1. Introduction
The need for lightweight, recyclable, malleable and strong materials has led to the use of aluminum alloys for a constantly increasing spectrum of industries with emphasis on the transportation sector both on land and sea serving automotive and marine applications, but also the food industry [
1,
2]. To gain tailored properties to match the needs of these industries various rolling and heat treatment processes must be fully controlled in order to tailor the microstructure, to enable an enhanced forming ability, and to gain expected final mechanical properties. In particular, the evolution of the crystallographic texture throughout forming and heat-treating stages, with regard to the final mechanical properties, is of great importance [
3]. Liu et al. have examined the effect of direct casting (DC) versus continuous (CC) casting of Al 5052 exhibiting the effect of the casting process on the texture [
4], while Yu et al. studied similar phenomena on Al 5182 [
5]. Crystallographic texture is affected at every step of the thermomechanical procedure [
6,
7]. Therefore, the correlation between crucial process parameters (e.g., temperature, alloy composition, casting procedure, number of reduction steps etc.) and their influence to texture evolution are paramount for the optimization of the desired properties through the relevant steps.
The 5182 Al alloy (see
Table 1) suits applications such as the beverage can lid as well as automotive structural parts and inner body parts [
8,
9,
10,
11]. Hot and cold rolling are used to match the final gauge. The more intense plastic deformation is applied to the alloy, the more the microstructure is affected. In the conventional rolling process, on the surface of the Al sheet that is produced, the shear stresses that are present lead to higher local strain. This results in more fine grains on the surface than in the middle of the produced sheet [
12]. Concerning the effect of cold rolling on Al alloys, crystallographic components that consist the β fiber (brass, copper and S) are expected. Cold rolling is characterized by the activation of octahedral slip systems while hot rolling has the tendency to provoke the slip of non-octahedral systems. At the stacking fault energy is attributed the way that the plastic deformation will occur (slip and/or twinning). The Al alloys are plastically deformed through slip on the systems {111} <110> [
13]. The texture components could be categorized in (i) rolling texture components (Copper, Dillamore or Taylor, S, Brass), (ii) shear texture components (rot-Cube
ND, γ fiber, α fiber Inverse brass, E, F,) and (iii) recrystallization texture components (Cube, P, R and Goss) [
14,
15,
16,
17,
18,
19].
The amount of recrystallization components that will be formed during the production process depends on the prior deformed state. The aim is to obtain the desired equally balanced amount of texture components in order to achieve the best formability through the control of the earing behavior [
17,
18,
19].
Two main theories had been widely discussed in the scientific community regarding texture evolution, the orientation of (i) the nucleation and (ii) the growth. Cube oriented grains are those that combine characteristics from the two theories altogether; they tend to grow from remained Cube bands and they tend to be favorable points for the growth of deformation crystallographic components [
20]. The more intense effect on cube oriented grains is given by the rolling reduction percentage, the annealing conditions and the chemistry of the alloy [
21]. It is crucial to decrease the presence of Cube component by controlling the hot rolling process, since a high amount of cube-oriented grains could lead to reduced drawability [
16].
In general, cold rolling induces work hardening resulting in an increase of both yield strength and hardness. The application of heat-treatment (annealing), however, can reduce the extent of these effects, [
14,
15] and, in addition, it may reduce anisotropy. K. J. Kim et al. [
16] studied the feasibility of deep drawing for aluminum alloys 5182 after annealing at 350 °C for different durations and concluded that the sheet, which had been annealed for 20 min exhibited the best drawability. The best combination of crystallographic components, according to the authors, to obtain the optimal drawability is γ fiber ND//<111> and rot-Cube
ND {001}<110>. Due to the thermal loses during the insertion of the samples, however, other researchers considered a treatment time of one hour [
22,
23,
24,
25,
26]. It has been documented that the rolling process results in the formation of a β fiber texture [
27], consisting of the Cu{112}<111>, S{123}<634> and brass{110}<112> components. In addition, the application of heat treatment results in a further transformation of the grains into cube {001}<100>, P {011}<1-11>, Q {013}<3-31>, R {132}<4-21> and Goss {011}<100> components [
14]. The crystallographic component R {124}<211> is similar to the crystallographic component S {123}<634>. Beck and Hu [
28] pointed out that the R orientation can originate from the deformation texture by two different mechanisms. The first mechanism is the retained R from the rolling texture, where the stored dislocation energy is being reduced partially through extended recovery reactions, named as continuous recrystallization in the relevant literature. The second mechanism is about the forming of grains exhibiting R orientation genuinely via discontinuous recrystallization by the growth of nuclei into S oriented grains at the grain boundaries of the deformed bands and subsequent growth under the depletion of the rolling components, B, C and S. An R orientation is created through discontinuous recrystallization by the procedures of nucleation and growth, contrary to the display of a notable swiftness regarding the corresponding rolling texture, which is apparent to the ODFs with large scattering close to the R component. During discontinuous recrystallization the R component competes with the cube orientation with regard to nucleation. Since the R grains can grow up to substantial volume fractions due to the high amount of potential nucleation sites, they can outweigh the cube orientation [
29].
Each texture component causes the material to form “ears” at different directions from RD (Cu, S and brass components results into the formation of 45°“ears” in deep drawn cups while the cube component strengthens the presence of 90°“ears”); hence to minimize earing, a proper combination of texture components should be obtained [
17,
29]. It is reported by O. Engler et al. [
13] that transient orientations along the deformation process from the recrystallization towards the rolling texture—including the α-fiber orientations between Goss and Bs—provoke an asymmetry of the ears of the cups, where the 0° cited “ears” are of greater height than the 90°“ears”. This asymmetry results in the formation of six ears, whereas in rare cases, two ears may appear. Hence, in order to achieve optimum properties for subsequent sheet-forming operations, a deep understanding of the evolution of texture during the production of the sheet is necessary [
30]. In addition, the tensile properties of Al alloys are heavily influenced by the anisotropy, a parameter that is quantified through the r value [
31]. Al alloys produced by means of cold rolling and annealing processes exhibit r values of the order of 0.55 to 0.85 [
2]. The typical influences of rolling and recrystallization texture components on r values, as well as the {111}//ND components mentioned, are identified as relevant for increasing r values [
26].
A number of models such as the Taylor/Bishop-Hill and Sachs are effectively utilized for the prediction of r values as well as earing behavior by taking into account texture data [
32].
Nevertheless, the effect of the process stage that is examined in the present study on the texture versus mechanical properties (yield strength, tensile strength, elongation at fracture and R-values) has not been properly quantified yet for the examined rolling reduction percentages. Thus, the formation of well-balanced crystallographic texture leading to the desired properties is still a challenge for researchers [
33].
The present study focuses on the effects of reduction (rolling) and heat treatment on the resulting crystallographic texture. Electron back-scatter diffraction (EBSD) and tensile tests are used to correlate microstructure and properties with the forming sequence and the thermal treatment background.
3. Results
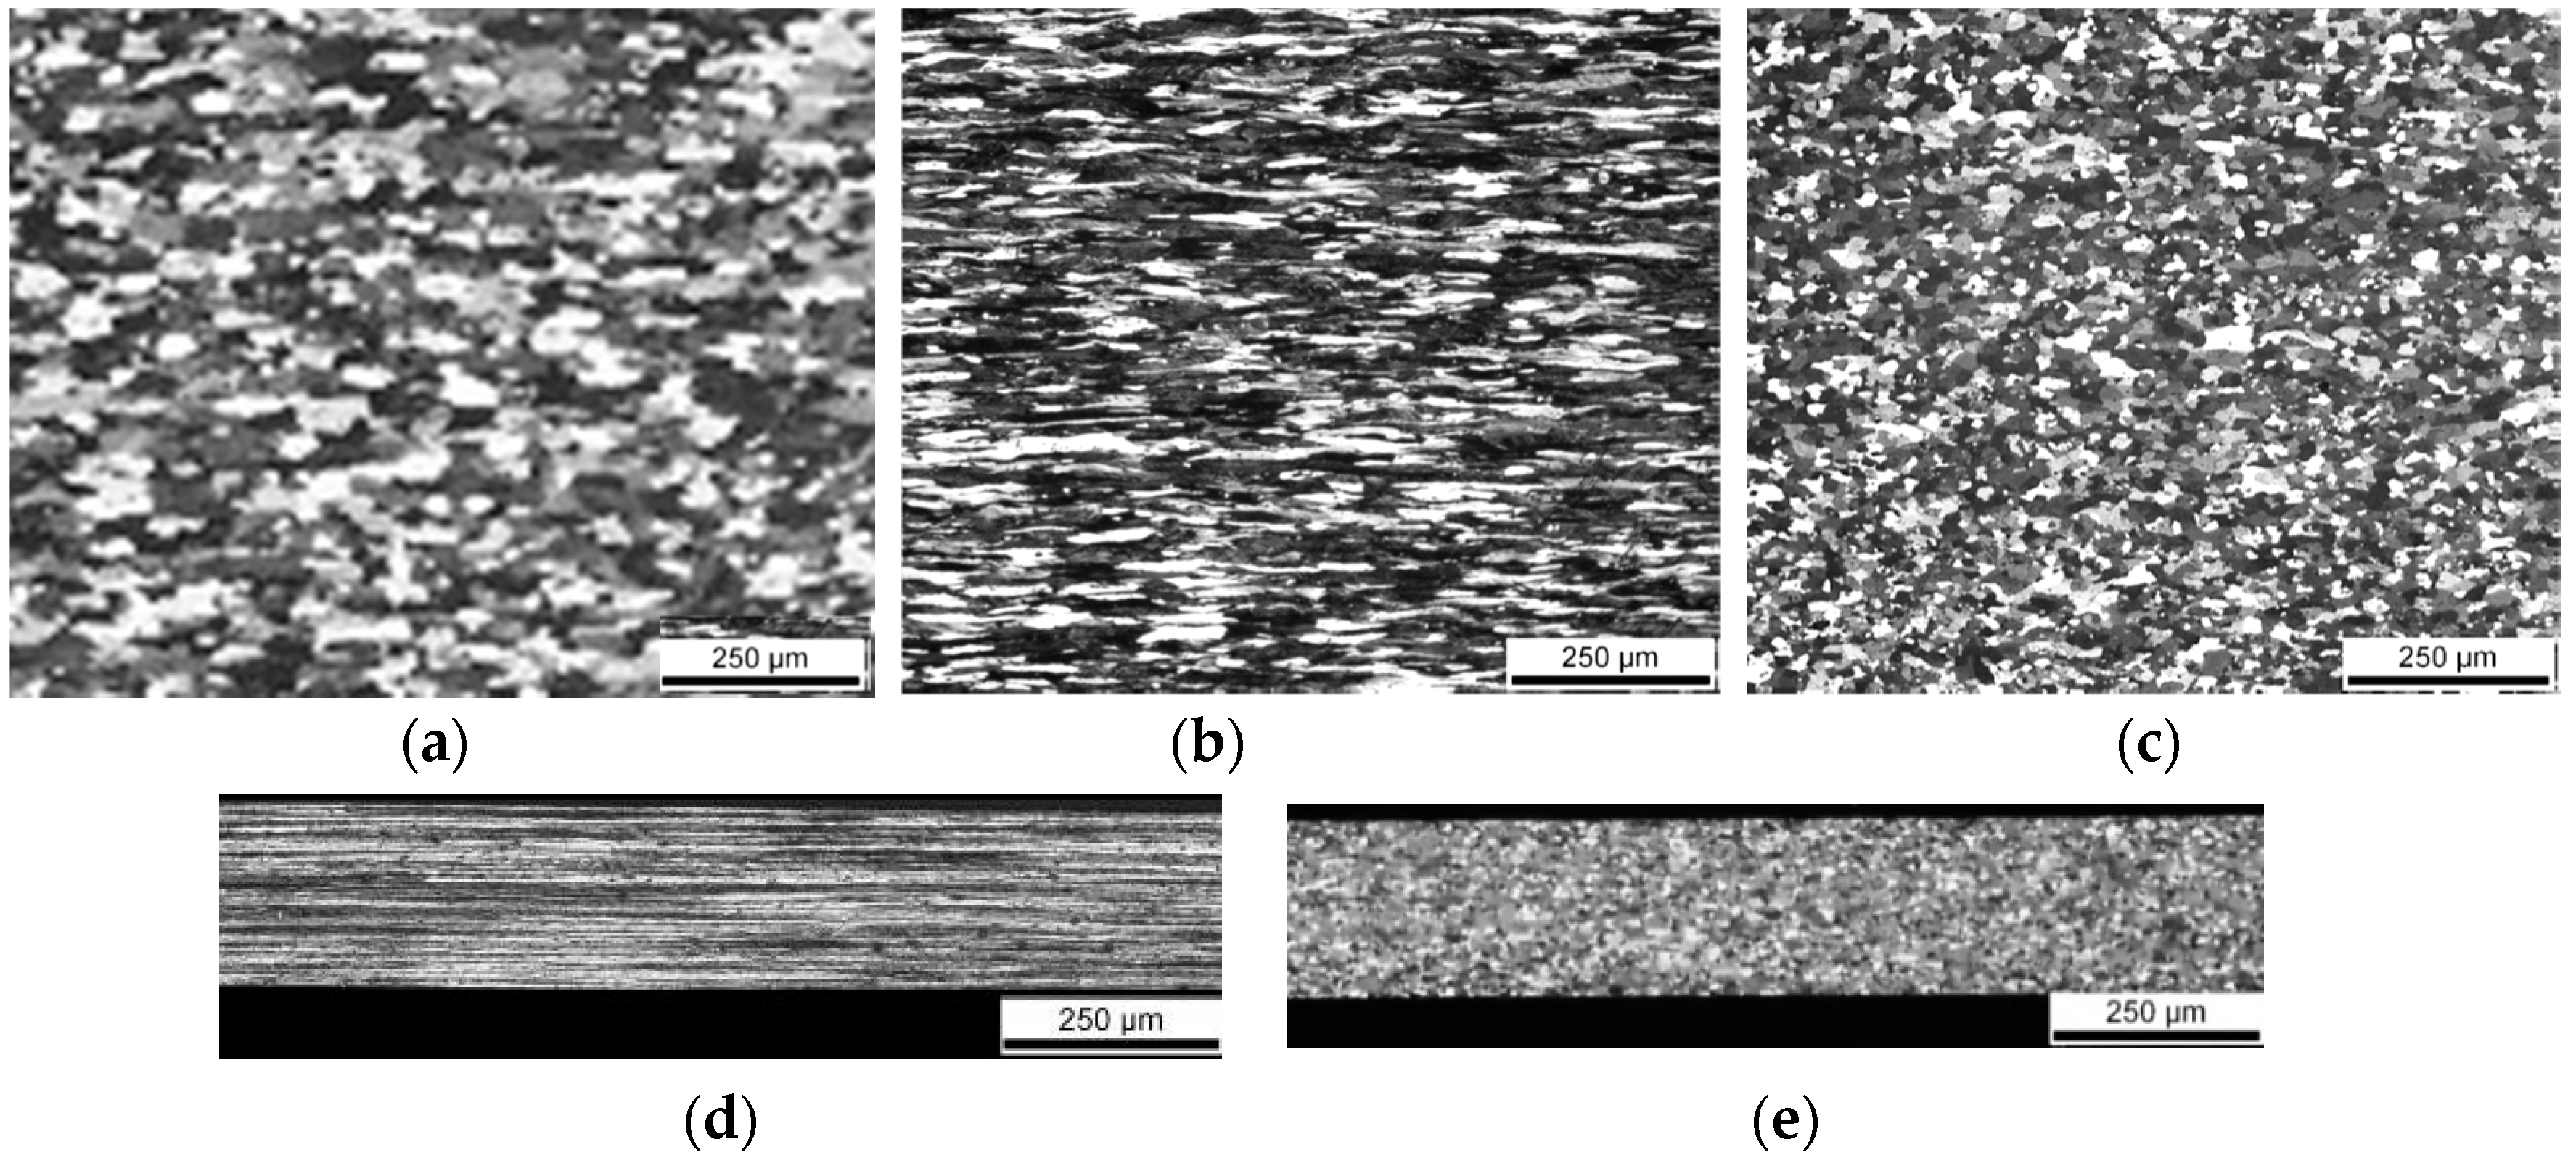
The grain structure was revealed after Barker’s etching. The hot rolled sample exhibited equiaxed grain structure. After the first cold roll pass, grains became elongated. After annealing, the grains retrieved their equiaxed morphology, which was retained even after the final cold roll pass. The final product showed a fully recrystallized microstructure (
Figure 1).
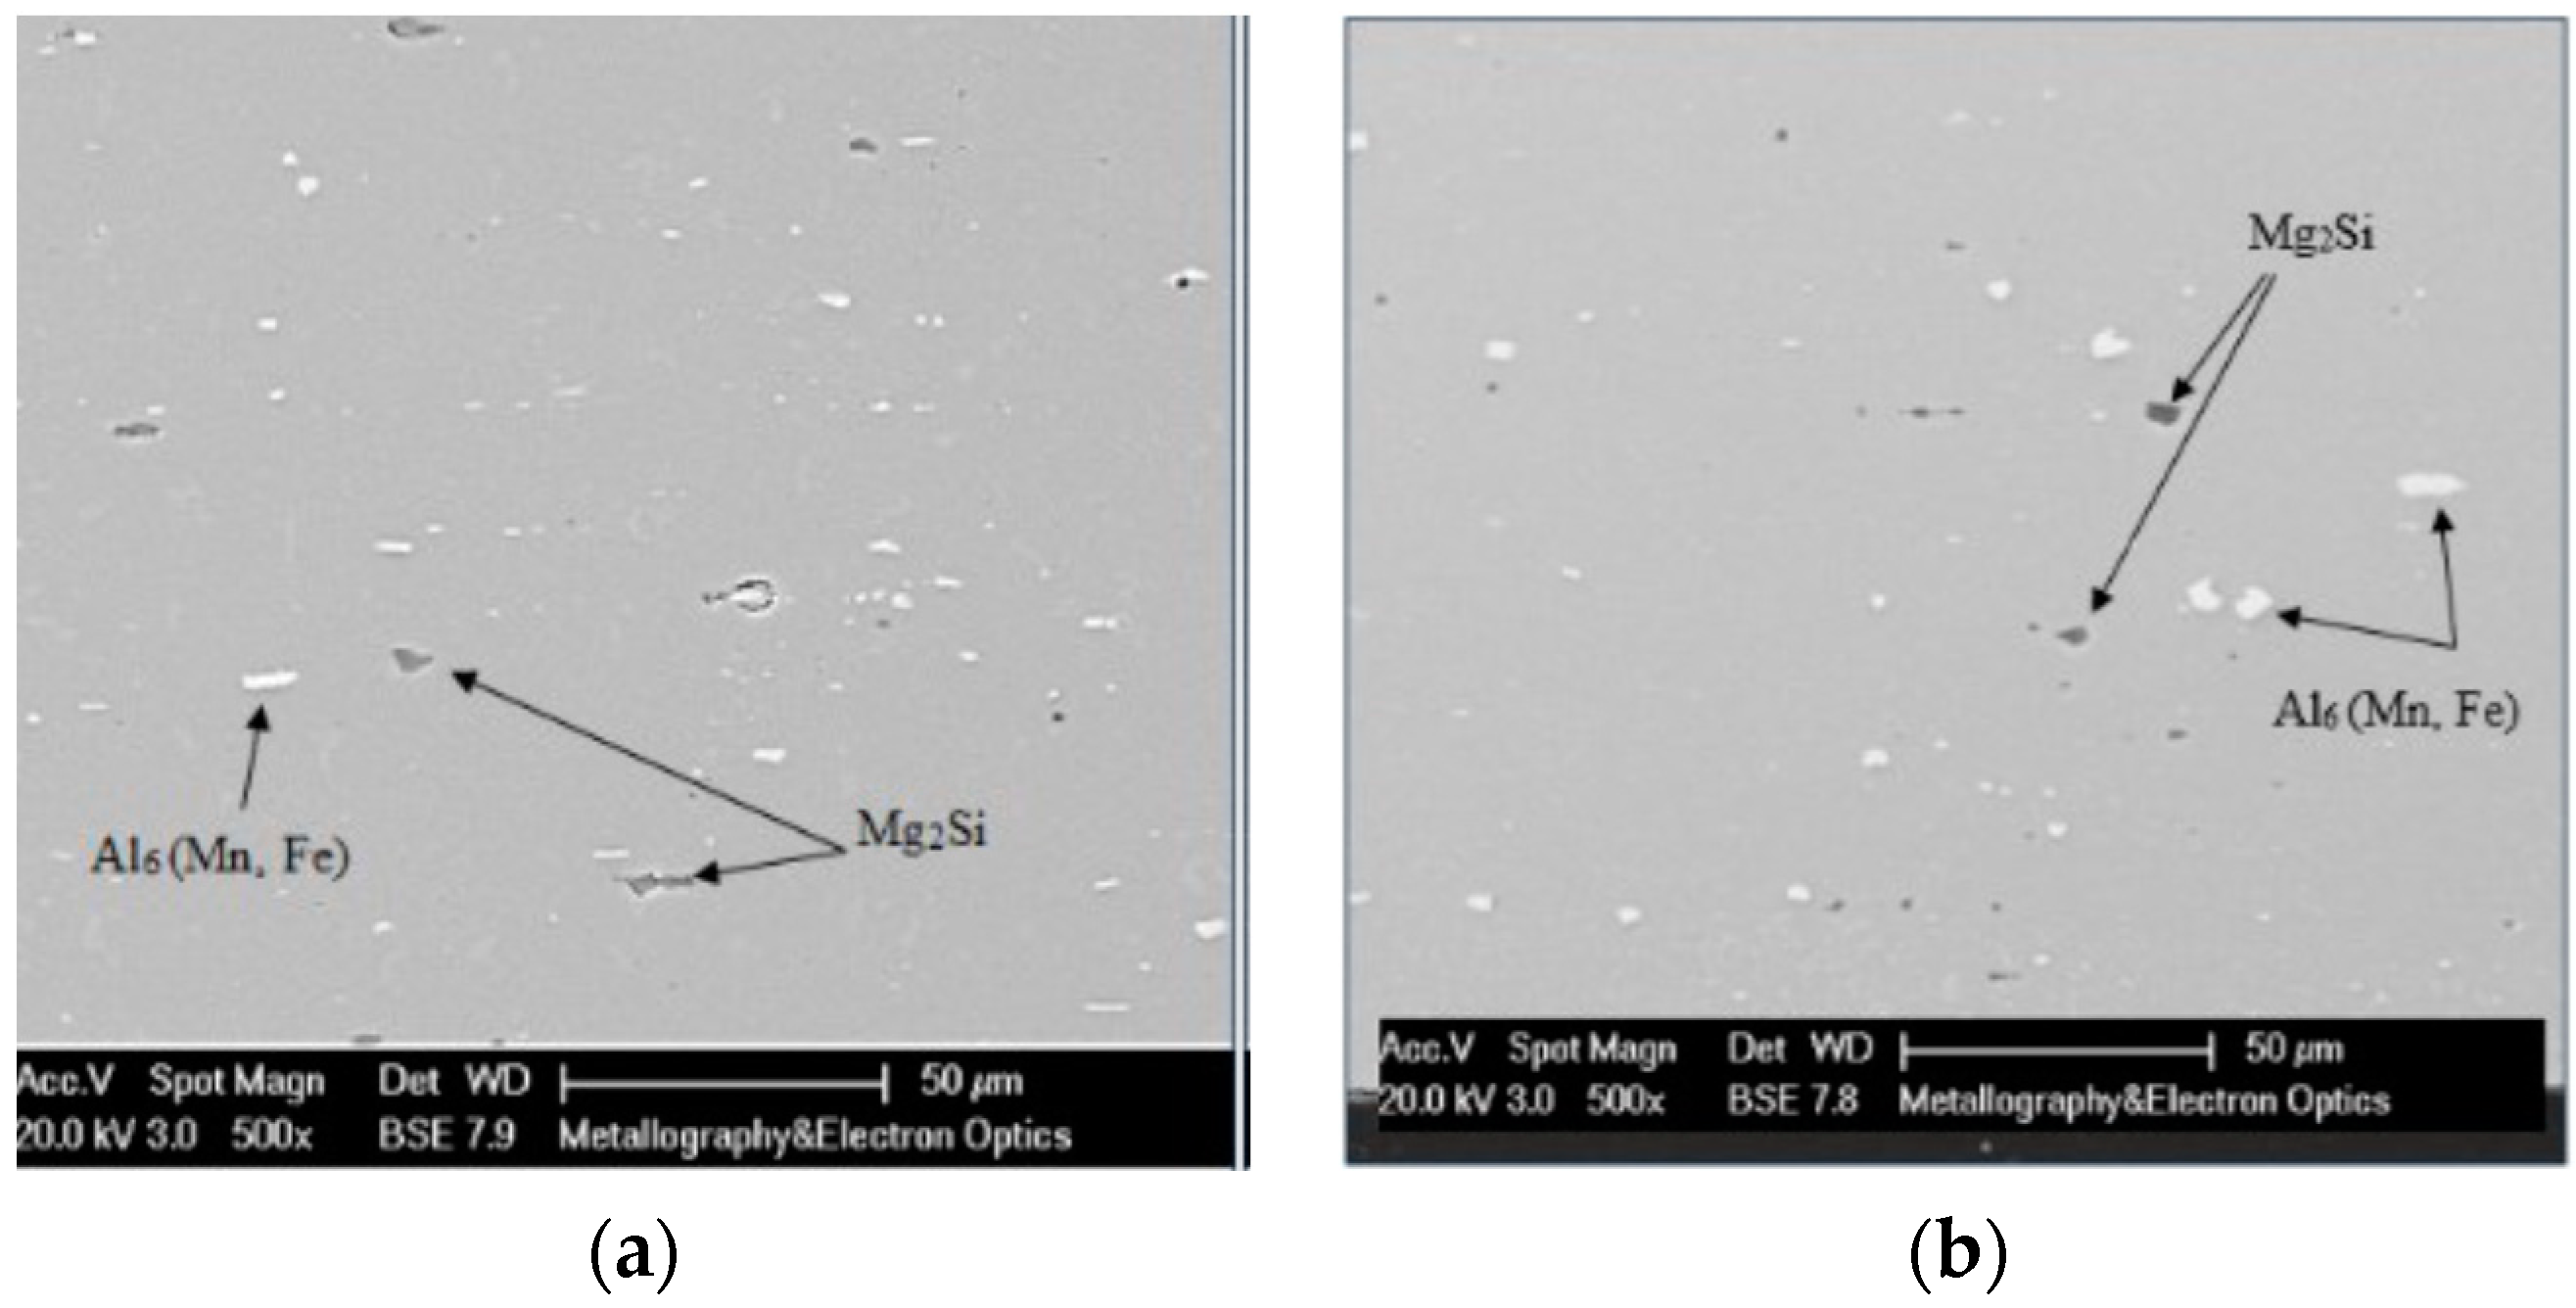
Second phase particles of Al
6(Mn, Fe) and Mg
2Si are dispersed all over the matrix of the examined samples. Indicative SEM micrographs of the particle dispersion in the matrix of h.r. and c.r.2 samples are shown in
Figure 2.
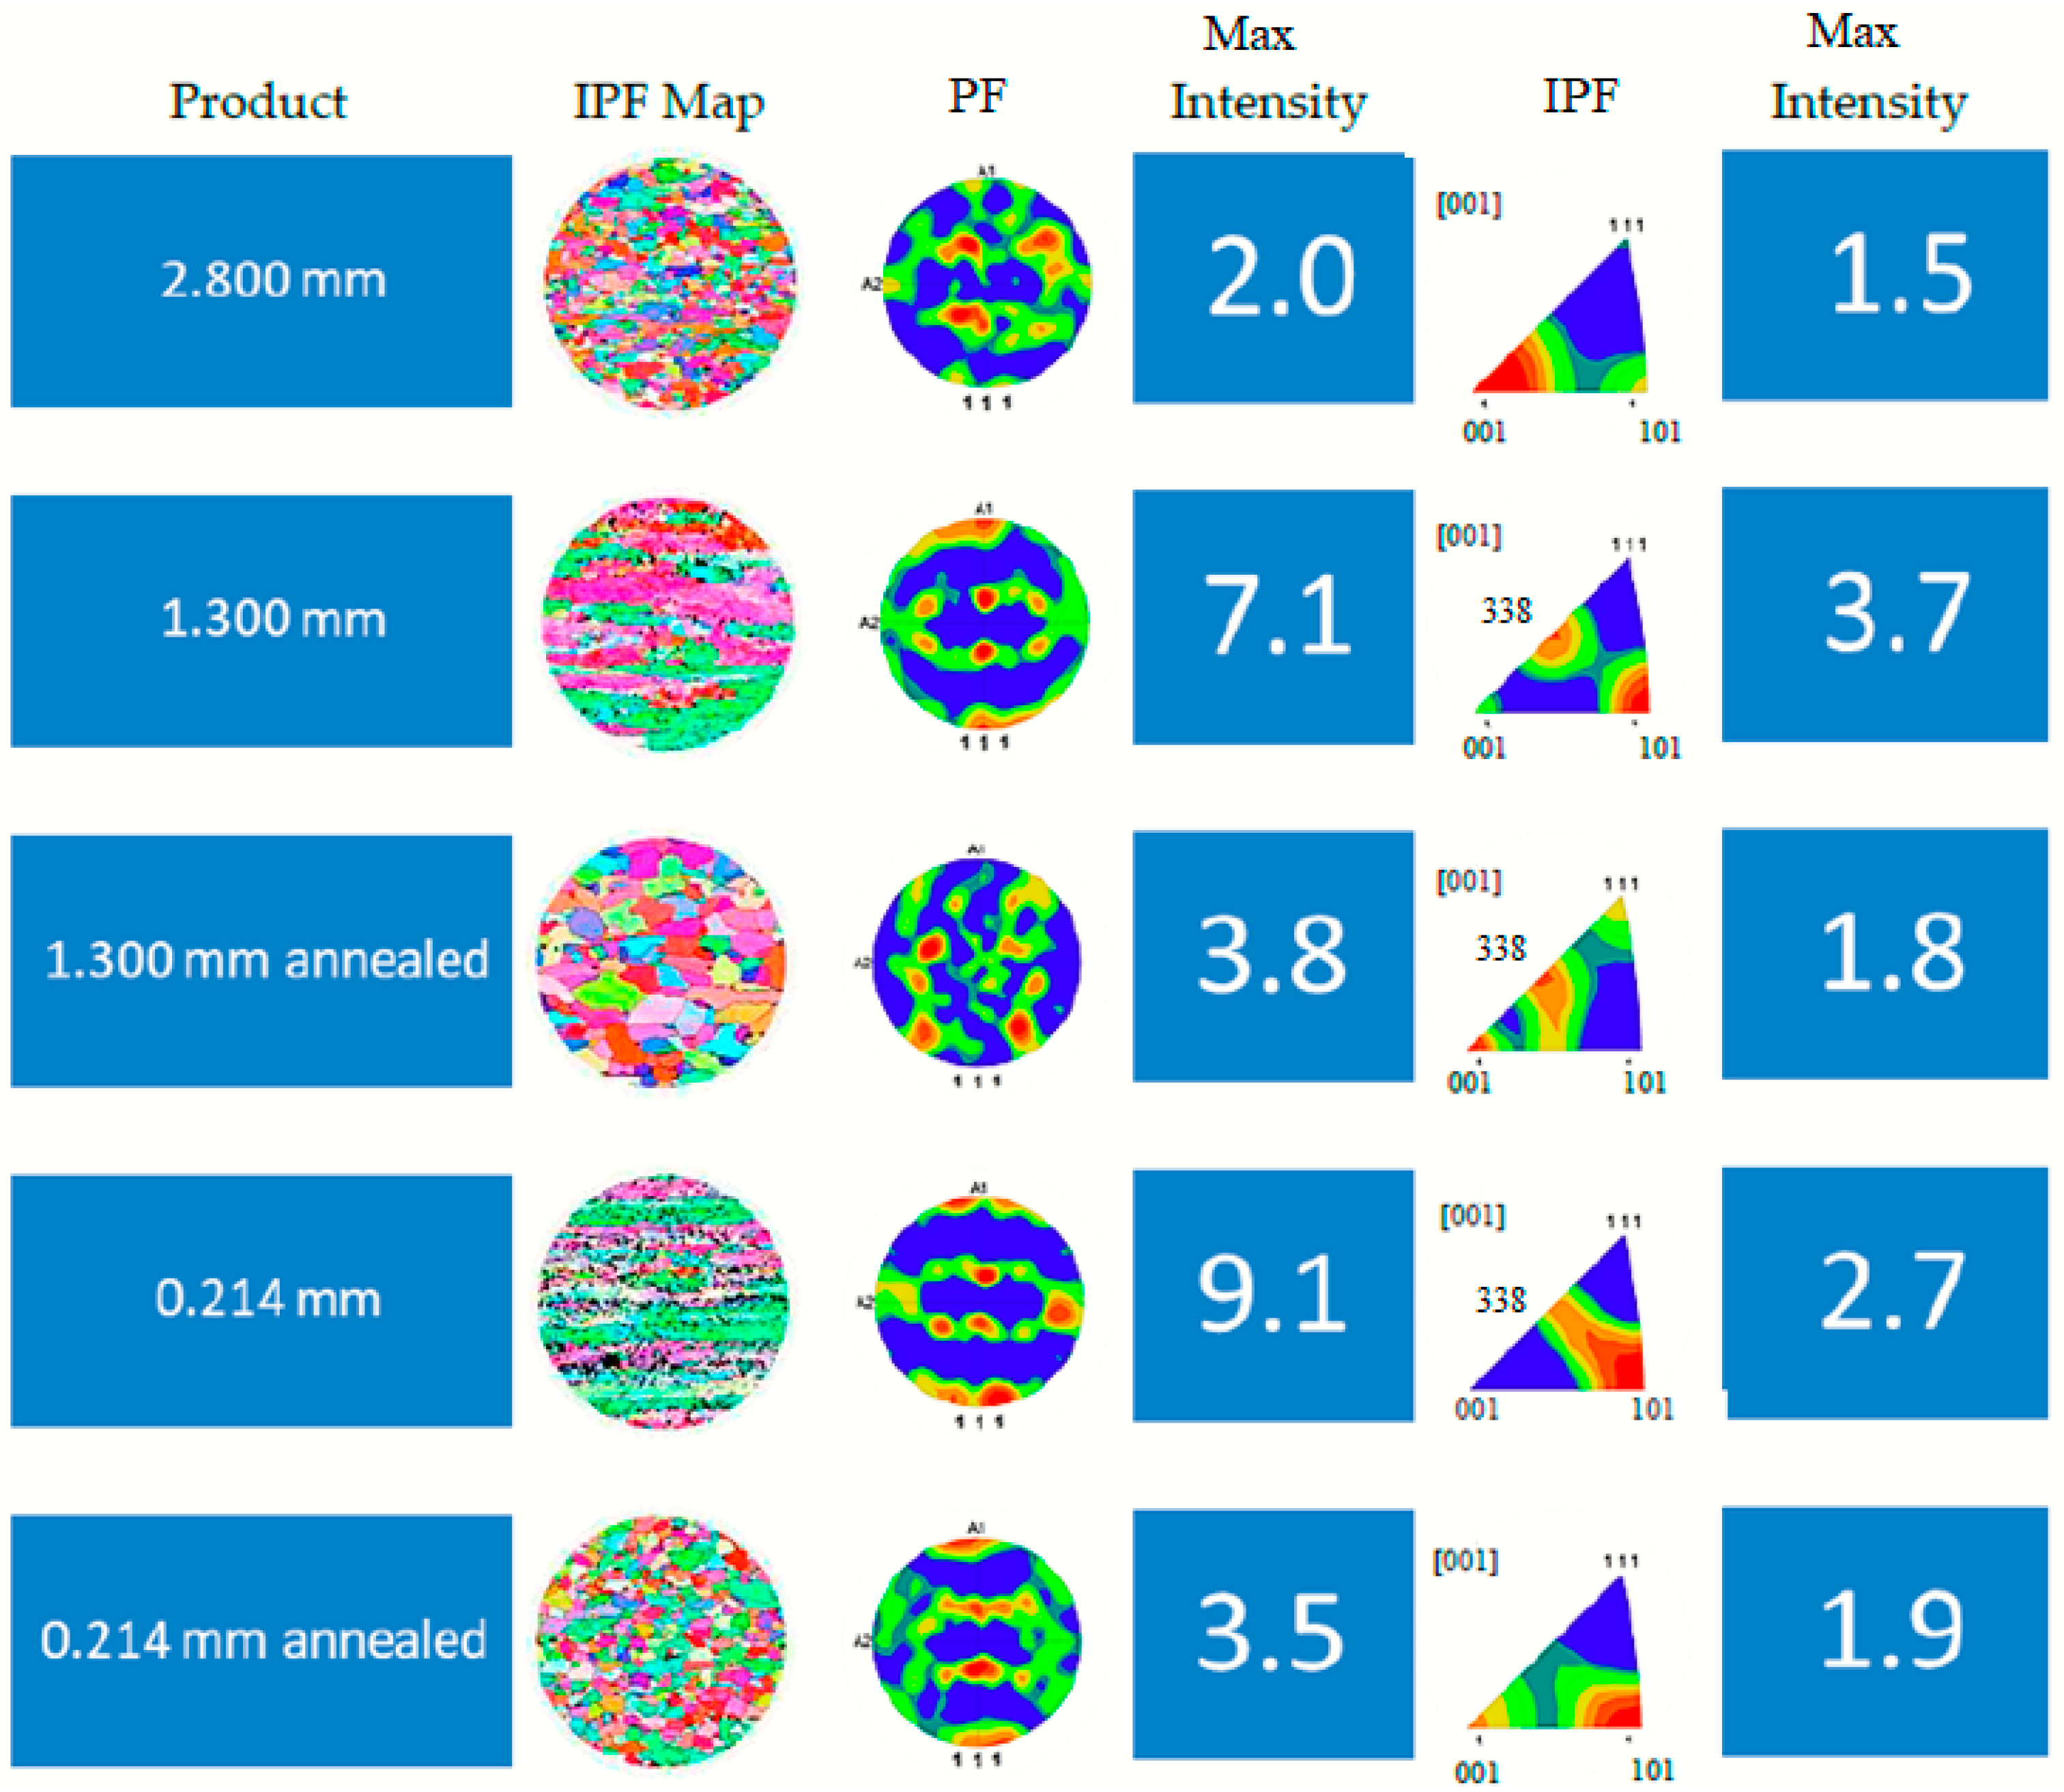
Intensities from inverse pole figure (IPF) and pole figure (PF) diagrams are related with the texture intensity of the examined sample. Red color indicates the points, where the highest texture intensity is observed. The lower intensity indicates higher isotropy of the texture and, consequently, the higher isotropy of mechanical properties as well. PF and IPF diagrams exhibit the same information from a different aspect. The findings originating from EBSD data are graphically illustrated in
Figure 3:
Figure 3 presents the IPF maps and microstructures as well as the PF for each product examined. The relevant intensities are also presented on the right side of
Figure 3. The h.r. sample is partially recrystallized showing a typical hot-rolled PF exhibiting relatively low texture intensity (2.0 in the PF diagram and 1.5 in the IPF diagram). After 53% thickness reduction, sample c.r.1 grains tend to be more elongated, while the IPF diagram indicates a shift towards {111} orientation with measured intensity 7.1 and 3.7 for PF and IPF diagrams respectively. The annealing creates a fully recrystallized and equiaxed grain structure, while the intensity is low (3.8 and 1.8 in the PF and the IPF diagram respectively). At the same time, a crucial difference is observed from the h.r. to the c.r.a.1 sample: a weak {111} and a strong {338} component is formed. After the final cold pass, the higher amount of texture intensity has been measured (9.1 in the PF and 2.7 in the IPF diagram respectively) (
Figure 3 and
Figure 4). After the final annealing, the texture intensity reaches similar values with the ones measured on the c.r.a.1 sample (3.5 and 1.9 in the PF and in the IPF diagram respectively) (see
Figure 3). At c.r.a.2 the {001} had be reformed after been seen in h.r. and in c.r.a.1.
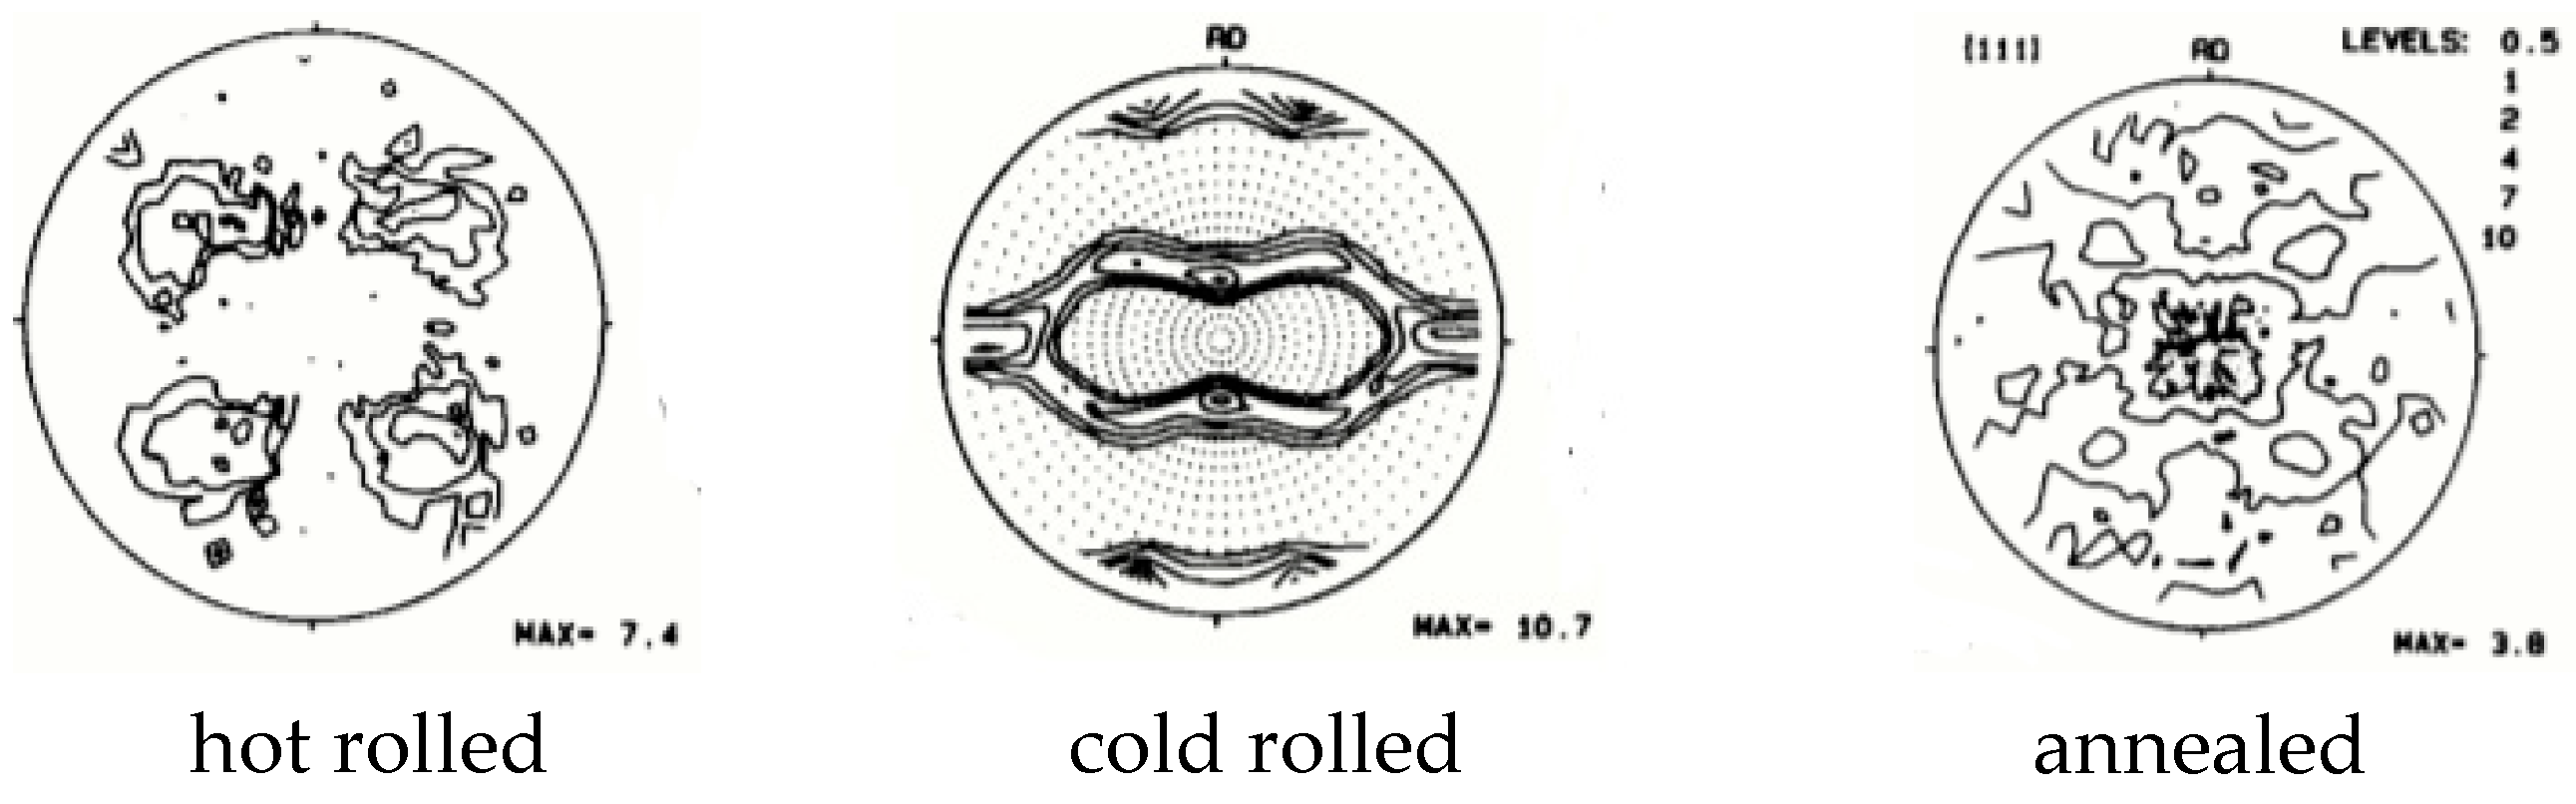
For reference, the typical appearance of PF in relation to the rolling process and heat treatment applied are given in
Figure 4 [
37].
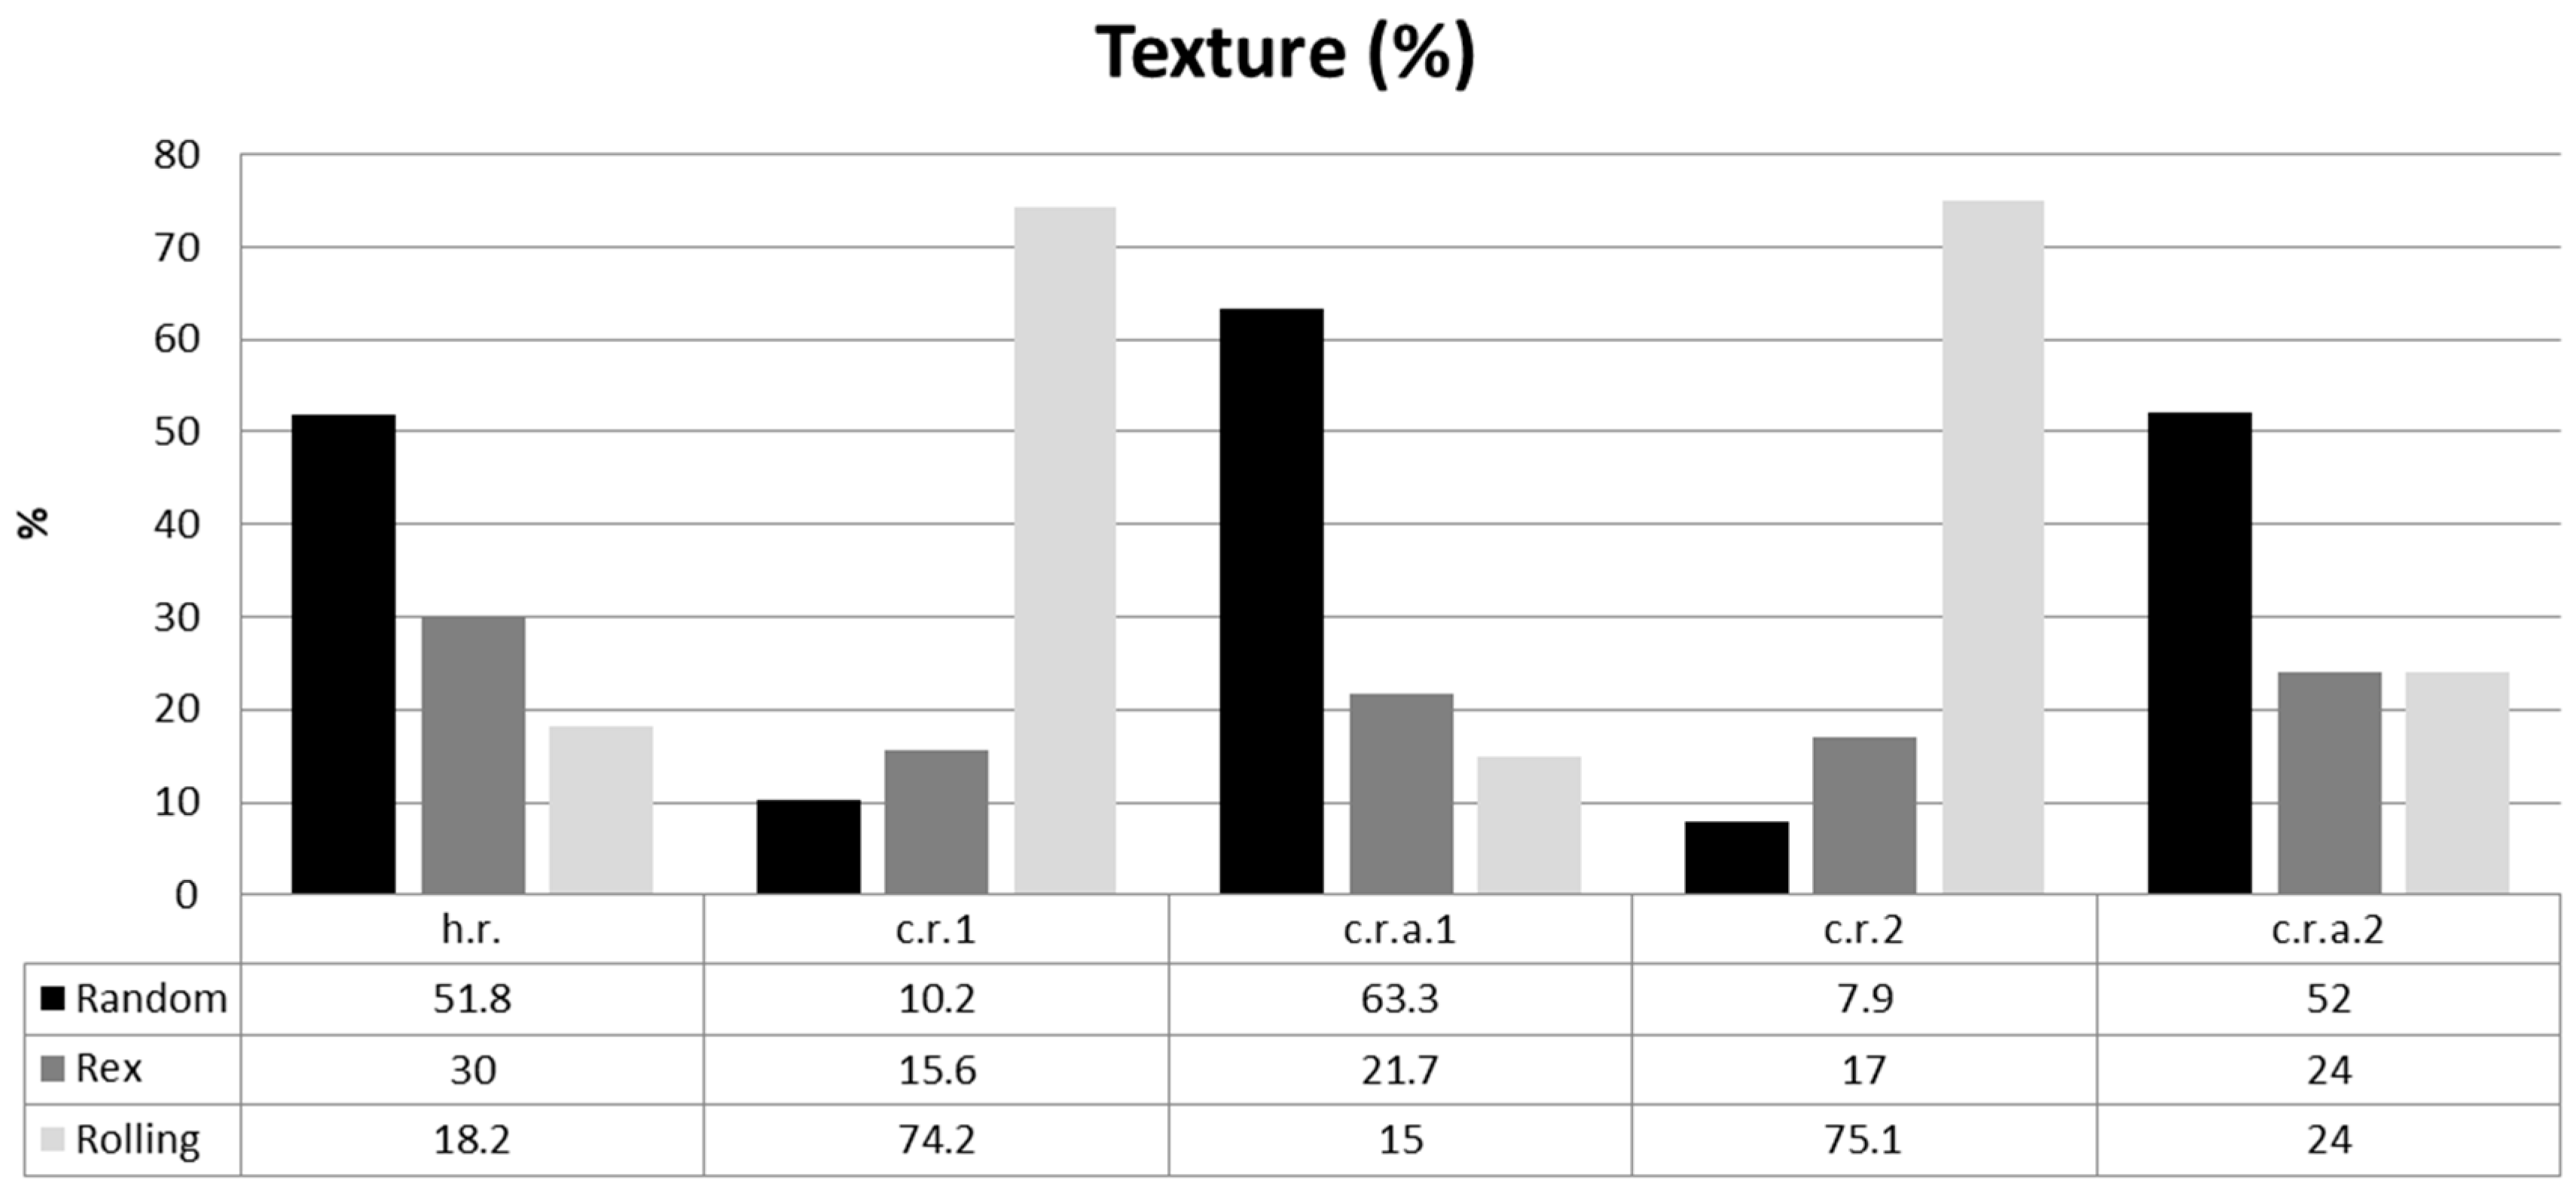
The Al sheet texture exhibits three main categories of component, recrystallization (cube, P, R), rolling (brass, copper, Goss, S, Dilamore or Taylor) and shear (rotated cube, inverse brass, E, F) texture components. The h.r. sample, mostly exhibited recrystallization texture accompanied by a significant amount of rolling texture (
Figure 5). The main components detected in this state are Q, R and brass. After 52.5% thickness reduction, the rolling texture increased and the main components detected are R and Goss from the remained texture recrystallization and intense S, brass, copper and Taylor.
The effect of annealing changed the components analogies increasing the random texture. Q, R and Goss increased leaving just a small amount of S and Taylor from the previous deformation. The final pass of 92% thickness reduction led to the formation of high amounts of S and brass, followed by Taylor and Copper. The representative recrystallization component is R. The ultimate annealing process provoked the formation of a high amount of R coexisting with brass and S (see
Figure 5). Cold rolling of the h.r. sample, led to an increased amount of both rolling and recrystallization texture percentage for the c.r.1 and c.r.2 samples. It also led to increased anisotropy (see the increased intensities PF and IPF diagrams). Annealing treatment formed low PF and IPF intensities, which resemble to the original h.r. sample observed intensities.
The random texture of both annealed sheet samples increased significantly reinforcing the isotropic behavior of these materials with approximately 1% normal anisotropy. This could be explained by the fact that in c.r.a.1 the nucleation of the cube component was inadequate (r-CubeRD) and the amount of recrystallization texture was higher than the remaining deformation texture. In contrast the c.r.a.2 exhibited greater volume fractions of the cube and R components, which favor the earing formation of 0/90° ears. In both cases the recrystallization texture in the annealed samples is higher than the cold-rolled samples before.
EBSD findings are analytically presented in the following chart, where the exact percentages of the random, recrystallization (Rex) and rolling texture are shown for each examined case (
Figure 5).
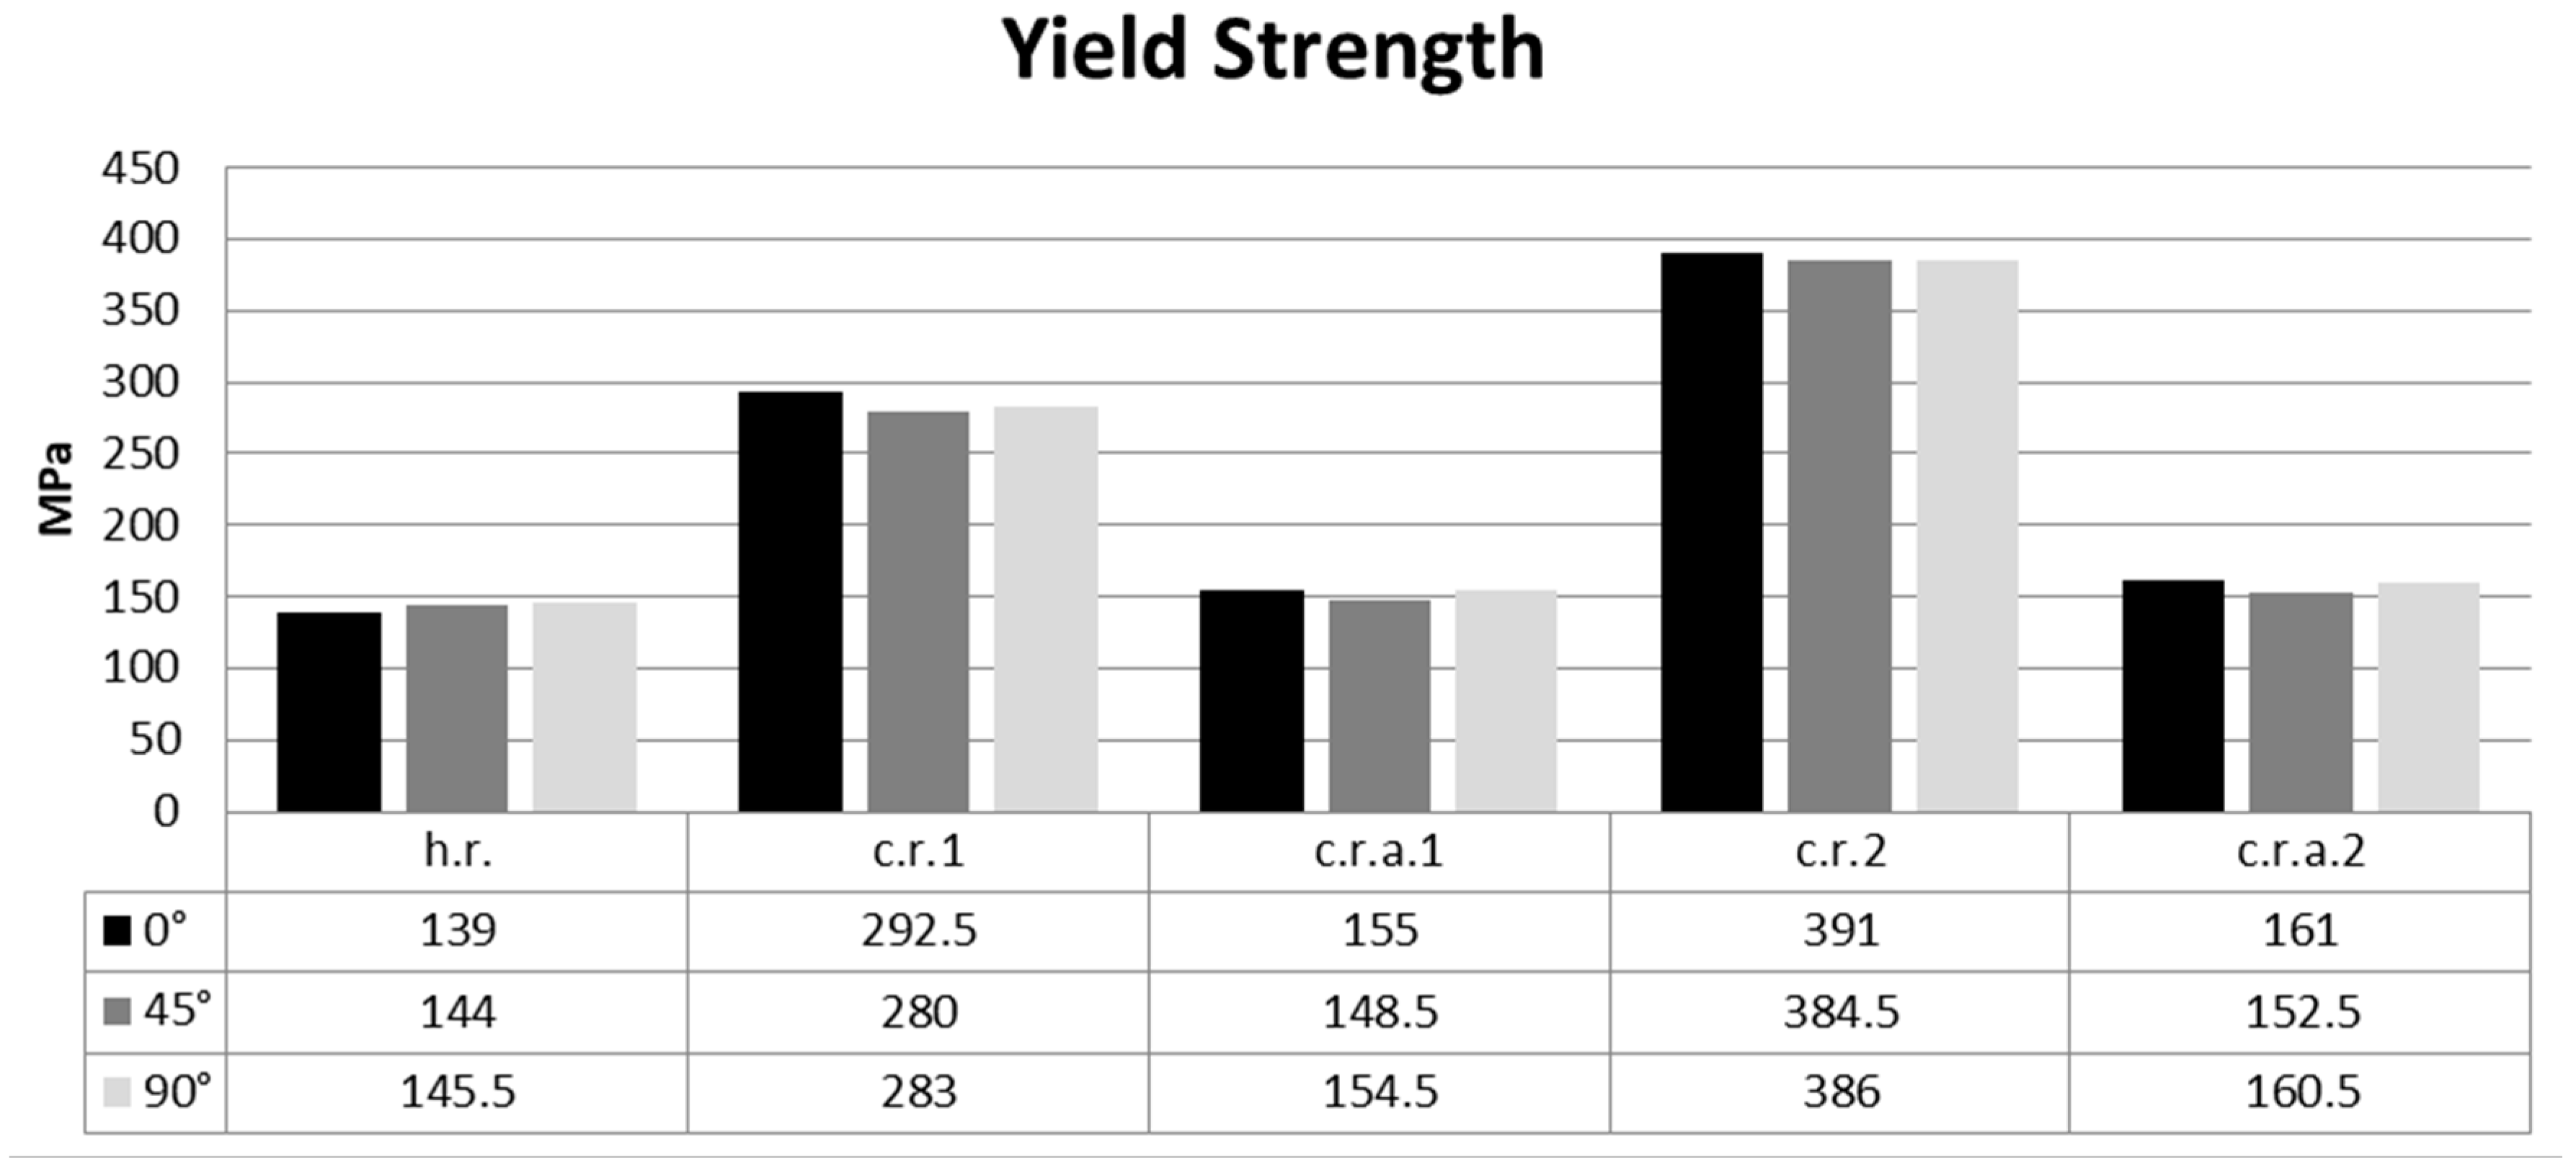
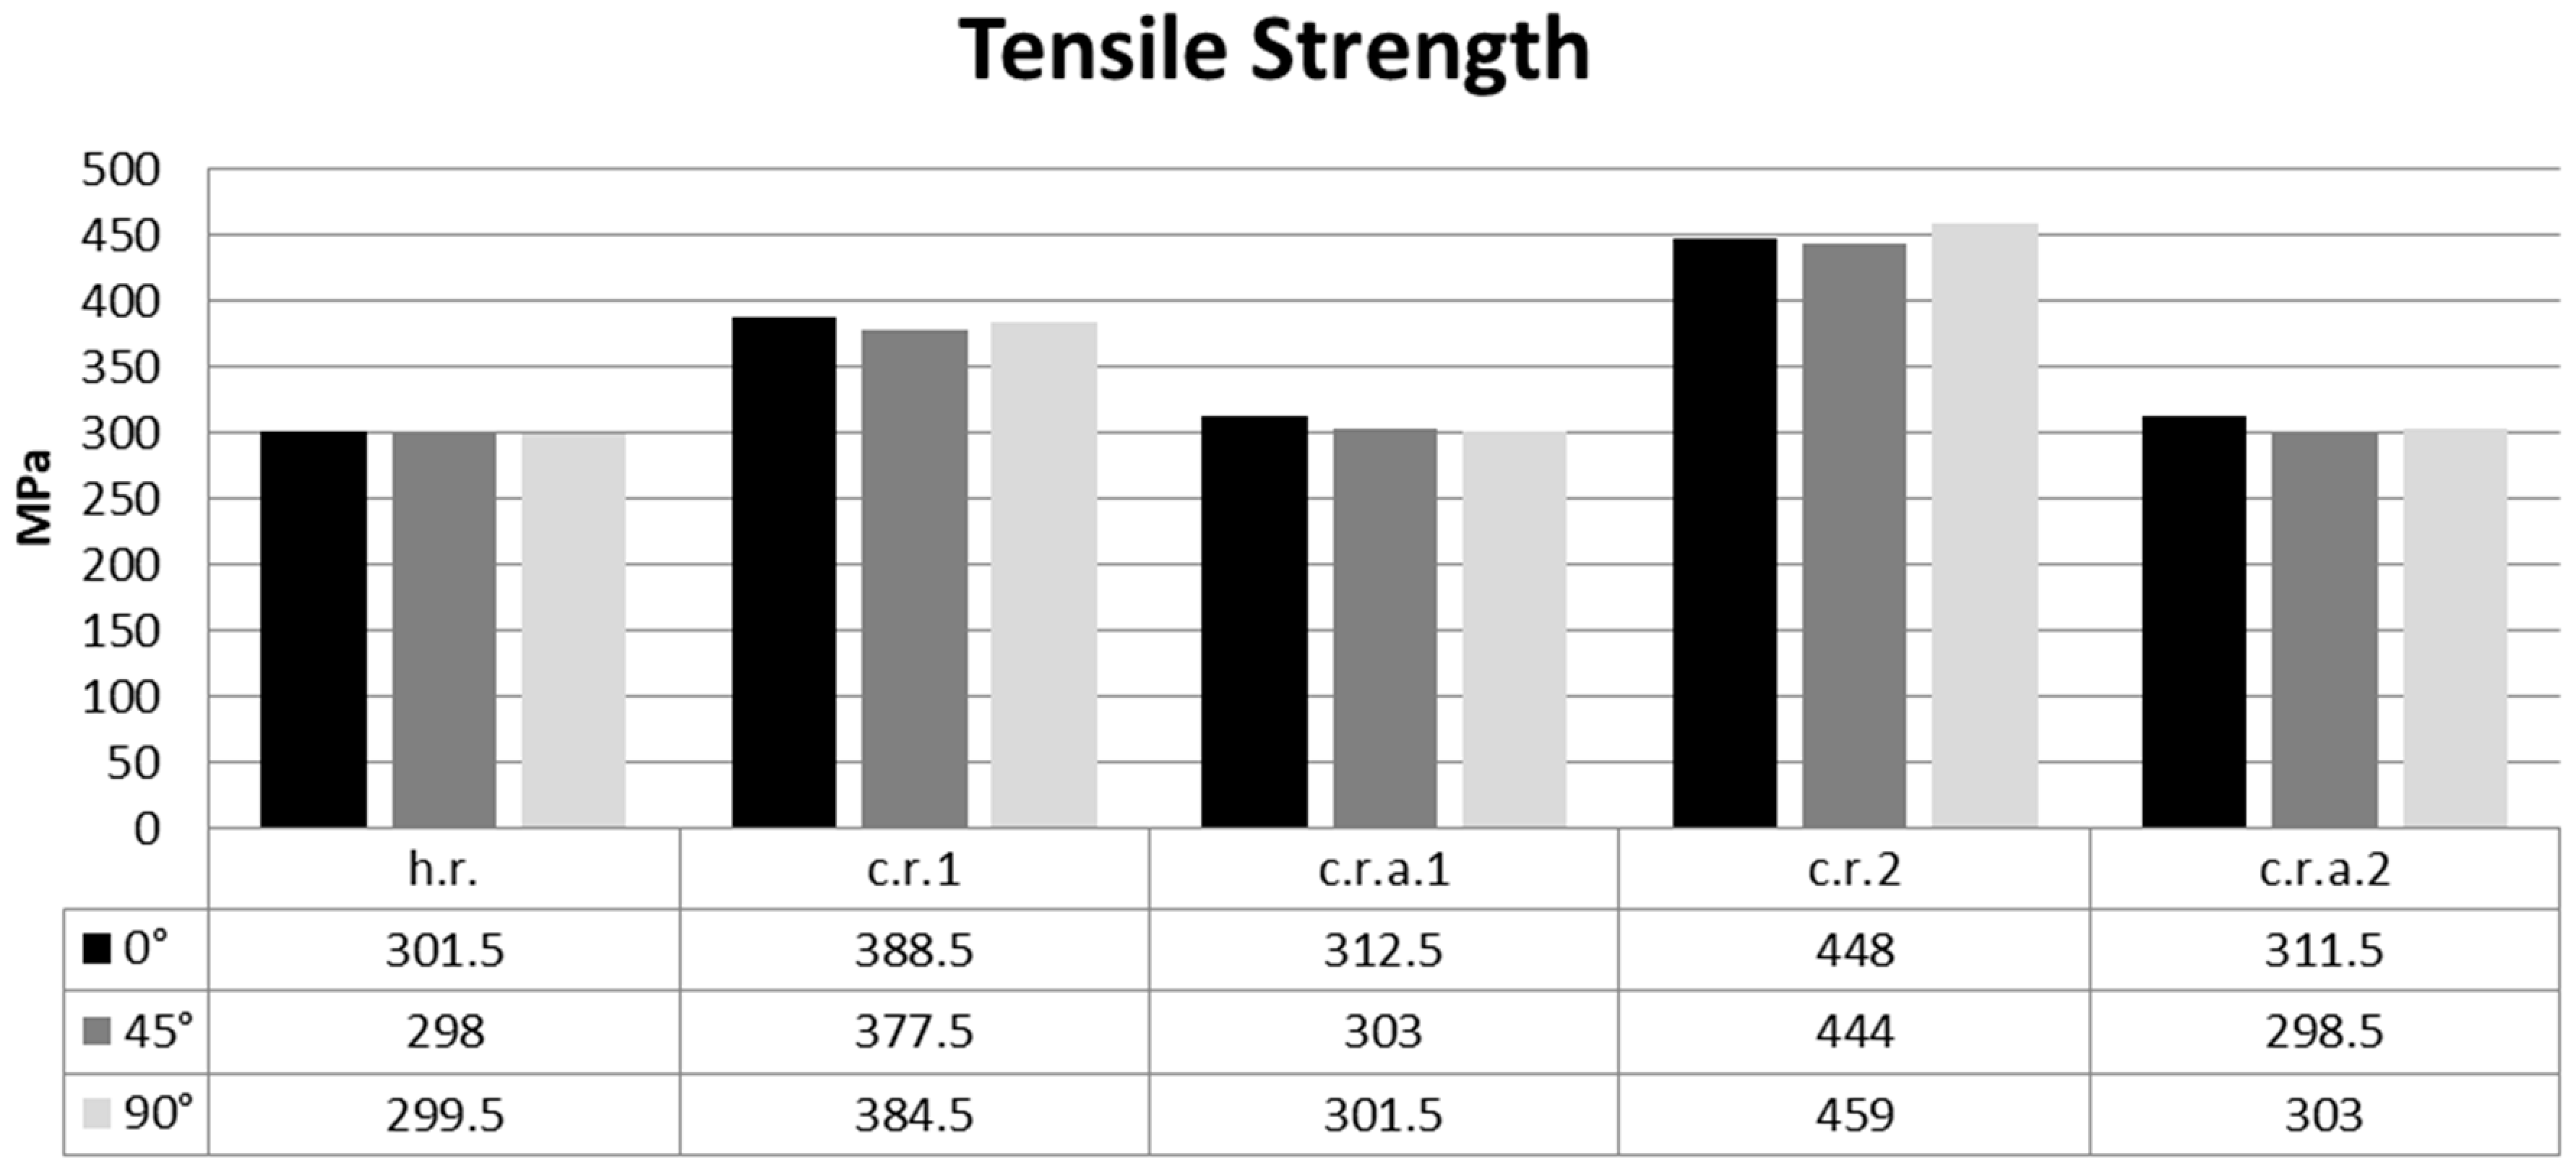
The mechanical properties after annealing for both cold-rolled products exhibited significant similarity with regard to the h.r. mechanical properties. Tensile testing results are given in
Figure 6,
Figure 7 and
Figure 8. In particular h.r. exhibited yield strength of 139 MPa at 0°, of 144 at 45° and of 145.5 at 90° whereas c.r.a.1 showed 155 MPa, 148.5 MPa and 154.5 MPa and c.r.a.2 161 MPa, 152.5 MPa and 160.5 MPa, respectively. Concerning the tensile strength, h.r. exhibited 301.5 MPa at 0°, 298 MPa at 45° and 299.5 MPa at 90° while c.r.a.1 showed 312.5 MPa, 303 MPa and 301.5 MPa and c.r.a.311.5 MPa, 298.5 MPa and 303 MPa, respectively. The measured values of the h.r, c.r.a.1 and c.r.a.2 confirmed that regarding the yield strength and the tensile strength, the annealing temperature restored the mechanical properties after the deformation, but did not have such an intense impact on crystallographic components (see
Figure 3).
The PF intensity was selected as an indicator of intense texture presence and, therefore, less isotropic behavior.
Yield strength and tensile strength increased to an analogous extent in all directions after cold rolling and decreases after annealing (
Figure 6 and
Figure 7). The 0° direction exhibited slightly higher strength values compared to the other directions for all but the 2.8 mm thick products.
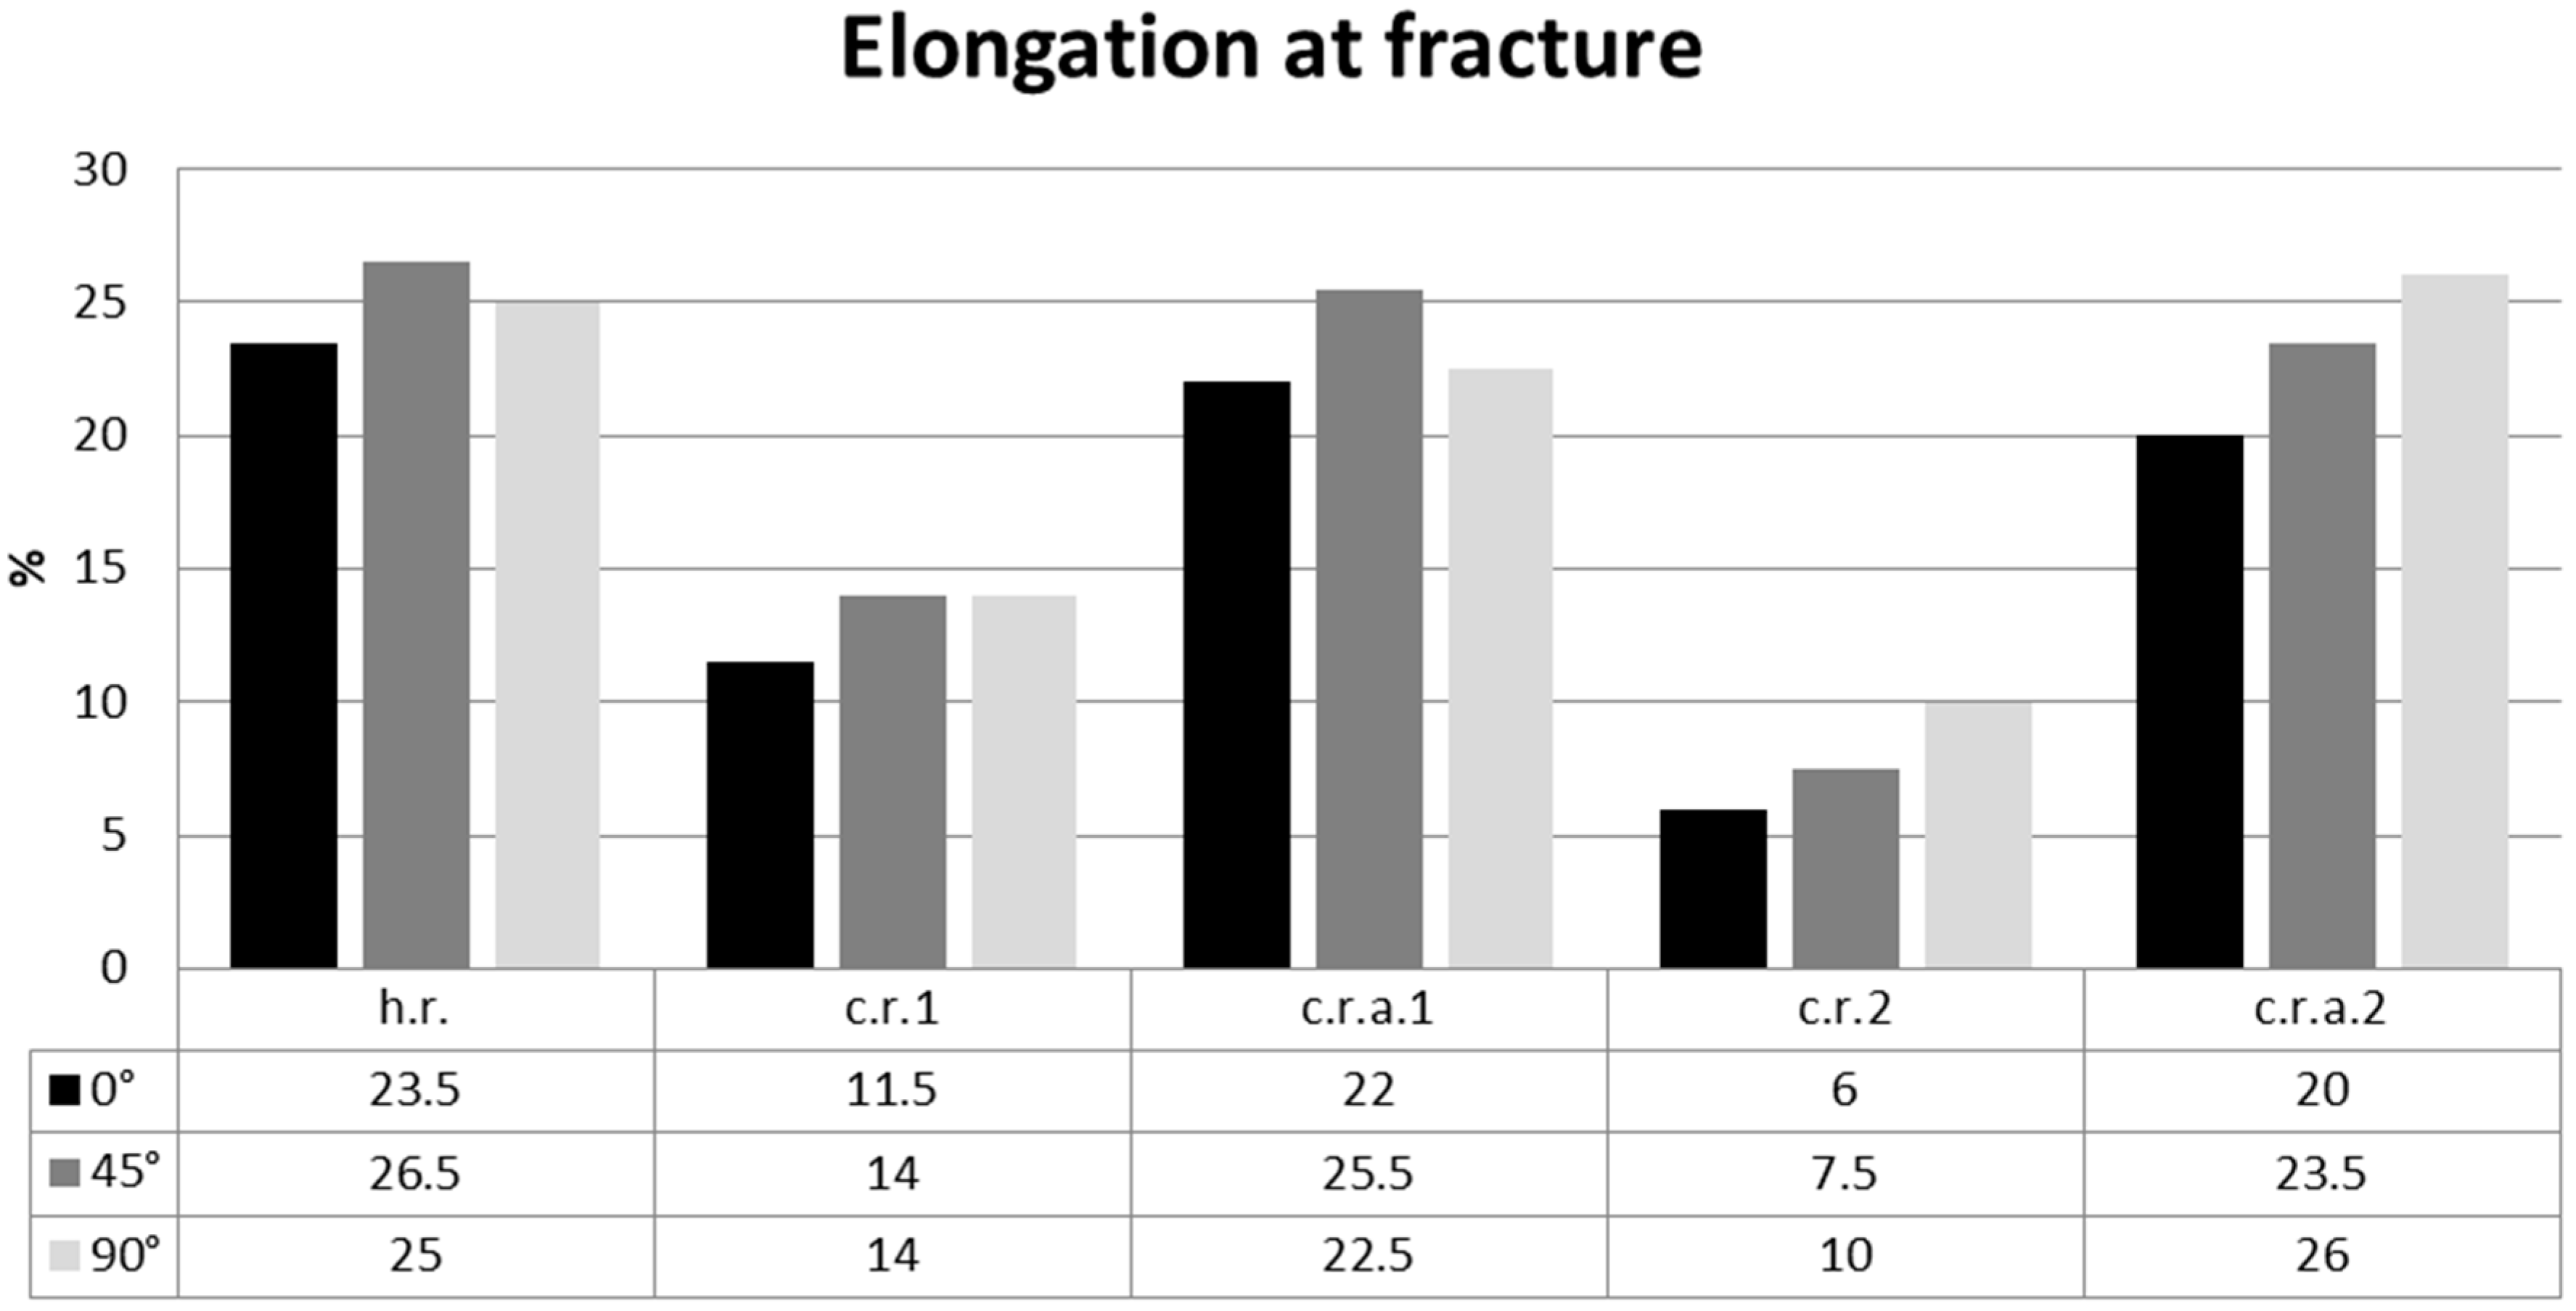
In both annealed cases (c.r.a.1 and c.r.a.2) the elongation at fracture was increased which can be related to the reduction of dislocation density and the new formed grain size and morphology (
Figure 8).
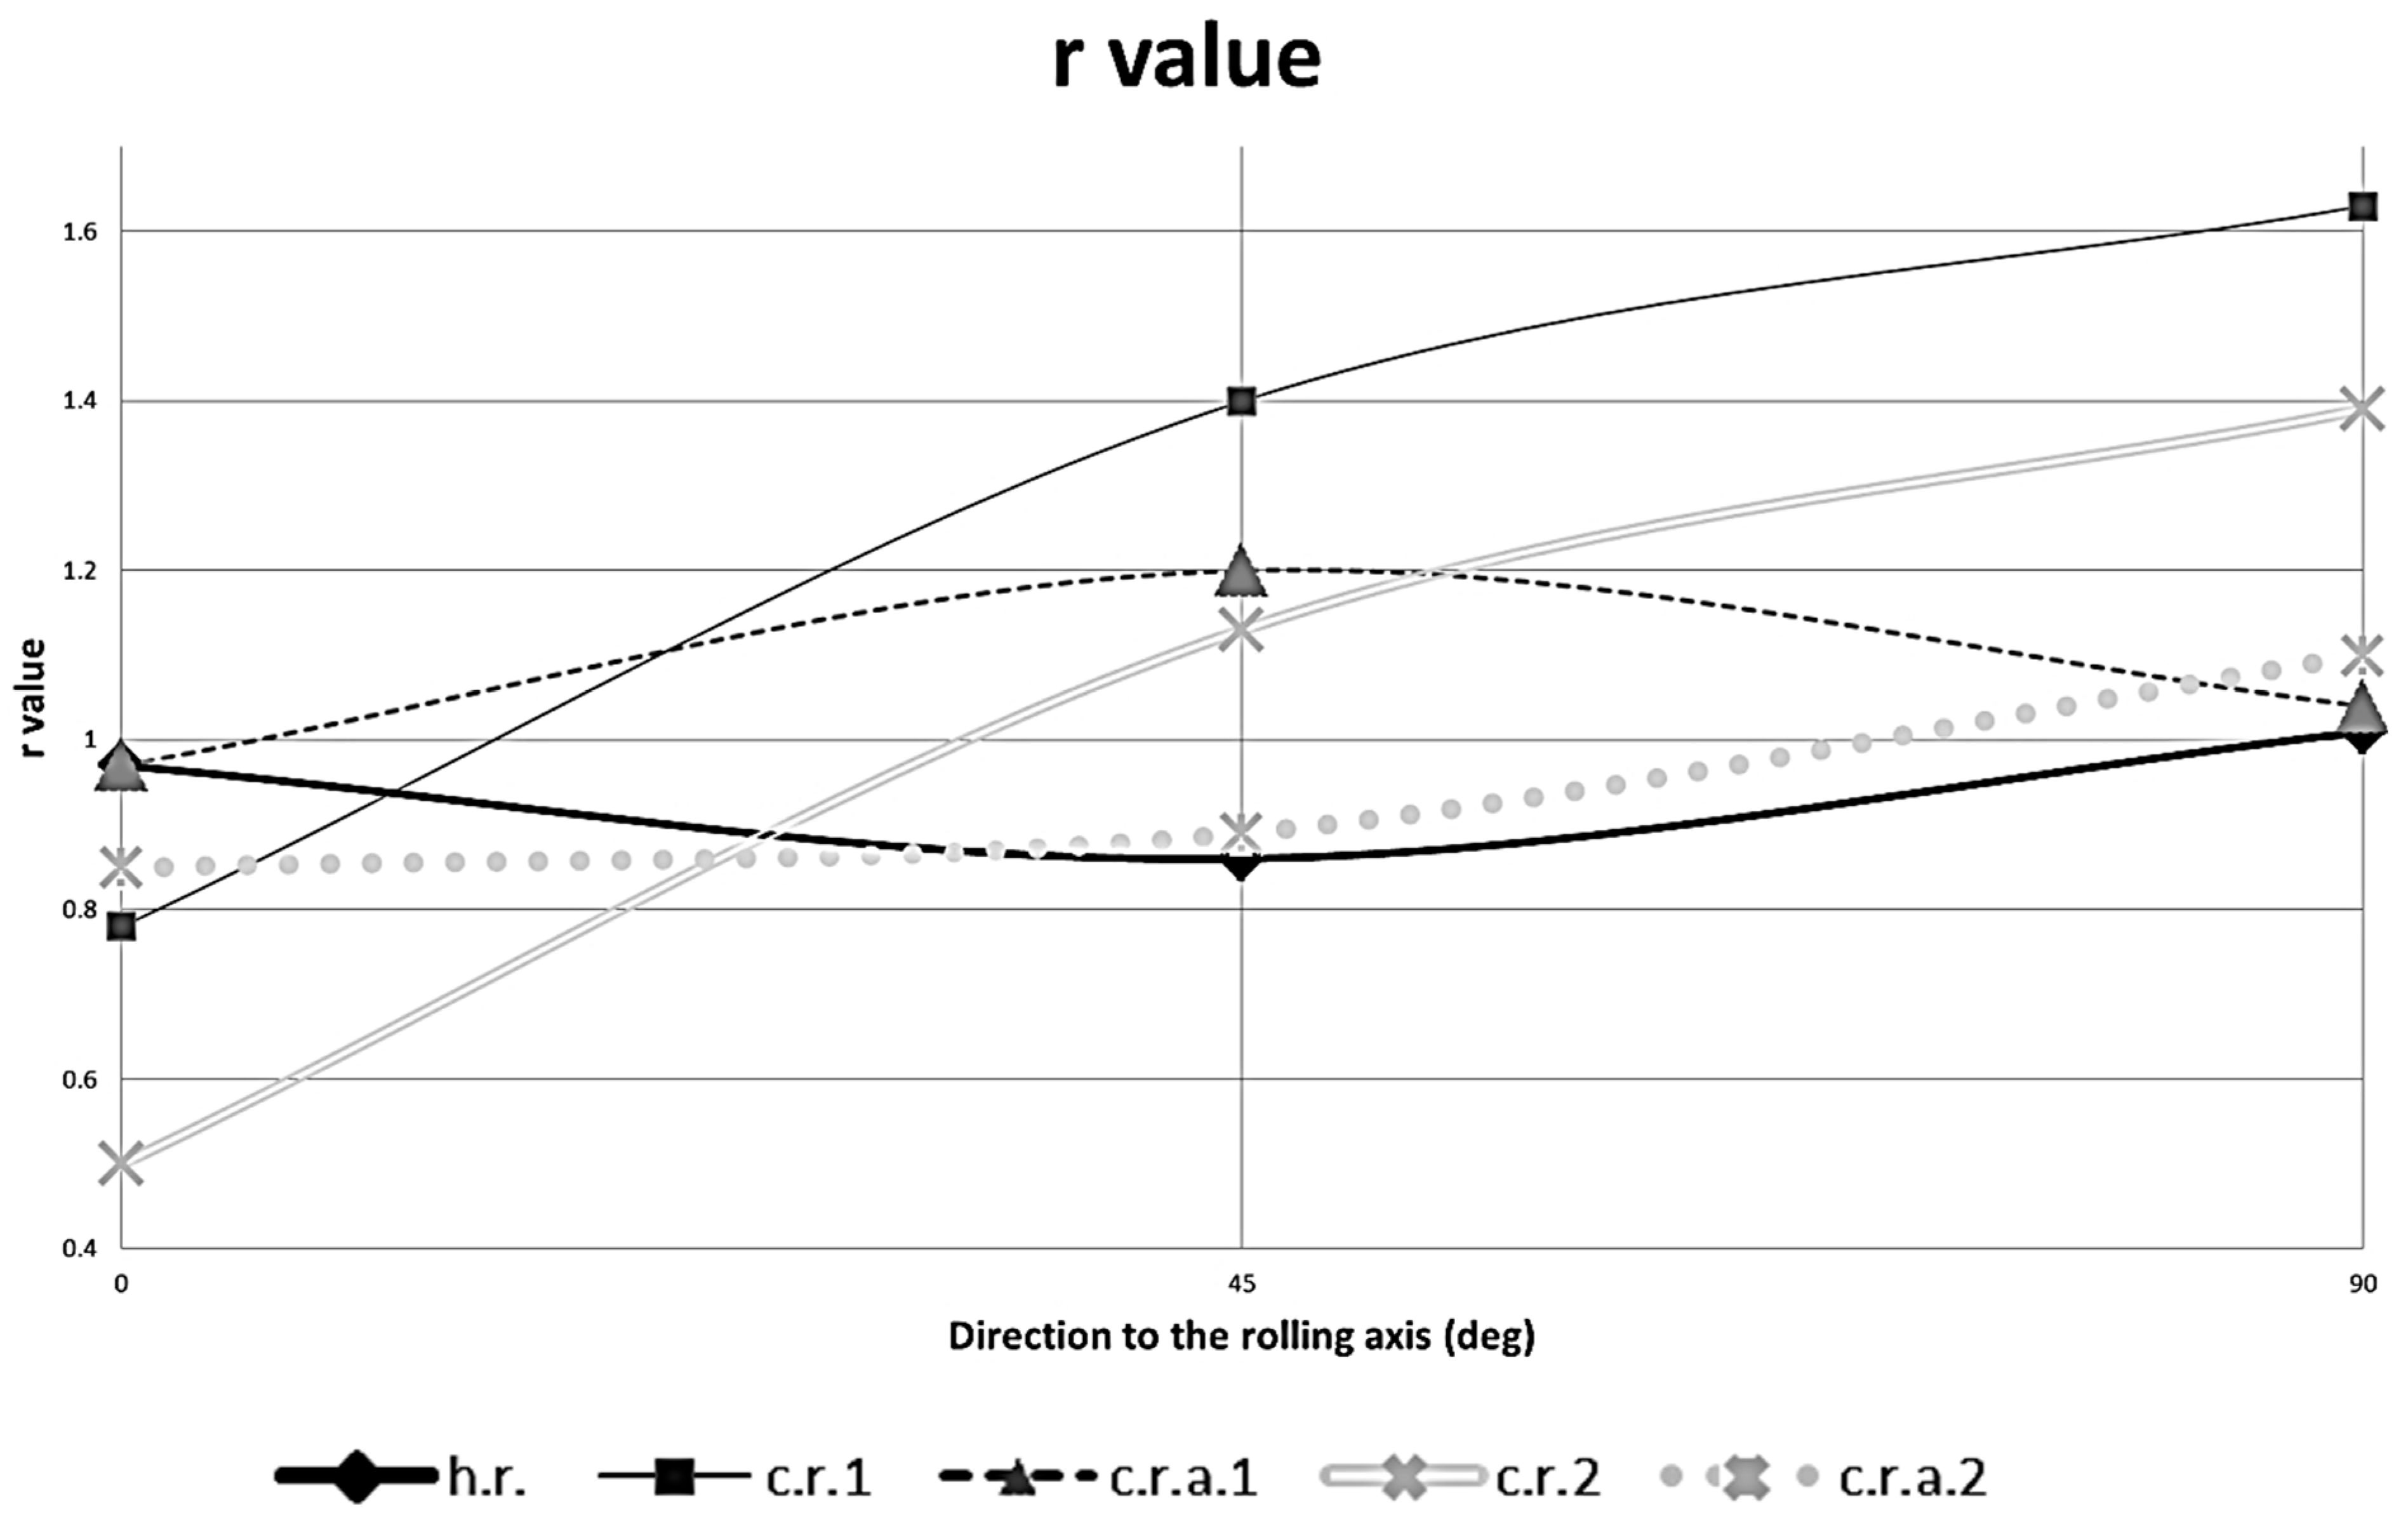
On a similar note, the r value was also influenced as a result of the various processing steps. In particular, cold rolling resulted into a reduction of the 0° r value in the rolling direction, whereas a significant increase was noted in the 45° and 90° directions. Similar observations were made for the 1.33 and 0.214 mm thick cold-rolled products. Annealing resulted in an increase of the r value in the rolling direction, whereas the r values in the 45° and 90° directions decreased. As a result, all r values after annealing closely resembled the relevant values of the original h.r. sample (see
Figure 9). Sample c.r.1 after 53% thickness reduction, exhibited decreased elongation (<14%). After the annealing process, elongation increased to >22%, which dropped to <10% after 92% reduction. After the final annealing, elongation reached along all the 0°, 45° and 90° directions, respectively >20%.
4. Discussion
The hot-rolled sheet exhibited a balanced amount of rolling and recrystallization texture components along with random texture. Cold rolling of the 2.8 mm hot-rolled sheet led to an increased amount of rolling texture, at the expense of both random and recrystallization textures. The effect of annealing was evident through the reduction of the rolling and recrystallization components percentages, whereas the random texture percentage increased. The amount of rolling texture components decreased whereas the amount of recrystallization and random components increased.
Cold rolling of the original 2.8 mm thick sheet resulted in increased anisotropy as indicated by the increased intensities PF and IPF diagrams. In contrast, post-cold-rolling annealing resulted in low PF and IPF intensities indicating a behavior relating to a more isotropic material, comparable to the original 2.8 mm thick hot-rolled product. This is beneficial due to the increase of fracture elongation and the reduction of anisotropy and elongated grain morphology, which can assume increased formability. In addition, cold rolling resulted in increased yield and tensile strength values as well as a significant decrease of fracture elongation due to the presence of fibrous grain with increased anisotropy. The dislocation density and grains size and morphology have major effects on elongation at fracture of the tensile specimens. PF intensity controls anisotropy of those mechanical properties, but hardly their overall level.
This effect was more pronounced in the 0.214 mm thick product that had to undergo two reductions instead of a single one, as was the case for the 1.33 mm thick product. Post cold rolling annealing restored the mechanical properties of the two cold-rolled products in levels comparable to the 2.8 mm thick hot-rolled product and as a result elongation and formability were improved. Cold rolling texture is transformed to the cube component during annealing, which favors its performance with regards to bending, whereas the addition of {111}<uvw> components such as {111}<110> during annealing favors deep drawability.
The random texture of both the annealed sheet samples was increased significantly which could be understood due to the suppression of nucleation and subsequent growth of the cube orientation which is expected to be strong in recrystallized aluminum rolled products. The almost homogeneous r value of the h.r., c.r.a.1 and c.r.a.2, a better formability could be expected [
37].
Suitable texture control relating to specific applications is required for the improvement of sheet metal behavior with regards to further forming operations (e.g., bending and deep drawing).
Structural variables could be used in measurements of dislocation cell morphology and material behavior. Therefore, the dependence of the cell morphology should be identified from the thermomechanical processes upon crystallite lattice orientation. Nevertheless the scan of areas of the order of a few μm or mm requires small step sizes in the case of highly deformed samples that exhibit good statistical accuracy, however, according to relevant literature [
4,
5,
6,
7,
8]. As such, data obtained from automated EBSD analysis of highly deformed microstructures can lead to a deeper understanding of the deformation behavior and the recrystallization and microstructure evolution sequences with regards to the applied deformation steps. Thus, the final microstructure and mechanical properties can be tailored accordingly with regard to the final thickness and the required strength levels as well as the necessary subsequent formability, which is the ultimate case.
EBSD data showed that after the first cold roll pass (c.r.1), crystallographic texture mainly contains β fiber texture (which was present even from the hot rolling process) with strong Taylor component. After annealing treatment, texture evolved mainly to Q, R and weak β fiber texture with the Taylor component maintaining the highest intensity. The second and final pass evolved the observed texture into a mixture of β fiber texture with the S component having the highest intensity and simultaneously strong Goss component; no significant cube texture was found. A possible path between directions {101} and {338}, could be a way for the nucleation of cube crystallographic components. At c.r.a.2 the {001} had be reformed after being seen in h.r. and in c.r.a.1.
Recrystallization exhibits characteristics of phase transformation in which the replacement of deformed material due to the creation of nuclei and growth of recrystallized grains can lead to significant changes of the resulting texture. The latter does not lead to precise orientation relationships among deformed and recrystallized material, contrary to the phase transformations. It should be stated that recrystallization does not always lead to texture transformations, especially when large volume fractions of second phase particles are present or when the deformation was axisymmetric.
The quantitative correlation between PF intensity and mechanical properties could be attributed to the anisotropy increase that takes place after each mechanical process, but it is important to observe the analogy of these values towards texture. The impact of texture components is strong on the variations of r-value for different directions. In all examined cases, the texture component occupies >92% of the total volume fraction of grains. The remaining volume fraction is populated by randomly oriented grains. The r-value is non-uniform for all the examined direction for each sample. It is clearly seen from
Figure 9 that the optimal texture for the smallest possible in-plane anisotropy clearly gives an average r-value less than 1.0 (exhibited by h.r.).
The r values of the Al sheet, when measured after hot rolling, can be regarded as more appropriate amongst those of all measured samples. After annealing of the 92% reduced sheet, r measurements indicated a quite good forming behavior, but the effect of the final pass towards the anisotropy and r values at 0°, 45° and 90° could not be eliminated throughout annealing. A higher, than expected for this Al alloys, r value was observed at 90°, a behavior that can be attributed to the higher amount of rolling texture and especially to the presence of the S component. Therefore, a reduced amount of thickness reduction, the number of rolling passes and the lubrication could provoke better results and, possibly, the ideal percentage of rolling and annealing crystallographic components.


