Article

A New Approach for Obtaining the Compression Behavior of Anisotropic Sheet Metals Applicable to a Wide Range of Test Conditions

by
Jorge Ayllón
1,2,
Valentín Miguel
1,2,*,
Alberto Martínez-Martínez
2,
Juana Coello
1,2 and
Jesús Andrés Naranjo
1,2
1
Regional Development Institute, Material Science and Engineering, University of Castilla-La Mancha, 02071 Albacete, Spain
2
Industrial Engineering School of Albacete, University of Castilla-La Mancha, 02071 Albacete, Spain
*
Author to whom correspondence should be addressed.
Metals 2020, 10(10), 1374; https://doi.org/10.3390/met10101374
Submission received: 24 September 2020 / Revised: 8 October 2020 / Accepted: 13 October 2020 / Published: 15 October 2020
(This article belongs to the Section Metal Casting, Forming and Heat Treatment)

Abstract

:
The consideration of anisotropic and asymmetric tension-compression behaviour in some materials has proved to be of great importance for the modelling of plastic behaviours that allow for accurate results in sheet metal forming analysis. However, obtaining this compression behaviour of a sheet metal in the principal plane directions is one of the most complex aspects from an experimental point of view. This complexity is notably increased when this behaviour needs to be analysed under high temperature conditions. This paper presents a compression test system with load application in the in-plane sheet directions which is characterised by a relative technical simplicity allowing its application under temperature conditions of up to 750 °C and different strain-rates. Due to the specific test conditions, namely the high temperature, it is not possible to use the common systems for measuring the strains involved and to obtain the stress-strain curve. Therefore, this paper proposes two methods for this purpose. The first is the performance of interrupted tests and measurement of the central cross sections. The second consists of inverse calibration using finite element simulations. The sensitivity of the proposed test methodology is validated through the characterisation, at room temperature, of the compression and tensile behaviour of six materials with different plastic deformation phenomena. In this way, the asymmetric tension-compression phenomena are accurately identified and high compression strains of around 0.3, higher than those existing in the literature, are investigated. A novel test methodology is thus established that is easily applicable for the mechanical characterisation of sheet metal at high temperature.

1. Introduction

The development of products with more complex geometries, applications and materials has led to FEM simulation systems becoming the fundamental industry tool in the study of complex sheet metal forming processes, significantly reducing development cycle costs and times by avoiding much of the prototype stage. The precision achieved over the last two decades in the analysis of these processes is mainly due to the development of complex mechanical behaviour models that take into account most of the plastic deformation phenomena detected in the materials. However, the development of these theoretical models is not sufficient to predict the response of the material under different temperatures or strain rate conditions. For this purpose, experimental test systems must be developed to identify the behaviour of each material under any condition. Thus, the most appropriate model can be selected and precisely adjusted.
The accuracy of predicting stress distributions in the bending produced in any sheet metal forming process is one of the key factors in the overall accuracy of the designed parts. Traditionally, mechanical behaviour has been considered equal to tension and compression. Recent studies, however, have highlighted the differences in many materials. The possible existence of asymmetries in the tensile and compressive behaviours affects, among others, the bending and unbending stresses. Nixon et al. evaluated the influence of this asymmetric effects on the modelling of pure titanium [1]. The agreement between the experimental and simulated results of bending tests was excellent, highlighting the displacement of the neutral axis that took place. This heterogeneous strain distribution through the thickness direction, caused by tension-compression asymmetry, has a significant influence on the subsequent springback. Springback is the main problem in determining the optimal design of complex dies and processes, making high efficiency production difficult. Therefore, the precise determination of the compression behaviour is a factor of great interest to obtain products with narrow dimensional tolerances. Noma et al., demonstrated the importance of considering asymmetric phenomena in the springback simulation of a curvature-hat press-formed part [2].
The compression test methodology for cylinders is well-established in the industry, even at high temperatures. However, in the case of sheet metal analysis, there is no clear testing system and methodology. This issue would be even more complex if tests at high temperatures were needed.
The main problem with sheet metal compression is the appearance of instability phenomena by buckling, even at very low loads, due to the reduced stiffness of the section. To avoid this problem, similarly to cylinder compression tests, some authors have carried out compression tests on stacks of sheet metal discs. Martínez et al. optimised this technique for the study of TRIP (Transformation-Induced Plasticity) steel behaviour, obtaining its asymmetric response in a precise way [3]. The simplicity of this method makes its application easy under moderate- to high-temperature conditions. Thus, Graf et al. analysed 6060-aluminum and AZ31-magnesium alloy sheets up to temperatures of 350 °C, but the scope of their work was to evaluate the material behaviour only under an isotropic hypothesis [4]. When the load application in the thickness direction must be considered, it is not easy to quantify the anisotropic behaviour. The combined use of either two optical measurement systems [5] or the testing of oriented cubic sheet stacks [6] can solve this problem as these authors demonstrated. The solution provided by Steglich et al. [6], that made use of two extensometers, had the added advantage of being able to measure the compression anisotropy. Nevertheless, these solutions are expensive or present setup and execution issues.
Compression tests with application of the load in the main plane of the sheet require a lateral support system that prevents buckling. This has the disadvantage of introducing frictional and pressure forces that induce a slight biaxial state that can cause deviation in the results and must be considered. Thus, it is necessary to minimise the pressure applied to avoid the buckling of the sheet during the tests, as well as the friction coefficient of the system sheet-tool. Various alternatives have emerged to evaluate the compression behaviour in each of the sheet metal directions.
Kuwabara et al. designed a test apparatus consisting of two pairs of male-female comb-shaped plates, closed by a pneumatic cylinder which allows the applied force to be controlled at any time In this way, buckling was avoided while allowing displacement for compressive deformation. Thanks to this tool, asymmetrical traction-compression behaviour could be observed for transverse and rolling directions of phosphor bronze, AA6016-T4 and SUS304 stainless steel [7,8]. Using this device, Gilles et al. analysed the tension and compression responses of Ti6Al4V up to deformation values around 0.15. In this way, they modelled the asymmetric-anisotropy behaviour of that alloy according to the CPB06ex3 yield criterion [9]. Maeda et al. redesigned this device to increase its stiffness, observing the strength differential effect (SDE) of the DP980 steel [10]. They were subsequently able to prove its importance in the study of sheet bending. Hama et al. used a similar design to study the mechanical behaviour of pure titanium at room temperature under monotonic and reverse loading, obtaining the same yield stress in tension and compression and a subsequent asymmetry in strain-hardening [11]. Boger et al. designed another system based on the use of two rectangular side plates attached to hydraulic cylinders for the application of force [12]. This method is technologically simpler but requires leaving a free gap between the lateral clamping and the test machine grips to perform the compression movement on the sheet. Consequently, a specimen design with large heads is necessary to avoid buckling in this free zone, and the maximum achievable strain is limited. Bae and Huh resorted to the use of springs for the application of lateral force in a similar device, simplifying the design proposed by Boger et al. and making it easier to use [13]. On basis of this system, Joo et al. designed a device to analyse the traction-compression behaviour of DP590, DQ, TRIP980 and TWIP980 steels at intermediate strain rates [14,15]. Hartel et al. used screws for the application of lateral force but they focused their study on the microstructural evolution during tension-compression loading of DC06 steel at low strains [16]. This method is slightly more complex to be controlled due to the variables affecting the relationship “clamping force-tightening torque”.
Other authors have proposed alternative compression systems, but these have been less widely used in the literature. Thus, Cao et al. designed a double-wedge device, which avoids leaving areas without lateral support, and developed a methodology for measuring deformations by means of the design of a specimen with double-side fins [17]. Yoshida et al., developed a hybrid system using a specimen stack with lateral support to prevent buckling and to achieve high compressive strains [18]. Recently, Zhou et al. proposed a specimen design with a single-sider groove, which forced the buckling phenomenon in one direction. This means that only one side of the tool needed to be clamped, reducing lateral forces and simplifying the tooling. Nevertheless, the machining required is highly complex for thin specimens [19].
The determination of the compression behaviour of sheet metal at elevated temperatures, however, has not been widely studied in previous works. Piao et al. modified the compression system proposed by Boger by integrating a heating system in the anti-buckling lateral plates to reach temperatures of 250 °C in the tensile-compression test of AZ31D magnesium alloy, TWIP steel and various dual-phase (DP) steels [20]. Lee et al. combined the methodologies of Kuwabara et al. and Piao et al. to design a comb-type die with a heating system by cartridges inserted in the clamping system [21]. This system allowed them to carry out tension-compression tests with Al5052 and AZ31 magnesium alloy up to temperatures of 250 °C, but with the possibility of reaching 350 °C in future tests. Odenberger et al. employed a device with a screw clamping mounted on a modified Gleeble 1500 system to obtain the compression behaviour of Ti6Al4V at 400 °C for strains close to the yield point [22].
In summary, all methodologies existing in the literature, as aforementioned, do not enable the characterisation of a possible anisotropic compression behaviour of sheet metal at temperatures higher than 300–400 °C. Moreover, the methodologies proposed in all previous studies analysed do not reach high strains beyond 0.15. Higher deformations are easily achieved in the common forming process, so compression tests should achieve higher values to be able to safely model all features of the material compression behaviour. In addition, authors who achieve greater deformations, as Martínez et al. [3], do so by means of a disk stack compression method, with the disadvantages mentioned before.
Thus, the aim of this work is the development of a technologically friendly compression test system capable of detecting asymmetric tension-compression behaviour and achieving high strains in tests at high temperatures up to 750 °C. The goal of this paper will focus on developing and testing the sensitivity of the proposed system for determining the compression behaviour of various materials at room temperature, leaving its application at high temperature for future works.

2. Materials and Methods

2.1. Development of the Experimental Methodology for Hot Compression Tests

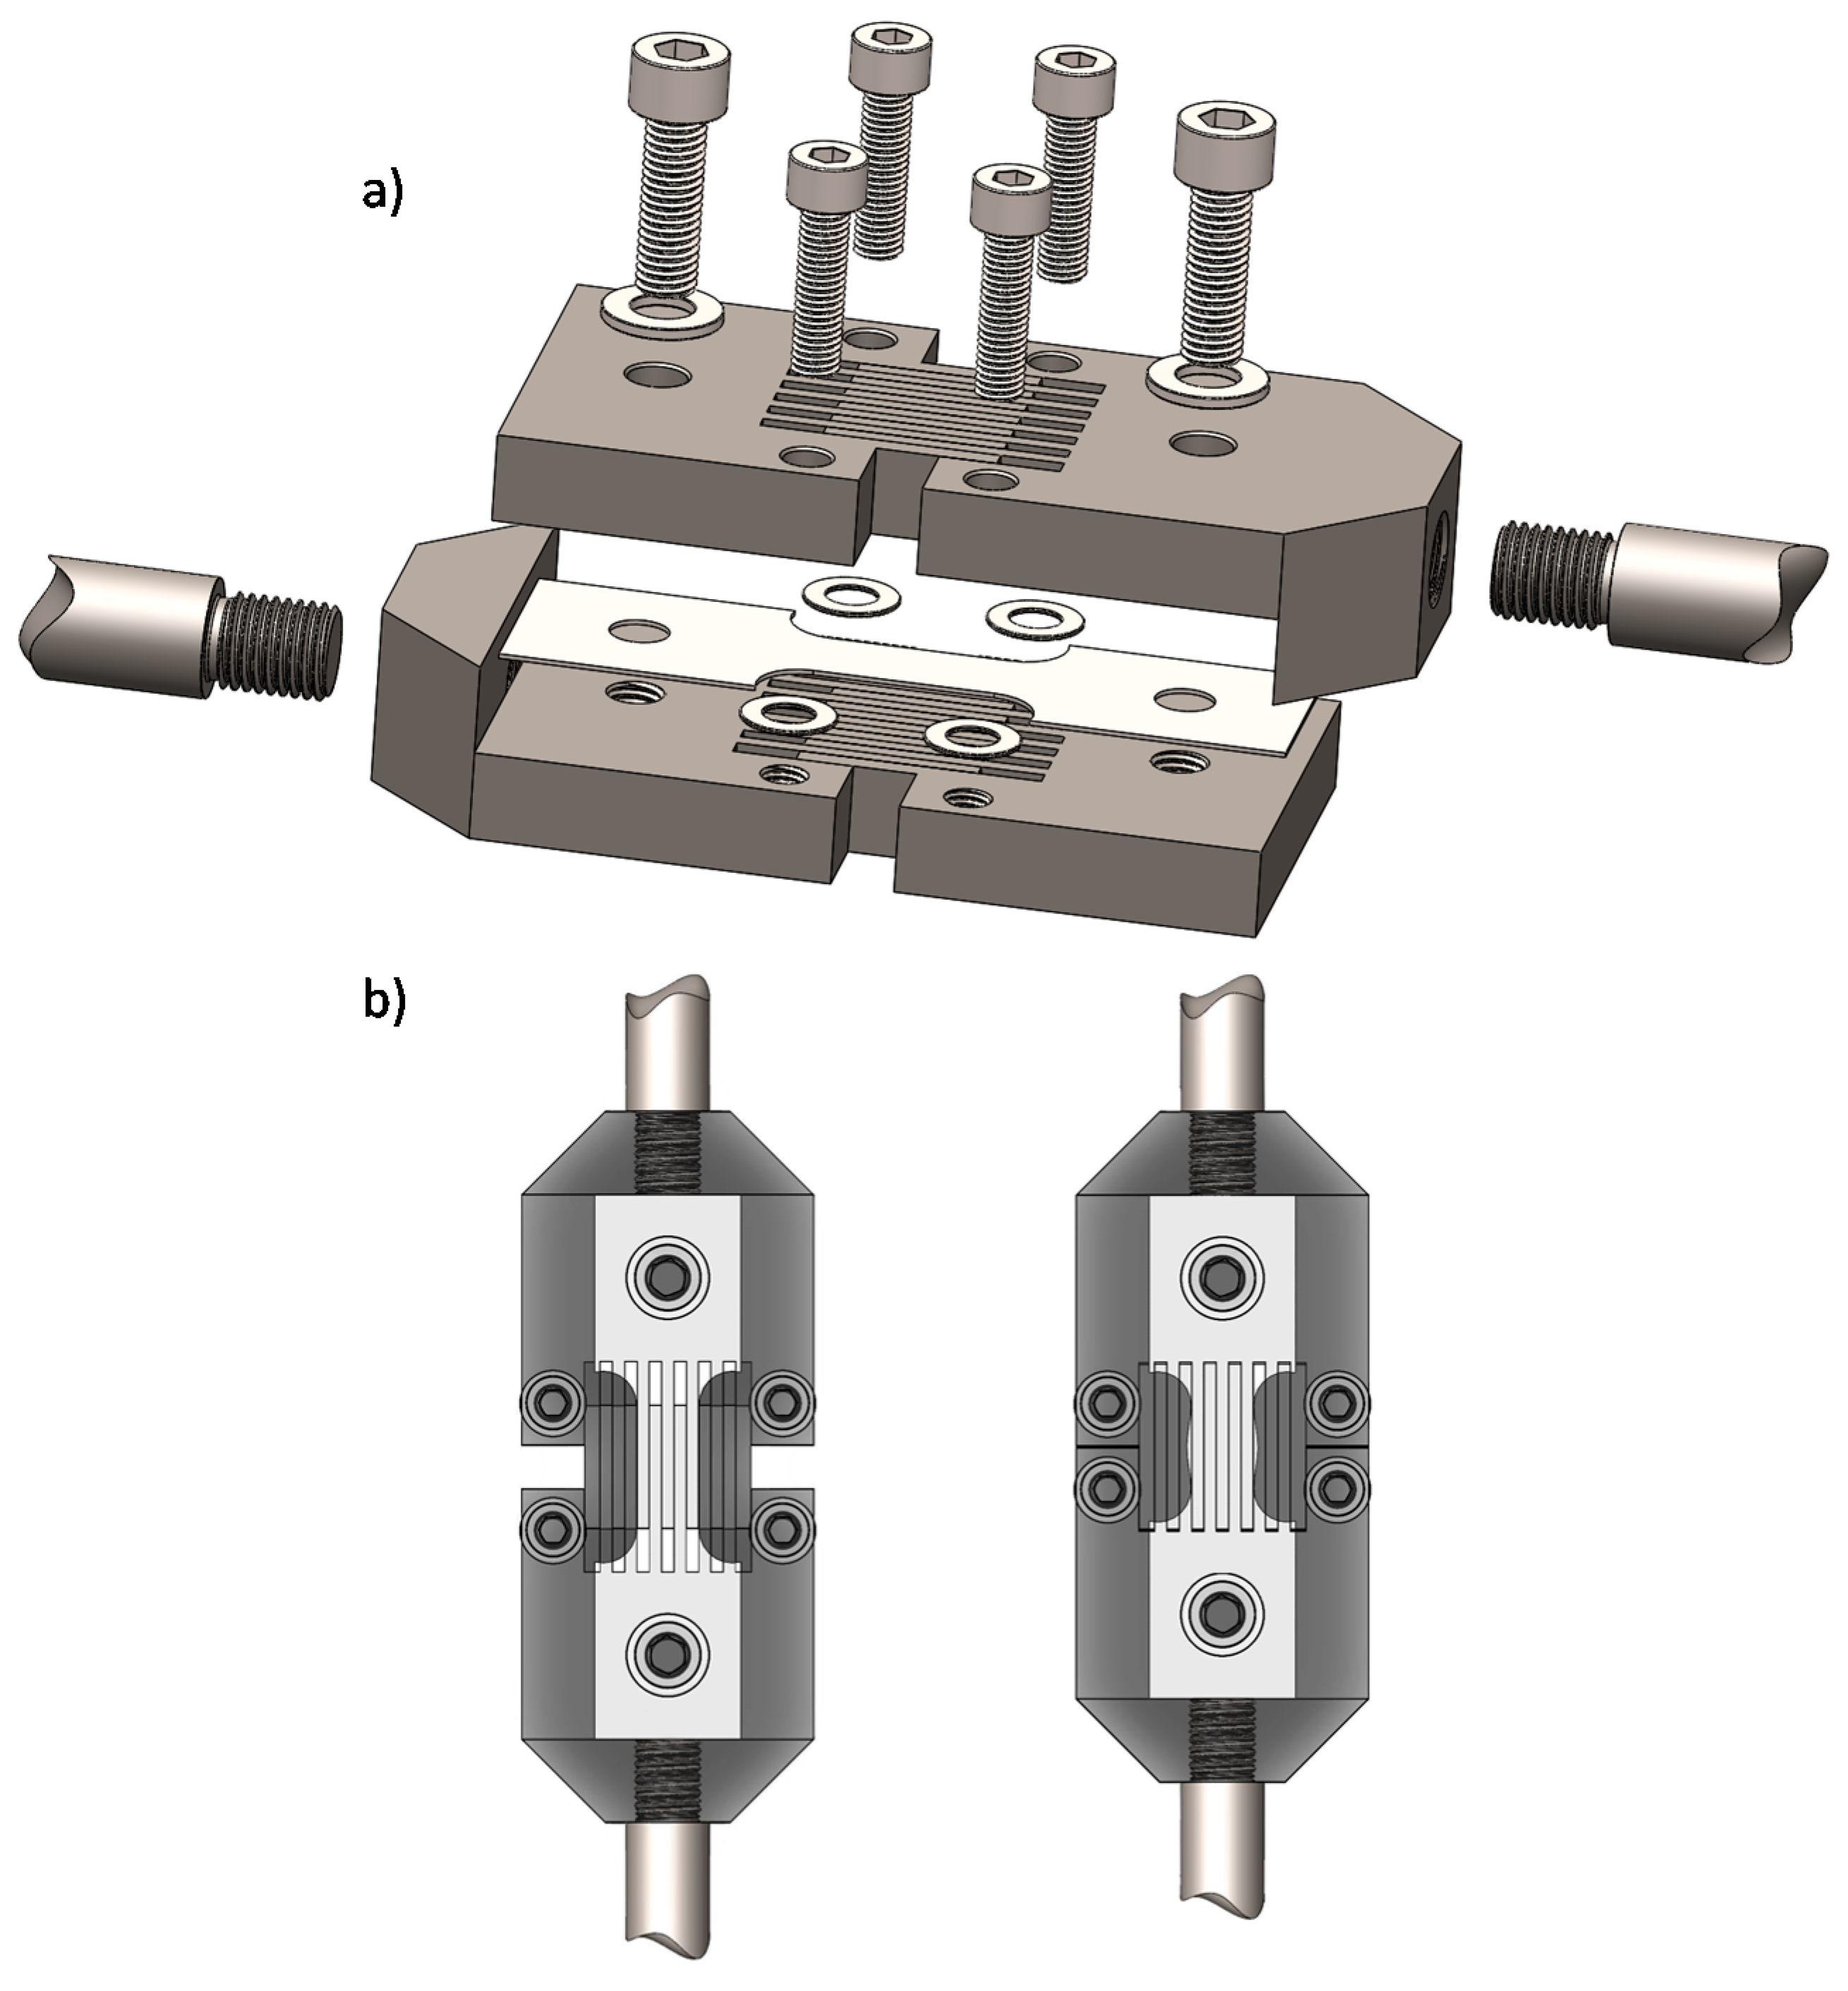
2.1.1. Description of Tools and Test System

For the development of the testing devices, the comb-type system proposed by Kuwabara et al. [7] was used as a reference. Dies have been developed to allow full lateral restriction of the specimen during the entire compression, with a great possibility of displacement by compression of up to 11mm, as shown in Figure 1. Due to the goal of establishing a methodology for high-temperature compression tests, the technical simplicity of the device was prioritised over other factors. The number of components was minimised, and the screw clamping system was chosen to apply just the right amount of lateral force that prevents the sheet metal buckling, similar to that used by Hartel et al. [16]. Even though, the tightening force of the screws can be affected by thermal expansions, it was considered more appropriate than the use of pneumatic cylinders because of their simplicity of assembly and use. The use of springs, despite their simplicity and effectiveness, was also ruled out due to their great loss of elastic rigidity with temperature.
As can be seen, the device consists of 4 parts made of X40CrMoV5-1 hot working steel, hardened and tempered at 650 °C, which ensures its good mechanical behaviour at a wide range of temperatures. The system is fixed by using 6 stainless steel screws. Two of them, placed in the area of the heads of the specimens and passing through the holes made in them, allow the specimen to be clamped and are responsible for providing the tightening force. Fixing the specimen by means of these two screws also allows it to be correctly aligned during the test, avoiding problems in this sense [12]. In addition, after several iterations, it was decided to add 4 lateral screws in the central zone, in order to avoid the possible play by elastic deformation and clearance of the dies, which could occur in materials with a high elastic limit due to the greater need of lateral forces. Thus, the design allows easy use of the device in a universal testing machine, as well as its use inside the furnace coupled to it.
The possibility of using this device inside a high-temperature test furnace facilitates reaching homogeneous high temperatures although some drawbacks appear in terms of extensometry and lack of isothermal conditions in tests at high strain rates. Taking into account the problems of temperature dissipation and distribution existing in the previous solutions [20,21], this method was considered the most suitable to reach temperatures up to 800 °C due to its thermal stability. This solution greatly simplifies the control system as it does not require zoned temperature control by inserting thermocouples or electrical insulation.

2.1.2. Design of the Compression Test Specimens

Several factors were considered in the design of the specimen, as it had to avoid the possibility of buckling while providing a compression deformation zone that was as homogeneous as possible. Boger et al. differentiate three modes of buckling in compression specimens: Lateral buckling in the width or lateral direction (W), buckling in the thickness direction (T) and buckling in the unrestricted area (L) [12]. The latter two buckling modes are automatically avoided due to the design and rigidity of the device used. Therefore, the design of the specimen should only limit the lateral buckling mode (W). However, due to the need for free deformation of the sheet metal to obtain a uniaxial state, it was impossible to limit the movement in this direction. Thus, the only solution to this drawback was to restrict the length/width ratio of the specimen to the minimum possible. Nevertheless, this solution is in contrast to obtaining a uniform uniaxial state over the entire length of the specimen, which requires the deformation length between the fillet radii being as large as possible to minimise the triaxial effect that these radii induce in certain areas of the specimen. The design of the compression specimen had to seek a balance between the two factors, bearing in mind that it is difficult to find a solution for the proposed testing system that solves both issues in an absolutely satisfactory manner, unlike a tensile system. It should be noted that, in the authors’ opinion, no previous work has adequately addressed this aspect for strains higher than 0.1.
A “dog bone”-type specimen was used for the tests (Figure 2a), similar to that used in the tensile tests but shorter, as it allows the deformations to be concentrated in a localised area and permits a clamping head zone without plastic deformation. This clamping zone is important to keep the whole assembly together due to the vertical running of the universal testing machine. In this case, the specimen fillet radii are not as critical as they are in tension, although their design remains important as they impact the restriction of the lateral deformation of the sheet at the ends of the deformation zone. In the head area, a restriction to the deformation occurs, similar to that produced by friction in compression tests on cylinders, causing barrelling in the study or calibration area [12]. This induces a different stress state to pure compression, which directly complicates the determination of equivalent stresses. This aspect has barely been addressed in previous works, where, due to the low strains, it was not considered a critical factor. However, when high plastic deformation is desired, its consideration is essential.
Based on these considerations, geometric optimisation by means of finite element simulation, using the explicit software Hypermesh 2019 + Radioss (Altair Engineering Inc., Troy, MI, USA), was carried out prior to the compression tests. The model of the specimen consisted of 2D quad QEPH type elements of 1 mm in size, which is a Radioss standard element improved and under-integrated with physical hourglass stabilisation (Figure 2b). The simulations were performed according to the Von Mises yield criterion for isotropic material considerations, and according to the Hill 1948 yield criterion, when anisotropic behaviour was assumed. In all cases, the mechanical behaviour of the material was defined according to the Swift model of Equation (1). From this arbitrary equation, it was possible to vary the “n” parameter to assess the influence of strain hardening on the material. The strength coefficient, K, and the prior strain, ε 0 , were kept constant.
σ = K   ( ε 0 + ε p l ) n = 300   ( 0.005 + ε p l ) 0.15
In pursuit of a balance between the different deformation phenomena, a fillet radius of 8 mm was established. As can be seen in Figure 3, the barrelling problem is more pronounced when the fillet radius is smaller, due to the greater constraint on lateral deformation it imposes. However, increasing this radius implies higher plastic deformation in the transition zone with the specimen heads. In contrast to tensile tests, where the strain hardening is partially compensated by section thinning, in the case of compression tests, the combined effect of the increased section together with the material hardening results in a considerable increase in the required strain force. This, in turn, generates significant plastic deformation of the radius areas, with less strain hardening. In addition, these deformations outside the calibration area make it difficult to achieve high strain values in the centre of the specimen due to limited axial displacement of the system.
Due to the barrelling problems and the deformation in the transition zone with the heads, a homogeneous strain length should not be considered. Thus, the strain measurement methodology would not be based on the consideration of displacement and gauge length, L 0 , as is the case in tensile tests. Therefore, the experimental strain measurement had to be limited to the measurement of the strain in the middle zone. The strain was estimated, as it will subsequently be discussed, by measuring the cross-section of the specimen in that area. For this purpose, a zone subjected only to uniaxial compression stresses should be guaranteed.
The triaxiality factor, T σ , quantifies the stress state of the material in a simple way. According to the definition of this parameter as a function of the hydrostatic stress, σ h , and the equivalent stress, σ e q (Equation (2)), a pure compressive stress state is defined by a triaxiality value of −0.33. Note that σ h is obtained from the principal stresses ( σ 1 , σ 2 , σ 3 ) . Therefore, this criterion was used to quantify the deviation of each design from pure compression, throughout the strain. For the preliminary studies, specimen simulations with different deformation lengths and a constant width of 15 mm were carried out (Figure 4).
T σ = σ h σ e q = 1 3 ( σ 1 + σ 2 + σ 3 ) σ e q
Using the mean value of triaxiality and deformation in the central zone (Figure 5), it can be seen that specimens with lengths of 30 and 40 mm come closest to a pure compression state, which corresponds to an L0/W0 ratio of 2 and 2.66, respectively. Similar results were obtained by Bae and Huh [13], L0/W0 = 2.27; Noma and Kuwabara [23], L0/W0 = 2.2; and Lee et al. [21], L0/W0 = 2. In accordance with the buckling criterion, to minimize the risks of lateral buckling, the 30 mm long specimen was chosen.
Due to the influence of anisotropy on the deformation of this kind of material, once the most suitable geometry had been established, simulations were carried out to evaluate its application in materials with different normal anisotropy values (r = 0.3, r = 1, r = 3 and r = 7). As can be seen in Figure 6a, the influence of anisotropy on triaxiality is remarkable. Higher anisotropy values imply a greater strain in the width direction, which increases the barrelling produced in the central zone and, therefore, induces a tensional state that is farther from pure compression. In the case of anisotropies below 1, the greater thickness strain avoids the occurrence of barrelling, ensuring a state closer to pure compression.
Figure 6b shows the behaviour of isotropic materials in a range of material hardening rates. As can be seen by the dashed lines, a higher hardening index “n” leads to a triaxiality farther from pure compression, but its influence is smaller than the r-parameter and can even be neglected in this context.
Therefore, the proposed geometry can be valid for obtaining the compressive behaviour of any material as long as it does not have an exceptionally high compressive anisotropy coefficient.
The maximum displacement admitted by the design of the dies, approximately 11 mm, limited the maximum strain that could be reached during the test. For this reason, tests were also carried out with smaller specimens (maintaining the ratio L0/W0 = 2) to obtain points for greater strains. The final dimensions of the specimens used are specified in Table 1.

2.2. Approaches to Evaluate the Compression Behaviour of Sheet Metal

In the application of this compression method, as a result of the designed die characteristics and the non-homogeneous strain distribution in the specimen, the measurement of the equivalent strain poses another difficulty. As previously mentioned, a constant deformation zone cannot be established. Consequently, obtaining the true curve by the traditional method, based on the consideration of a gauge length and the conversion of the engineering curve, is not valid for the case of this compression tests. This curve will be defined for future reference as an apparent compression curve. As can be seen in Figure 7, the apparent curves obtained from finite element simulations (dotted lines) diverge considerably from the true curves (continuous lines).
The use of gauges attached to localised areas of the specimen has been used by other authors to solve this problem. However, measurement with gauges is not applicable for high-temperature testing, due to their limited working temperature.
On the other hand, the optical measurement systems, based on digital image correlation (DIC) or laser extensometers, also solve the problem of the non-homogeneous distribution of strains along the sample, obtaining good results in the strain measurements in the thickness profile of the sample [20] or through holes in the dies designed for this purpose [22]. These systems have greater versatility, but their use remains technologically complex if high-temperature tests need to be performed. High-temperature testing requires the use of an insulated furnace, which makes it difficult to record accurate images of the test. Generally, these systems are based on the projection of a stochastic pattern onto the specimen, usually paint, which is sensitive to temperatures above 300 °C, although this could be solved with the use of suitable primers.
Therefore, in view of the impossibility of calculating the strains up to high values from a constant gauge length and also ruling out the use of gauges or optical systems, two alternatives were considered to obtain the stress-strain curve in compression: Measurement of the cross-section in the central area and adjustment of the curve by means of inverse methods, also known as feedback methods.

2.2.1. Procedure Based on the Central Cross-Section Measurement

This methodology was based on the measurement of the cross-section in the central area of the specimen. As discussed in Section 2.1.2, it was ensured that a stress-strain state very close to pure compression was produced in this zone. Numerous tests were carried out under the same conditions up to different strain levels, each of which allowed a point of the true stress-strain curve to be obtained.
As in the specimen design, finite element simulations were carried out to check the validity of this methodology before its experimental application. The results of these simulations are shown in Figure 7. The continuous lines correspond to the true stress-strain hardening law used in the definition of the constitutive model of the material, while the points correspond to each of the discrete strain measurements in the central section, calculated according to Equations (3) and (4), where the initial cross-section of the sample is S0, the cross-section of the deformed sample is S, and the compression force at the measurement moment is F c .
σ = | F c S |
ε p l = | ln ( S S 0 ) |
Figure 7a shows the results obtained considering different material hardening rates. As can be seen, the points obtained by applying the cross-section measurement methodology coincided with the true stress-strain curve of the simulated material in all cases. Figure 7b illustrates the influence of the material anisotropy. Only for very high anisotropy values (r = 3) was a slight deviation in the measured points from the true stress-strain curve observed. In these cases, the triaxiality induced by the anisotropic deformation moves the stress state away from pure compression and a certain error is generated when measuring equivalent stresses as uniaxial stresses.
Thus, it was proven that the proposed geometry and the cross-section measurement methodology are suitable to obtain the compression behaviour of materials, as long as they do not have very high compression anisotropy values. In such cases, the methodology should incorporate appropriate correction factors, or the test sample should be redesigned by slightly increasing the length of the deformed zone, L0. This solution is tedious as it requires numerous tests, but it allows the curve to be obtained using only experimental methods.
As already mentioned, and as can be seen in Figure 7, the consideration of a gauge length of deformation (apparent curve) is not valid for the case of compression tests. A double error occurs: Underestimation of the stresses and overestimation of the strains. Figure 8 shows the ratio between the average cross-sectional strains, obtained by experimental and simulated methods, and the theoretical value calculated on the assumption of a gauge length (apparent curve). The deviation from the optimal ratio can be observed in all cases as the strain increases. The optimum value corresponds to when the measured and calculated strains are equal, i.e., the absence of the phenomena of barrelling and deformation outside the gauge length. Measured and calculated strains are similar for very low strain values, which would allow the apparent curve to be used directly up to a strain value around 0.05.

2.2.2. Procedure Based on the Inverse Modelling Method of the Compression True Stress-Strain Curve

As opposed to the purely experimental procedure proposed in the previous section, a methodology based on the application of computational techniques was used. By means of finite element simulations, the behaviour of the material was adjusted following an experimentally known response. This approach has been successfully used for the determination of the tensile behaviour beyond the necking point [24] or the yield loci calibration [25].
On the basis of the tensile behaviour adjusted and extrapolated according to the suitable function for each material and using the finite element model described in Section 2.1.2, an iterative procedure was carried out until the compression true stress-strain curve was achieved. This iterative process was conducted by comparing the engineering stress-strain curve obtained experimentally with those predicted by the FEM simulation. For an elongation point, the experimental, σ e n g i e x p , and simulated, σ e n g i s i m , values of the engineering stress and the average simulated plastic strain, ε ¯ p l i s i m , in the central section were obtained. The new true stress value to define the compressive behaviour of the material at the point corresponding to the plastic strain, ε ¯ p l i s i m , was calculated using Equation (5). By applying this procedure to several strain points, i, the entire true curve was corrected at each iteration, n, until the experimental and simulated engineering curves were coincident. Having achieved that, the true compression curve could be drawn using those corrected values.
σ i n + 1 = σ i n · σ e n g i e x p σ e n g i s i m
Before making the inverse adjustment, the component of the experimental stress due to friction must be removed. For this purpose, the frictional force must be calculated according to the procedure that will be detailed in Section 2.3.4, and subsequently subtracted from the total compression force obtained experimentally. Figure 9b shows the experimental points with friction and after elimination of friction, as well as the consecutive approximations by the inverse method.
As can be seen in Figure 9, with a reduced number of iterations, a good concordance was achieved between the experimental reference curve and the predicted one, in this example for the pure titanium grade 2 (Ticp2) studied. The evolution of the true curve in each iteration is shown in Figure 9a, highlighting the considerable difference between the curve of the first iteration (corresponding to the tensile test) and that finally obtained in iteration 4.

2.3. Experimental Procedure

Once the test methodology and analysis of the results had been established, tensile and compression tests were carried out to obtain the mechanical behaviour of various materials, several of which have a known response, in order to validate the proposed method, as well as to verify the influence of the tensional system.

2.3.1. Test Materials

To check the sensitivity of the developed methodology, the compression curves of 6 different materials were obtained. The materials chosen and their most significant properties are shown in Table 2. In this way, we considered materials with all the main crystallographic structures and different plastic deformation phenomena, aspects that can affect the asymmetric behaviour of tension-compression to varying degrees.
The DX52D + Z steel was chosen because it is an almost perfectly isotropic mild steel and a more traditional behaviour was expected. This material was used to develop the test methodology, and everything related to the elimination of friction forces. On the other hand, the motivation to choose both titanium alloys was their hcp structure. In the case of pure titanium, Nixon et al. demonstrated a high degree of asymmetry in tension and compression hardening [26]. TRIP 690 and AISI 316 steels were selected because the martensitic transformation by deformation occurring in these materials has been found to be different under tensile and compressive stresses [3]. In the case of AISI 316 stainless steel and Al 1050 aluminium, there is also evidence that the fcc structure can affect the deformation under various types of stress due to its tendency to deformation by twinning [27].

2.3.2. Compression Tests

The compression tests were performed using a Servosis ME 401/10 +/−100 kN (Servosis Inc., Pinto, Madrid, Spain) universal testing machine, equipped with the compression dies described in Section 2.1.1. The testing speed of the machine was set at 4 mm/min for normal specimens and 2.66 mm/min for short specimens. In both cases, the material was deformed at a constant strain rate of approximately 0.002 s1.
Despite not directly knowing the force applied on the flat surfaces, the tightening torque of all the bolts was kept constant to establish similar conditions across all the tests. Thus, for the same temperature and lubrication conditions, the force applied to the specimen surface would be similar in all cases. Preliminary tests were carried out to establish the most appropriate torque for each material tested, as indicated in Table 3
To reduce the frictional force in the system, solid lubricant of MoS2 with an average particle size of 6 µm was used. This lubricant has the advantages of thermal stability and low coefficient of friction (0.08–0.1) when it is properly applied to the materials under study.
This type of solid lubricant can be used at a temperature of up to 600 °C, which is an advantage over other lubricants used in previous studies, such as Vaseline, Teflon or oil. The most suitable method of application was dispersing this powder in alcohol, so that after priming, this solvent evaporated quickly, leaving a uniform layer of MoS2 adhering to the applied surfaces. This lubrication was applied to both sides of the specimen, as well as to the screws and toothed areas of the dies, reducing the frictional forces of the system as much as possible.
The specimens prepared in this way were tested up to various compression stages, after which their correct deformation without buckling in either plane of the section was checked (Figure 10a) and the strain in the central cross-section was measured. Two methods were used for these measurements to assess their accuracy. On the one hand, once the test was carried out, the specimen was measured using direct measuring systems (micrometre and calliper), which have the advantage of obtaining the measurement quickly and without preparing the specimen. Moreover, the specimens were cut in the middle and polished, to be measured later with a microscope binocular fitted with an image analysis system (Figure 10b). This latter destructive methodology implied performing numerous tests to obtain the stress-strain curve of each material.

2.3.3. Tensile Tests

In order to compare the behaviour in tension and compression, tensile tests at the same strain rate of 0.002 s1 were carried out on the same specimen type used in the compression tests.
The engineering obtained curves, σeng-eeng, were turned into true stress-strain curves, σ-εpl, using the conventional procedure expressed in Equations (6) and (7), where the gauge length of the sample after and before the deformation was L and L0, respectively. In this case, no deformations out of the gauge length of the samples took place, i.e., only homogeneous deformation appeared up to the ultimate tensile strength (UTS) or necking point. The plastic strain zone was adjusted to an appropriate function according to traditional criteria (Hollomon’s, Swift’s or Ludwik’s) for each material and extrapolated beyond the necking point (Figure 11). Thus, it was assumed that the plastic behaviour models for all materials were valid until the break point.
σ = σ e n g ( 1 + e e n g )
ε p l = ln ( 1 + e e n g ) = ln ( L L 0 )

2.3.4. Estimation of the Friction Force in the System and the Correction to be Considered in True Stress-Strain Curves

The use of the anti-buckling support introduces frictional forces into the system, which must be corrected in the experimental raw data. Kuwabara et al. neglected these frictional forces due to the use of Teflon and Vaseline as a lubricant (friction coefficient of 0.02) [7]. However, the need to use high-temperature solid lubricants (MoS2), with somewhat higher coefficients of friction, meant that the existing frictional force had to be considered.
Owing to the impossibility of accurately determining the normal force to the sheet metal due to the tightening torque of the bolts, it was necessary to estimate the friction force by means of tensile tests, similarly to the procedure proposed by Lee et al. [28] for the friction coefficient estimation. This approach consisted of performing tensile tests with the designed compression dies and under the same lubrication and clamping conditions as the compression tests. By comparing the measured forces, F F ( e ) , with the forces corresponding to the tensile test without anti-buckling support, F ( e ) , it was possible to obtain an approximate value for the average friction force of the system, F F ¯ , Equation (8). This assumption can only be made up to the UTS point, e U T S , as, after this point, the appearance of necking does not ensure a homogeneous contact and lateral pressure on the sheet metal (Figure 12a). Subtracting this value of average friction force, F F ¯ , from the experimental compression force measured by the universal test machine, F C e x p , the effective compression force of the material, F C , was obtained (Equation (9)).
F F ¯ = 0 e U T S F F ( e ) d e 0 e U T S F ( e ) d e e U T S
F C = F C e x p F F ¯
From the frictionless compression force–displacement obtained curve, the compression engineering stress-strain curve was worked out using the traditional equations, Equations (6) and (7).
For the DX52D steel analysed, Figure 12b shows the engineering compression curve after correction to remove the force component due to friction. This frictionless curve was subsequently used to perform the inverse calibration. Figure 12c shows the points obtained by the procedure of measuring cross-sections. The action of friction is also evaluated.
The simplification in the friction force computation considers a constant clamping pressure, which may not be entirely correct, because of the sheet thinning in the tensile tests as opposed to the sheet thickening during compression. This may lead to a decrease or increase in lateral pressure, respectively, which would involve a slightly different friction force between the two cases. However, the consideration applied does not significantly compromise the data accuracy, due to the low value of this force in relation to the axial compressive force and the relative elastic flexibility of the clamping system, which facilitates its adaptation to the sheet during the test. This fact is demonstrated from a relatively constant friction force obtained during the tensile test, as can be seen in Figure 12a.
The accuracy in the friction force estimation of this methodology is slightly lower than that obtained by other authors using controlled force application or force measurement systems. However, the technical simplicity of this approach to the evaluation of frictional forces facilitates its application in high-temperature tests.
Furthermore, the lateral force applied to prevent buckling also implies the existence of a biaxial stress state in the specimen. Considering a friction coefficient of between 0.08 and 0.1, due to the MoS2 lubricant, and a Coulomb friction law, the values of the applied lateral pressure for each material were estimated from the obtained friction force (Table 4). The values of the applied lateral forces and pressures are within the same range as those applied in other previous works [10]. These pressure values are quasi-constant during the whole test, so the error incurred if no biaxiality correction is applied is maximum at the beginning of the test and decreases with the strain hardening of the material. The approximate maximum error in the equivalent stress by not considering biaxial effects was estimated according to the Von Mises criterion, and in no case does it exceed 1.2%. Similar results have been obtained by Lee et al. [28], 1%, and Cao et al. [17], 1.6%. This finding proves that biaxial correction can be neglected due to the low stress value this force involves in the thickness direction with respect to the axial stress, including this factor as part of the experimental error itself. Figure 12d shows the low impact of this correction on the final compression curve in the case of DX52D steel.

3. Results

The execution of the compression tests and the subsequent measurement of the central cross-sections by direct measurement with a micrometre and a calliper enabled us to quantify the strain in both the width and thickness directions. Thus, the compression anisotropy coefficient was obtained for each material analysed (Figure 13). The anisotropy values are below 1 in all cases and differ from the tensile anisotropy coefficients indicated in Table 2.
According to the results obtained in Section 2, values below 1 favour the compression test, which suggests the proposed methodology was appropriate for all the materials analysed.
Due to the mainly uniaxial stresses and the measured compression anisotropy values, the isotropic and anisotropic material considerations made in the inverse adjustment were found to yield similar true stress-strain curves (Figure 14). There is only a slight deviation to high strains in Al 1050 and AISI 316, because of the accentuation of the triaxiality by the barrelling and its lower anisotropy coefficients. Having ensured a predominantly uniaxial behaviour during the design of the specimen, the choice of the yield criterion has very little influence. Therefore, the assumption of isotropy may be appropriate and greatly simplifies this method, as it is unnecessary to obtain prior experimental measures of anisotropy, which are also subject to relative uncertainty. It should be noted that the consideration of advanced yield models makes more sense in simulations with multi-axial loading states.
The experimental results obtained for each of the developed procedures are represented in Figure 15. The continuous curve corresponds to the compression stress-strain curve obtained by inverse adjustment. Due to the limited compressive strain applied to the specimens, the inverse modelling method could only be applied up to a certain strain value. From this point, the curve is extrapolated according to the same trend (dotted line). The tensile curve and its extrapolation based on the adjustment conducted (Figure 11) is also shown in order to compare the response of each material for the two stress states.
Finally, the white and black dots represent the results obtained with the measurement of cross-sections by means of optical systems and by direct measurement, respectively. As can be seen, a similar dispersion of dots was obtained in all cases. Only for pure titanium (Ticp2) is there a notable divergence between the trends marked by the measurements of both methods. It was proven that small errors in the optical measuring procedure influenced on the obtained results significantly. This influence was attributed to the necessity of cutting and measuring the material exactly by the central section. The barrelling phenomenon is higher for high-anisotropy materials, such as Ticp2, and consequently, an error in the section position for cutting can be relevant.

4. Discussion

The different methodologies performed present discrepancies in the final data for most of the analysed materials. As can be seen in Figure 15, there is no satisfactory coincidence between the discrete points and the curves obtained by inverse calibration. This fact is reflected in the different results obtained depending on the definition of the material in the compression test simulation. The simulation using the material definition obtained by adjusting the cross-sectional measurement points provides a significantly different response to that obtained experimentally, in contrast to the inverse adjustment (Figure 16b).
This difference indicates that the existence of measurement errors in the initial and final sections modifies the obtained curve. From Equations (3) and (4), it can be seen that, due to the double influence of the section, small errors generate notable differences in the final true stress- strain curve. The error between the procedures is more notable in the case of TRIP 690, AISI 316 and Ticp2. Strain errors are more significant if the hardening index of the material is greater, as they modify the corresponding stress in a more important way; i.e., the higher the hardening slope of the plastic curve, the greater the divergence of the true stress-strain curve.
This phenomenon is illustrated in Figure 17 for two examples of stress-strain curves with different hardening coefficients. A higher “n” parameter significantly affects the dispersion of obtained points due to the measurement error, and consequently, the obtaining of the compression curve by adjusting these points is subject to greater uncertainty.
Therefore, considering the curve obtained by the inverse modelling method as the real compression curve, the error probably made in the measurement of the sections causing the deviation was calculated. Assuming that any error is due to the final measurement and not to the previous experimental procedure, an average error of about 3% was obtained (Figure 18a). This value is within the range of the experimental and measurement uncertainty of the instruments used. In the case of direct measurement (black dots), if the error is transferred completely to the measurement of the final thickness, as it is the most sensitive measurement due to its dimension, an approximate measurement deviation of 0.02 mm is obtained (Figure 18b). This value is close to the sensitivity of the instrument used. Therefore, the accuracy of the measuring systems is the bottleneck in obtaining the true stress-strain curve by measuring cross-sections. For this reason, unless more precise measurement systems are available, this procedure should be ruled out for obtaining true stress-strain curves in future works.
The compression anisotropy coefficients, set out in Figure 13, were recalculated considering these errors in thickness measurement, obtaining certain variations in the values (Figure 19). This case would correspond to the most extreme case, in which the entire experimental error corresponds to the measurement of the thickness strain. The differences between the coefficient of anisotropy in traction and compression continue to exist in the cases of Ticp2, AISI 316, Al 1050 and Ti6Al4V. In DX52D and TRIP 690 steels, however, these differences are not notable. Steglich et al. [6] and Zhou et al. [19] observed significant differences between the tensile and compressive anisotropy coefficients for magnesium alloys. They attributed this phenomenon to the material texture induced in rolling and the mechanisms of the hcp crystallographic structure for being deformed. It is difficult for the structure to suffer deformation in one direction or another depending on the load applied. This may coincide with the observations made, as the materials with the greatest difference in anisotropy coefficients have structures, fcc [27] and hcp [29], with similar deformation mechanisms, such as twinning. However, the analysis of this phenomenon would require a more in-depth study.
Using the tensile and compression stress curve obtained by inverse calibration, it was possible to identify the asymmetric behaviour in the materials analysed. In the case of DX52D steel, a slight increase in compressive stress was observed (Figure 15a). Kuwabara et al. [30] and Maeda et al. [10] identified strength differential effects (SDE) in interstitial-free and dual-phase steels, respectively, which attribute the influence of the hydrostatic stress component to the movement of dislocations. However, in the case of this steel, Martínez et al. obtained a perfectly symmetrical behaviour [3], so this difference can be attributed to the experimental variability itself and to the higher range of initial yield in tension. Figure 20a compares both compression curves and shows a perfect match. In the case of TRIP 690 steel, there is further agreement with the results of these authors, because, as they are highly isotropic materials, the behaviour is the same in all directions (Figure 20b). The asymmetry in the case of TRIP 690 (Figure 15d) is attributed to the effects of the stress system on the plasticity-induced transformation mechanisms. Therefore, as the results are the same as those obtained by other authors, the methodology applied can be considered validated.
In the case of pure grade 2 titanium (Ticp2), there is significant tensile-compression asymmetry as the plastic strain increases (Figure 15e). This was compared with the results obtained by Baral et al. [31] and Nixon et al. [26] (Figure 20c,d), observing similar asymmetric behaviour in all cases. The difference in stress values in the various studies is due to the influence of small traces of interstitial elements, such as oxygen, nitrogen or carbon, on the mechanical strength of pure titanium [32,33]. The complex asymmetric behaviour of titanium has been analysed in numerous previous works, identifying up to three deformation stages in titanium according to the dominant deformation mechanisms. Initially, the mode of deformation is by slip, so there is no asymmetry. When the deformation increases, twinning is also activated and the existence of different twinning mechanisms in tension and compression causes asymmetry in these stages [34]. The polarity in the twinning activation mainly contributes to the change in texture and significantly influences the strain-hardening behaviour due to the crystallographic reorientation [29], the Hall-Petch effect due to the grain subdivision, and the Basinski hardening mechanism [35]. Furthermore, Nixon et al. indicated that this asymmetry is highly dependent on direction being considered with respect to the rolling direction [26]. This anisotropic behaviour is due to the strong crystallographic anisotropy of the hcp structure and the strong basal texture induced in the previous raw processes. However, the asymmetric behaviour is very slight in the case of Ti6Al4V (Figure 15f), which can be attributed to the mixed structure. This result contrasts with the bigger tension-compression difference obtained by other authors for this alloy. Tuninetti et al. detected differences of 5–10% in the tensile-compression behaviour of an ingot of this alloy [36]. Gilles et al. observed that, in the case of sheet metal, this asymmetry is highly dependent on the considered direction, being somewhat more symmetrical in the rolling direction [9]. Khan et al. obtained a similar T-C behaviour in the transverse direction. However, few studies have reported conclusive findings [37].
Finally, significant asymmetric behaviour was also obtained in the cases of Al 1050 and AISI 316 (Figure 15b,c, respectively). No previous references were found for these materials. However, in the case of AISI 316, this effect may be due to two factors: The deformation-induced transformation of this material, as in the case of TRIP 690, and the existence of twinning mechanisms in the crystallographic structure of fcc [27]. Kuwabara et al., obtained asymmetric behaviour in another austenitic stainless steel, SUS304, which they attributed to the directionality of the dislocated structures and their rearrangement during reloading [7]. In the same work, Kuwabara et al. did not detect any SDE in AA6016-T4 aluminium alloy. However, Holmen et al., did observe traction-compression asymmetry in several 6XXX series aluminium alloys depending on the ageing treatments applied, indicating the effect of hydrostatic pressure on the movement of dislocations as a probable cause [38]. Therefore, no clear conclusion can be drawn as to reasons for SDE detected in Al 1050 (Figure 15b). In future work, texture analysis by EBSD (electron backscatter diffraction) will be required to establish the origin of the behaviour of both materials.
Definitely, and in spite of some complexity in the numerical results analysis exists, the approach is relatively simple as the hard equipment needed is only a conventional tensile test machine, which avoids the use of complex devices such as those proposed by other authors. This represents practical implications as the compression tests of sheet metals can be carried out without expensive media.

5. Conclusions

This works develops a technologically simple equipment and methodology, suitable for carrying out compression tests in a wide range of temperatures, up to 750 °C. These values are not addressed for sheet metal compression in any previous work. Furthermore, by means of this system, strains close to 0.3 were achieved, higher than those obtained in previous papers about sheet metal compression with the application of loads in the main plane of the sheet. The test equipment and procedure are adaptable to a conventional tensile test machine, which avoids the use of complex devices such as those existing in literature. This aspect is one of the most remarkable advantage of the approach established herein.
By using FEM simulations, the geometry of the compression test specimen was designed and the methodologies for obtaining the compression behaviour of most existing materials were validated. Only in the case of materials with high compression anisotropy coefficients (greater than 3) should the specimen be redesigned, or correction coefficients be applied. None of the materials analysed are in this condition.
Of the two methods used to obtain the true stress-strain curve, the semi-experimental method based on inverse iterative calibration yielded the best results. Nevertheless, this procedure has the disadvantage of requiring computational tools along with the experimental ones. The procedure for cross-sectional measurements, although proven to be valid in previous simulations, was experimentally limited by the measurement uncertainty of the procedure and instruments used. This error, depending on the material analysed, might have caused a significant deviation in the stress-strain curve obtained with respect to the real one.
In this way, by means of inverse calibration, the existence of asymmetric behaviour in the tensile and compression stress-strain curves of the materials analysed was determined. Emphasis is placed on the importance of considering this phenomenon in modelling the mechanical behaviour of Ticp2, AISI 316, TRIP 690 and Al 1050. In some of these materials, significant variations in the anisotropy coefficients as a function of stress direction were observed, a phenomenon previously reported by a small number of authors.
Therefore, in view of the results achieved in this work, the authors consider that the proposed compression test can be fully validated, and its sensitivity to detect characteristic deformation phenomena is demonstrated. The performance of tests in a wide range of temperatures and strain rates in subsequent works will allow possible asymmetric behaviours to be evaluated. This will allow a better selection and definition of the necessary plastic behaviour models for hot sheet forming simulations of complex processes, such as deep-drawing or single point incremental forming (SPIF).

Author Contributions

Conceptualization, V.M. and A.M.-M.; data curation, J.A.; formal analysis, J.A., V.M. and A.M.-M.; funding acquisition, V.M.; investigation, J.A., V.M., A.M.-M, J.C. and J.A.N.; methodology, J.A., V.M. and A.M.-M.; project administration, V.M.; resources, V.M., A.M.-M., J.C. and J.A.N.; software, J.A. and J.A.N.; supervision, V.M. and A.M.-M.; validation, J.A., V.M. and A.M.-M.; visualization, J.A. and J.A.N.; writing—original draft, J.A., valentín miguel, A.M.-M. and J.C.; writing—review & editing, J.A., V.M. and A.M.-M. All authors have read and agreed to the published version of the manuscript.

Funding

This work has been conducted thanks to the National Research Plan’s financial support promoted by the Spanish Ministry of Science and Innovation and FEDER funds (Project MAT2013-46386-P).

Conflicts of Interest

The authors declare no conflict of interest.

Notation

ε p l true plastic strain
ε 0 prior strain
ε ¯ p l i s i m average simulated plastic strain for a strain point i
σ true stress
σ h hydrostatic stress
σ e q equivalent stress
σ i n + 1 estimated true stress for n+1 iteration for a strain point i
σ i n estimated true stress in the current iteration for a strain point i
σ e n g engineering stress
σ e n g i e x p experimental reference stress for the inverse adjustment for a strain point i
σ e n g i s i m engineering stress obtained in the simulation for a strain point i
Ddiameter of the hole for the clamping screws
e e n g engineering strain
e U T S engineering strain in ultimate tensile strength (UTS)
F F ¯ average friction force
F c effective compression force
F c e x p experimental measured compression force (with friction)
F F ( e ) tensile test force with anti-buckling support
F ( e ) tensile test force
Kstrength coefficient
Rtransition radius to the width of the test samples heads
Llength of the gauge area after deformation
L 0 gauge/initial length
Lhspecimen head width
nstrain hardening index
rnormal anisotropy value or Lankford index
Scross-section of the deformed sample
S 0 initial cross-section of the sample
T σ triaxiality parameter
W 0 initial width
Whspecimen head length
Ls, Wsposition of the screw hole

References

  1. Nixon, M.E.; Lebenshon, R.A.; Cazacu, O.; Liu, C. Experimental and finite-element analysis of the anisotropic response of high-purity x-titanium in bending. Acta Mater. 2010, 58, 5759–5767. [Google Scholar] [CrossRef]
  2. Noma, N.; Hashimoto, K.; Maeda, T.; Kuwabara, T. High accuracy springback simulation by using material model considering the SD effect. Iop Conf. Ser. J. Phys. Conf. Ser. 2018, 1063, 012096. [Google Scholar] [CrossRef]
  3. Martínez, A.; Miguel, V.; Coello, J.; Manjabacas, M.C. Determining stress distribution by tension and by compression applied to steel: Special analysis for TRIP steel sheets. Mater. Des. 2017, 125, 11–25. [Google Scholar] [CrossRef]
  4. Graf, M.; Henseler, T.; Ulmann, M.; Kawalla, R.; Prahl, U.; Awiszus, B. Study on determination of flow behavior of 6060-aluminium and AZ31-magnesium thin sheet by means of stacked compression test. Iop Conf. Ser. Mater. Sci. Ing. 2019, 480, 012023. [Google Scholar] [CrossRef]
  5. Merklein, M.; Kuppert, A. A method for the layer compression test considering the anisotropic material behavior. Int. J. Mater. 2009, 2, 483–486. [Google Scholar] [CrossRef]
  6. Steglich, D.; Tian, X.; Bohlen, J.; Kuwabara, T. Mechanical testing of thin sheet magnesium alloys in biaxial tension and uniaxial compression. Exp. Mech. 2014, 54, 1247–1258. [Google Scholar] [CrossRef]
  7. Kuwabara, T.; Kumano, Y.; Ziegelheim, J.; Kurosaki, I. Tension-compression asymmetry of phosphor bronze for electronic parts and its effect on bending behavior. Int. J. Plast. 2009, 25, 1759–1776. [Google Scholar] [CrossRef]
  8. Kuwabara, T.; Saito, R.; Hirano, T.; Oohashi, N. Difference in Tensile and Compressive Flow Stresses in Austenitic Stainless Steel Alloys and Its Effect on Springback Behavior. Int. J. Mater. 2009, 2, 499–502. [Google Scholar] [CrossRef]
  9. Gilles, G.; Hammami, W.; Libertiaux, V.; Cazacu, O.; Yoon, J.H.; Kuwabara, T.; Habraken, A.M.; Duchene, L. Experimental characterization and elasto-plastic modelling of the quasi-static mechanical response of TA-6V at room temperature. Int. J. Solids Struct. 2011, 48, 1277–1289. [Google Scholar] [CrossRef] [Green Version]
  10. Maeda, T.; Noma, N.; Kuwabara, T.; Barlat, F.; Korkolis, Y.P. Measurement of the strength differential effect of DP980 steel sheet and experimental validation using pure bending test. J. Mater. Process. Technol. 2018, 256, 247–253. [Google Scholar] [CrossRef]
  11. Hama, T.; Nagao, H.; Kobuki, A.; Fujimoto, H.; Takuda, H. Work-hardening and twinning behaviors in a commercially pure titanium sheet under various loading paths. Mater. Sci. Eng. 2015, 620, 390–398. [Google Scholar] [CrossRef] [Green Version]
  12. Boger, R.K.; Wagoner, R.H.; Barlat, F.; Lee, M.G.; Chung, K. Continuous, large strain, tension/compression testing of sheet material. Int. J. Plast. 2005, 21, 2319–2343. [Google Scholar] [CrossRef]
  13. Bae, G.H.; Hub, H. Tension/compression test of auto-body steel sheets with the variation of the pre-strain and the strain rate. Trans. Eng. Sci. 2011, 72, 213–225. [Google Scholar]
  14. Joo, G.; Huh, H.; Choi, M.K. Tension/compression hardening behaviors of auto-body steel sheets at intermediate strain rates. Int. J. Mech. Sci. 2016, 108–109, 174–187. [Google Scholar]
  15. Joo, G.; Huh, H. Rate-dependent isotropic-kinematic hardening model in tension-compression of TRIP and TWIP steel sheets. Int. J. Mech. Sci. 2018, 146–147, 432–444. [Google Scholar] [CrossRef]
  16. Hartel, M.; Illgen, C.; Bruder, E.; Frint, P.; Wagner, M.F.X. Microstructural evolution during uniaxial tension-compression in-plane deformation of an IF steel. Mat. Sci. Eng. 2019, 744, 652–660. [Google Scholar] [CrossRef]
  17. Cao, J.; Lee, W.; Cheng, H.S.; Seniw, M.; Wang, H.P.; Chung, K. Experimental and numerical investigation of combined isotropic-kinematic hardening behavior of sheet metals. Int. J. Plast. 2009, 25, 942–972. [Google Scholar] [CrossRef]
  18. Yoshida, F.; Uemori, T.; Fujiwara, K. Elastic-plastic behavior of steel sheets under in-plane cyclic tension-compression at large strain. Int. J. Plast. 2002, 18, 633–659. [Google Scholar] [CrossRef]
  19. Zhou, P.; Beeh, E.; Friedrich, H.E. Influence of tension-compression asymmetry on the mechanical behavior of AZ31B magnesium alloy sheets in bending. J. Mater. Eng. Perform. 2016, 25, 853–865. [Google Scholar] [CrossRef] [Green Version]
  20. Piao, K.; Lee, J.K.; Kim, J.H.; Kim, H.Y.; Chung, K.; Barlat, F.; Wagoner, R.H. A sheet tension/compression test for elevated temperature. Int. J. Plast. 2012, 38, 27–46. [Google Scholar] [CrossRef]
  21. Lee, M.G.; Kim, J.H.; Kim, D.; Seo, O.S.; Nguyen, N.T.; Kim, H.Y. Anisotropic hardening of sheet metal at elevated temperature: Tension-compressions test development and validation. Exp. Mech. 2013, 53, 1039–1055. [Google Scholar] [CrossRef]
  22. Odenberger, E.L.; Hertzman, J.; Thilderkvist, P.; Merklein, M.; Kuppert, A.; Stöhr, T.; Lechler, J.; Oldenburg, M. Thermo-mechanical sheet metal forming of aero engine components in Ti-6Al-4V-PART 1: Material characterisation. Int. J. Mater. 2013, 6, 391–402. [Google Scholar] [CrossRef]
  23. Noma, N.; Kuwabara, T. Specimen geometry optimization for in-plane reverse loading test of sheet metal and experimental validation. Steel Res. Int. 2012, 2012, 1283–1286. [Google Scholar]
  24. Zhao, K.; Wang, L.; Chang, Y.; Yan, J. Identification of post-necking stress-strain curve for sheet metals by inverse method. Mech. Mater. 2016, 92, 107–118. [Google Scholar] [CrossRef]
  25. Aydin, M.S.; Gerlach, J.; Kessler, L.; Tekkaya, A.E. Yield locus evolution and constitutive parameter identification using plane strain tension and tensile tests. J. Mat. Process. Technol. 2011, 211, 1957–1964. [Google Scholar] [CrossRef]
  26. Nixon, M.E.; Cazacu, O.; Lebensohn, R.A. Anisotropic response of high-purity x-titanium: Experimental characterization and constitutive modelling. Int. J. Plast. 2010, 26, 516–532. [Google Scholar] [CrossRef]
  27. Asgari, S.; El-Danaf, E.; Kalidindi, S.R.; Doherty, R.D. Strain hardening regimes and microstructural evolution during large strain compression of low stacking fault energy fcc alloys that form deformation twins. Met. Mat. Trans. A 1997, 28, 1781–1795. [Google Scholar] [CrossRef]
  28. Lee, M.G.; Kim, D.; Kim, C.; Wenner, M.L.; Wagoner, R.H.; Chung, K. Spring-back evaluation of automotive sheets based on isotropic-kinematic hardening laws and non-quadratic anisotropic yield functions. Part II: Characterization of material properties. Int. J. Plast. 2005, 21, 883–914. [Google Scholar]
  29. Tirry, W.; Nixon, M.; Cazacu, O.; Coghe, F.; Rabet, L. The importance of secondary and ternary twinning in compressed Ti. Scr. Mater. 2011, 64, 840–843. [Google Scholar] [CrossRef]
  30. Kuwabara, T.; Kuroda, M.; Hiwatashi, S.; Yoshida, H. Strength-differential effect in dual-phase and interstitial-free steel sheets. In Proceedings of the 9th International Symposium on Plasticity and Its Current Applications, Aruba, 2002; Khan, A.S., Ed.; Neat Press: Fulton, MD, USA, 2002; p. 325. [Google Scholar]
  31. Baral, M.; Hama, T.; Knudsen, E.; Korkolis, Y.P. Plastic deformation of commercially-pure titanium: Experiments and modelling. Int. J. Plast. 2018, 105, 164–194. [Google Scholar] [CrossRef]
  32. Lampman, S. Wrought titanium and titanium alloys. In ASM Handbook Volume 2, Properties and Selection: Nonferrous Alloys and Special-Purpose Materials, 10th ed.; ASM International: Cleveland, OH, USA, 1990; pp. 592–633. [Google Scholar]
  33. Yi, N.; Hama, T.; Kobuki, A.; Fujimoto, H.; Takuda, H. Anisotropic deformation behavior under various strain paths in commercially pure titanium Grade 1 and Grade 2 sheets. Mater. Sci. Eng. A 2016, 655, 70–85. [Google Scholar] [CrossRef] [Green Version]
  34. Knezevic, M.; Lebensohn, R.A.; Cazacu, O.; Revil-Baudard, B.; Proust, G.; Vogel, S.C.; Nixon, M.E. Modeling bending of x-titanium with embedded polycrystal plasticity in implicit finite elements. Mater. Sci. Eng. A 2013, 564, 116–126. [Google Scholar] [CrossRef]
  35. Salem, A.A.; Kalidindi, S.R.; Doherty, R.D.; Semiatin, S.L. Strain hardening due to deformation twinning in x-titanium: Mechanisms. Met. Mater. Tran. A 2006, 37A, 259–268. [Google Scholar] [CrossRef]
  36. Tuninetti, V.; Gilles, G.; Milis, O.; Pardoen, T.; Habraken, A.M. Anisotropy and tension-compression asymmetry modeling of the room temperature plastic response of Ti-6Al-4V. Int. J. Plast. 2015, 67, 53–68. [Google Scholar] [CrossRef]
  37. Khan, A.S.; Kazmi, R.; Farrokh, B. Multiaxial and non-proportinal loading responses, anisotropy and modeling of Ti-6Al-4V titanium alloy over wide ranges of strain rates and temperatures. Int. J. Plast. 2007, 23, 931–950. [Google Scholar] [CrossRef]
  38. Holmen, J.K.; Frodal, B.H.; Hopperstad, O.S.; Borvik, T. Strength differential effect in age hardened aluminum alloys. Int. J. Plast. 2017, 99, 144–161. [Google Scholar] [CrossRef]
Figure 1. (a) Schematic of the assembly for compression tests. (b) Initial and final stages of operation.
Metals 10 01374 g001
Figure 2. (a) Diagram of the compression test specimen used. (b) Mesh used in FEM simulations.
Metals 10 01374 g002
Figure 3. Influence of fillet radii on specimen behaviour. (a,b) Plastic strain. (c,d) Triaxiality.
Metals 10 01374 g003
Figure 4. Distribution of the triaxiality parameter on each of the simulated samples ( ε p l = 0.09 ) .
Metals 10 01374 g004
Figure 5. Mean triaxiality in the central zone during deformation.
Metals 10 01374 g005
Figure 6. (a) Influence of anisotropy on the triaxiality of the central zone. (b) Influence of hardening on the triaxiality of the central zone.
Metals 10 01374 g006
Figure 7. Validation of the central cross-section measurement methodology by simulation. (a) Variation in hardening parameter “n”. (b) Variation in normal anisotropy “r”.
Metals 10 01374 g007
Figure 8. Strains measured (simulations and experimental tests) vs theoretical strains according to the use of the apparent curve procedure.
Metals 10 01374 g008
Figure 9. Iterative procedure to obtain the Ticp2 stress-strain curve. (a) True stress-strain curve in each iteration. (b) Engineering curve in each iteration.
Metals 10 01374 g009
Figure 10. (a) Ticp2 specimens before and after the compression test. (b) Measured central cross-sections.
Metals 10 01374 g010
Figure 11. Tensile true stress-true strain curves obtained and extrapolation.
Metals 10 01374 g011
Figure 12. DX52D steel. (a) Estimation of the average friction force. (b) Compressive response with and without correction of the friction. (c) Friction correction of points obtained by cross-section measurement. (d) Results obtained by biaxial correction.
Metals 10 01374 g012
Figure 13. Compressive anisotropy values for the analysed materials. Experimental measure.
Metals 10 01374 g013
Figure 14. Influence of considering isotropy or anisotropy in the determination of the stress-strain curve by inverse calibration.
Metals 10 01374 g014
Figure 15. Compression test results. (a) DX52D. (b) Al 1050. (c) AISI 316. (d) TRIP 690. (e) Ticp2. (f) Ti6Al4V.
Metals 10 01374 g015
Figure 16. (a) Compression true stress-strain curves obtained with both methodologies. (b) Compression simulations response.
Metals 10 01374 g016
Figure 17. Influence of the hardening index, n, on the error dispersion of a measured compression curve.
Metals 10 01374 g017
Figure 18. (a) Error dispersion in section measurement. (b) Error transferred to thickness measurement.
Metals 10 01374 g018
Figure 19. Compressive anisotropy values for the analysed materials. Measures after thickness correction.
Metals 10 01374 g019
Figure 20. Comparison of compression results with other authors. (a) DX52D Martínez et al. (2017). (b) TRIP690 Martínez et al. (2017). (c) Ticp Baral et al. (2018). (d) Ticp Nixon et al. (2010b).
Metals 10 01374 g020
Table 1. Final dimensions of the compression test specimens used.
Dimension (mm) L0W0RDLhLsWhWs
Test specimen301581042.5203517.5
Short test specimen201081047.5203517.5
Table 2. Main properties of the analysed materials.
MaterialThickness (mm)Crystallographic Structure Tensile   Elastic   Limit ,   σ 0.2   ( MPa ) Rolling DirectionAnisotropyDeformation Characteristics
Ti6Al4V
(Hot-rolled and annealed to 760 °C)
0.8Hcp + Bcc102790°1.34Possible asymmetry t-c by hcp
Ticp2
(Cold-rolled)
0.81Hcp2824.27Asymmetry t-c by hcp.
Highly anisotropic
AISI 316
(Annealed)
0.8Fcc3070.61Strain-induced martensitic transformation
Al 10500.975Fcc1630.87
TRIP 690 + EBT
(Zinc-coated)
1Bcc + Fcc4460.89Strain-induced martensitic transformation
DX52C + Z
(Hot did galvanised)
0.8Bcc29990°1.00Isotropic
Table 3. Tightening torque of the screws for each material.
MaterialScrews for Tightening on HeadsAuxiliary Lateral Screws
Ti6Al4V40 Nm5 Nm
Ticp225 Nm5 Nm
AISI 31620 Nm5 Nm
Al 105020 Nm5 Nm
TRIP 69025 Nm5 Nm
DX52C20 Nm5 Nm
Table 4. Lateral pressure applied on each material. Approximate error incurred if biaxial correction is not considered.
MaterialFFriction
(N)
Blank-Holding Pressure
(MPa)
Compression   Yield   Stress ,   σ 0.2   ( MPa ) %   Max .   Biaxiality   Error   σ e q V M
Ti6Al4V3044.2–3.49300.2–0.2
Ticp21662.3–1.82670.4–0.3
AISI 3163454.8–3.82431.0–0.8
Al 10502823.9–3.11571.2–1.0
TRIP 6904366.1–4.84000.7–0.6
DX52C3645.1–4.02880.9–0.7
Publisher’s Note: MDPI stays neutral with regard to jurisdictional claims in published maps and institutional affiliations.

