Article

Insight into the Role and Mechanism of Nano MgO on the Hot Compressive Deformation Behavior of Mg-Zn-Ca Alloys

1
School of Materials Science and Engineering, Tianjin University of Technology, Tianjin 300384, China
2
Key Laboratory of Display Materials and Photoelectric Device (Ministry of Education), Tianjin 300384, China
*
Author to whom correspondence should be addressed.
Metals 2020, 10(10), 1357; https://doi.org/10.3390/met10101357
Submission received: 7 September 2020 / Revised: 5 October 2020 / Accepted: 8 October 2020 / Published: 12 October 2020

Abstract

:
Aiming to investigate the role and mechanism of nano MgO on the hot compressive deformation behavior of Mg alloys, the Mg-3Zn-0.2Ca alloy (MZC, in wt%) and the 0.2MgO/Mg-3Zn-0.2Ca alloy (MZCM, in wt%) were investigated systematically in the temperature range of 523–673 K and the strain rate range of 0.001–1 s−1. MZCM shows finer grains and second phase because of the refinement effects of added MgO. Flow behavior analysis shows that the addition of nano MgO promotes the dynamic recrystallization (DRX) of MZC. The flow stress of MZCM is lower than that of MZC during deformation at 523–623 K but exhibits a reverse trend at 673 K and 0.1–1 s−1. The constitutive analysis indicates that dislocation climb is the dominant deformation mechanism for MZC and MZCM. The addition of nano MgO particles decreases the stress sensitivity and deformation resistance for thermal deformation and improves the plasticity of the MZC. Besides, according to the processing map constructed at strains of 0.7 and corresponding microstructure evolution, MZCM exhibits higher power dissipation efficiency and smaller instability regions than MZC, and the optimum hot working condition for MZCM was determined to be at 623–653 K and 0.01–0.001 s−1.

1. Introduction

Research on magnesium (Mg) and its alloys as biodegradable implants has grown for years due to their biodegradability, biocompatibility and moderate mechanical properties close to those of bone [1]. Aiming to further improve the bioactivity and mechanical properties of Mg alloys [2], Mg-matrix composites (MMCs) have been studied in the last decade. These materials use micro or nano-sized ceramic particles as reinforcements, such as calcium phosphate particles (CPP) [3], hydroxyapatite (HA) [4], tricalcium phosphate (β-TCP) [5], ZrO2 [6], Al2O3 [7], ZnO [8] and TiB2 [9], which improve the yield strength (YS) and utimate tensile strength (UTS) of Mg alloys. However, these enforcement particles have disadvantages of serious aggregation and nonuniform distribution, and a poor interface between the particles and magnesium matrix, leading to the deterioration in mechanical properties. Additionally, the aforementioned ceramic particles are stable in the inner physiological environment, which forms nondegradable residues in vivo when used as enforcement in MMC implants.
Due to their small intrinsic flaws and good MgO/Mg interfacial bonding [10], MgO nanoparticles became one of the most promising reinforcement for MMCs. Our previous research [11] shows that the orientation relationships of (111)MgO ~2.62° from (0002)α-Mg and [0-11]MgO//[2-1-10]α-Mg were observed at the interface of Mg/MgO, which verified the excellent interfacial bonding, resulting in a compatible deformation in MMCs. Thus, the mechanical properties of MgO-added MMCs are dramatically enhanced. Furthermore, the addition of MgO forms a dense protective film to achieve uniform corrosion of the composites, which benefits to improve the corrosion resistance of MMCs to meet the corresponding benchmark of biodegradable implants (corrosion rate < 0.5 mm/y) [12]. Moreover, as a homologous substance to the Mg matrix, MgO can transfer to water-soluble MgCl2 completely in a chloridion-rich physiological environment, which avoids the formation of nondegradable residues.
Importantly, as MMCs have poor workability at room temperature due to the aggregation of ceramic particles, hot working is an effective method to refine grains and break up ceramic particles in MMCs [13], which enhances the plasticity of them dramatically. Xiao et al. [14] studied the hot deformation behavior of in-situ nano-sized TiB2/AZ91 composite by analyzing the constitutive equation, hot processing maps and microstructure evolution, revealing that the in-situ nano-sized TiB2 particles increase the deformation resistance of AZ91 during thermal deformation. Therefore, an effective way to investigate the hot deformation behavior and identify the optimum hot processing parameters is by developing hot processing maps [15,16] and constitutive equations [17]. However, the current corresponding research on MMCs is not systematic enough, and no research has investigated the effect of MgO nanoparticles on the hot deformation process of Mg alloys yet. Therefore, more in-depth investigations must be done in the future.
Based on our previous work [11], research on xMgO/Mg-3Zn-0.2Ca (x = 0.1, 0.2, 0.3, 0.5 wt%) composites shows that the 0.2MgO/Mg-3Zn-0.2Ca composite exhibited the most favorable comprehensive properties. The addition of nano MgO particles improves the strength of alloy but results in no significant difference in plasticity. Therefore, the present study investigates the hot deformation behavior of Mg-3Zn-0.2Ca and 0.2MgO/Mg-3Zn-0.2Ca through constitutive analysis and processing maps by running hot compression tests under a wide range of compressive temperatures and strain rate range. Meanwhile, microstructural evolution and deformation mechanisms were systematically analyzed. This study aims to understand the effects of nano MgO in plastic deformation and obtain the optimal processing parameters to optimize its mechanical properties, providing a guideline for post-processing and lay a foundation for clinical application.

2. Materials and Methods

Pure Mg (99.99%) ingot, pure Zn (99.99%) particles (Ke Wei company of Tianjin University Co. Ltd., Tianjin, China), Mg-Ca master alloy (with 25 wt% Ca) and MgO nanoparticles (obtained by Biomaterial Lab, Tianjin, China) were used as raw materials to prepare the Mg-3Zn-0.2Ca alloy (MZC) and the 0.2MgO/Mg-3Zn-0.2Ca composite (MZCM); the chemical composition of the MZC and MZCM are summarized in Table 1. Raw materials were melted in an electric furnace under a mixed protection atmosphere of 99.6% N2 and 0.4% SF6 at 720 °C, and then, MgO nanoparticles were added into the melted MZC. A high shear stirring unit (developed by BCAST, Brunel University, London) [18] was employed to disperse the MgO nanoparticles with a mandatory infiltration stirring rate as 3500 rpm for 5 min, and then the melt was cast in a cold steel mold at 690 °C. Afterwards, the cast ingots were subjected to homogenizing annealing at 420 °C for 13 h.
The homogenized ingots were machined into cylindrical specimens with a diameter of 10 mm and a height of 15 mm for hot compression tests. The hot compression tests were performed on a Gleeble 1500 thermal simulation test machine (DSI Inc., Saint Paul, MN, USA) under the protection of argon. The samples were heated to the test temperature at a rate of 10 °C/s and held for 1 min. Afterwards, the specimens suffered a hot compression under a temperature range from 523 to 673 K and a strain rate from 0.001 to 1 s−1, and stopped when the true strain reached 0.7. Finally, the specimens were quenched in water immediately. The stress-strain curves during the deformation process were recorded. Observation of the microstructure of as-cast specimens and compression specimens after chemical polishing and corrosion was performed using an optical microscope (OM) (OLYMPUS Inc., Tokyo, Japan) and a scanning electron microscope (SEM) (FEI Inc., Hillsboro, OR, USA). The chemical compositions of different phases were analyzed by the SEM equipped with energy dispersive X-ray spectroscopy (EDS). The dynamic recrystallization (DRX) fractions of the samples were calculated by ImageJ software (FEI Inc., Hillsboro, OR, USA).

3. Results

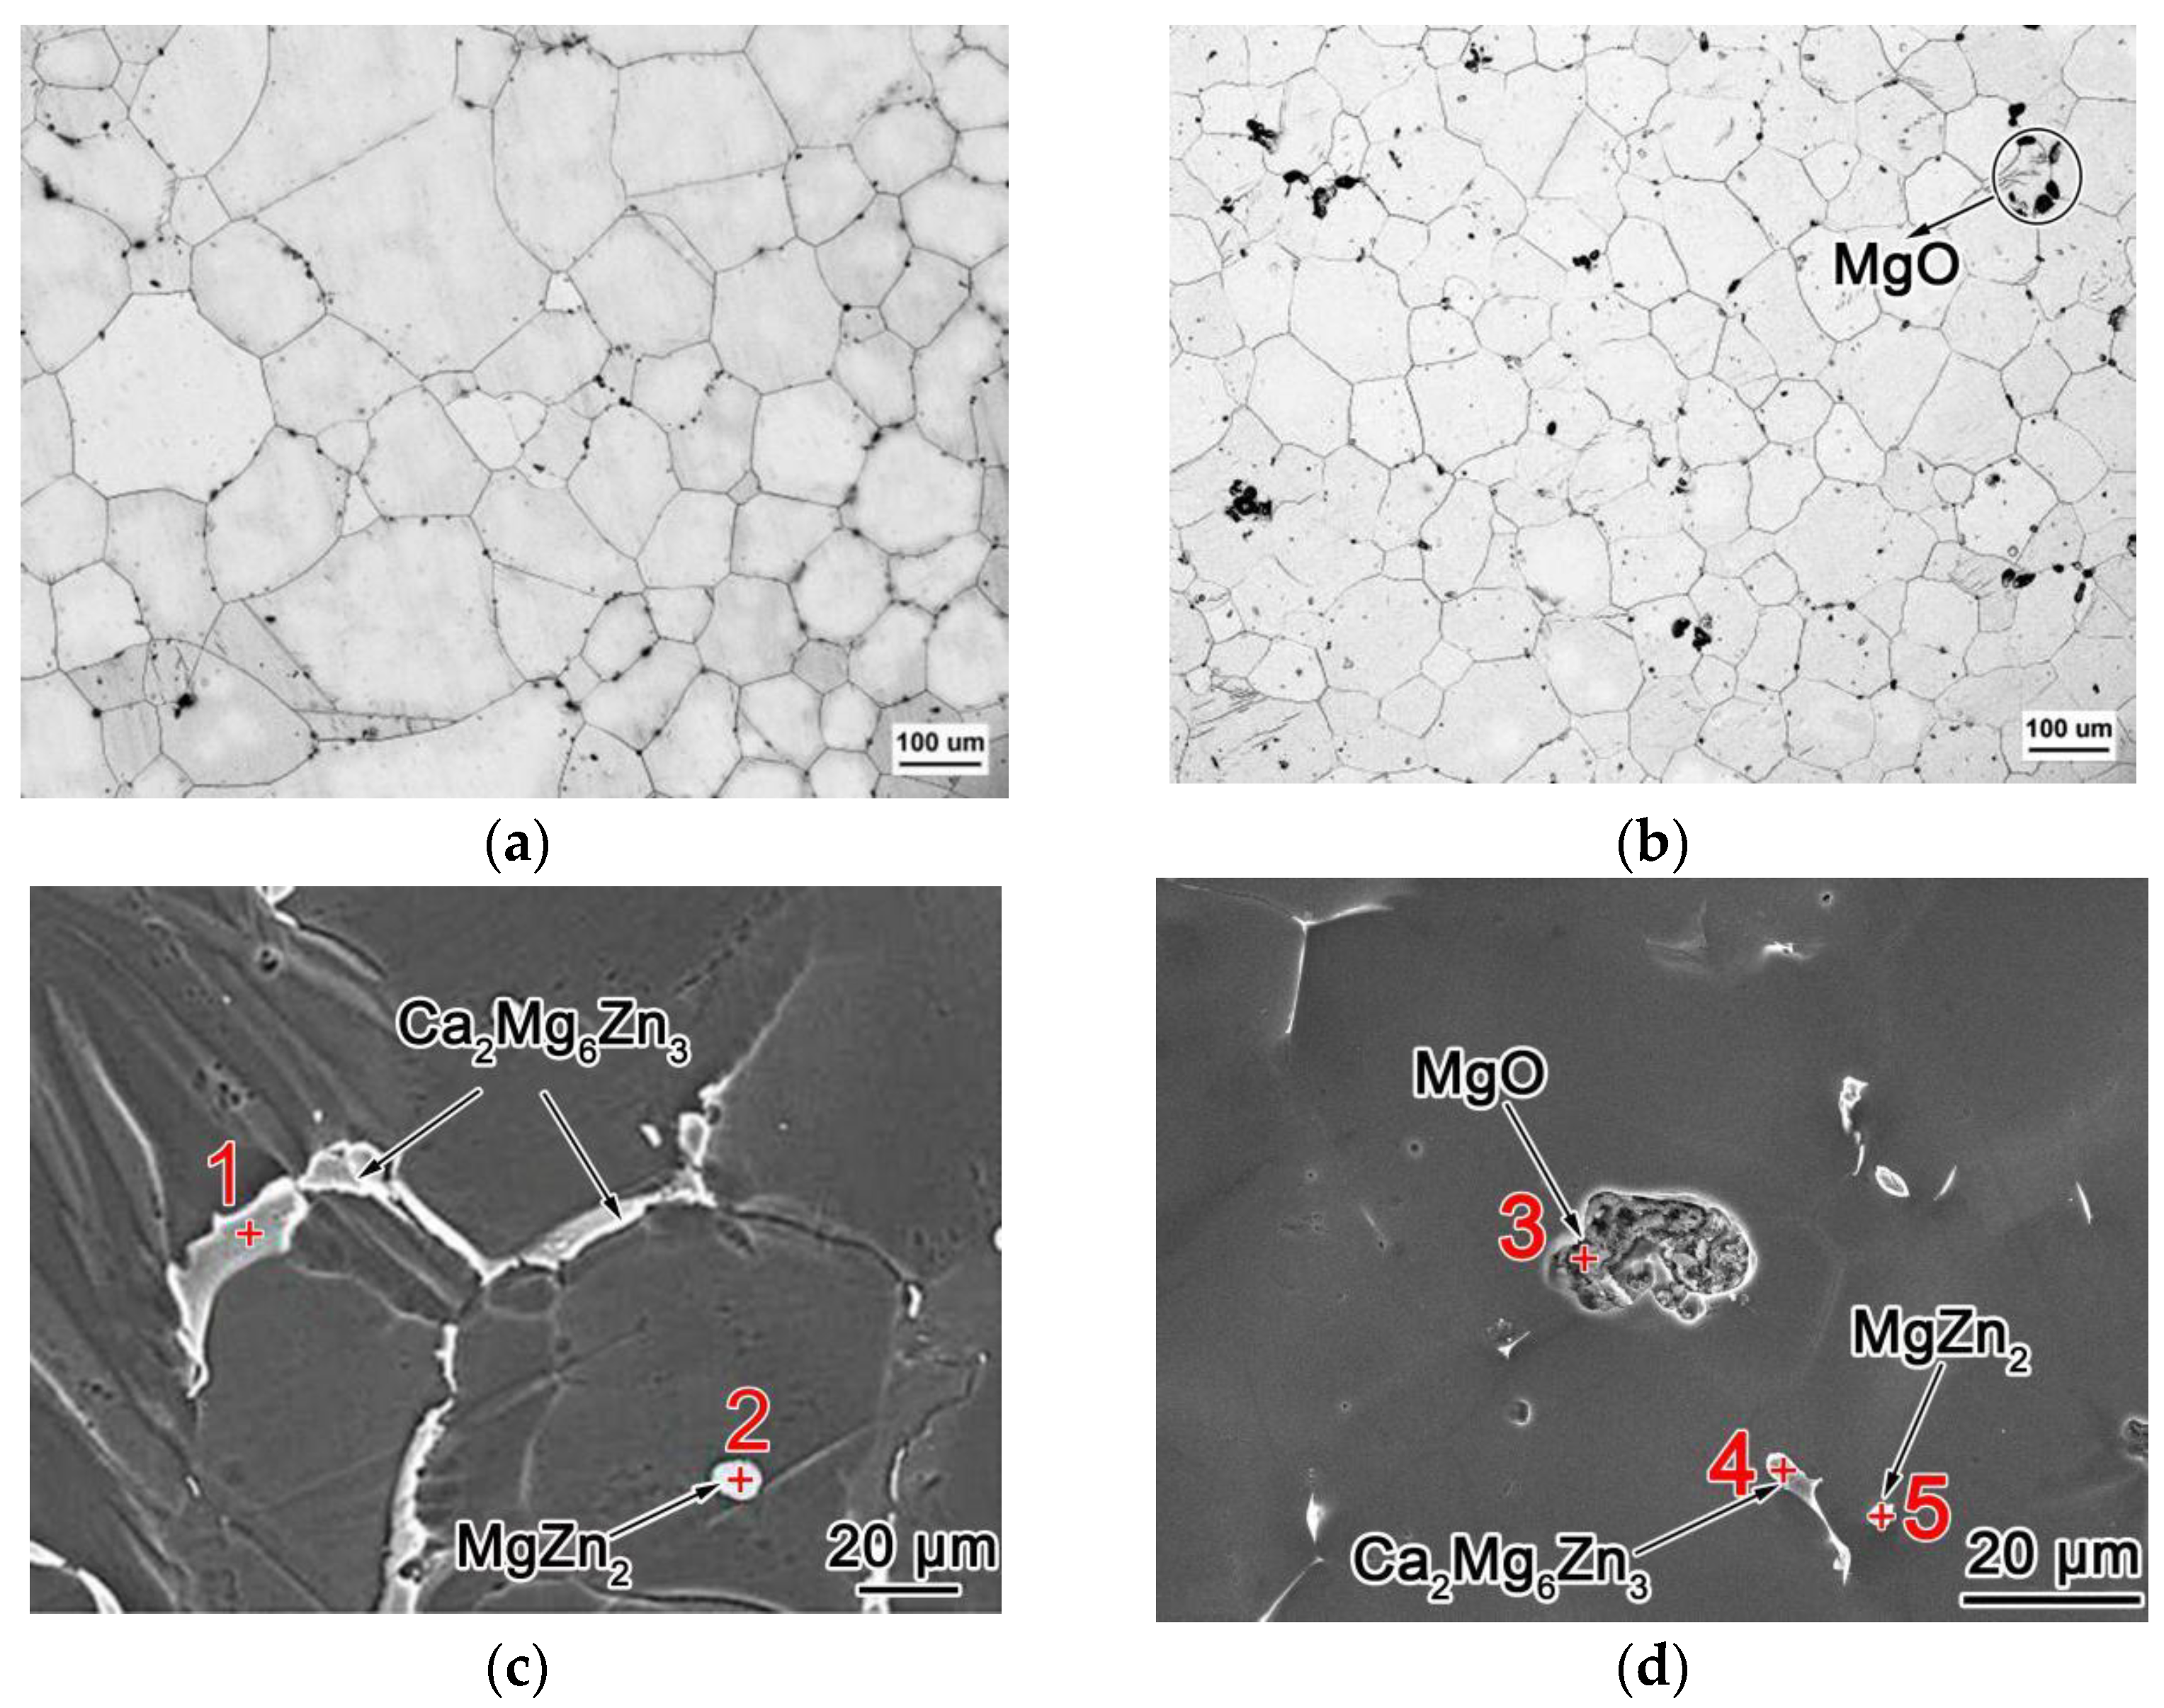
3.1. Initial Microstructure Analysis

Figure 1 shows the microstructure of homogenized MZC and MZCM. Compared with coarse grains in MZC (Figure 1a), finer and more uniform grains are observed in MZCM (Figure 1b). The average grain size of MZCM was calculated to be 67 µm, which is 43 µm lower than that of MZC. The black particles (marked by the black circle in Figure 1b and spectrum 3 in Figure 1d), with dimensions in the range of 1–27 µm, distributed in grain boundaries and interior grains of MZCM, which are agglomerated nano MgO particles. Based on SEM and EDS analysis (Table 2), the strip second phases (spectrum 1 and spectrum 4) along the grain boundary are identified to be Ca2Mg6Zn3 phase, and the spherical second phases (spectrum 2 and spectrum 5) in the grains are MgZn2 phase, which is also consistent with our previous study [11]. Additionally, the average sizes of Ca2Mg6Zn3 and MgZn2 phase in MZC are 41.9 µm and 9.74 µm, respectively, and average sizes of Ca2Mg6Zn3 and MgZn2 phase in MZCM are 15.4 µm and 2.6 µm, respectively, showing the dramatic refinement effects of added MgO.

3.2. Flow Curves

The typical true stress-strain (σ-ε) curves of MZC and MZCM deformed up to a true strain of 0.7 at designed temperatures and strain rates are presented in Figure 2. All the flow stress curves increase initially to a peak value and then decrease to a steady state. Such flow behavior is a typical characteristic of hot working results from competitive deformation mechanisms between work-hardening and work-softening [19]. Especially, when the samples are compressed at a higher temperature or lower strain rate, the work softening dominates the deformation process and reaches a steady state at last. In contrast, the samples exhibit a great work-hardening rate at the initial stage, followed by moderate flow softening when deformed at a lower temperature or a higher strain rate. Figure 2 also shows that the flow stress of MZCM is lower than that of MZC under the same hot deformation condition in the temperature range of 523–623 K. However, it should be noted that the flow stress of MZCM is higher than that of MZC when deformed at 673 K and 0.1–1 s−1, which are caused by the hot cracking in MZC (Figure 15a).
The peak stress values of MZC and MZCM at different strain rates and deformation temperatures are shown in Figure 3. It is demonstrated that the strain rate and deformation temperature have a significant influence on the peak stress of MZC and MZCM. The peak stress of the specimens decreases with increasing deformation temperature and decreasing strain rate. This is because the lower strain rate provides sufficient time for dislocation rearrangement and energy accumulation for DRX, and higher deformation temperatures increase the driving force and the mobility of grain boundaries [20].

3.3. Constitutive Analysis

Constitutive characteristics have been used to describe the relationship among the strain rate ( ε . ), deformation temperature (T) and flow stress (σ) for MZC and MZCM. A constitutive equation is helpful to study the effect of the addition of MgO on the temperature plastic deformation behavior of MZC. The corresponding equation is expressed as follows [21]:
ε . = A [ sinh ( α σ ) ] n exp ( Q R T )
where A is the material constant, α is the stress multiplier, n is the stress exponent, R is the gas constant (8.314 J/mol/K) and Q is the activation energy for plastic flow (KJ/mol). In this part of the study, σ is considered as the peak stress because the steady state is difficult to attain at high strain rate conditions. Equations (2) and (3) are applicable to low stress level (ασ < 0.8) associated with power-law creep and high stress level (ασ > 0.8) associated with power-law breakdown, respectively.
ε . = A 1 σ n 1 exp ( Q R T )
ε . = A 2 exp ( β σ ) exp ( Q R T )
where A1, A2, n1 and β are material constants and β = αn1. Taking natural logarithm on both sides of Equations (2) and (3), it can be seen that the value of n1 could be derived from the slope of the linear equation between ln ε . and lnσ, and the slope of the linear equation between ln ε . and σ is the value of β. The average value of α was calculated from n1 and β for each alloy. Thus the average values of α obtained at various temperatures following the above procedure were 0.01420 and 0.01322 for MZCM and MZC, respectively.
Q is an important physical parameter to characterize the deformation difficulty of materials under various conditions [22]. Taking the natural logarithm on both sides of Equation (1), Q could be determined by differentiating the above equation:
Q = R [ ln ε . ln [ sinh ( α σ ) ] ] T [ ln [ sinh ( α σ ) ] ( 1 / T ) ] ε . = R n s
where n is the average slope of the plots in the ln-ln [sinh(ασ)] plots at different temperature and s is the average slope of the lines of ln [sinh(ασ)]-1000/T at different strain rates, as shown in Figure 4a–d. As such, the average value of n for MZCM is given by the average slopes of ln and ln [sinh(ασ)] which was calculated as 4.5081, while the average value of Q for MZCM could be calculated as 150.3 kJ·mol−1 according to Equation (4). Similarly, the average values of n and Q for MZC are 5.1387 and 187.2 kJ·mol−1, respectively. Therefore, the n and Q values of MZCM are lower than those of MZC, indicating that MZCM is more easily deformed than MZC under the same hot deformation condition. Substituting the above measured values into Equation (1), the constitutive equations for the MZC and MZCM are eventually obtained as Equations (5) and (6), respectively.
ε . = 1.044 × 10 15 [ sinh ( 0.0132 σ ) ] 5.14 exp ( 187.17 R T )
ε . = 9.598 × 10 10 [ sinh ( 0.0142 σ ) ] 4.51 exp ( 150.32 R T )
Figure 5 shows the fitting plots between calculated and measured peak stress. It can be seen the correlation coefficient between calculated and measured peak stress for the MZC and MZCM are 0.988 and 0.987, respectively. This means that the above constitutive equations could describe the hot deformation behavior of MZC and MZCM accurately.

3.4. Processing Maps

To obtain the optimum hot deformation conditions, processing maps [23] were developed to investigate the workability of materials, which are the combination of an instability map onto a power dissipation map. When the alloy behaves as a power dissipator in the process of hot deformation, the generated power is mainly dissipated through plastic deformation and microstructural evolution. According to the dynamic materials model, power dissipation efficiency (η) is defined as the characteristic of power dissipation of microstructural evolution during hot deformation, which is expressed as [24]:
η = 2m/(m + 1)
where m ( = ln σ / ln ε . ) is the strain rate sensitivity exponent. The correlation between the η values and deformation parameters (temperature and strain rate) represents a power dissipation map, which shows different domains associated with a specific microstructure process. However, η alone cannot determine the workability of the material. An instability map is used to characterize the instability zones of the material during hot deformation. The instability criterion used to define the onset of flow instability is expressed as follows [25]:
ξ ( ε . ) = ln [ m / m + 1 ] ln ε . + m 0
where ξ( ε . ) is the instability parameter. The variation of the ξ values with different temperatures and strain rates constitutes an instability map that defines the domains of flow instability (ξ( ε . ) < 0). The flow instability domains are always attributed to adiabatic shear bands, cracks or localized flow instabilities in the microstructure [26]. Finally, the processing map can be plotted by the superimposition of an instability map onto a dissipation map. A higher η value in the map means that power dissipation provides more energy for the dynamic recovery (DRV) and DRX at a certain temperature and strain rate. A positive ξ value and high η value signify better workability of the materials. Thus, premium microstructure and excellent mechanical properties of the material are gained under this situation.
Figure 6 and Figure 7 show the processing maps at strains of 0.1, 0.3, 0.5 and 0.7 for MZC and MZCM, respectively. The strains of 0.1, 0.3 and 0.5 represent the work-hardening stage, the balance stage between work-hardening and -softening and the work -oftening stage, respectively. The shaded areas reveal the flow instability regions while the unshaded areas reveal the flow stability regions. For the same material, the η patterns at the strains of 0.1–0.7 are similar in terms of contour shape, while the value of η is different between MZC and MZCM. Furthermore, the distribution of instability regions varies with strains and materials.
As shown in Figure 6 and Figure 7, the numbers marked in contour represents η values in percentage. η values ranging from 30 to 50% associated with DRX [25], and the boundaries of η = 30% are marked by red dotted lines. For both MZC and MZCM, the areas in the processing maps with η values over 30% increase with increasing strain in a general trend, indicating that the transformation mechanism transfers from work-hardening to work-softening. Additionally, the maximum η value in processing maps of MZCM is higher than that of MZC at certain strains, proving the microstructure of MZCM is more deeply influenced by dynamic recrystallization mechanisms. Processing maps at the strain of 0.7 present the stability state of the specimen during hot deformation. Thus, compared with MZC at the strain of 0.7, the DRX region with η values in the range of 30–50% MZCM is larger and the area of the whole instability region of MZCM is smaller. However, the area of the low-temperature high strain-rate instability region for MZCM is larger than that of MZC, and the area of the high-temperature high strain-rate instability region for MZCM is smaller than that of MZC. Therefore, the alleviative flow instability in the MZCM at high temperatures and high strain rates results from the DRX, which was promoted by the addition of nano MgO. Meanwhile, it is worth noting that the instability region of MZCM at the low temperature is enlarged due to the stress concentration effects caused by nano MgO.

4. Discussion

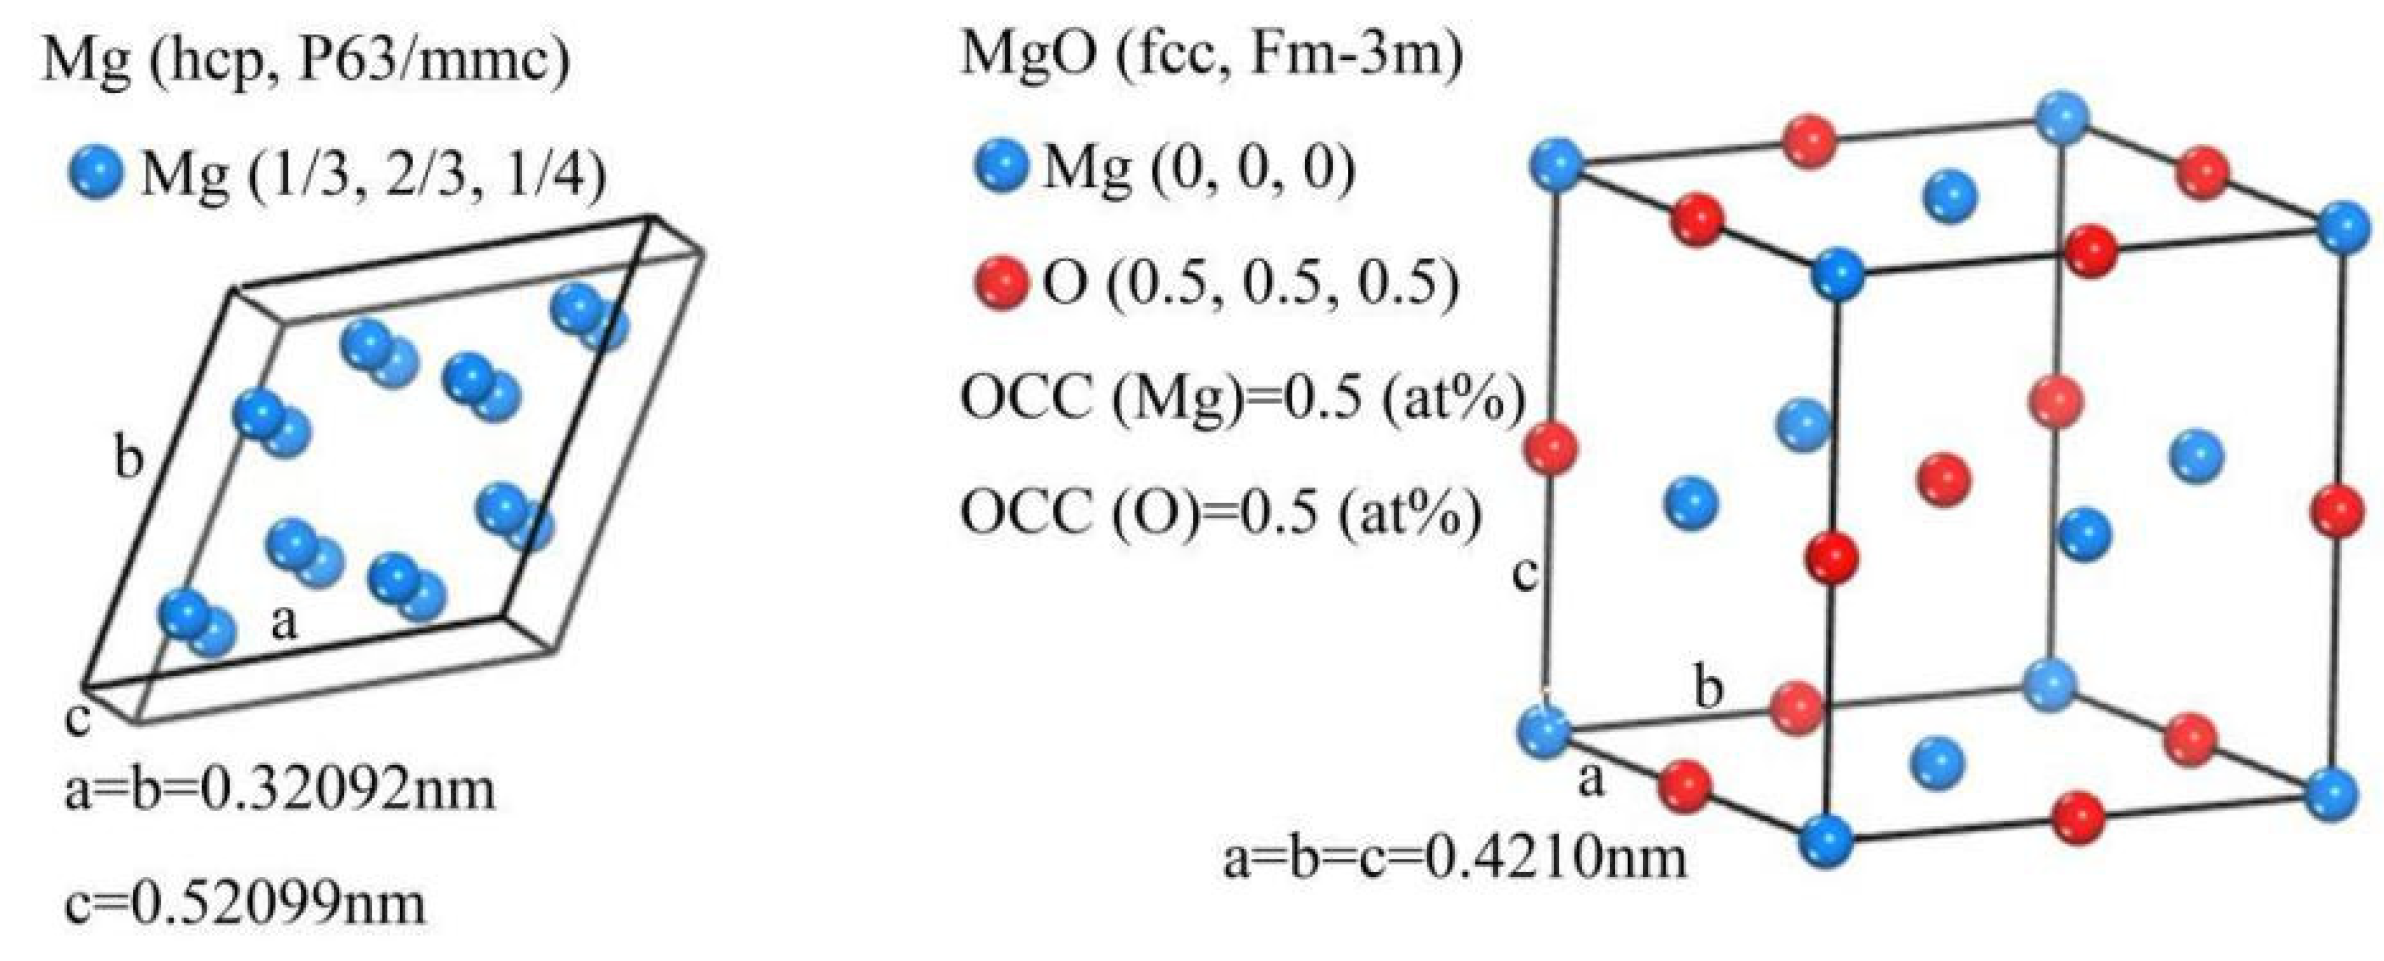
4.1. Crystal Analysis

As illustrated in Figure 8, the Mg matrix has a close-packed hexagonal structure (HCP) with lattice parameters of a = 0.321 nm and c = 0.521 nm [27], and the crystal structure of reinforcement MgO is face-center-cubic with lattice parameters of a = 0.421 nm. Interface bonding status between matrix and reinforcement has a great influence on the properties of the composite. According to the lattice disregistry theory proposed by Bramfitt [28], the disregistry (δ) equation between nucleation phase and matrix is:
δ ( h k l ) n ( h k l ) s = i = 1 3 | ( d [ u v w ] s i cos θ ) d [ u v w ] n i d [ u v w ] n i | × 100 3
where (hkl)s and (hkl)n are a low-index plane of the substrate and the nucleated solid, respectively, [uvw]s and [uvw]n are a low-index direction in (hkl)s and (hkl)n, respectively, and d[uvw]n and d[uvw]s are the interatomic spacing along [uvw]n and [uvw]s, respectively. According to the reported literature [28], the refinement effect of nucleation particles on a matrix is the best when δ is less than 6% and decreases when δ is between 6% and 12%. Thus, based on Equation (9), the calculated δ (Table 3) between MgO nucleation particles and the Mg matrix is much lower than 6%, indicating good lattice matching between them. Therefore, MgO particles can be used as an effective and stable nucleation core of the Mg matrix, which promotes the DRX process in MZCM during deformation. Meanwhile, fine grain structure and work-softening effects resulting from the DRX process endow stable deformation onto MZCM. Moreover, small interface disregistry between MgO particles and Mg matrix means great deformation compatibility, which benefits the plasticity of MZCM.

4.2. Flow Behavior

Figure 9 shows the typical work-hardening rate (θ = dσ/dε)—flow stress curve which further describes the hot deformation process of materials [29]. The three stages of the plot are divided by the critical stress (σc), peak stress (σp) and steady state stress (σss), which are referred to as the significant work-hardening stage (I), the balance stage between the work-hardening and -softening (II) and the dynamic softening stage (III), respectively [30]. Saturated stress (σsat) suggests a balance between the work-hardening and DRV while the stress for maximum softening rate (σ*) corresponds to the stress with minimum θ. Steady-state flow behavior is achieved when work-hardening and dynamic softening (DRX and DRV) reach a dynamic balance at σss.
The work-hardening rate (θ = dσ/dε)—flow stress curves calculated from the true stress-strain curves of MZC and MZCM are shown in Figure 10 and Figure 11, respectively. According to the above characteristics of the schematic (Figure 9), when deformed at 623–673 K and 1/s, the area enclosed by θ = 0 and θ-σ curves (θ < 0) is larger than the area under other deformation conditions for MZC and MZCM, indicating the unstable status of under this condition. Moreover, the aforementioned area of MZC is larger than that of MZCM under the same condition, indicating that the larger instability area of MZC than that of MZCM. This is consistent with the results of the above mentioned processing maps at the strain of stability state.
The σc on the spinodal of the curves in Figure 10 and Figure 11 indicates the dislocation density in a material [31], which increases with increasing strain rates or decreasing deformation temperature for MZC and MZCM in the general trend. The increase rates of the materials under certain temperature are calculated as kp values in corresponding figures. When deformed at under 573 K, the σc values of MZCN increase much more slowly than those of MZC with smaller kp, indicating lower stress and dislocation concentrations in MZCM. This is because the addition of MgO in MZCM refines the microstructure of it, especially the coarse Ca2Mg6Zn3 phase, which avoids brittle fractures forming in it. A reverse trend is shown when the deformation temperature is over 623 K—the lower σc and kp values of MZC which contribute to the unstable structure may be caused by the microcracks in it, which is consistent with the bigger unstable area of MZC in the processing map (Figure 6d). Importantly, compared with MZC, it is worth noting that the kp values of MZCM at higher temperatures (573–673 K) are not associated with increasing temperature, indicating that the addition of MgO endows the MZCM with a more stable deformation behavior and mechanism at higher temperatures.
The values of critical strain of the initiation of DRX (εc), the strain corresponding to σpp) and the ratio of εcp at different deformation regimes for MZC and MZCM are listed in Table 4 and Table 5, respectively. The results show that the values of εc and εp increase with the increasing strain rate under the same deformation temperature. This is because the higher strain rate cannot provide sufficient nucleation time for DRX in the alloy, resulting in a dramatic work-hardening effect due to the higher dislocation density [32]. A decrease in the εc and εp values of MZC and MZCM is also observed with increasing deformation temperature under the same strain rate. A high deformation temperature promotes annihilation and rearrangement of dislocations at grain boundaries [33], which boosts the nucleation and growth rate of DRX grains. Meanwhile, a higher temperature decreases the critical resolved shear stress (CRSS) of the non-basal slip system [34] of HCP structure alloy, which decreases the work-hardening effects by enhancing the cross slipping in the alloy.
In general, values of εcp in the range of 0~1 indicate the onset of DRX at a given deformation condition [35,36]. The average value of εcp for MZC and MZCM is 0.734 and 0.694, respectively, which is close to the εcp value for many metals, around 0.8 [37]. The lower average εcp value of MZCM reveals that the DRX of MZCM occurs at a lower strain. According to the particle-stimulated nucleation (PSN) mechanism, agglomerated MgO nanoparticles with a diameter larger than 1 µm (Figure 1b) promote DRX of MZCM by producing local high-density dislocations during deformation [38]. Therefore, the addition of nano MgO promotes the DRX of MZCM. This also explains why the flow stress of MZC is higher than that of MZCM under the same hot deformation conditions (Figure 2).

4.3. Deformation Mechanism

The values of average Q of MZC and MZCM are 187.2 kJ·mol−1 and 150.3 kJ·mol−1, respectively, and the average values of n for MZC and MZCM are 5.1387 and 4.5081. The n and Q values of MZCM are lower than those of MZC, indicating that the addition of nano MgO particles decreases the stress sensitivity and deformation resistance for thermal deformation and improves the plasticity of the MZC [39]. This is because the addition of nano MgO particles in MZCM results in the formation of large quantities of non-equilibrium grain boundaries, which provide an additional driving force for MZCM during the compressive deformation [40]. Additionally, the addition of nano MgO particles in MZCM promotes the DRX, which reduces the threshold of deformation resistance of MZCM.
The compression deformation mechanism is also determined by stain rate sensitivity exponent. Figure 12 shows the strain rate sensitivity exponent m of MZC and MZCM at different temperatures, which was calculated according to the slope of the linear equation between lnσ and ln ε . . The value of m reflects the ability of materials to suppress local necking. Generally, elongations of the alloys increase with increasing the m value. As shown in Figure 12, the m values of MZC and MZCM range from 0.07 to 0.21 under the corresponding temperature and strain rate ranges, suggesting that the dislocation climb is the dominant mechanism during compressive deformation [40]. As shown in Figure 12, the m value of MZC and MZCM increases with the increase in deformation temperature, resulting from the more thermally activated annihilation of lattice dislocation effect in grain boundaries or adjacent zones under higher compression temperatures [41]. Compared to MZC, m values of MZCM are higher at the same deformation temperature, indicating higher elongation of MZCM than of MZC. This is attributed to the higher grain boundary density in MZCM (Figure 1a,b), which benefits the plasticity of MZCM by grain boundary sliding [42]. Furthermore, the higher grain boundary density of MZCM accelerates the annihilation of positive and negative dislocations at grain boundaries in it, resulting in enhancement of elongation.

4.4. Microstructure Evolution

The Zener-Hollomon (Z) parameter is an important parameter for the characterization of the process of hot deformation for metallic materials. The Z parameter is a deformation rate factor for temperature compensation which integrates the effects of deformation temperature and strain rate [43]. Z can be expressed by temperature and strain rate as:
Z = ε . exp ( Q R T )
Then, lnZ values are obtained according to Equation (10), as shown in Table 5. The Z parameter acts as a critical indicator of microstructure evolution under specific deformation conditions. Thus, based on the results of the processing maps and Z parameter, DRX behaviors and microstructure evolution of MZC and MZCM are investigated. According to Table 5, the Z value decreased with the increase in deformation temperature or the decreasing strain rate. DRX fraction can be estimated by flow stress and Z parameter [29], indicating that the DRX fraction is sensitive to the Z parameter. The Z value of MZCM is lower than that of MZC, and fine and equiaxed dynamic recrystallized grains (Figure 14) are obtained at a relatively low Z value, indicating that a higher Z value should not be taken during the process of hot deformation.
As shown in Figure 13, MZC and MZCM were compressed at 523 K and 0.1 s−1, which correspond to a relatively high Z value condition. According to the processing map at the strain of 0.7 (Figure 6d and Figure 7d), the flow instability occurs both in MZC and MZCM under this low-temperature high strain-rate deformation condition. As no obvious dynamic recrystallized grains were observed in both specimens, indicating the dominance of work-hardening for these two materials. According to Figure 13, twinning is the main deformation behavior. Because of the poor work-softening provided by the DRX, serious stress concentration generates at the interface between twins and grain boundaries in MZC and MZCM (marked by black circles in Figure 13), which hinders the base-slip and result in microcracks. Importantly, the area of the low-temperature high strain-rate instability region for MZCM is larger than that of MZC (Figure 6d and Figure 7d). This is because MZCM is susceptible to local dislocation tangling because of the addition of MgO, which induces local stress concentration easily and then results in microcracks. It is worth noting that the extension distance of microcracks of MZC is longer than that of MZCM, attributed to the hindered effects of high-density grain boundaries and nano MgO in MZCM. Moreover, it can be observed that the grains of MZCM are much more deformed than those of MZC. This is because the larger scaled Ca2Mg6Zn3 phases distributed along grain boundaries (Figure 1) increase the deformation resistance of MZC. Thus, the flow stress of MZCM is lower than that of MZC under this condition (Figure 2).
Figure 14 shows the microstructure evolution in flow stability regions of MZC and MZCM deformed under different deformation conditions. As shown in Figure 14a,b, the necklace structure along the original grain boundaries at 623 K and 0.1 s−1 is observed, showing that a typical DRX feature initiates at grain boundaries, and the average grain size of MZCM and MZC are 2.6 µm and 2.8 µm. Compared to Figure 13, DRX in both materials is promoted with the rise of deformation temperature, which is attributed to the improved mobility of dislocations in grain boundary due to the enhanced atomic diffusion at high temperature. The DRX fraction of MZCM (26.6%) is higher than that of MZC (15.7%), attributing to the higher grain boundary density and heterogeneous nucleation effects of MgO, which provide more nuclear sites for dynamic recrystallized grains.
The typical microstructures of MZC and MZCM at 623 K and 0.001 s−1 are shown in Figure 14c,d, respectively, which correspond to a high efficiency of power dissipation in the processing maps. Compared to Figure 13 and Figure 14a,b, low strain rates leave sufficient time for DRX process, thus a uniform and equiaxed grain structure can be observed. The average DRX grain size of MZCM is 13.1 µm, which is more uniform and finer than that of MZC (18.1 µm). This phenomenon is mainly ascribed to the addition of nano MgO particles, which limit the growth of crystallized grains in MZCM by pinning the grain boundaries during hot deformation. Under this deformation condition, the DRX fractions of MZCM and MZC are about 98.4% and 85.2%, respectively, which benefits the DRX of MZCM a lot and thus decreases the flow stress (Figure 2) of it. Figure 14e,f show the microstructures of alloy deformed at 673 K and 0.01 s−1. Compared with Figure 14c,d, the average grain sizes of MZC and MZCM are 32.2 µm and 28.1 µm, respectively. This is because a higher deformation temperature provides sufficient energy for dynamic recrystallized grains to grow continuously, resulting in overgrowth, especially for MZC, which lowers the flow stress of materials.
Figure 15 presents the microstructure of the edge region of MZC and MZCM at 673 K and 0.1 s−1, which corresponds to the flow instability domains for MZC and stability domains for MZCM. Compared with MZCM, higher density twins in MZC prevail the severe local deformation in the alloy. This is because the larger scaled Ca2Mg6Zn3 phase particles (Figure 1c) distributed along the grain boundaries cause serious stress concentration around them under the high strain rate of 0.1 s−1, which results in nucleation and extension of microcracks easily. Thus, the MZC fails to reach its intrinsic flow stress because of early fracture, resulting in low flow stress and the following plunge in stress in the stress-strain curve (Figure 2) for this condition. For MZCM, fewer twins indicate the uniform distribution of stress in it. This results from the fine grains and secondary phases refined by nano MgO in MZCM (Figure 1b,d), which decreases the deformation resistance and stress concentration in it. Therefore, no plastic instability happens for MZCM at 673 K and 0.1–1 s−1, and the flow stress of MZCM is higher than that of MZC.
Based on the above analysis, the optimum hot working condition for MZCM is determined to be 623–653 K and 0.01–0.001 s−1 with the peak value of power dissipation efficiency.

5. Conclusions

In summary, the effect of the addition of the nano MgO particles on the hot compression behavior and processing maps of MZC was examined in the present work. The following brief conclusions can be drawn:
(1)
The crystal structure analysis showed that MgO particles can be used as effective and stable nucleation cores of a Mg matrix, and a fine and more homogeneous microstructure of MZCM was formed with the addition of nano MgO particles.
(2)
The flow stress of MZC and MZCM showed typical DRX features, and the flow stress of MZCM is lower than that of MZC during deformation at 523–623 K but this result is the opposite at 673 K and 0.1–1 s−1. The average εcp value of MZCM is lower than that of MZC, revealing that the addition of nano MgO promotes the DRX of MZC. This result is consistent with microstructure evolution.
(3)
The constitutive equation of MZCM was developed; the n and m value show that dislocation climb is the dominate compressive deformation mechanism for MZC and MZCM, but the higher m value of MZCM might be attributed to the grain boundary sliding mechanism. The n and Q values of MZCM were lower than those of MZC under the same deformation condition, but the m value showed a reverse trend, which implies that the addition of nano MgO particles decreases the stress sensitivity and deformation resistance for thermal deformation and improves the plasticity of MZC.
(4)
According to the processing maps, compared with MZC, MZCM exhibits higher power dissipation efficiency, a larger DRX region and smaller instability regions, but the area of the low-temperature high strain-rate instability region for MZCM is larger and the area of the low-temperature high strain-rate instability region instability region for MZCM is smaller. Combined with microstructure evolution, a relatively lower Z value means sufficient DRX occurred in MZCM, and the optimum hot working condition for MZCM was determined to be 623–653 K and 0.01–0.001 s−1.

Author Contributions

Conceptualization, M.C.; investigation, L.Y.; writing—original draft preparation, H.Z.; writing—review and editing, H.Z., S.L., C.Y. and M.C.; funding acquisition, M.C. All authors have read and agreed to the published version of the manuscript.

Funding

This research was funded by the National Natural Science Foundation of China, grant numbers U1764254 and 51871166.

Conflicts of Interest

The authors declare no conflict of interest.

References

  1. Ahmad, R.; Wu, Z.X.; Curtin, W.A. Analysis of double cross-slip of pyramidal I <c + a> screw dislocations and implications for ductility in Mg alloys. Acta Mater. 2020, 183, 228–241. [Google Scholar] [CrossRef]
  2. Bommal, V.K.; Krishn, M.G.; Rao, C.T. Magnesium matrix composites for biomedical applications: A review. J. Magn. Alloys 2019, 7, 72–79. [Google Scholar] [CrossRef]
  3. Zheng, Y.F.; Gu, X.N.; Xi, Y.L.; Chai, D.L. In vitro degradation and cytotoxicity of Mg/Ca composites produced by powder metallurgy. Acta Biomater. 2010, 6, 1783–1791. [Google Scholar] [CrossRef] [PubMed]
  4. Pollock, T. Weight Loss with Magnesium Alloys. Science 2010, 328, 986–987. [Google Scholar] [CrossRef] [PubMed]
  5. Zheng, H.R.; Li, Z.; You, C.; Chen, M.F. Effects of MgO modified β-TCP nanoparticles on the microstructure and properties of β-TCP/Mg-Zn-Zr composites. Bioact. Mater. 2017, 2, 1–9. [Google Scholar] [CrossRef]
  6. Chen, Y.W.; Moussi, J.; Drury, J.L.; Wataha, J.C. Zirconia in Biomedical Applications. Expert Rev. Med. Devices 2016, 13, 945–963. [Google Scholar] [CrossRef]
  7. Mounib, M.; Pavese, M.; Badini, C.; Lefebvre, W.; Dieringa, H. Reactivity and Microstructure of Al2O3-Reinforced Magnesium-Matrix Composites. Adv. Mater. Sci. Eng. 2014, 2014, 1–6. [Google Scholar] [CrossRef] [Green Version]
  8. Lei, T.; Tang, W.; Cai, S.H.; Feng, F.F.; Li, N.F. On the corrosion behaviour of newly developed biodegradable Mg-based metal matrix composites produced by in situ reaction. Corros. Sci. 2012, 54, 270–277. [Google Scholar] [CrossRef]
  9. Meenashisundaram, G.K.; Seetharaman, S.; Gupta, M. Enhancing overall tensile and compressive response of pure Mg using nano-TiB2 particulates. Mater. Charact. 2014, 94, 178–188. [Google Scholar] [CrossRef]
  10. Goh, C.S.; Gupta, M.; Wei, J.; Lee, L.C. Characterization of High Performance Mg/MgO Nanocomposites. J. Compos. Mater. 2007, 41, 2325–2335. [Google Scholar] [CrossRef]
  11. Lin, G.Y.; Liu, D.D.; Chen, M.F.; You, C.; Li, Z.; Wang, Y. Preparation and characterization of biodegradable Mg-Zn-Ca/MgO nanocomposites for biomedical applications. Mater. Charact. 2018, 144, 120–130. [Google Scholar] [CrossRef]
  12. Shahin, M.; Munir, K.; Wen, C.; Li, Y. Magnesium matrix nanocomposites for orthopedic applications: A review from mechanical, corrosion, and biological perspectives. Acta Biomater. 2019, 96, 1–19. [Google Scholar] [CrossRef] [PubMed]
  13. Zheng, H.R.; Li, Z.; Chen, M.F.; You, C.; Liu, D. The effect of nano β-TCP on hot compression deformation behavior and microstructure evolution of the biomedical Mg-Zn-Zr alloy. Mater. Sci. Eng. A 2018, 715, 205–213. [Google Scholar] [CrossRef]
  14. Xiao, P.; Gao, Y.M.; Xu, F.X.; Yang, S.; Li, Y.; Li, B. Hot deformation behavior of in-situ nanosized TiB2 particulate reinforced AZ91 Mg matrix composite. J. Alloys Compd. 2019, 798, 1–11. [Google Scholar] [CrossRef]
  15. Raj, R. Development of a Processing Map for Use in Warm-Forming and Hot-Forming Processes. Metall. Trans. A 1981, 12, 1089–1097. [Google Scholar] [CrossRef]
  16. Łyszkowski, R.; Bystrzycki, J. Hot deformation and processing maps of a Fe-Al intermetallic alloy. Mater. Charact. 2014, 96, 196–205. [Google Scholar] [CrossRef]
  17. Zhang, L.; Wang, Q.; Liu, G.; Guo, W.; Jiang, H.; Ding, W. Effect of SiC particles and the particulate size on the hot deformation and processing map of AZ91 magnesium matrix composites. Mater. Sci. Eng. A 2017, 707, 315–324. [Google Scholar] [CrossRef]
  18. Fan, Z.; Zuo, Y.B.; Jiang, B. A new technology for treating liquid metals with intensive melt shearing. Mater. Sci. Forum 2011, 690, 141–144. [Google Scholar] [CrossRef]
  19. Cheng, W.L.; Bai, Y.; Ma, S.C.; Wang, L.; Wang, H.; Yu, H. Hot deformation behavior and workability characteristic of a fine-grained Mg-8Sn-2Zn-2Al alloy with processing map. J. Mater. Sci. Tech. 2019, 35, 1198–1209. [Google Scholar] [CrossRef]
  20. Hao, J.Q.; Zhang, J.S.; Xu, C.X.; Ni, K. Optimum parameters and kinetic analysis for hot working of a solution-treated Mg-Zn-Y-Mn magnesium alloy. J. Alloys Compd. 2018, 754, 283–296. [Google Scholar] [CrossRef]
  21. Chadha, K.; Shahriari, D.; Tremblay, R.; BHATTACHARJEE, P.P.; JAHAZI, M. Deformation and Recrystallization Behavior of the Cast Structure in Large Size, High Strength Steel Ingots: Experimentation and Modeling. Metall. Mater. Trans. A 2017, 48, 4297–4313. [Google Scholar] [CrossRef]
  22. Tahreen, N.; Zhang, D.F.; Pan, F.S.; Jiang, Q.; Li, C.; Li, D.Y. Characterization of hot deformation behavior of an extruded Mg-Zn-Mn-Y alloy containing LPSO phase. J. Alloys Compd. 2015, 644, 814–823. [Google Scholar] [CrossRef]
  23. Prasad, Y.V.R.K.; Seshacharyulu, T. Processing maps for hot working of titanium alloys. Mater. Sci. Eng. A 1998, 243, 82–88. [Google Scholar] [CrossRef]
  24. Ansari, N.; Tran, B.; Poole, W.J.; Singh, S.S.; Krishnaswamy, H.; Jain, J. High temperature deformation behavior of Mg-5wt.%Y binary alloy: Constitutive analysis and processing maps. Mater. Sci. Eng. A 2020, 777, 139051. [Google Scholar] [CrossRef]
  25. Kwak, T.Y.; Kim, W.J. Effect of refinement of grains and icosahedral phase on hot compressive deformation and processing maps of Mg-Zn-Y magnesium alloys with different volume fractions of icosahedral phase. J. Mater. Sci. Tech. 2019, 35, 181–191. [Google Scholar] [CrossRef]
  26. Suttona, S.C.; Luo, A.A. Constitutive behavior and processing maps of a new wrought magnesium alloy ZE20 (Mg-2Zn-0.2Ce). J. Magn. Alloys 2020, 8, 111–126. [Google Scholar] [CrossRef]
  27. Wang, W.Y.; Tang, B.; Shang, S.L.; Wang, J.; Li, S.; Wang, Y. Local lattice distortion mediated formation of stacking faults in Mg alloys. Acta Mater. 2019, 170, 231–239. [Google Scholar] [CrossRef] [Green Version]
  28. Bramfitt, B.L. The effect of carbide and nitride additions on the heterogeneous nucleation behavior of liquid iron. Metall. Trans. 1970, 1, 1987–1995. [Google Scholar] [CrossRef]
  29. Li, L.; Wang, Y.; Li, H.; Jiang, W.; Wang, T.; Zhang, C.C.; Wang, F.; Garmestani, H. Effect of the Zener-Hollomon parameter on the dynamic recrystallization kinetics of Mg-Zn-Zr-Yb magnesium alloy. Comp. Mater. Sci. 2019, 166, 221–229. [Google Scholar] [CrossRef]
  30. He, D.G.; Lin, Y.C.; Chen, J.; Chen, D.D.; Huang, J.; Tang, Y. Microstructural evolution and support vector regression model for an aged Ni-based superalloy during two-stage hot forming with stepped strain rates. Mater. Des. 2018, 154, 51–62. [Google Scholar] [CrossRef]
  31. Queen, H.J.; Ryan, N.D. Constitutive analysis in hot working. Mater. Sci. Eng. A 2002, 322, 43–63. [Google Scholar]
  32. Xia, X.S.; Chen, Q.; Huang, S.H.; Lin, J.; Hu, C.; Zhao, Z. Hot deformation behavior of extruded Mg-Zn-Y-Zr alloy. J. Alloys Compd. 2015, 644, 308–316. [Google Scholar] [CrossRef]
  33. Tahreen, N.; Zhang, D.F.; Pan, F.S.; Jiang, X.Q.; Li, D.Y.; Chen, D.L. Hot deformation and processing map of an as-extruded Mg-Zn-Mn-Y alloy containing I and W phases. Mater. Des. 2015, 87, 245–255. [Google Scholar] [CrossRef]
  34. Xia, X.; Chen, Q.; Zhang, K.; Zhao, Z.; Ma, M.; Li, X. Hot deformation behavior and processing map of coarse-grained Mg-Gd-Y-Nd-Zr alloy. Mater. Sci. Eng. A 2013, 587, 283–290. [Google Scholar] [CrossRef]
  35. Poliak, E.I.; Jonas, J.J. Initiation of Dynamic Recrystallization in Constant Strain Rate Hot Deformation. ISIJ Int. 2003, 43, 684–691. [Google Scholar] [CrossRef] [Green Version]
  36. Jonas, J.J.; Quelennec, X.; Jiang, L.; Martin, E. The Avrami kinetics of dynamic recrystallization. Acta Mater. 2009, 57, 2748–2756. [Google Scholar] [CrossRef]
  37. Barnett, M.R. Hot Working Microstructure Map for Magnesium AZ31. Mater. Sci. Forum 2003, 426, 515–520. [Google Scholar] [CrossRef]
  38. Park, S.H.; Jung, J.G.; Kim, Y.M.; You, B.S. A new high-strength extruded Mg-8Al-4Sn-2Zn alloy. Mater. Lett. 2015, 139, 35–38. [Google Scholar] [CrossRef]
  39. Sherby, O.D.; Wadsworth, J. Superplasticity-Recent advances and future directions. Prog. Mater. Sci. 1989, 33, 169–221. [Google Scholar] [CrossRef]
  40. Mabuchi, M.; Ameyama, K.; Iwasaki, H.; Higashi, K. Low temperature superplasticity of AZ91 magnesium alloy with non-equilibrium grain boundaries. Acta Mater. 1999, 47, 2047–2057. [Google Scholar] [CrossRef]
  41. Panicker, R.; Chokshi, A.H.; Mishra, R.K.; Verma, R.; Krajewski, P.E. Microstructural evolution and grain boundary sliding in a superplastic magnesium AZ31 alloy. Acta Mater. 2009, 57, 3683–3693. [Google Scholar] [CrossRef]
  42. Tong, L.B.; Zheng, M.Y.; Zhang, D.P.; Gan, W.M.; Brokmeier, H.G.; Meng, J. Compressive deformation behavior of Mg-Zn-Ca alloy at elevated temperature. Mater. Sci. Eng. A 2013, 586, 71–77. [Google Scholar] [CrossRef]
  43. Yue, C.X.; Zhang, L.W.; Liao, S.L.; Pei, J.B.; Gao, H.J.; Jia, Y.W. Research on the dynamic recrystallization behavior of GCr15 steel. Mater. Sci. Eng. A 2009, 499, 177–181. [Google Scholar] [CrossRef]
Figure 1. Optical microscope (OM) images (a,b) and SEM images (c,d) of homogenized MZC (a,c) and MZCM (b,d).
Metals 10 01357 g001
Figure 2. Ture stress-strain curves of MZC and MZCM at different temperatures with strain rates of (a) 0.001 s−1, (b) 0.01 s−1, (c) 0.1 s−1 and (d) 1 s−1.
Metals 10 01357 g002
Figure 3. Variation of peak stresses of MZC (a) and MZCM (b) at different temperatures and strain rates.
Metals 10 01357 g003
Figure 4. Plots of ln ε . -ln[sinh(ασ)] (a,b) and ln [sinh(ασ)]-1000/T (c,d) for MZC (a,c) and MZCM (b,d).
Metals 10 01357 g004
Figure 5. Comparison of the calculated and measured peak stress for MZC (a) and MZCM (b).
Metals 10 01357 g005
Figure 6. Processing maps of the MZC at the strains of (a) 0.1, (b) 0.3, (c) 0.5 and (d) 0.7.
Metals 10 01357 g006
Figure 7. Processing maps of the MZCM at the strains of (a) 0.1, (b) 0.3, (c) 0.5 and (d) 0.7.
Metals 10 01357 g007aMetals 10 01357 g007b
Figure 8. Crystal structure simulations of Mg and MgO.
Metals 10 01357 g008
Figure 9. Schematic of the relation between working-hardening rate and flow stress.
Metals 10 01357 g009
Figure 10. Variation of the work-hardening rate θ with flow stress σ for MZC at different temperatures: (a) 523 K; (b) 573 K; (c) 623 K and (d) 673 K.
Metals 10 01357 g010
Figure 11. Variation of the work-hardening rate θ with flow stress σ for MZCM at different temperatures: (a) 523 K; (b) 573 K; (c) 623 K and (d) 673 K.
Metals 10 01357 g011
Figure 12. Strain rate sensitivity of (a) MZC and (b) MZCM.
Metals 10 01357 g012
Figure 13. Microstructures of MZC (a) and MZCM (b) deformed at 523 K/0.1 s−1.
Metals 10 01357 g013
Figure 14. Microstructures of MZC (a,c,e) and MZCM (b,d,f) deformed at (a,b) 623 K/0.1 s−1, (c,d) 623 K/0.001 s−1 and (e,f) 673 K/0.01 s−1.
Metals 10 01357 g014
Figure 15. Microstructures of MZC (a) and MZCM (b) deformed at 673 K/0.1 s−1.
Metals 10 01357 g015
Table 1. The chemical components of the Mg-3Zn-0.2Ca alloy (MZC) and the 0.2MgO/Mg-3Zn-0.2Ca composite (MZCM) (wt%).
Materials.ZnCaMgOMg
Mg-Zn-Ca (MZC)30.2-Balance
n-MgO/Mg-Zn-Ca (MZCM)30.2-Balance
Table 2. Chemical composition of MZC and MZCM by EDS, wt% (at.%).
SpectrumsMgCaZnO
#136.58 (57.08)16.68 (15.79)46.74 (27.13)-
#236.73 (58.76)1.56 (1.28)60.71 (38.96)-
#368.71 (59.10)--31.29 (40.90)
#446.91 (58.93)13.88 (14.27)49.21 (36.80)-
#545.77 (67.70)2.13 (1.39)52.10 (30.91)-
Table 3. Possible coherent interfaces of Mg and MgO.
NumberMgMgOδ/%
d/nm(hkl)d/nm(hkl)
10.13867(200)0.14891(220)1.87
20.13613(112)0.21056(200)1.07
30.13396(201)0.14891(220)2.91
40.13613(112)0.14891(220)1.05
Table 4. Values of εc, εp and εcp under different deformation conditions for MZC and MZCM.
Temperature/K ε . /s‒1MZCMZCM
εcεpεcpεcεpεcp
5230.0010.1950.2670.7300.1930.2650.728
0.010.2070.2960.6990.2080.3050.682
0.10.2150.3250.6620.2180.3380.645
10.2290.3380.6780.2390.3420.699
5730.0010.0930.1220.7620.0990.1610.615
0.010.1390.2950.4710.2000.2940.680
0.10.2110.3220.6550.2150.3140.685
10.2200.3360.6540.2260.3270.691
6230.0010.0870.1100.7910.0730.1170.624
0.010.1020.1490.6850.0990.1760.563
0.10.1780.2810.6330.2110.2840.743
10.1910.2840.6730.2200.2890.761
6730.0010.0570.0650.8770.0540.0670.806
0.010.0700.0780.8970.0760.0930.817
0.10.0740.0790.9370.0880.1400.629
10.0860.0920.9350.2030.2770.733
Table 5. lnZ values of MZC and MZCM under different deformation conditions.
ε . /s‒1MZCMZCM
523 K573 K623 K673 K523 K573 K623 K673 K
145.341.438.135.234.631.629.026.9
0.143.039.135.832.932.329.326.724.6
0.0140.736.833.530.629.926.924.422.3
0.00138.434.531.228.327.724.622.119.9

