Article

Influence of Severe Plastic Deformation on Static Recrystallization Microstructure of Pure Iron

Department of Mechanical Engineering, Tokyo Institute of Technology, Tokyo 1528550, Japan
*
Author to whom correspondence should be addressed.
Metals 2020, 10(10), 1320; https://doi.org/10.3390/met10101320
Submission received: 11 September 2020 / Revised: 29 September 2020 / Accepted: 30 September 2020 / Published: 2 October 2020
(This article belongs to the Section Metal Casting, Forming and Heat Treatment)

Abstract

:
In recent years, ultrafine-grained steel has been gaining increasing attention as a high-performance material. Accordingly, it is necessary to develop an efficient production method for ultrafine-grained steel. Severe plastic deformation is a critical factor that causes grain subdivision into ultrafine grains less than 1 µm in diameter. In this study, the effects of plastic deformation on the microstructure and static recrystallization of pure iron were studied by comparing orthogonal cutting and rolling. Orthogonal cutting yielded ultrafine grains with a diameter of 0.2 µm. It was found that a high strain rate in the thin shear plane generated during the cutting process caused a uniform subdivision of grains, and this uniform plastic deformation resulted in the uniform recrystallization of grains. In addition, a theoretical model was developed, and it was revealed that the number of recrystallized grains depended on the fraction of a large-misorientation area constructed with geometrically necessary boundaries (GNBs). It was suggested that the cutting process was more advantageous than rolling in producing ultrafine recrystallized grains because cutting could apply severe plastic strain uniformly on a work material, effectively generating GNBs.

1. Introduction

In recent years, the reduction of energy consumption and conservation of natural resources have become increasingly important to achieve the goal of sustainable development. Among various industrial technologies, the improvement of material properties is essential to increase energy efficiency and resource conservation in all technical fields, and further development is required. Thermomechanical control processing (TMCP) is an effective technique to improve the material properties of steel products [1,2]. TMCP is a technology to control the microstructure of metallic materials by adjusting the conditions of the metal formation processes. This is based on metallurgical phenomena, such as phase transformation and recrystallization, which are induced by the stored energy provided by the formation process [2]. There are several examples of TMCP products, such as ultrafine-grained steel with high strength [3] and oriented electromagnetic steel with minimal iron loss in transformers [4]. The advantage of TMCP is that it requires fewer or no additional alloy elements to control metallurgical phenomena. It is preferable for material recycling and saving resources.
Ultrafine-grained steel has attracted increasing attention in the field of research because it can achieve a very high yield strength with high formability. Moreover, it has been reported that ultrafine-grained steel can be used in micromachines as it does not cause deterioration of the machine surface or distortion in shape when it is applied to microcutting [5], microhole piercing [6] or microlaser cutting [7]. Ultrafine-grained steel is usually produced by TMCP of controlled rolling, wherein severe plastic strain and adequate heat treatment are achieved by hot or warm rolling methods [3,8]. Severe plastic strain is necessary to produce ultrafine-grained steel [9]. However, because the strain applied by rolling depends on the thickness reduction of the material, the maximum strain is limited by the thickness of the product plate. In addition, it is difficult to optimize the processing conditions because the metallographic phenomena in hot rolling are significantly affected by the chemical components of the material. It is necessary to collect a large set of experimental data from each production facility to determine the optimal processing conditions.
Several researchers have proposed alternate processes that cause severe plastic strain on a work material. One such example is equal channel angular processing (ECAP) proposed by Segal et al. [10,11]. ECAP causes shear plastic strain to the material but does not affect its shape. Thus, it can be repeated on the same work material to accumulate severe plastic strain energy in the material. Through ECAP, crystal grains of a material are subdivided into ultrafine subgrains, wherein ultrafine grains are generated by recrystallization. Compared with TMCP by rolling, the productivity of ECAP is low because it is a batch process. Other processes, such as the high-pressure torsion (HPT) process [12,13] and the accumulative roll-bonding (ARB) process [14], have been proposed to apply severe plastic strain on work materials. However, these processes also have low productivity.
Meanwhile, the authors suggested a new method to produce ultrafine-grained steel and to control its microstructure by a combination of cutting and heat treatment [15,16]. It is known that, in a metal cutting process, the work material is deformed to a chip with severe shear strain in the shear plane. The authors successfully produced ultrafine-grained steel by applying adequate heat treatment to a chip. In the report [16], an ultrafine-grained strip of 10 mm width was produced. It is expected to be applied for micro parts of such as endoscopes or surgical appliances. The process is much simpler than other processes such as ECAP or HPT, and it generates ultrafine grains more efficiently than rolling. In addition, it was found that the metal cutting method results neither in strong anisotropy nor oriented texture of the ultrafine-grained material, although strong unidirectional shear deformation in the shear plane was added to the chip.
The objectives of this study are to investigate differences in microscopic deformation between cutting and rolling, and the effects of these differences on the static recrystallization phenomenon induced by the subsequent heat treatment. In addition, it aims to elucidate the reason why cutting is effective in producing ultrafine-grained steel. First, the difference in microscopic plastic strain between chips generated by cutting and a thin plate formed by rolling is studied experimentally using electron backscatter diffraction (EBSD) analysis. Second, the effect of the difference in the deformed microstructure on static recrystallization was studied experimentally. In addition, the effects of microscopic pre-strain on the nucleation and grain growth mechanism are discussed theoretically.

2. Materials and Methods

2.1. Experimental Method

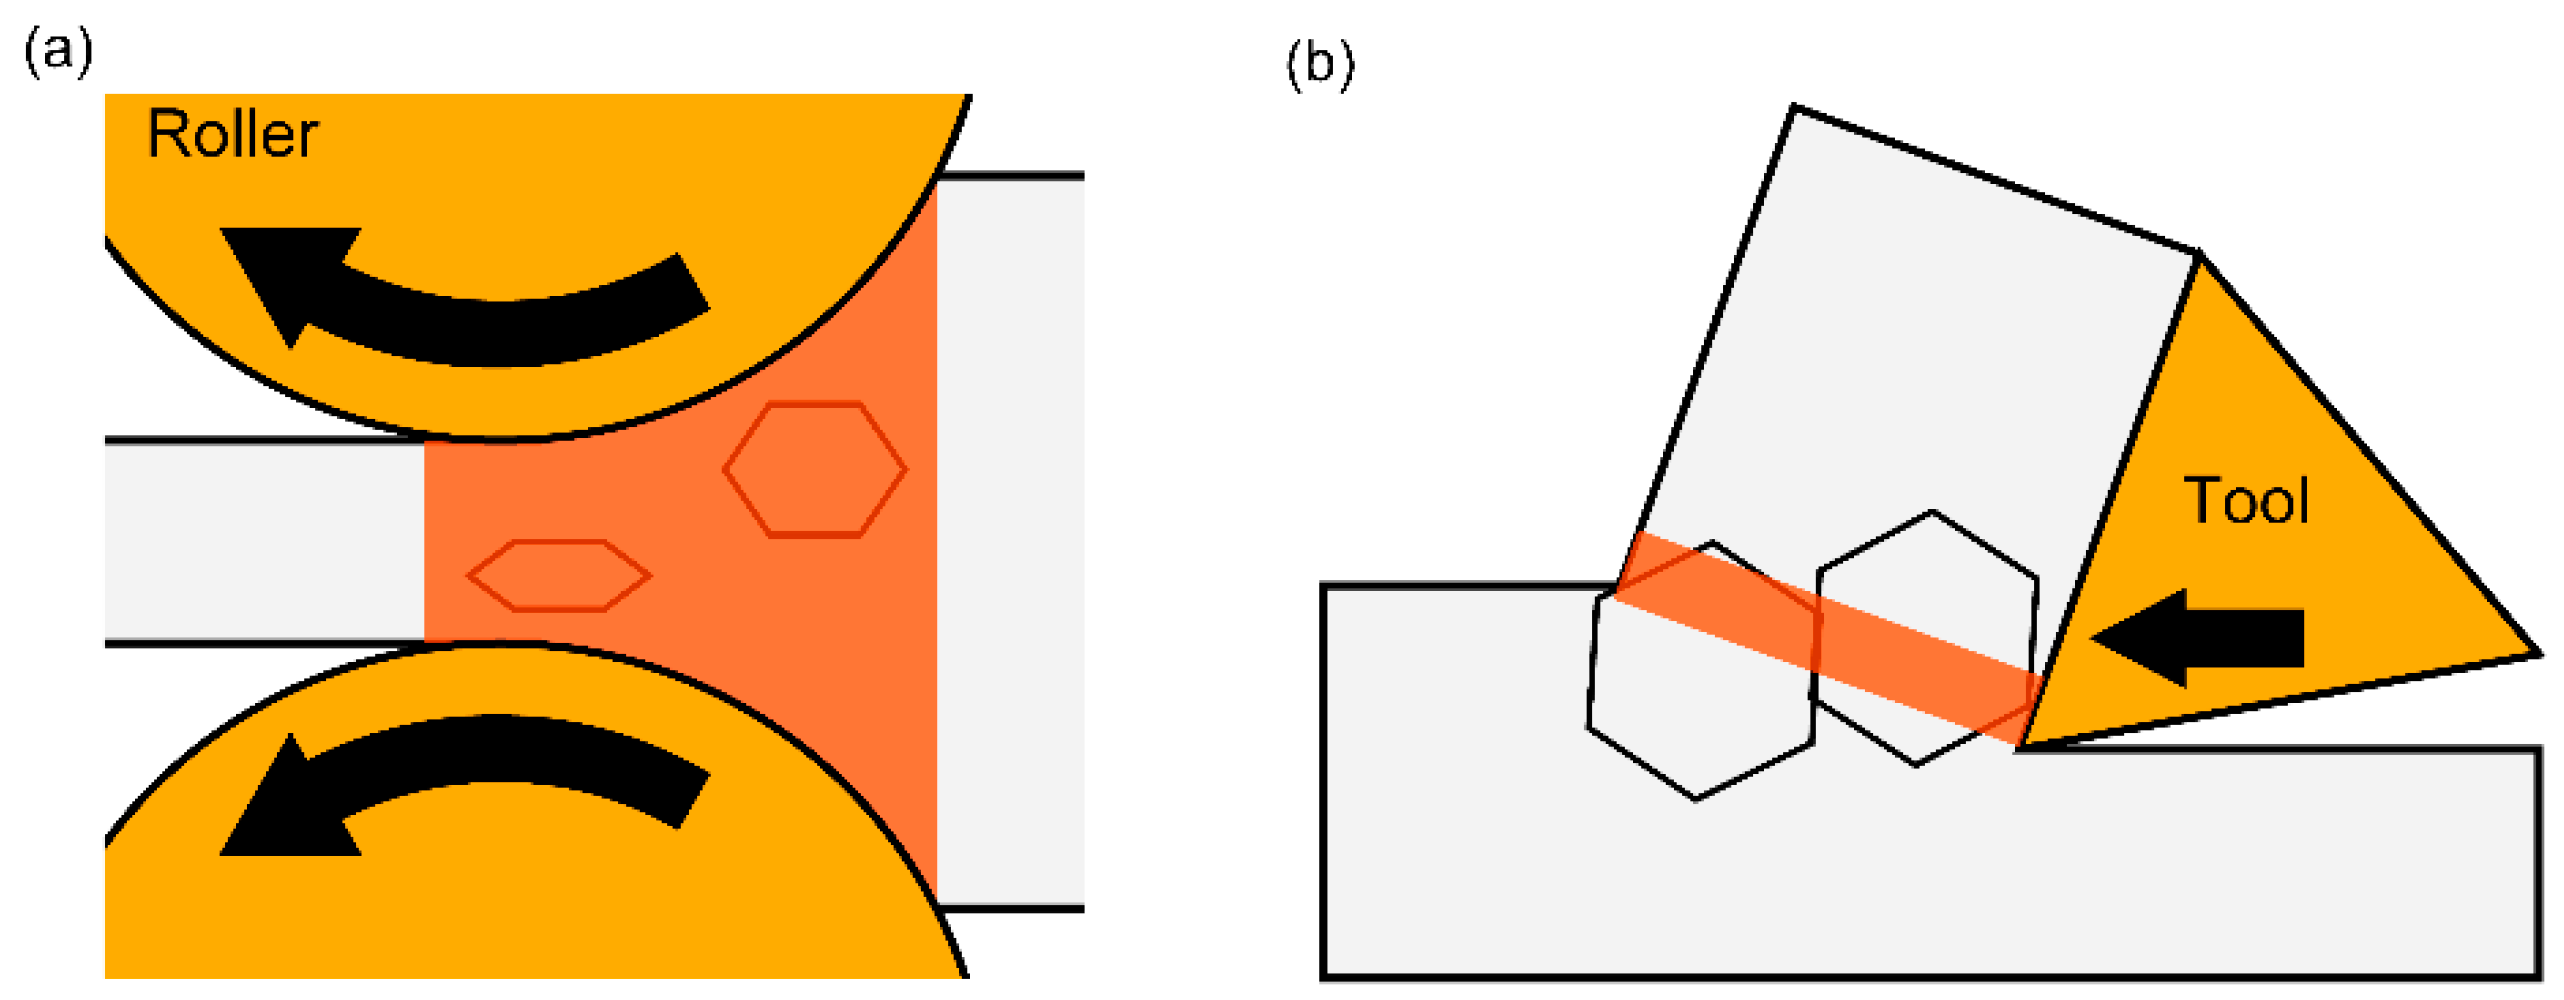
2.1.1. Orthogonal Cutting

In this study, orthogonal cutting was conducted with a computerized numerical control (CNC) lathe (TAC-360, Takisawa Machine Tool Co., Ltd., Okayama, Japan) under the conditions listed in Table 1. The adopted test material was a commercial-grade pure iron (C < 0.03 wt.%) rod of diameter 100 mm, the average grain diameter of which was 83 µm.
Figure 1 illustrates an orthogonal cutting model. A work material is instantly deformed in the shear plane and forms a chip. The plastic shear strain applied to the chip in the shear plane is expressed by the following equation [17]:
γ = cot ϕ + tan ( ϕ α )
where α is the rake angle of the tool and ϕ is the shear angle calculated as:
tan ϕ = ( t 0 / t c ) cos α 1 ( t 0 / t c ) sin α
where t 0 is the depth of the cut and t c is the chip thickness. Based on plasticity theory, the equivalent strain is calculated by integrating the following equation:
d ϵ ¯ = 2 3 d ϵ x x 2 + d ϵ y y 2 + d ϵ z z 2 + 2 ( d ϵ x y 2 + d ϵ y z 2 + d ϵ z x 2 )
where ϵ x x , ϵ y y and ϵ z z are the normal strain and ϵ x y , ϵ y z and ϵ z x are the shear stain. The total equivalent strain when only shear strain is applied is calculated as follows:
ϵ c ¯ = 2 3 0 + 0 + 0 + 2 ( d ϵ x y 2 + 0 + 0 ) = 2 3 2 d ϵ x y = 2 3 ϵ x y
Because ϵ x y = γ / 2 , Equation (4) is calculated as:
ϵ c ¯ = γ 3
The shear angle, shear strain, and equivalent strain are also listed in Table 1.
The coordinate system ND-RD-TD shown in Figure 1 is notation used for the EBSD analysis system. The specimen was set in the scanning electron microscope (SEM)-EBSD chamber so that RD (reference direction) corresponded to the chip flow direction, ND (normal direction) corresponded to thickness direction of the chip specimen, and TD (transverse direction) corresponded to the width direction.

2.1.2. Plate Rolling

A plate-rolling experiment was also conducted using specimens made of the same material as that of the iron rod used for the cutting test. Rectangular specimens of 10 mm width, 30 mm length, and 3 mm thickness were cut out from the iron rod by wire electric discharge machining. These specimens were rolled without heating under the conditions listed in Table 2. The equivalent strain of rolling was also calculated by integrating Equation (3) as follows:
ϵ r ¯ = 2 3 d ϵ x x 2 + d ϵ y y 2 + 0 + 2 ( 0 + 0 + 0 ) = 2 3 d ϵ x x 2 + d ϵ y y 2
Because ϵ x x = ϵ y y in the plate rolling,
ϵ r ¯ = 2 3 d ϵ x x 2 + d ϵ x x 2 = 2 3 2 d ϵ x x = 2 3 ϵ x x
As for plate rolling, plastic strain is expressed as
ϵ x x = ln H 2 H 1 = ln H 1 H 2
where H 1 and H 2 are the plate thickness before and after rolling, respectively. Equation (7) is calculated as
ϵ r ¯ = 2 3 ln ( H 1 H 2 )
The equivalent strain of rolling and the geometric parameters of the rolled specimen are also listed in Table 2.
Another specimen was rolled only halfway to investigate the crystal deformation during rolling. The thickness reduction of this half-rolled specimen was 68%, from 2.96 to 0.96 mm. In this case, the equivalent strain was approximately 1.3.

2.1.3. Heat Treatment and Microstructure Analysis

After these processes, the specimens were divided into several pieces and subjected to heat treatment at 500 and 600 °C for different annealing times, that is, 30 s, 1 min, and 5 min, in an Ar gas furnace. The specimens were inserted into a preheated furnace to rapidly increase the temperature and were held there for a predetermined time. Then, they were removed from the furnace and cooled quickly by blowing Ar gas. A series of these processes was performed under an Ar gas atmosphere.
The microstructure of these specimens was analyzed by SEM-EBSD; a field-emission scanning electron microscope (FE-SEM, JSM-7001F, JEOL Ltd., Tokyo, Japan) and a high-speed orientation imaging microscopy (OIM) detector (Hikari Super, EDAX, AMETEK Inc., Berwyn, PA, USA) were utilized for the analysis of the deformed specimens; a SEM (JSM-6510, JEOL Ltd., Tokyo, Japan) and a versatile OIM detector (DVC5, EDAX, AMETEK Inc., Berwyn, PA, USA) were utilized to analyze the annealed specimens. The grain size, texture, and other microstructural properties were characterized based on crystal orientation.

2.2. Methods of Numerical Simulation of Static Recrystallization

In this model, recrystallized grain size was calculated by an analytical solution based on the following equations. Those equations were solved by MATLAB.
Recrystallization was simulated based on the nucleation and grain growth theory. It was assumed that the driving force of recrystallization was the stored energy of plastic deformation. The increment of stored energy by plastic deformation was calculated as follows:
W = 1 2 μ tan 2 θ ( θ 15 ° ) W = 1 2 ρ b 2 ( θ > 15 ° )
where θ is the misorientation angle, μ is the modulus of rigidity, ρ is the dislocation density, and b is the length of the Burgers vector. For a low misorientation area ( θ 15 ° ), the stored energy was defined as the plastic strain energy, where the shear strain was tan θ . For a large-misorientation area ( θ > 15 ° ), the stored energy was defined as dislocation energy. The dislocation density was calculated from the plastic shear strain:
ρ = ϵ b x ¯
where ϵ is the applied shear strain and x ¯ is the average distance of dislocation movement. Because a dislocation cannot cross grain boundaries, it was considered that the average dislocation movement is related to the grain size. Therefore, it was assumed that:
x ¯ = C d d ¯
where d ¯ is the average grain diameter of the deformed microstructure and C d is a constant.
During heat treatment, recovery occurs, and some dislocations disappear in the collision between the positive and negative dislocations. The dislocation disappearance rate can be calculated from the probability of dislocation collision [18] as follows:
d ρ d t = C ρ ρ 2
where C ρ is a constant.
According to nucleation theory, the critical radius and critical free energy of nuclei were calculated as follows:
r c = 2 E g b W
g c = 16 π E g b 3 3 W 2
where E g b is the grain boundary energy. The grain boundary energy at misorientation angle θ was calculated using the Read–Shockley equation [19]:
E g b = μ b 4 π ( 1 ν ) θ ( A ln θ )
where ν is Poisson’s ratio and A is a material parameter. The nucleation rate per unit time and per unit volume was calculated as [20]:
N ˙ = n k b T h · exp [ Δ ( G a ) g k b T ] · exp ( g c k b T )
where k b is the Boltzmann constant, h is Planck’s constant, T is the heat treatment temperature, n is the atomic density, and Δ ( G a ) g is the activation energy of the boundary diffusion. The probability of growth was considered, as proposed by Yoshida [18]:
f = exp ( q k b T ) exp ( q k b T ) + exp ( b n k b T )
where q is the stored energy per atom and b n is the lattice diffusion energy. Thus, the number of nuclei appearing in Δ t was calculated as:
Δ N = f · N ˙ · V θ · Δ t
where V θ is the material volume where the misorientation is θ .
The grain growth rate during recrystallization was assumed to be:
r ˙ = C g · exp ( d E R T ) · [ 1 exp ( W R T ) ] · ( 1 R r e x )
where R is the gas constant, C g is a fitting parameter, d E is the activation energy of self-diffusion for recrystallization, and R r e x is the recrystallization ratio. To account for the overlapping of recrystallized grains, an extended volume fraction was introduced by Johnson and Mehl [21] and Avrami [22,23,24]. Based on this theory, the recrystallization ratio was calculated as follows:
R r e x = 1 exp ( V r e x V 0 )
where V r e x is the volume of recrystallized grains when all grains grow continuously, even impinging each other. Table 3 lists the material parameters used in this study.

3. Results and Discussion

3.1. Experimental Results and Discussion

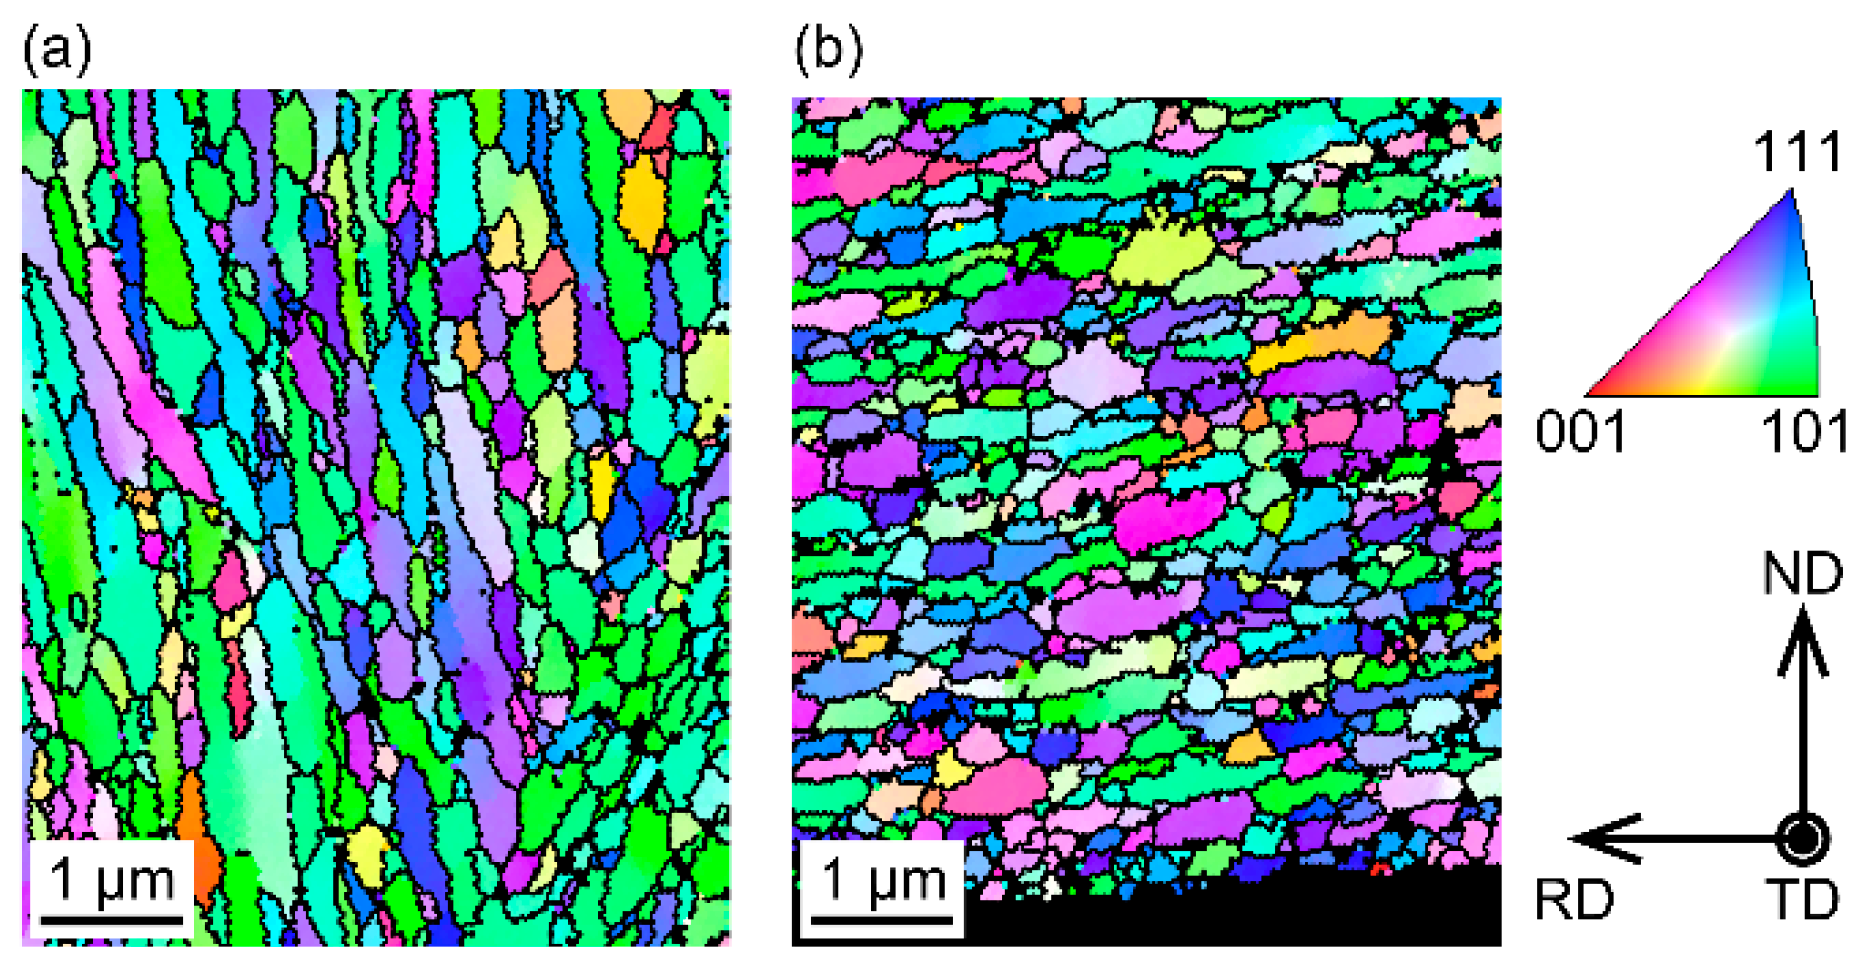
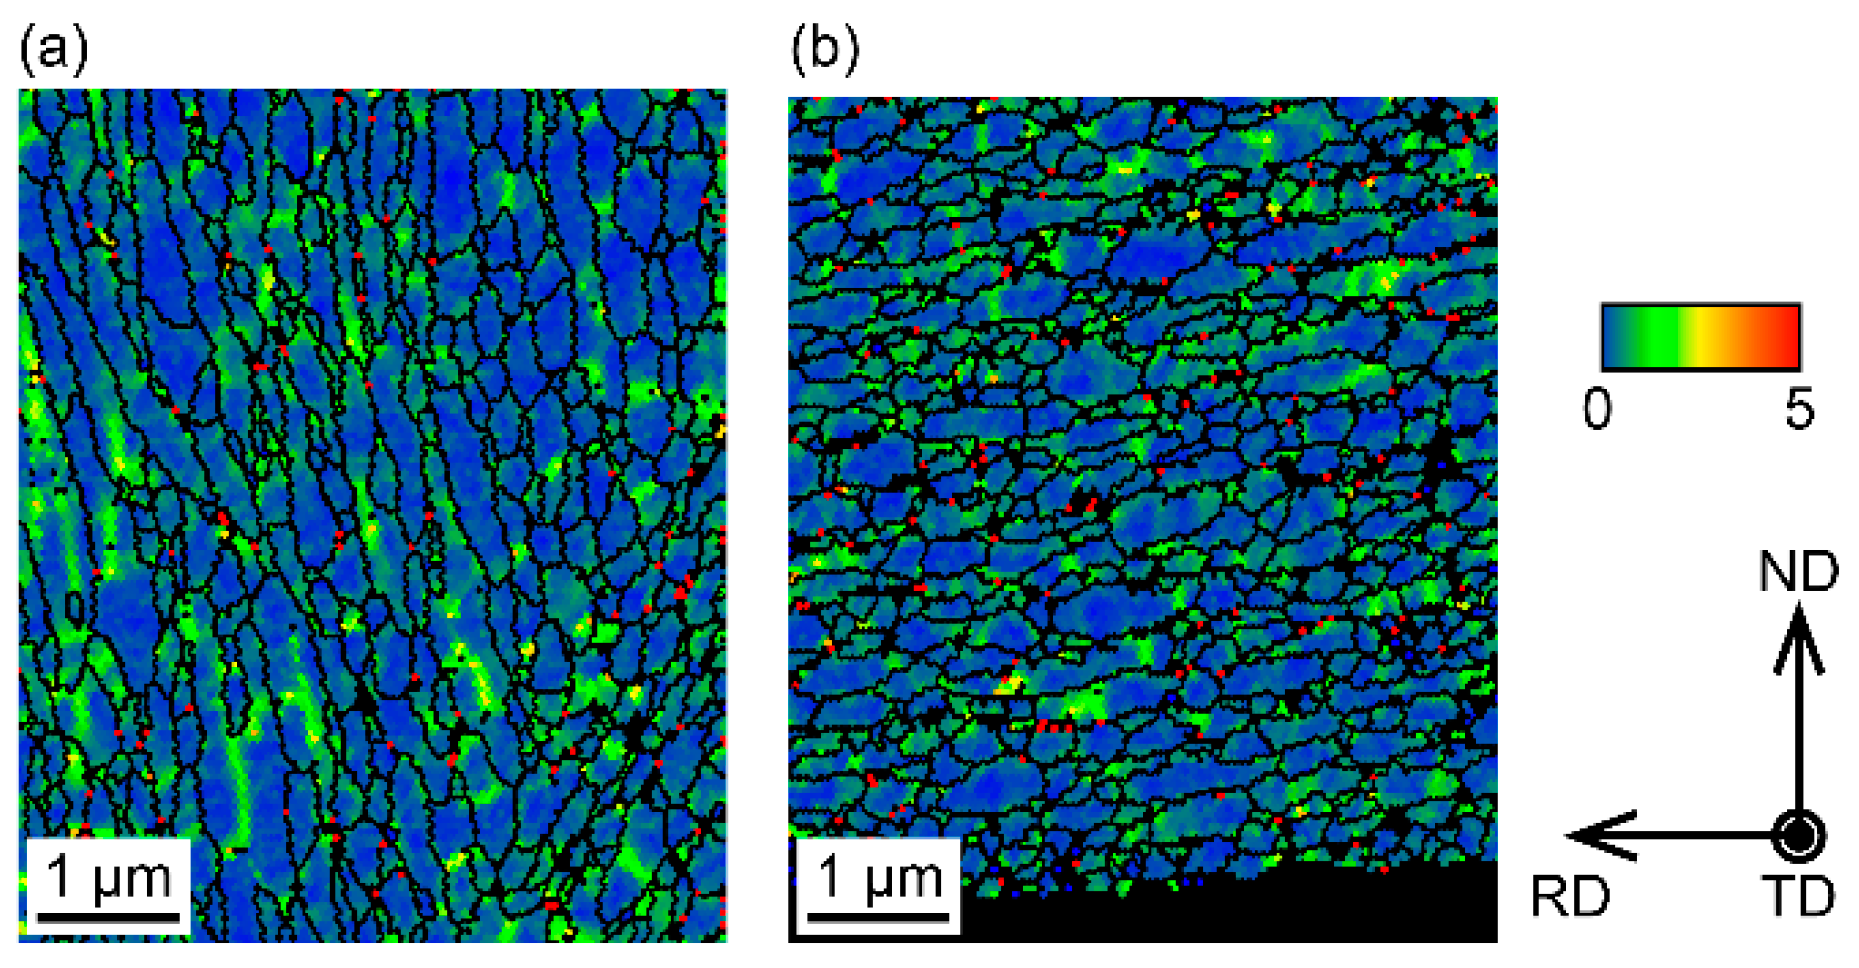
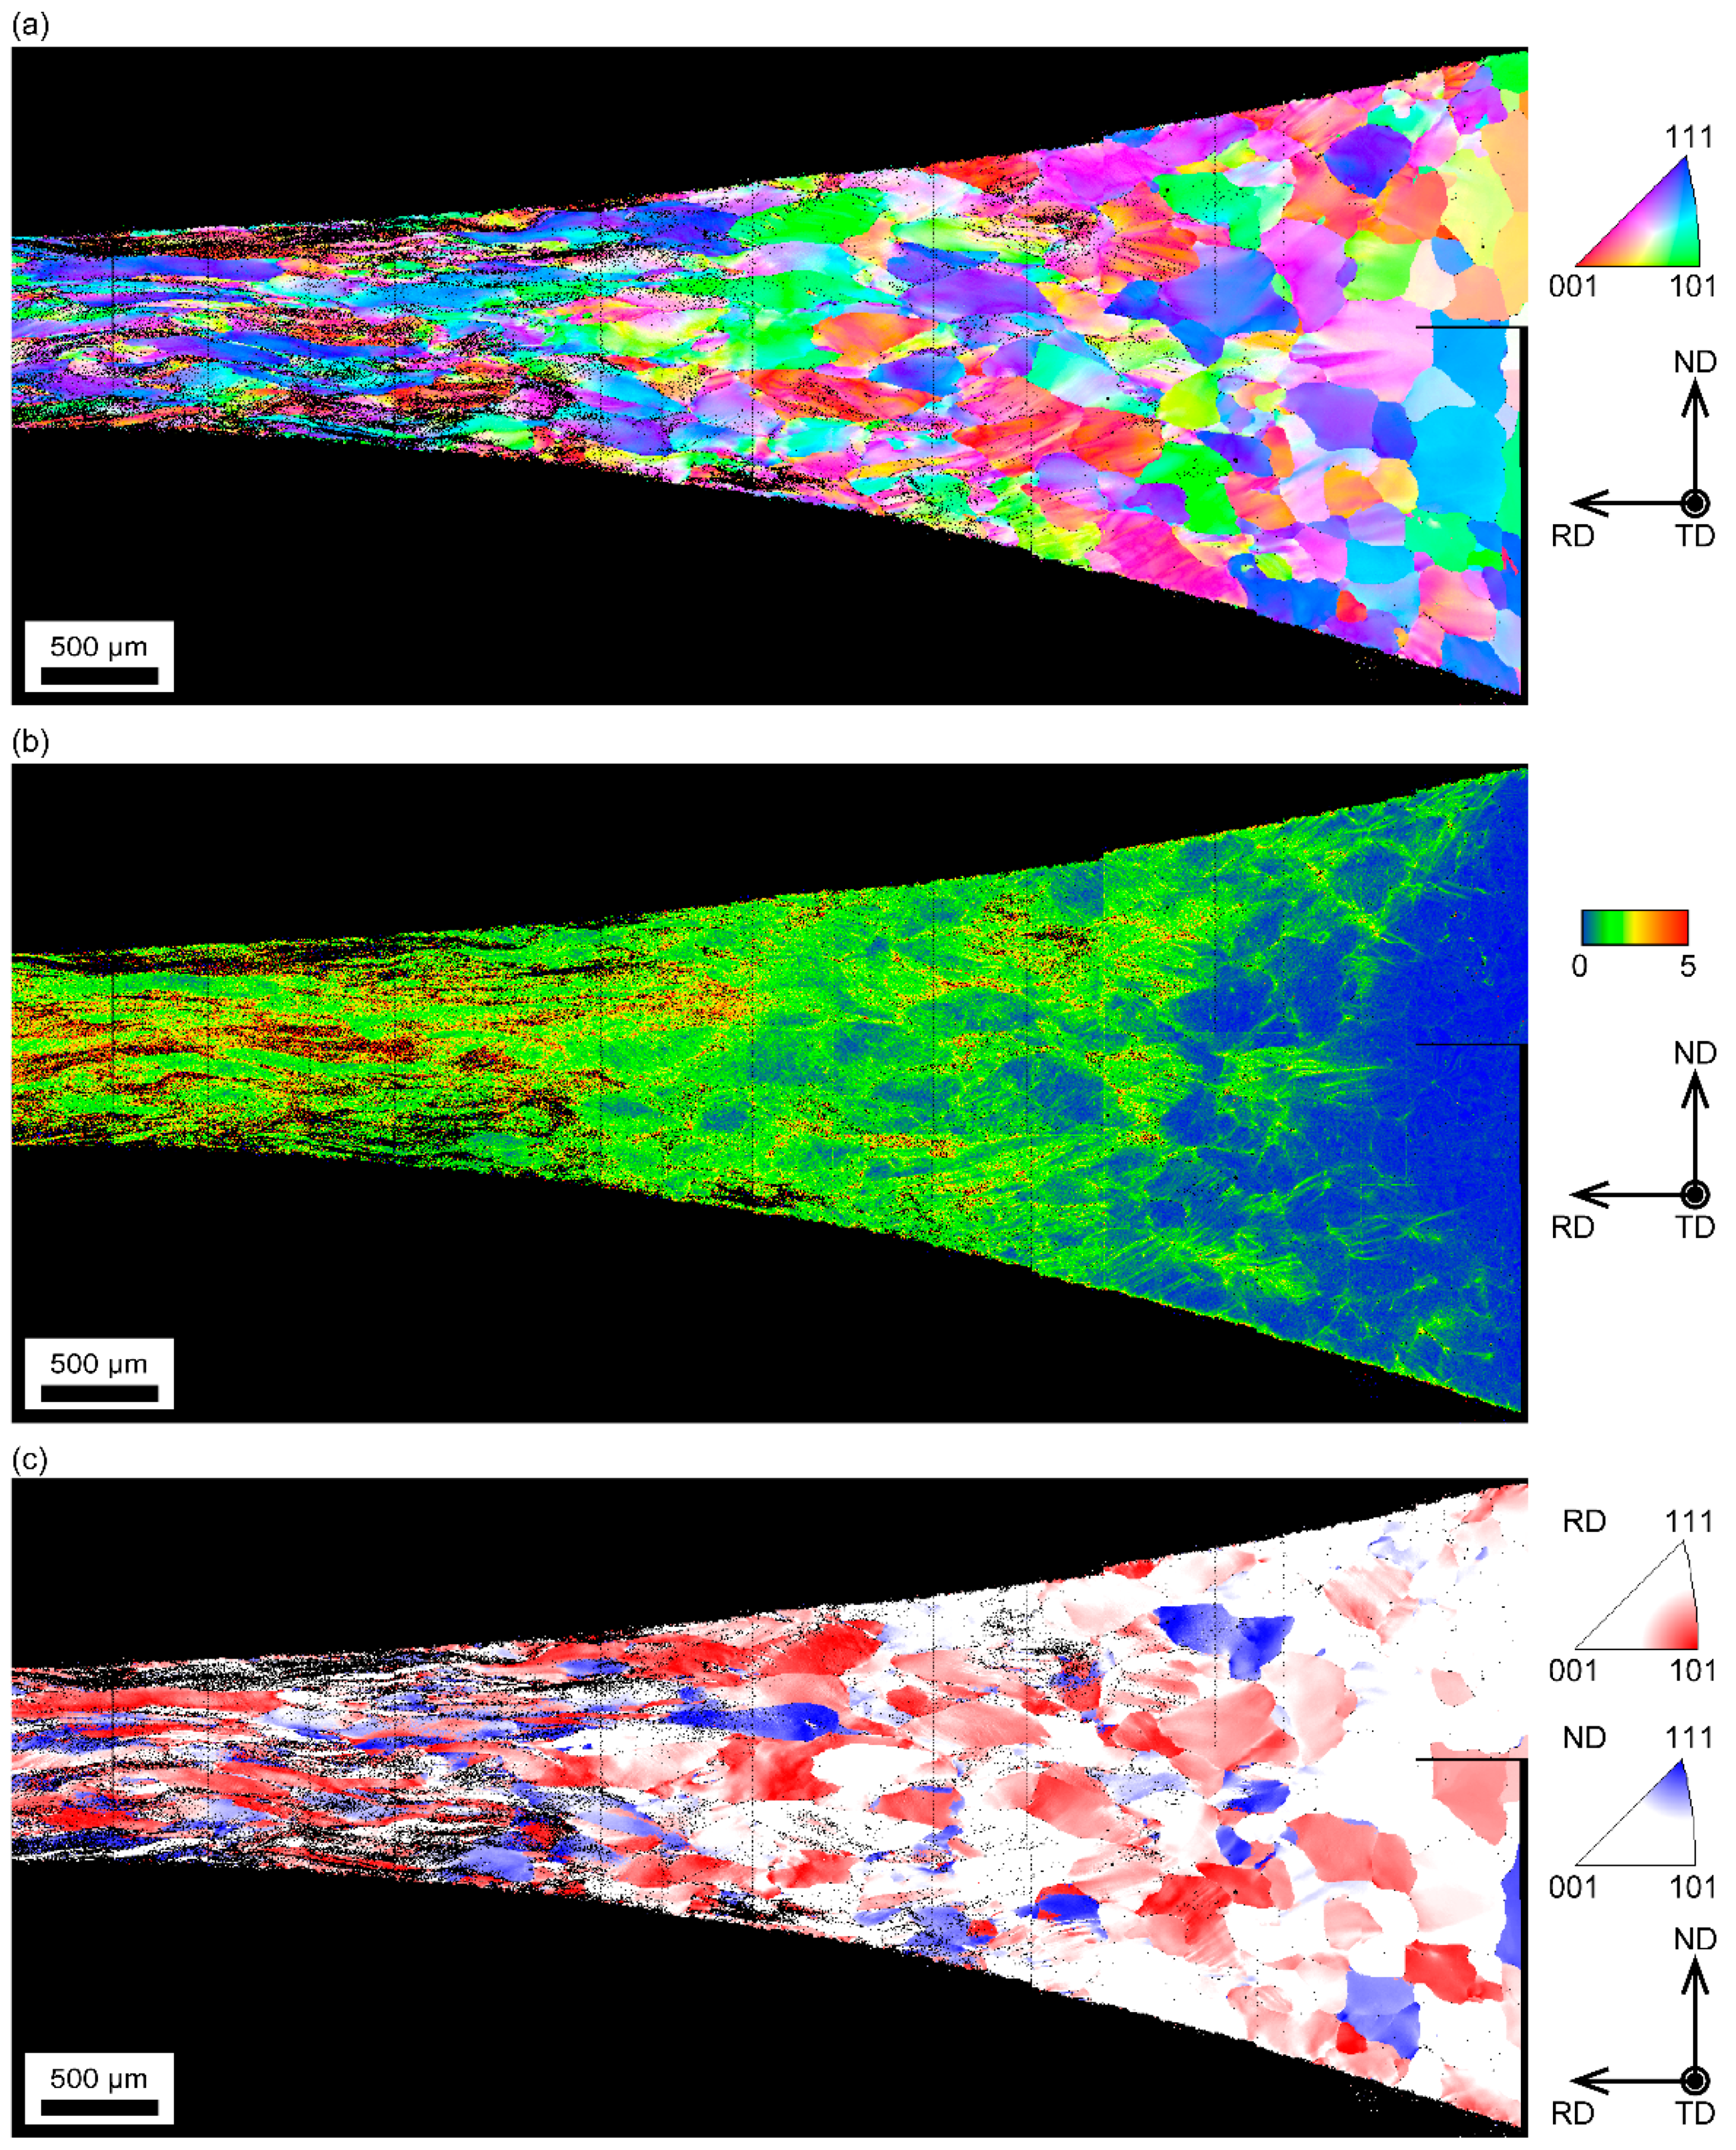
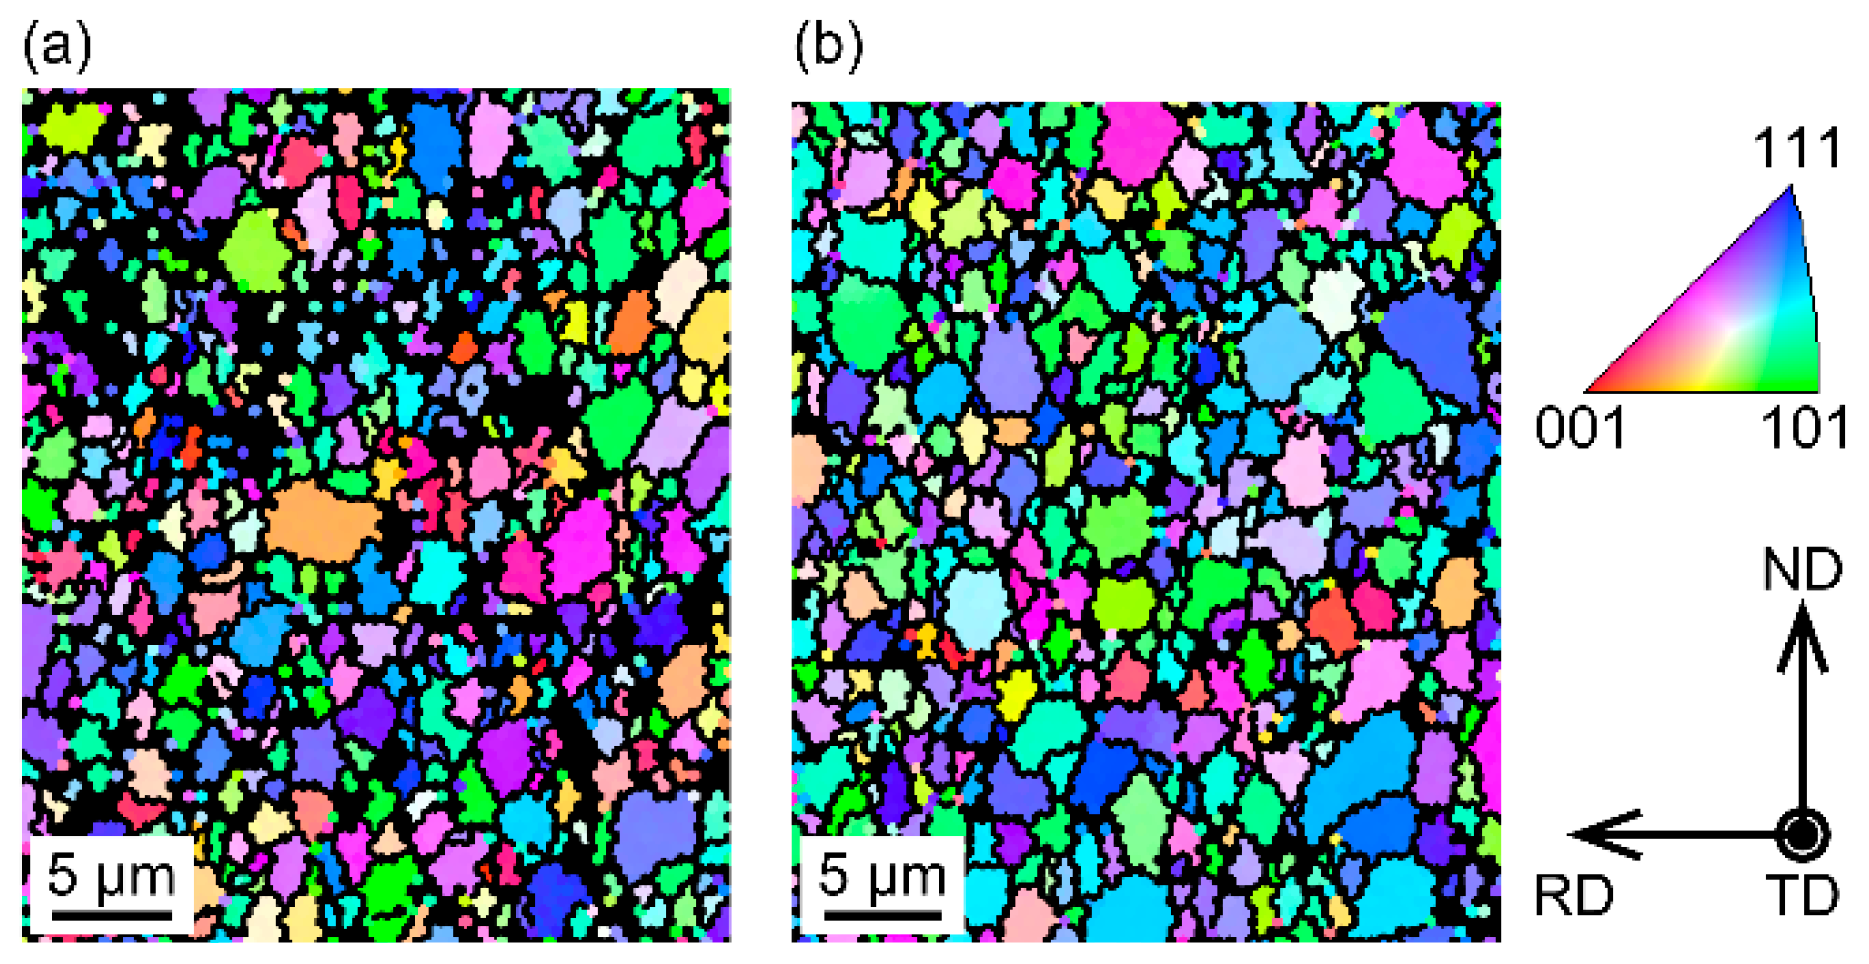
3.1.1. Deformed Microstructure

Figure 2 shows inverse pole figure (IPF) maps in the TD of the chip before heat treatment; Figure 2a shows the IPF map near the center of the chip in the thickness direction and Figure 2b shows the IPF map near the rakeface. It was found that ultrafine grains with an average diameter of 0.2 µm were generated. Interestingly, the grains in Figure 2a were elongated in the ND, which is almost parallel to the shear plane, whereas those in Figure 2b were elongated in the RD, which is almost parallel to the rakeface. This is because of the friction between the chip and the rakeface. Figure 3 shows kernel average misorientation (KAM) maps of the chip. The KAM value is defined as the average local misorientation angle within a grain, which has been reported to be related to the dislocation density [28]. It is considered that these high-KAM zones represent footprints of slip deformation. In Figure 3, most of the area is colored blue, and it is found that the KAM value is relatively small in the chip, although a large shear strain is applied. A relatively high-KAM zone exists in the elongated grains of a chip. This is where dislocations are concentrated and form an incidental dislocation boundary (IDB). Although the misorientation angle of the IDB is small, it subdivides the elongated grains into ultrafine grains. This is considered as the mechanism for producing ultrafine grains by cutting. This grain subdivision phenomenon is known to be a general mechanism of cold deformation. In a grain subdivision process, dislocations form IDBs with low misorientation angles and geometrically necessary boundaries (GNBs) with high misorientation angles [29,30]. IDBs are formed to reduce the elastic energy of stored dislocations in a grain and GNBs are formed to maintain consistency with misorientations arising from different slip system activations.
Figure 4 shows IPF maps in the TD of the rolled specimen before heat treatment: Figure 4a,b show maps at different positions in the thickness direction. The coordinate system of ND-RD-TD corresponds to the normal direction of the rolled surface, the rolling direction, and the transverse direction, respectively. Ultrafine grains of average diameter 0.4 µm are observed in Figure 4a, but the grain size shown in Figure 4b is much larger than 10 µm in diameter. The grain size is evidently uneven in the rolled specimen. KAM maps of the same area as in Figure 4 are shown in Figure 5. Relatively high-KAM zones in the rolled specimen, which are indicated by green or yellow, are larger than those in the chip shown in Figure 3. This indicates that more dislocations remained in the grains of the rolled specimen. In the area of fine grains (Figure 5a), high-KAM zones subdivide elongated grains. This structure is similar to that of the chip (Figure 3) and, therefore, ultrafine grains were generated by the same mechanism with cutting and subdivision by dislocation. By contrast, in the coarse-grained area (Figure 5b), high-KAM zones form a network and divide the coarse grains. However, the size of the divided area is much larger than those shown in Figure 5a. These results indicate that the deformed microstructure of a rolled specimen is highly non-uniform compared with that of a chip specimen.
Figure 6a shows an IPF map for the TD of the half-rolled specimen. It is observed that some grains were divided into small subgrains, whereas some grains were not divided but elongated in the rolling direction. Figure 6b shows a KAM map of the half-rolled specimen. The KAM values of these grains were smaller than those of the subdivided grains. This suggests that GNBs that have large misorientations and are generated by multiple slip system activation have not been constructed in these elongated grains. Figure 6c shows a crystal direction map for <011>//RD and <111>//ND of the half-rolled specimen. In the crystal direction map, grains of <011>//RD are indicated in red and those of <111>//ND are indicated in blue, as shown in the reference triangles. By comparing Figure 6a,c, it is found that elongated grains are aligned in the <011>//RD or <111>//ND; this alignment is known as a cold rolling texture [31]. It is considered that slip systems in grains of <011>//RD or <111>//ND were not activated as much as those in grains of other orientations. The dislocation density did not increase in these grains, and they were not subdivided. As a result, grains of these orientations remained large, and other grains were divided into small subgrains. This was because the plastic deformation zone in rolling was much larger than the grain size, and the strain in each grain depended on the crystal orientation, i.e., the orientation of slip systems. Because grains of small Taylor factors were difficult to deform, grains of large Taylor factors were deformed preferentially.
Although the plastic strain of the chip specimens was less than that of the rolled specimens, the chip specimens were more finely divided into subgrains than the rolled specimens. In addition, the shear strain applied by cutting was not as large as that applied in previous studies on ultrafine grains ( ϵ ¯ 10 ) [29], but in the cutting experiments, the grains were completely subdivided into submicron grains. This was attributed to the size of the plastic deformation zone.
During rolling, the contact length between a roller and the specimen was approximately 7.3 mm, and the crystal grains between the rollers were deformed plastically by compressive stress. The size of the plastic deformation zone was much larger than the average grain diameter as shown in Figure 7a. The contact surface between the rollers and the specimen was the displacement boundary and, thus, crystal grains in the zone were deformed by the interaction of stress. The Schmid factors of the slip systems against the compressive direction (thickness direction) in each grain depended on the crystal orientation and, thus, the yield stress and plastic strain differed with the grains as seen in the half-rolled specimen. In addition, it is considered that grain boundary plays an important role in crystal grain deformation. One mechanism is multiple slip system activation in the vicinity of grain boundaries [32,33]. It is expected to induce dislocation multiplication and restrict internal deformation of grains. Another is sliding on the grain boundary. Sliding on the grain boundary is usually observed in the hot forming process wherein grain boundary diffusion is activated [34,35]. It is supposed to allow crystal rotation on the grain boundaries so that in-grain distortion was reduced. These mechanisms lead to heterogeneous deformation of grains in a rolled specimen.
By contrast, the shear deformation by cutting caused rapid shear strain in the shear plane, and the boundary condition of cutting was different from that of rolling. The thickness of the shear plane in this cutting experiment was estimated to be approximately 24 µm as calculated by Equation (6), where the ratio of the thickness of the shear plane Δ S to the length of the shear plane was assumed to be 6, based on Usui’s report [36].
t 0 Δ S sin ϕ = 6 Δ S 0.024   mm = 24   μ m
This was much smaller than the average grain diameter (83 µm) of the work material. It was considered that the shear plane passed through the grains of the material, and each grain was deformed equally by shear deformation as shown in Figure 7b. Because the outsides of the shear plane were elastic regions, they acted as the deformation boundary that constrained the shear deformation of the grains. The influence of the constraint boundary on grain deformation was larger than that of the interaction between grains, and shear deformation in each grain became almost uniform. As a result, grains are uniformly subdivided into ultrafine grains with severe plastic deformation.
Another possible reason for the difference of grain deformation between rolling and cutting is the difference in the strain rate. The average strain rate of plate rolling was calculated using the following equation proposed by Sims [37]:
ϵ r ˙ ¯ = 2 π N r 60 r r o l l R r o l l H 1 ln 1 1 r r o l l ϵ r ˙ ¯ 6.87   s 1
where N r is the rolling speed (rpm), r r o l l is the thickness reduction ratio, and R r o l l is the radius of the roller. By contrast, the shear strain rate in cutting was calculated as follows [36]:
ϵ c ˙ = 1 Δ S γ V c sin ϕ ϵ c ˙ 2.8 × 10 4   s 1
where V c is the cutting speed. Strain rate in cutting is significantly larger than that in rolling, and it is considered to cause different deformation mechanism of grains. For example, it is known that dynamic recovery affects dislocation storage when a material is deformed under high strain rate, especially in pure metals [29,38]. However, the effect of strain rate in the experiments in this paper is not apparent, and it should be studied in the future work.

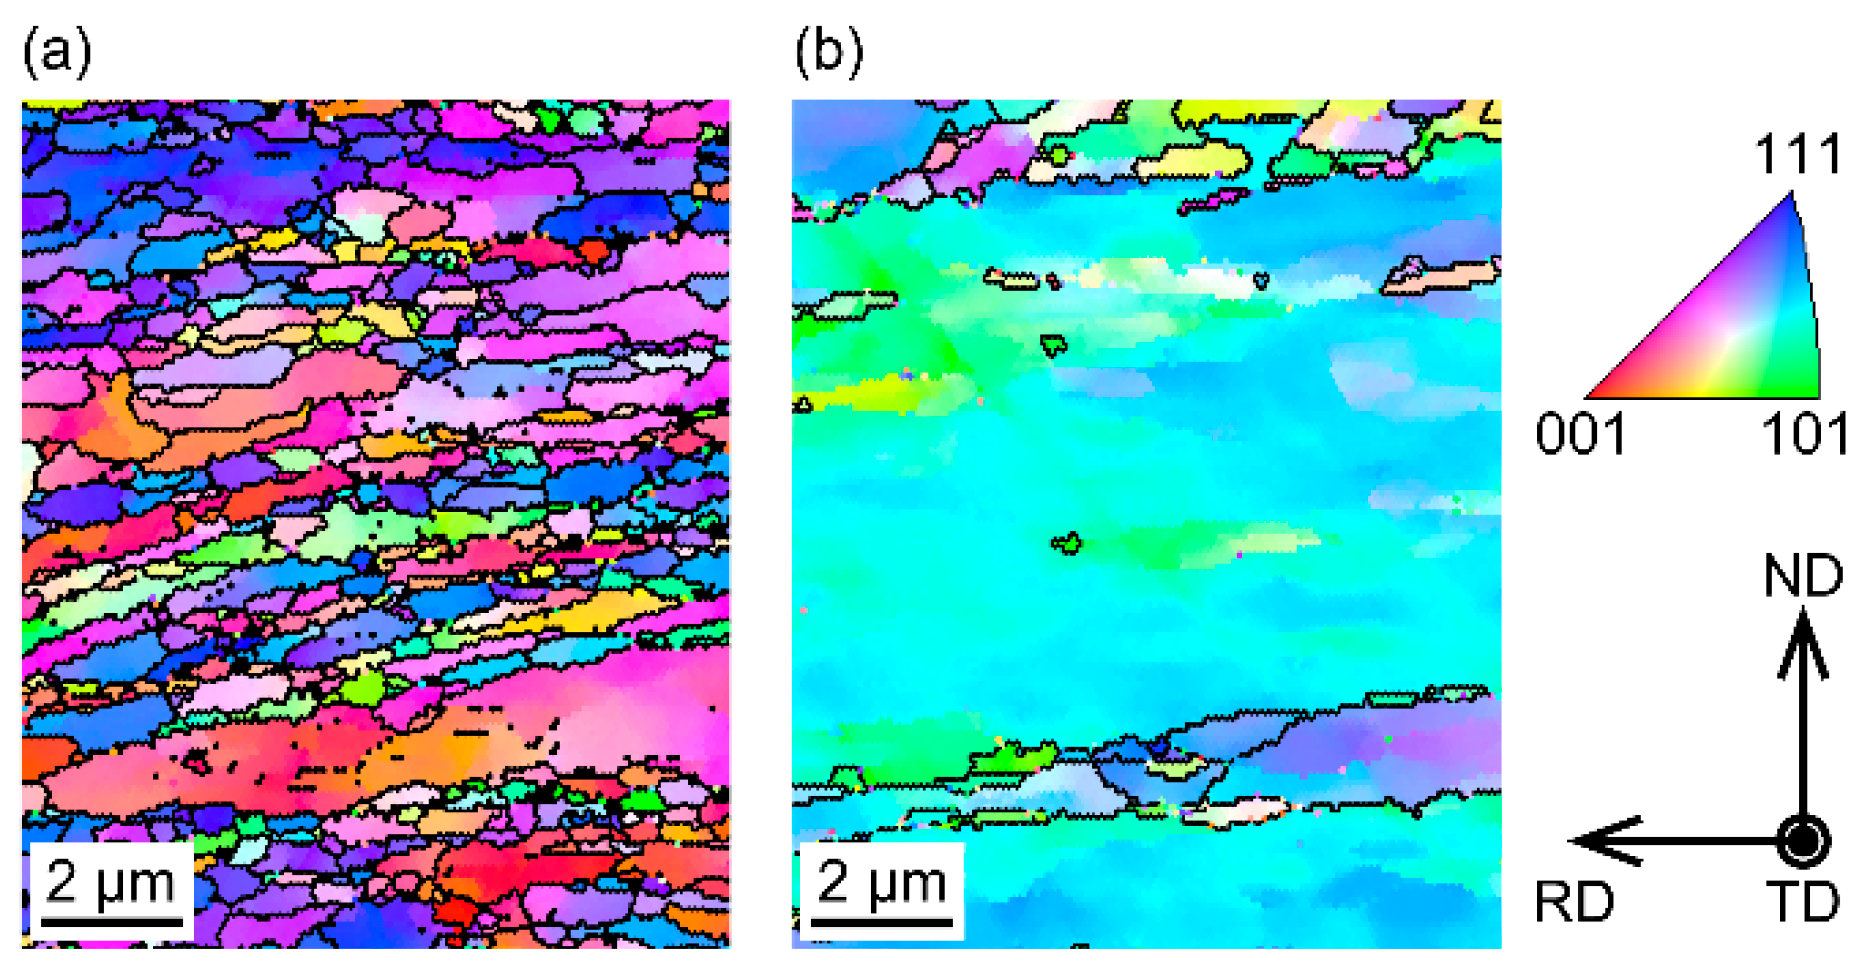
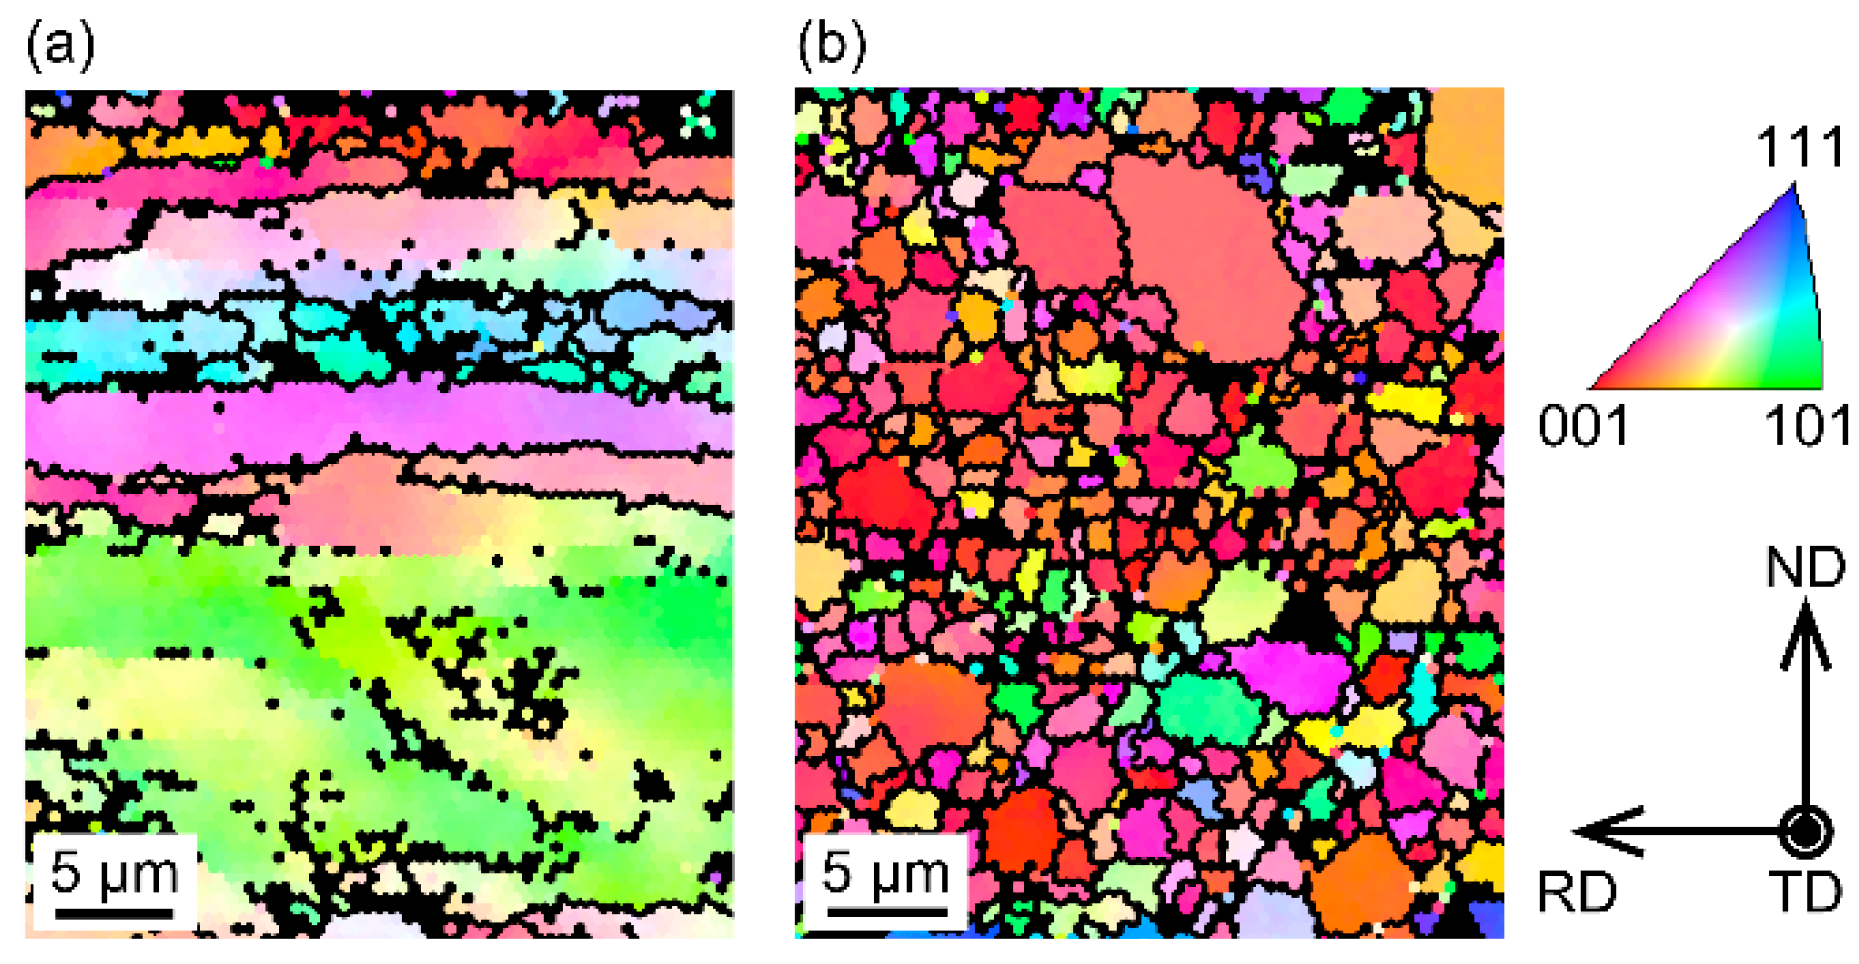
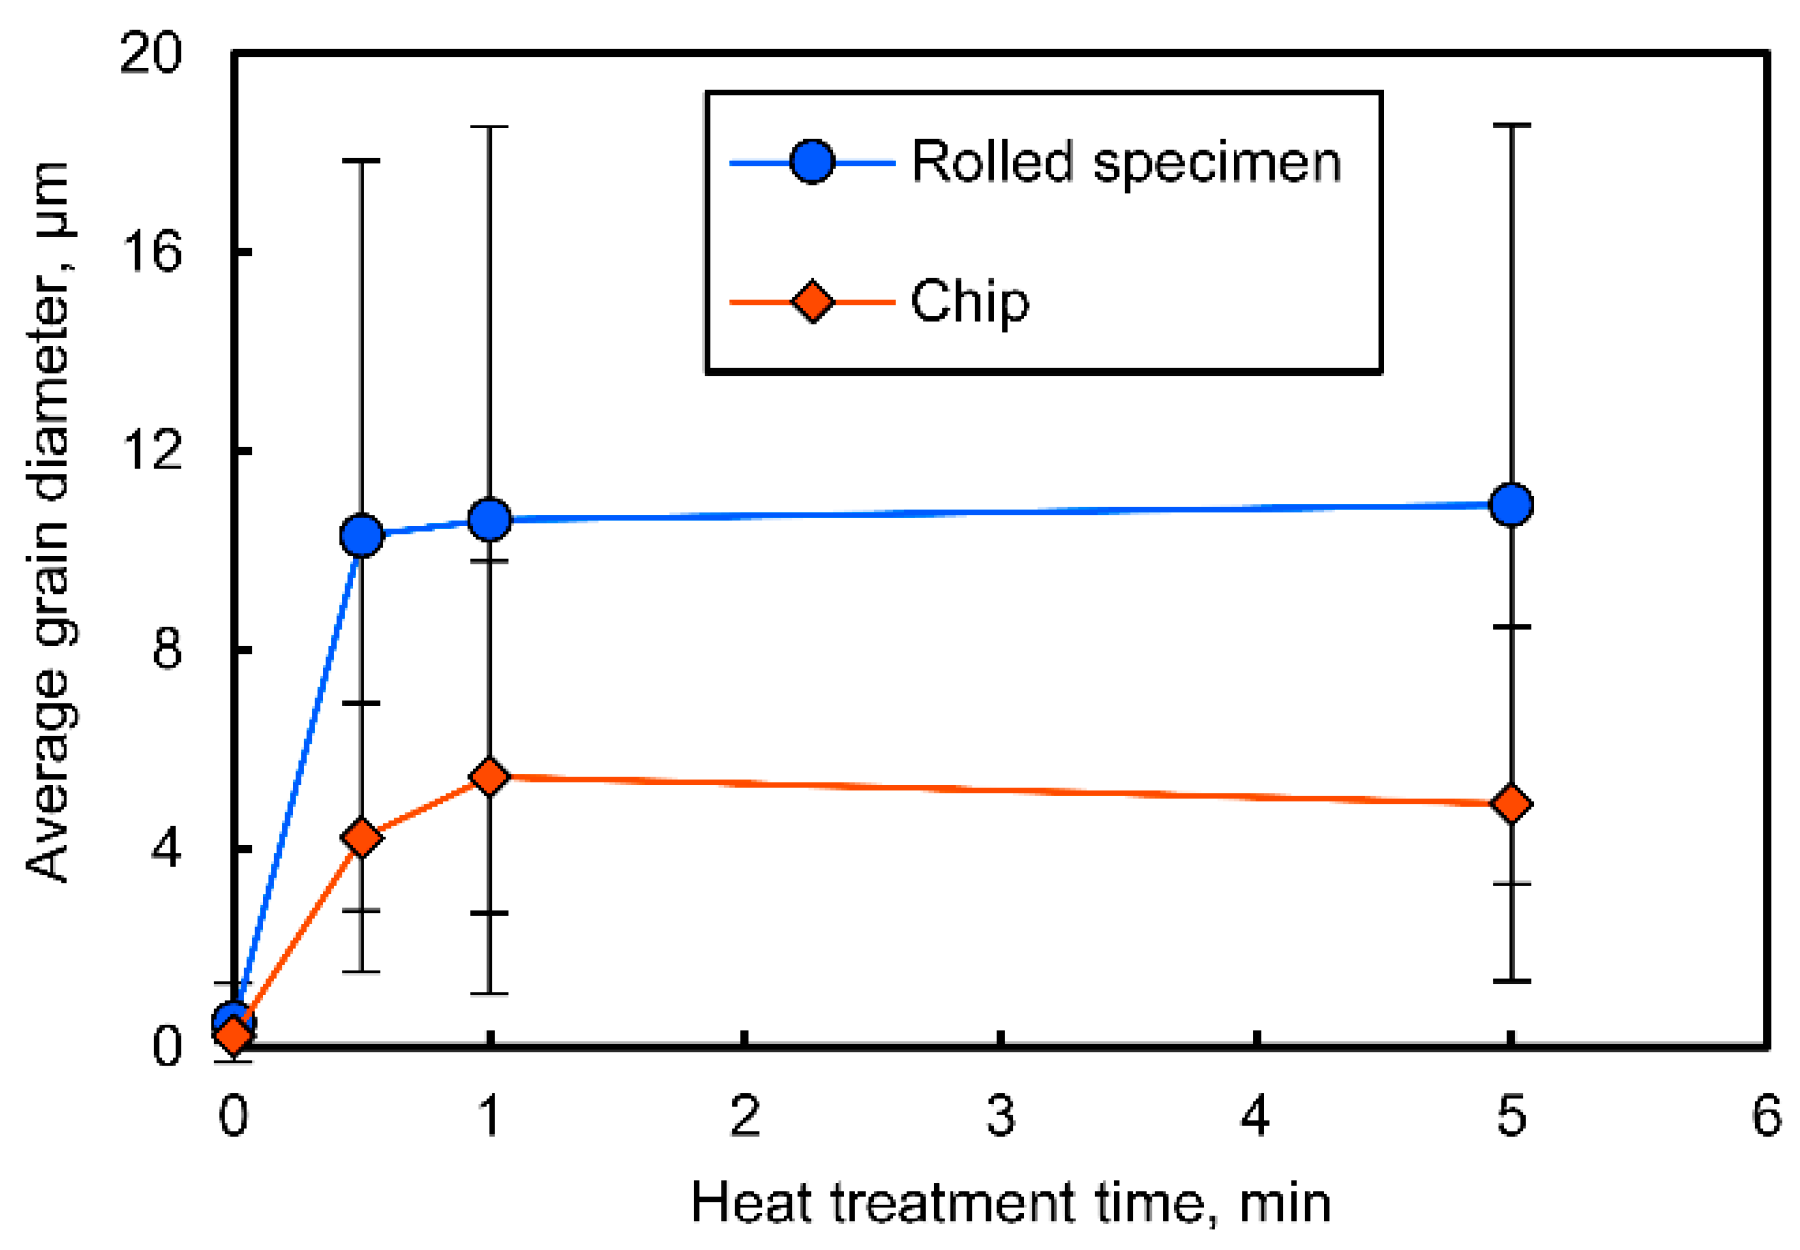
3.1.2. Recrystallized Microstructure

Figure 8a shows the IPF map of a chip after heat treatment at 500 °C for 1 min and Figure 8b shows the IPF map after 5 min. Figure 9 shows the IPF maps of the rolled specimen after heat treatment under the same conditions. In general, the recrystallization temperature is approximately half of the melting point, and in the case of iron, it is below 500 °C [30]. At low temperatures, recrystallization proceeded slowly and the grains retained their size small. The recrystallized grains of the chip were uniformly small, and the average grain diameter was approximately 1.2 µm, as shown in Figure 8a. Although the average grain size of the rolled specimen shown in Figure 9a was also small (approximately 1.8 µm in diameter), the grain size was uneven. Recrystallization was considered to proceed uniformly throughout the specimen, because the grains deformed uniformly and the stored energy was distributed equally. However, because the deformation of rolling was different in different grains, the recrystallization speed also seemed to vary among the grains. After heat treatment for 5 min, as shown in Figure 9b, most grains had already recrystallized, but the grain size was still uneven. It was thought that the grain growth rate of recrystallized grains was low because the atomic diffusion rate was low at 500 °C, and the fine grains remained unencroached upon.
Figure 10 shows IPF maps of a chip specimen after heat treatment at 600 °C, and Figure 11 shows those of a rolled specimen. The average grain diameter of the chip specimen after heat treatment at 600 °C for 5 min was approximately 4.9 µm, and that of the rolled specimen was approximately 6.7 µm. Recrystallized grains grew much faster at 600 °C than at 500 °C, and some grains grew larger by consuming other small grains. The variation in grain size through heat treatment at 600 °C is shown in Figure 12. The error bars in the figure indicate the standard deviations of grain size under each condition. It was confirmed that the grain size of the chip specimens was clearly smaller than that of the rolled specimens. The grain size dispersion was also smaller in the chip specimens than in the rolled specimens. It was supposed that the recrystallization process, i.e., nucleation and grain growth, was affected by the strain distribution in the grains accumulated in the plastic formation process. In the chip specimen where grains were uniformly deformed, nucleation occurred uniformly in the specimen, and the grain growth rate was almost constant. As a result, uniform and fine grains were generated. By contrast, in the rolled specimen, nucleation occurred mainly in the subdivided grains, and grain growth stopped within a short time. Meanwhile, the density of nucleation was less in the coarse grains, and they grew significantly. As a result, the size of the recrystallized grains was unevenly distributed in the rolled specimen.

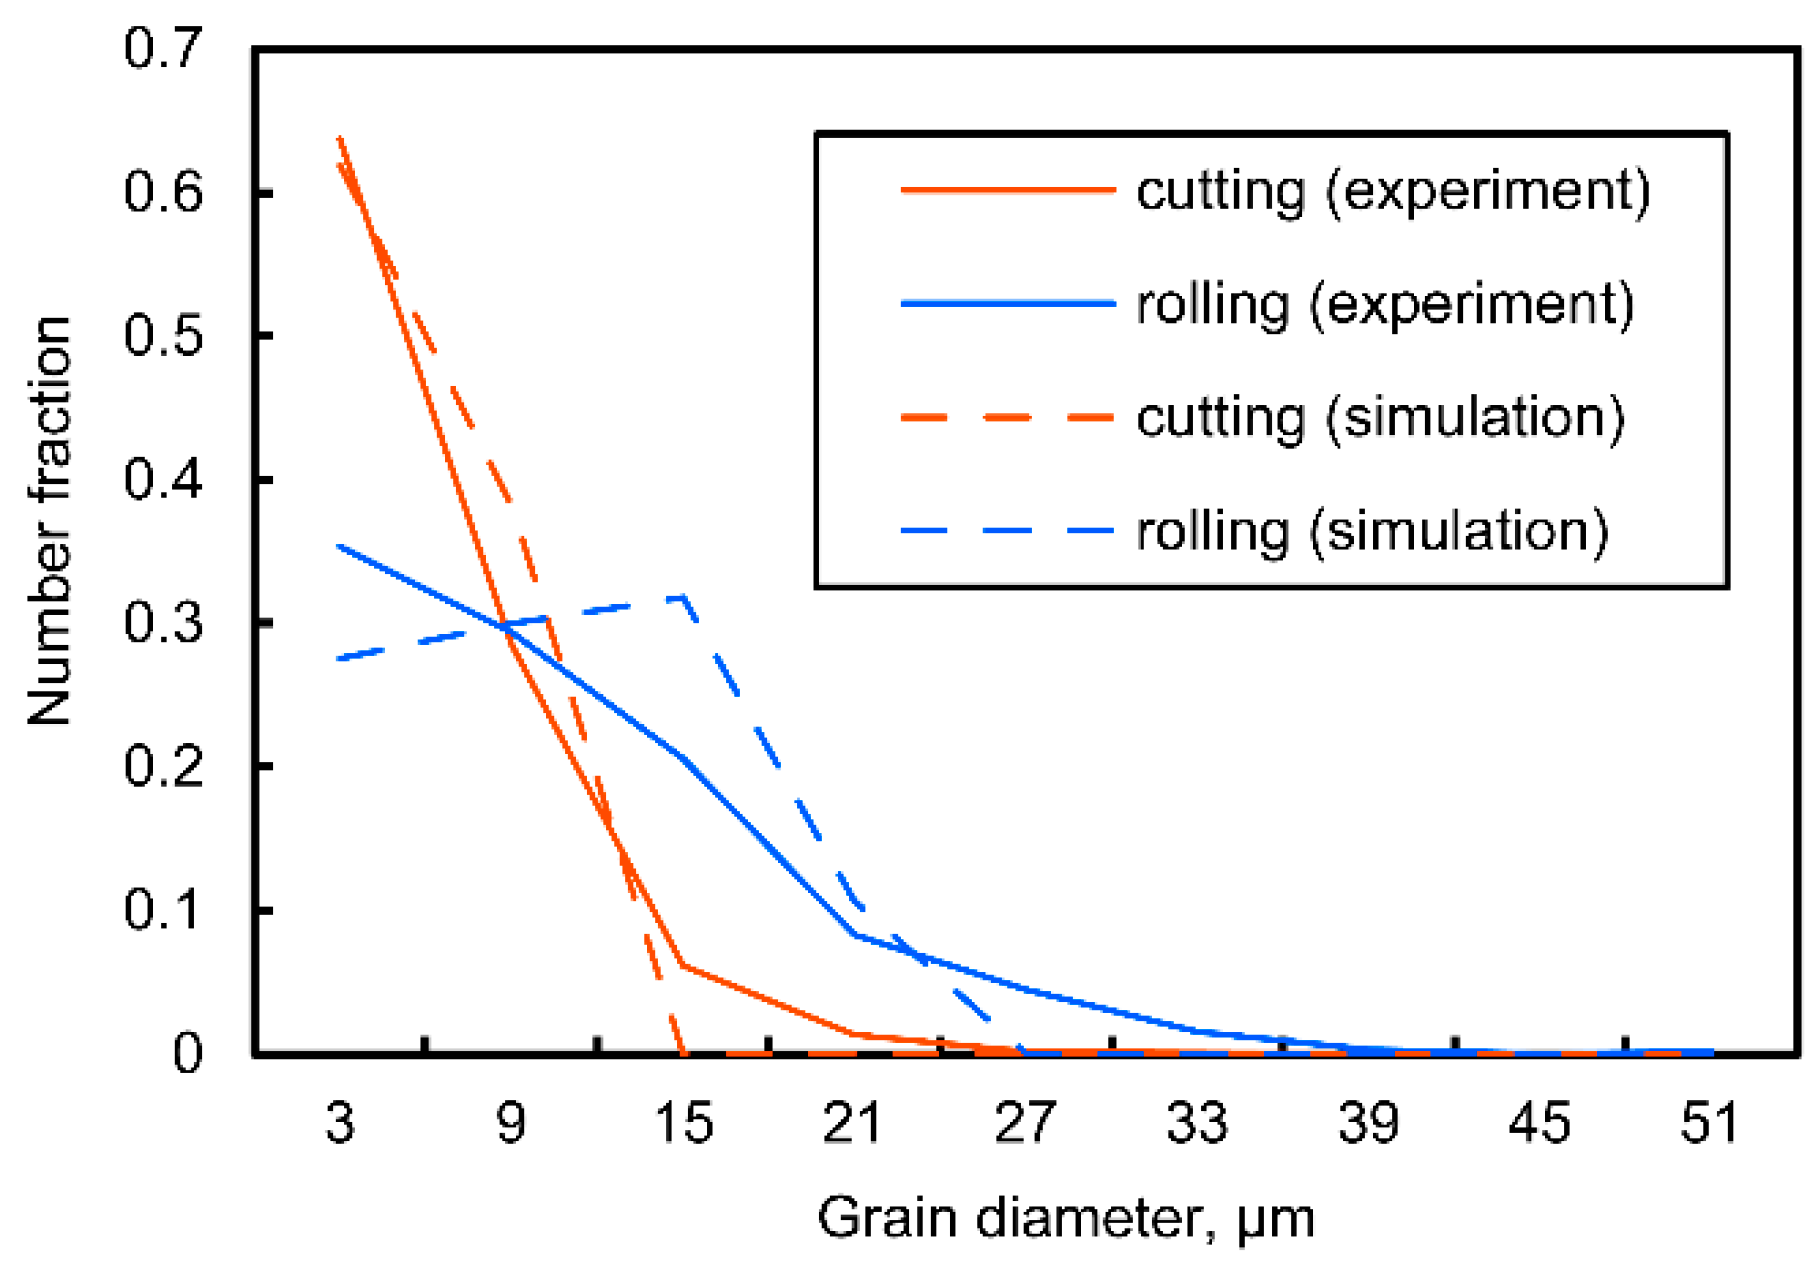
3.2. Simulation Results and Discussion

The parameters C d , C ρ , and C g were determined by fitting curves to the experimental results, as shown in Figure 13. In Figure 13, the solid curves represent the simulated variation of grain size using an optimized value of C g , and the dashed curves represent those using different values of C g . Because C g is a parameter of the grain growth rate, it does not depend on the deformed microstructure. The value of C g is determined such that the calculated curves agree with both the cutting and rolling results. C ρ is a parameter of the recovery rate, and it depends on the annealing temperature. C d depends on the deformed microstructure, because it is the ratio of the distance of the dislocation movement to the grain diameter in a large-misorientation area. When the material is deformed uniformly into fine grains like a chip specimen, dislocations construct grain boundaries. Almost all grains after deformation are formed by dislocation movement or multiplication. In this case, the distance of the dislocation movement is close to the grain size and hence, C d increases. On the contrary, when the deformation differs in each crystal grain, as seen in the rolled specimen, the dislocations in a large grain do not construct grain boundaries. The distance of the dislocation movement in a large-misorientation area where grains are subdivided into fine grains is smaller than the average grain size, wherein large grains with low misorientation are included. Thus, C d decreases during uneven deformation. Table 4 lists the optimized C d , C ρ , and C g determined by similar curve fitting.
Figure 14 compares the distributions of the recrystallized grain size of the chip and rolled specimens. The solid curves represent experimental data obtained from the EBSD analysis, and the dashed curves show the simulated results. Although the parameters were determined by curve fitting to the average grain size, the simulated results agree well with the experimental results. It can be surmised that this model accurately represents the static recrystallization process.
Figure 15 shows simulated recrystallization ratios for the chip and rolled specimens. Although the strain applied to the chip specimen was smaller than that to the rolled specimen, the recrystallization rate in the chip specimen was faster than that in the rolled specimen. This was because nucleation and grain growth were more active in the chip specimen. Table 5 summarizes the characteristics of each recrystallization process obtained from the simulation, where the chip and rolled specimens were annealed at 600 °C. The difference in the deformation characteristics between the chip and rolled specimens was represented by the ratio of the high-misorientation-angle area, wherein the misorientation angle was larger than 15°, constructed by GNBs. Because nucleation occurs actively in the high-misorientation-angle area, a difference in the ratio resulted in a difference in the number of recrystallized grains. Meanwhile, the grain growth rate depends on the stored energy, and the high-misorientation-angle area had little influence on the grain growth rate. Because the ratio of the low-misorientation-angle area was much larger than that of the high-misorientation-angle area, the stored energy in the low-misorientation-angle area affected the average diameter of the recrystallized grains. The recrystallization rate and the number of recrystallized grains depended on the high-misorientation-angle area, and the grain growth rate during recrystallization depended on the stored energy. Therefore, it is concluded that the distribution of the high-misorientation-angle area is a critical factor for obtaining fine and uniform recrystallized grains. In the chip specimen, because the high-misorientation-angle area was uniformly distributed as GNBs, several nuclei were formed simultaneously, and each nucleus could not grow significantly, owing to the collision of recrystallized grains.
Figure 16 shows simulated results of the effects of plastic strain applied by cutting via static recrystallization at 600 °C. The parameters in Table 3 and Table 4 were used for the simulation. With increasing shear stain, the recrystallization rate increased as shown in Figure 16a, but the recrystallized grain size decreased as shown in Figure 16b. It is considered that the number of nuclei increases with increasing shear strain because the energy stored in the large-misorientation area increases. This result indicates that larger shear strain is effective for generating ultrafine recrystallized grains. When the shear strain was 4.5, recrystallized grains grew to only 1 µm in diameter. The shear strain of 4.5 in the chip specimen is obtained by controlling the rake angle, such as a rake angle of −10° and a shear angle of 14°. The effect of thickness reduction in rolling was simulated, as shown in Figure 17. The same trend is observed here as for cutting, wherein the average grain diameter of recrystallized grains decreases with increasing thickness reduction. In the case of the production of ultrafine-grained steel with 1 µm diameter by rolling, it is necessary to reduce the thickness up to 96% by cold rolling, such as from 10 to 0.4 mm in thickness. However, it is difficult to achieve this condition in a practical rolling process. Therefore, the cutting method is more useful to produce ultrafine grains.

4. Conclusions

The influence of plastic deformation on microscopic plastic strain in grains and on static recrystallization was studied. The conclusions are summarized as follows:
  • In the cutting process, the grains of a chip specimen were uniformly subdivided into ultrafine grains by severe shear deformation with a high strain rate in the thin shear plane. Meanwhile, in the rolling process, the deformation of grains in a rolled specimen was significantly affected by crystal orientation, and the plastic deformation of grains was uneven in comparison with that in the chip specimen. Several grains were elongated along the rolling direction, but they were not subdivided, although a large strain was applied to the work material.
  • A theoretical model was developed, and it was revealed that the number of recrystallized grains depended on the fraction of the large-misorientation area constructed with GNBs. Uniform plastic deformation of a chip specimen caused a high-misorientation-angle area, and more nucleation of static recrystallization occurred than in the rolled specimen.
  • It was demonstrated that the cutting process was more advantageous than rolling in producing ultrafine recrystallized grains because cutting could apply severe plastic strain uniformly on a work material and effectively generate GNBs.

Author Contributions

Conceptualization: F.N. and M.Y.; methodology: F.N. and M.Y.; formal analysis: F.N.; investigation: F.N. and Y.N.; writing—original draft preparation: F.N.; writing—review and editing: Y.N. and M.Y.; supervision, Y.N. and M.Y.; project administration, F.N. and M.Y.; funding acquisition, M.Y. All authors have read and agreed to the published version of the manuscript.

Funding

This research was funded by the AMADA FOUNDATION, grant number AF-201910-B2.

Conflicts of Interest

The authors declare no conflict of interest.

References

  1. Buchmayr, B. Thermomechanical Treatment of Steels—A Real Disruptive Technology Since Decades. Steel Res. Int. 2017, 88, 14. [Google Scholar] [CrossRef]
  2. Maki, T.; Furuhara, T.; Tsuji, N.; Morito, S.; Miyamoto, G.; Shibata, A. Thermomechanical Processing of Steel—Past, Present and Future. Tetsu Hagane 2014, 100, 1062–1075. [Google Scholar] [CrossRef] [Green Version]
  3. Tsuji, N. Ultrafine Grained Steels. Tetsu Hagane 2002, 88, 359–369. [Google Scholar] [CrossRef] [Green Version]
  4. Xia, Z.S.; Kang, Y.L.; Wang, Q.L. Developments in the production of grain-oriented electrical steel. J. Magn. Magn. Mater. 2008, 320, 3229–3233. [Google Scholar] [CrossRef]
  5. Komatsu, T.; Matsumura, T.; Torizuka, S. Effect of Grain Size in Stainless Steel on Cutting Performance in Micro-Scale Cutting. Int. J. Autom. Technol. 2011, 5, 334–341. [Google Scholar] [CrossRef]
  6. Komatsu, T.; Kobayashi, H.; Torizuka, S.; Nagayama, S. Micro Hole Piercing for Ultra Fine Grained Steel. Int. J. Autom. Technol. 2012, 6, 802–808. [Google Scholar] [CrossRef]
  7. Komatsu, T. Effects of Grain Size on the Groove Depths in Microlaser Cutting of Austenitic Stainless Steel SUS304. Int. J. Autom. Technol. 2015, 9, 636–645. [Google Scholar] [CrossRef]
  8. Torizuka, S.; Muramatsu, E.; Komatsu, T.; Nagayama, S. Production processes for nanostructured wires, bars and strips. In Nanostructured Metals and Alloys: Processing, Microstructure, Mechanical Properties and Applications; Whang, S.H., Ed.; Woodhead Publ Ltd.: Cambridge, UK, 2011; pp. 715–746. [Google Scholar]
  9. Azushima, A.; Kopp, R.; Korhonen, A.; Yang, D.Y.; Micari, F.; Lahoti, G.D.; Groche, P.; Yanagimoto, J.; Tsuji, N.; Rosochowski, A.; et al. Severe plastic deformation (SPD) processes for metals. Cirp Ann. Manuf. Technol. 2008, 57, 716–735. [Google Scholar] [CrossRef]
  10. Segal, V.M. Materials processing by simple shear. Mater. Sci. Eng. A Struct. Mater. Prop. Microstruct. Process. 1995, 197, 157–164. [Google Scholar] [CrossRef]
  11. Segal, V.M.; Reznikov, V.I.; Drobyshevskiy, A.E.; Kopylov, V.I. Plastic working of metals by simple shear. Russ. Metall. 1981, 1, 99–105. [Google Scholar]
  12. Bridgman, P.W. Effects of High Shearing Stress Combined with High Hydrostatic Pressure. Phys. Rev. 1935, 48, 825–847. [Google Scholar] [CrossRef]
  13. Erbel, S. Mechanical properties and structure of extremely strainhardened copper. Met. Technol. 1979, 6, 482–486. [Google Scholar] [CrossRef]
  14. Saito, Y.; Tsuji, N.; Utsunomiya, H.; Sakai, T.; Hong, R.G. Ultra-fine grained bulk aluminum produced by accumulative roll-bonding (ARB) process. Scr. Mater. 1998, 39, 1221–1227. [Google Scholar] [CrossRef]
  15. Nagashima, F.; Yoshino, M.; Terano, M. Microstructure control of pure iron by utilizing metal cutting method. Procedia Manuf. 2018, 15, 1541–1548. [Google Scholar] [CrossRef]
  16. Nagashima, F.; Nakagawa, Y.; Yoshino, M. Study on effects of strong shear strain on recrystallized grain size of pure iron and microstructure control method. Procedia Manuf. 2020, 50, 248–252. [Google Scholar] [CrossRef]
  17. Baumeister, T. Standard Handbook for Mechanical Engineers, 7th ed.; McGraw-Hill: New York, NY, USA, 1967. [Google Scholar]
  18. Yoshida, S. Kaifukuto Saikessho. In Ten’iron: Sono Kinzokugakuheno Ouyo, Materials; The Japan Institute of Metals and Materials, Ed.; Maruzen Co., Ltd.: Tokyo, Japan, 1971; pp. 227–275. [Google Scholar]
  19. Read, W.T.; Shockley, W. Dislocation Models of Crystal Grain Boundaries. Phys. Rev. 1950, 78, 275–289. [Google Scholar] [CrossRef]
  20. Byrne, J.G. Recovery, Recrystallization, and Grain Growth; Macmillan: London, UK, 1965. [Google Scholar]
  21. Johnson, W.A.; Mehl, R.F. Reaction kinetics in processes of nucleation and growth. Trans. Am. Inst. Min. Metall. Eng. 1939, 135, 416–442. [Google Scholar]
  22. Avrami, M. Kinetics of phase change I—General theory. J. Chem. Phys. 1939, 7, 1103–1112. [Google Scholar] [CrossRef]
  23. Avrami, M. Kinetics of Phase Change. II Transformation-Time Relations for Random Distribution of Nuclei. J. Chem. Phys. 1940, 8, 212–224. [Google Scholar] [CrossRef]
  24. Avrami, M. Granulation, Phase Change, and Microstructure—Kinetics of Phase Change. III. J. Chem. Phys. 1941, 9, 177–184. [Google Scholar] [CrossRef]
  25. Turnbull, D. Theory of Grain Boundary Migration Rates. J. Met. 1951, 3, 661–665. [Google Scholar] [CrossRef]
  26. Lübbehusen, M.; Mehrer, H. Self-diffusion in α-iron: The influence of dislocations and the effect of the magnetic phase transition. Acta Metall. Mater. 1990, 38, 283–292. [Google Scholar] [CrossRef]
  27. Buffington, F.S.; Hirano, K.; Cohen, M. Self diffusion in iron. Acta Metall. 1961, 9, 434–439. [Google Scholar] [CrossRef]
  28. Umezaki, S.; Murata, Y.; Nomura, K.; Kubushiro, K. Quantitative Analysis of Dislocation Density in an Austenitic Steel after Plastic Deformation. J. Jpn. Inst. Met. Mater. 2014, 78, 218–224. [Google Scholar] [CrossRef] [Green Version]
  29. Hansen, N. New discoveries in deformed metals. Metall. Mater. Trans. A Phys. Metall. Mater. Sci. 2001, 32, 2917–2935. [Google Scholar] [CrossRef]
  30. Maki, T. Tekko No Soshikiseigyo -Sono Genri To Houho-; Uchida Rokakuho Publishing: Tokyo, Japan, 2015. [Google Scholar]
  31. Tomita, M.; Inaguma, T.; Sakamoto, H.; Ushioda, K. Development of Recrystallization Texture in Severely Cold-rolled Pure Iron. ISIJ Int. 2016, 56, 693–699. [Google Scholar] [CrossRef] [Green Version]
  32. Hook, R.E.; Hirth, J.P. The deformation behavior of isoaxial bicrystals of Fe-3%Si. Acta Metall. 1967, 15, 535–551. [Google Scholar] [CrossRef]
  33. Abe, M.; Kokabu, Y.; Hayashi, Y.; Hayami, S. Effects of Initial Grain Boundaries on the Cold-Rolling and Annealing Textures of Pure Iron. J. Jpn. Inst. Met. 1980, 44, 84–94. [Google Scholar] [CrossRef] [Green Version]
  34. Sugino, Y.; Ukai, S.; Leng, B.; Tang, Q.; Hayashi, S.; Kaito, T.; Ohtsuka, S. Grain Boundary Deformation at High Temperature Tensile Tests in ODS Ferritic Steel. ISIJ Int. 2011, 51, 982–986. [Google Scholar] [CrossRef] [Green Version]
  35. Kaibyshev, R.; Goloborodko, A.; Musin, F.; Nikulin, I.; Sakai, T. The Role of Grain Boundary Sliding in Microstructural Evolution during Superplastic Deformation of a 7055 Aluminum Alloy. Mater. Trans. 2002, 43, 2408–2414. [Google Scholar] [CrossRef] [Green Version]
  36. Usui, E. Sessaku/kensakukakogaku Jou -Sessakukako-; Kyoritsu Shuppan Co., Ltd.: Tokyo, Japan, 1971. [Google Scholar]
  37. Sims, R.B. The Calculation of Roll Force and Torque in Hot Rolling Mills. Proc. Inst. Mech. Eng. 1954, 168, 191–200. [Google Scholar] [CrossRef]
  38. Kawasaki, M.; Horita, Z.; Langdon, T.G. Microstructural evolution in high purity aluminum processed by ECAP. Mater. Sci. Eng. A 2009, 524, 143–150. [Google Scholar] [CrossRef]
Figure 1. Schematic illustration of an orthogonal cutting model.
Metals 10 01320 g001
Figure 2. Inverse pole figure (IPF) maps of chip specimen (a) at center in the thickness direction and (b) near rake face.
Metals 10 01320 g002
Figure 3. Kernel average misorientation (KAM) maps of chip specimen (a) at center in the thickness direction and (b) near rake face.
Metals 10 01320 g003
Figure 4. IPF maps of the rolled specimen of (a) fine grains and (b) coarse grains.
Metals 10 01320 g004
Figure 5. KAM maps of the rolled specimen of (a) fine grains and (b) coarse grains.
Metals 10 01320 g005
Figure 6. Microstructure of the half-rolled specimen. (a) IPF map for transverse direction (TD), (b) KAM map, and (c) crystal direction map for <011>//reference direction (RD) and <111>//normal direction (ND).
Metals 10 01320 g006
Figure 7. Plastic deformation zone of (a) rolling and (b) cutting against grain size.
Metals 10 01320 g007
Figure 8. IPF maps of the chip specimens after heat treatment at 500 °C for (a) 1 min and for (b) 5 min.
Metals 10 01320 g008
Figure 9. IPF maps of the rolled specimens after heat treatment at 500 °C for (a) 1 min and for (b) 5 min.
Metals 10 01320 g009
Figure 10. IPF maps of the chip specimens after heat treatment at 600 °C for (a) 1 min and for (b) 5 min.
Metals 10 01320 g010
Figure 11. IPF maps of the rolled specimens after heat treatment at 600 °C for (a) 1 min and for (b) 5 min.
Metals 10 01320 g011
Figure 12. Variation of grain size in the chip and in the rolled specimen with heat treatment at 600 °C.
Metals 10 01320 g012
Figure 13. Effect of the parameter on recrystallization simulation and results of parameter fitting for 600 °C heat treatment.
Metals 10 01320 g013
Figure 14. Grain size distribution after heat treatment at 600 °C for 1 min.
Metals 10 01320 g014
Figure 15. Time variation of recrystallization ratio during heat treatment at 600 °C, as calculated using the model.
Metals 10 01320 g015
Figure 16. Variation of (a) recrystallization ratio and (b) recrystallized grain size with respect to applied shear strain by cutting during heat treatment at 600 °C.
Metals 10 01320 g016
Figure 17. Variation of (a) recrystallization ratio and (b) recrystallized grain size with respect to thickness reduction of plate rolling during heat treatment at 600 °C.
Metals 10 01320 g017
Table 1. Cutting conditions and geometry of the chip specimens.
Cutting Conditions
 Tool materialCarbide, P10
 Rake angle α 10°
 Cutting speed V c 25 m/min
 Depth of cut t 0 0.04 mm
 LubricationDry
Geometry of Chip
 Thickness of the chip t c 0.15 mm
 Shear angle ϕ 15.8°
 Shear strain of a chip γ 3.6
 Equivalent strain of a chip ϵ c ¯ 2.1
Table 2. Rolling conditions and geometry of the rolled specimens.
Rolling Conditions
 Roll diameter R r o l l 40 mm
 Rolling speed N r 10 rpm
 Thickness reduction r r o l l 91%
 Number of rolling passes1 pass
 LubricationDry
Geometry of Rolled Sheet
 Thickness before rolling H 1 2.96 mm
 Thickness after rolling H 2 0.27 mm
 Equivalent strain ϵ r ¯ 2.8
Table 3. Material parameters of recrystallization simulation.
ParameterValueReference
A 0.231[19] for Si-Fe
Δ ( G a ) g 33.8 kcal/mol[25]
b n 3.025 eV[26]
d E 60 kcal[27]
Table 4. Fitting parameters of recrystallization simulation at 600 °C.
ParameterCuttingRolling
C d 4.23 × 10 2 2.28 × 10 2
C ρ 8.5 × 10 23 8.5 × 10 23
C g 2.9 × 10 7 2.9 × 10 7
Table 5. Recrystallization process properties of the chip and rolled specimens at 600 °C.
ParameterCuttingRolling
Large-misorientation area ratio0.280.038
Calculated dislocation density at large-misorientation area [/m2] 1.71 × 10 18 1.69 × 10 18
Number of recrystallized grains [/mm3] 8.53 × 10 6 7.76 × 10 5
Grain growth rate when recrystallization ratio reaches 50% [µm/s] 8.05 × 10 2 8.45 × 10 2

