Article

Capturing and Micromechanical Analysis of the Crack-Branching Behavior in Welded Joints

1
Shanghai Key Laboratory of Multiphase Flow and Heat Transfer in Power Engineering, School of Energy and Power Engineering, University of Shanghai for Science and Technology, Shanghai 200093, China
2
Department of Mechanical & Aerospace Engineering, University of Strathclyde, Glasgow G1 1XJ, UK
*
Author to whom correspondence should be addressed.
Metals 2020, 10(10), 1308; https://doi.org/10.3390/met10101308
Submission received: 25 August 2020 / Revised: 22 September 2020 / Accepted: 27 September 2020 / Published: 29 September 2020
(This article belongs to the Special Issue Fracture Mechanics and Fatigue Design in Metallic Materials)

Abstract

:
During the crack propagation process, the crack-branching behavior makes fracture more unpredictable. However, compared with the crack-branching behavior that occurs in brittle materials or ductile materials under dynamic loading, the branching behavior has been rarely reported in welded joints under quasi-static loading. Understanding the branching criterion or the mechanism governing the bifurcation of a crack in welded joints is still a challenge. In this work, three kinds of crack-branching models that reflect simplified welded joints were designed, and the aim of the present paper is to find and capture the crack-branching behavior in welded joints and to shed light on its branching mechanism. The results show that as long as there is another large enough propagation trend that is different from the original crack propagation direction, then crack-branching behavior occurs. A high strength mismatch that is induced by both the mechanical properties and dimensions of different regions is the key of crack branching in welded joints. Each crack branching is accompanied by three local high stress concentrations at the crack tip. Three pulling forces that are created by the three local high stress concentrations pull the crack, which propagates along with the directions of stress concentrations. Under the combined action of the three pulling forces, crack branching occurs, and two new cracks initiate from the middle of the pulling forces.

1. Introduction

Cracks are the main drivers of material failure [1,2]. In the crack propagation process, a crack may split into two or more branches. This crack-branching phenomenon usually occurs in concrete structures, brittle materials, and quasi-brittle materials under dynamic loading, and it makes the fracture become more unpredictable and has aroused a wide range of concerns. For concrete structures, Forquin [3] investigated the crack propagation behavior in concrete and rock-like materials under dynamic tensile loading by an optical correlation technique. Curbach et al. [4] discussed the crack velocity in concrete by an experimental investigation. Ožbolt et al. [5,6,7] studied the inertia on resistance, failure mode, and crack pattern of concrete loaded by higher loading rates. Zhang et al. [8] reviewed the development and the state of the art in dynamic testing techniques and dynamic mechanical behavior of rock materials. For the brittle and quasi-brittle materials, much research has been done. Most recently, Mecholsky et al. [9] studied the relationship between fractography, fractal analysis, and crack branching in brittle materials. Nakamura et al. [10] researched the effect of the stress field on crack branching in brittle material. Chen et al. [11] studied the influence of micro-modulus functions on peridynamics simulation of crack propagation and branching in brittle materials. Kou et al. [12] investigated the crack propagation and crack branching in brittle solids under dynamic loading. Li et al. [13] studied the underlying fracture trends and triggering on Mode-II crack branching and kinking for quasi-brittle solids. Bouchbinder et al. [14] studied the dynamics of branching instabilities in rapid fracture and offered predictions for the geometry of multiple branches. Boué et al. [15] investigated the source of the micro-branching instability and revealed the relationship between micro-branching and the oscillatory instabilities of rapid cracks. Karma et al. [16] researched the unsteady crack motion and branching in brittle fracture and shed light on the physics that control the speed of accelerating cracks and the characteristic branching instability.
In the meantime, different classes of models and methods were selected to study the crack-branching behavior in the crack propagation process. The cohesive region model describes the crack propagation process by considering a potential opening between two bulk elements, and it can capture some features of crack-branching patterns [17,18]. The extended finite element method (XFEM) was also selected to obtain crack branching by input additional branching criterion in the crack propagation algorithm [19,20]. The phase field model was the most widely used to research the crack-branching behavior in the dynamic crack propagation process. Henry [21] studied the dynamic branching instability under in-plane loading by a phase field model. Bleyer [22] investigated the crack-branching, speed-limiting, and velocity-toughening mechanism in the dynamic crack propagation process by a variational phase-field model. Hofacker and Miehe [23,24] described the evolution of complex crack patterns under dynamic loading by representative numerical examples. Karma et al. [25] introduced a phenomenological continuum model for the mode III dynamic fracture that is based on the phase-field methodology. Henry and Adda-Bedia [26] studied the crack branching in brittle material and established its relationship to the fractographic patterns by a phase-field model. In addition, Bobaru and Zhang [27] reviewed the peridynamic model for brittle fracture and investigated the crack-branching behavior in brittle homogeneous and isotropic materials.
A crack can branch for many reasons. Since an additional crack was generated in the branching event, the energy release rate was proposed as a crack-branching criterion [28]. Another important crack-branching criterion is crack-tip velocity. There exists a critical value of crack-tip velocity, and crack branching occurs at the critical value [29]. Nevertheless, in the inelastic nonlocal continuum model, such as a phase-field model, the crack-branching behavior can be captured naturally, and an extrinsic branching criterion is not needed [30,31].
Due to the highly heterogeneity of the microstructural, mechanical, and fracture properties, welded joints are a vulnerable component of structures, and they are prone to pores, cracks, and other defects. However, compared with the homogeneous materials that are mainly studied and mentioned above, the crack-branching behavior was rarely reported in welded joints. Understanding the branching criterion or mechanism governing the bifurcation of a crack in welded joints is still a challenge.
In the fracture mechanics experiment for a dissimilar metal welded joint (DMWJ), which is used for connecting the pipe nozzle and the safe end in nuclear power plants, the authors found that the crack-branching behavior occurred occasionally [32,33]. However, it is not clear when the crack will surely branch in welded joints, nor the crack-branching mechanism. Thus, in this research, three kinds of crack-branching models that reflect simplified welded joints were designed; the aim of the present paper works on finding and capturing the crack-branching behavior in welded joints and shedding light on its branching mechanism.

2. The Designed Crack-Branching Model

Since the crack deviation phenomenon occurs in the crack propagation process under local strength mismatch, and the crack deviates to the side of material with lower strength [32,33], it can be assumed that the crack will branch when there are similar strength mismatches on two sides of the crack. Based on this assumption, three kinds of simple crack-branching models, which can reflect simplified welded joints, were designed to capture the crack-branching behavior, as presented in Section 2.1, Section 2.2 and Section 2.3.
All these models were composed by three regions: the left region, the center region, and the right region. Different material properties, which are obtained by changing the true stress versus strain curve of a ductile material, ferrite low-alloy steel A508, were assigned to the three regions. Figure 1 presents the true stress versus strain curve of the ductile material A508 [34]. Its elastic modulus E is 202,410 MPa, and Poisson’s ratio ν is 0.3.
For all models, a load roll is applied at the top and center of the model, and two back-up rolls are applied at the bottom of the model. The loading is applied at the load roll by prescribing a displacement of 30 mm, and the two back-up rolls are fixed by control displacement and rotation. The initial crack is located in the middle of the model. The model width is 32 mm (W = 32 mm), the loading span is 128 mm (L = 4W), and the initial crack length is 16 mm (a/W = 0.5). All models are two-dimensional (2D) plane strain specimen models. Compared with the three-dimensional (3D) specimen models, the 2D plane strain specimen with W = 32 mm, L = 4W, and a/W = 0.5 has the same J-resistance curve with the 3D specimen with W = 32 mm, L = 4W, a/W = 0.5, and B/W = 0.5.

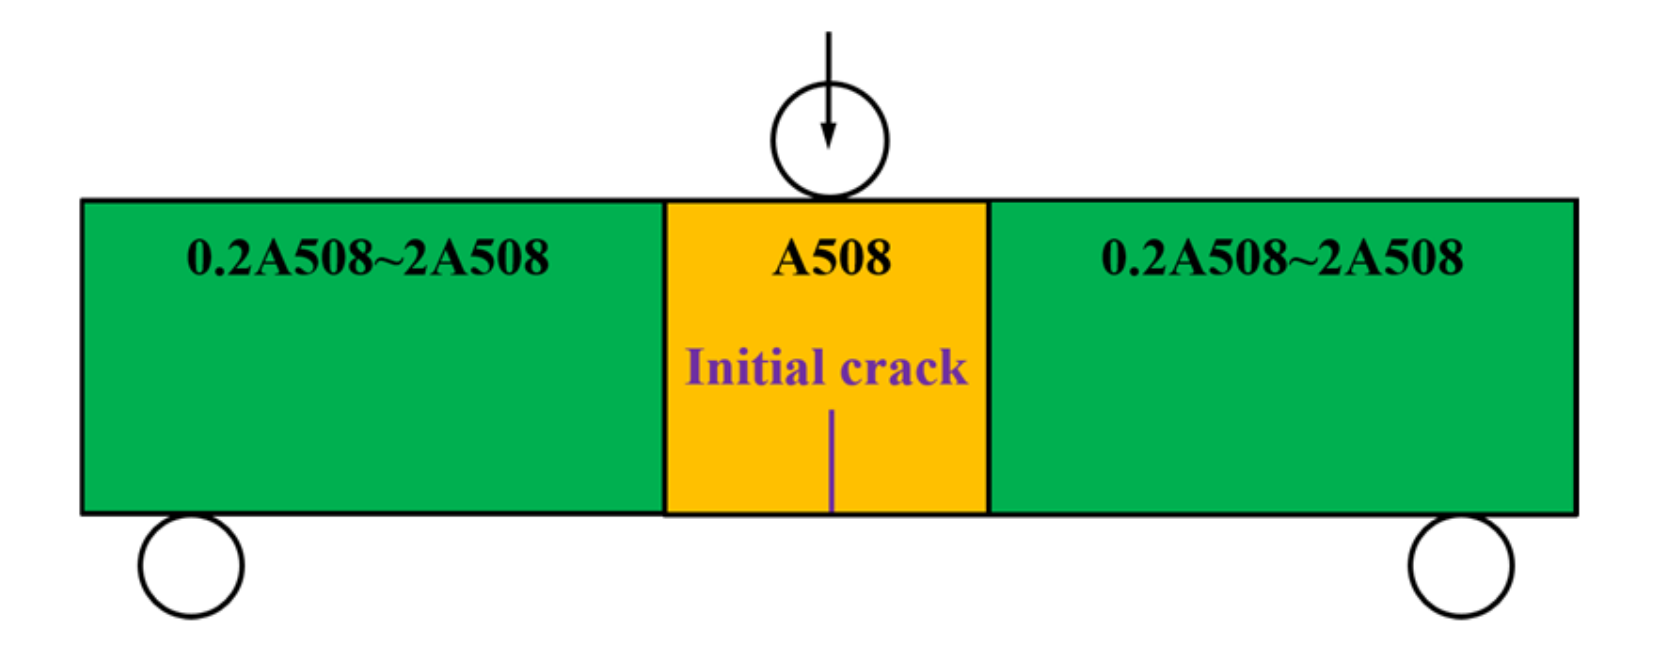
2.1. The First Crack-Branching Model

In the first crack-branching model, the material of the center region is fixed as the A508, and its true stress versus strain curve was assigned to this region. The left region and the right region have the same material properities, and 0.2–2 times (0.2, 0.4, 0.6, 0.8, 1.0, 1.2, 1.4, 1.6, 1.8, 2.0) of the true stress versus strain curves of the ductile material A508 were assigned to them successively, as shown in Figure 2. In addition, the widths of the left, center, and right regions are fixed to 64, 20, and 64 mm, respectively.

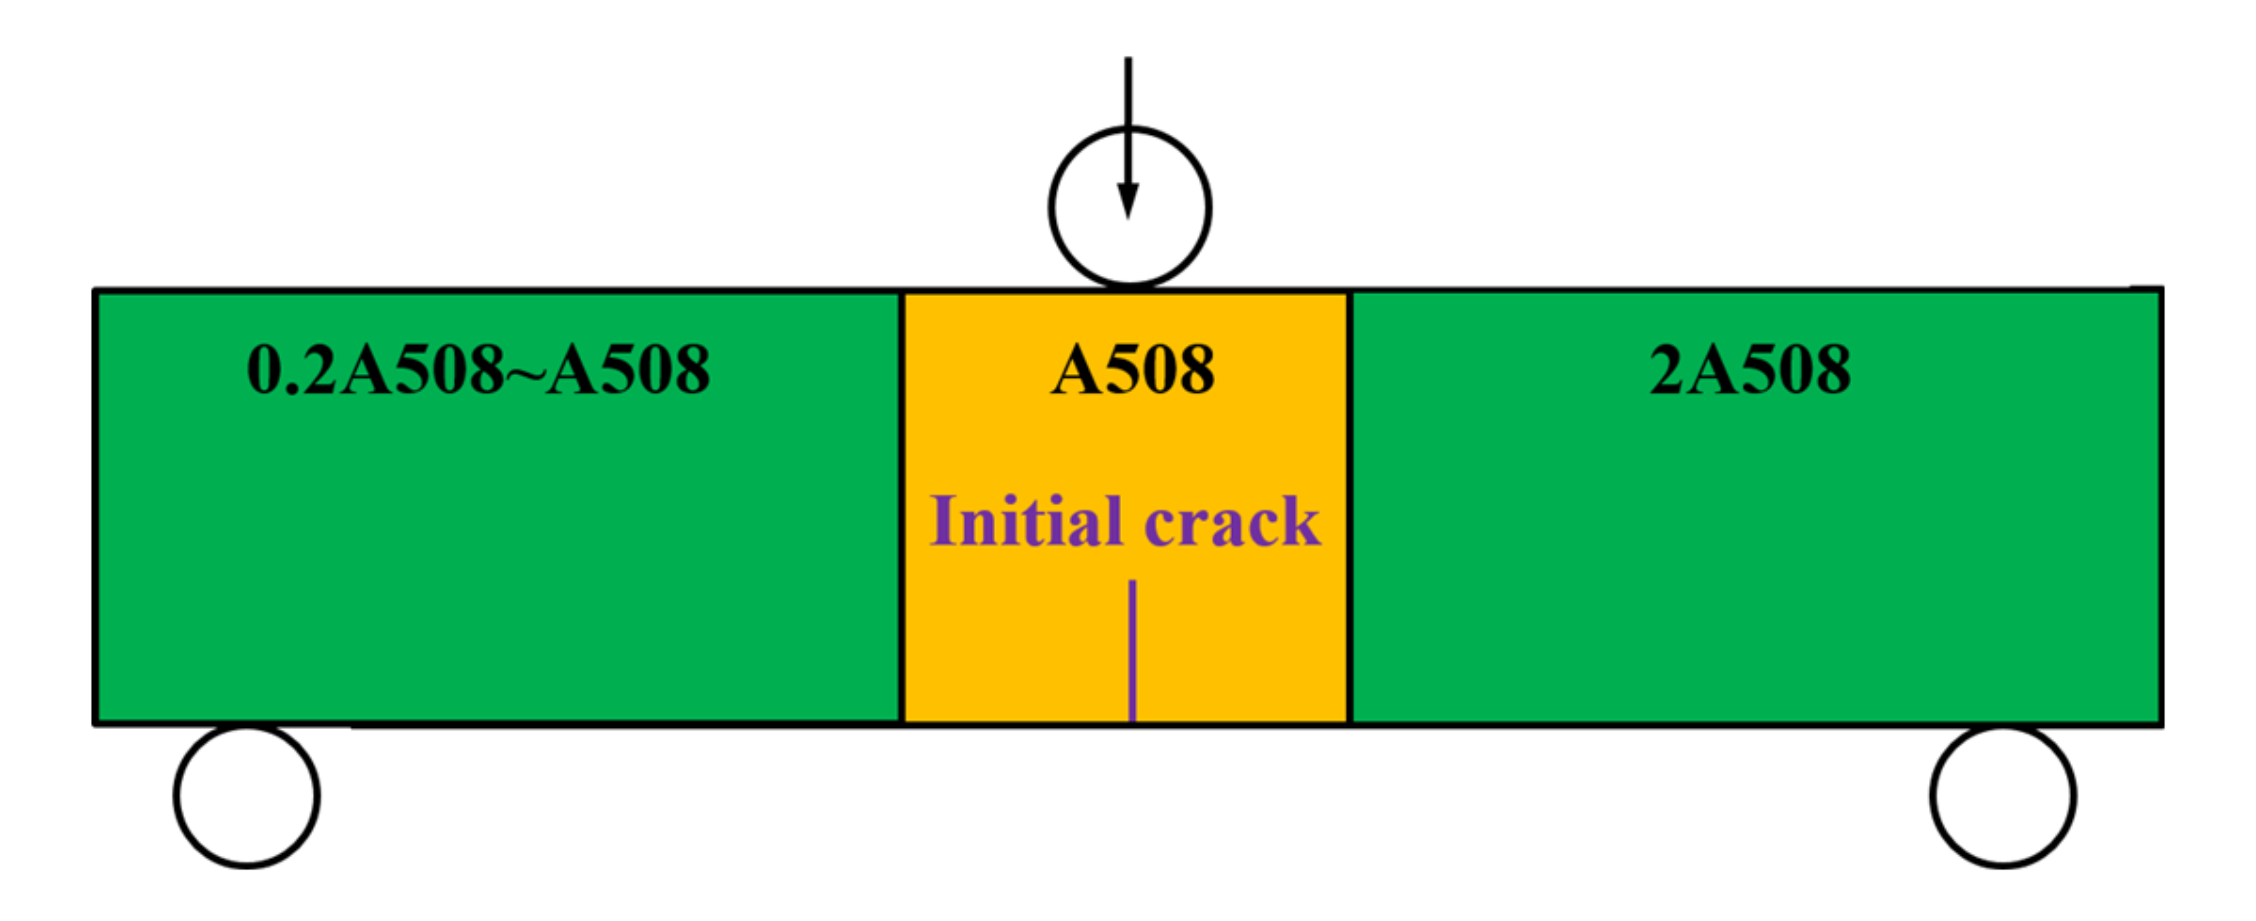
2.2. The Second Crack-Branching Model

In the second crack-branching model, both materials of the center region and the right region are fixed, and one time and two times of the true stress versus strain curves of the ductile material A508 were assigned to them, respectively. In addition, 0.2–1 times (0.2, 0.3, 0.4, 0.5, 0.6, 0.7, 0.8, 0.9, 1.0) of the true stress versus strain curves of the ductile material A508 were assigned to the left region successively, as shown in the Figure 3. In addition, the widths of left, center, and right regions are fixed to 64, 20, and 64 mm, respectively.

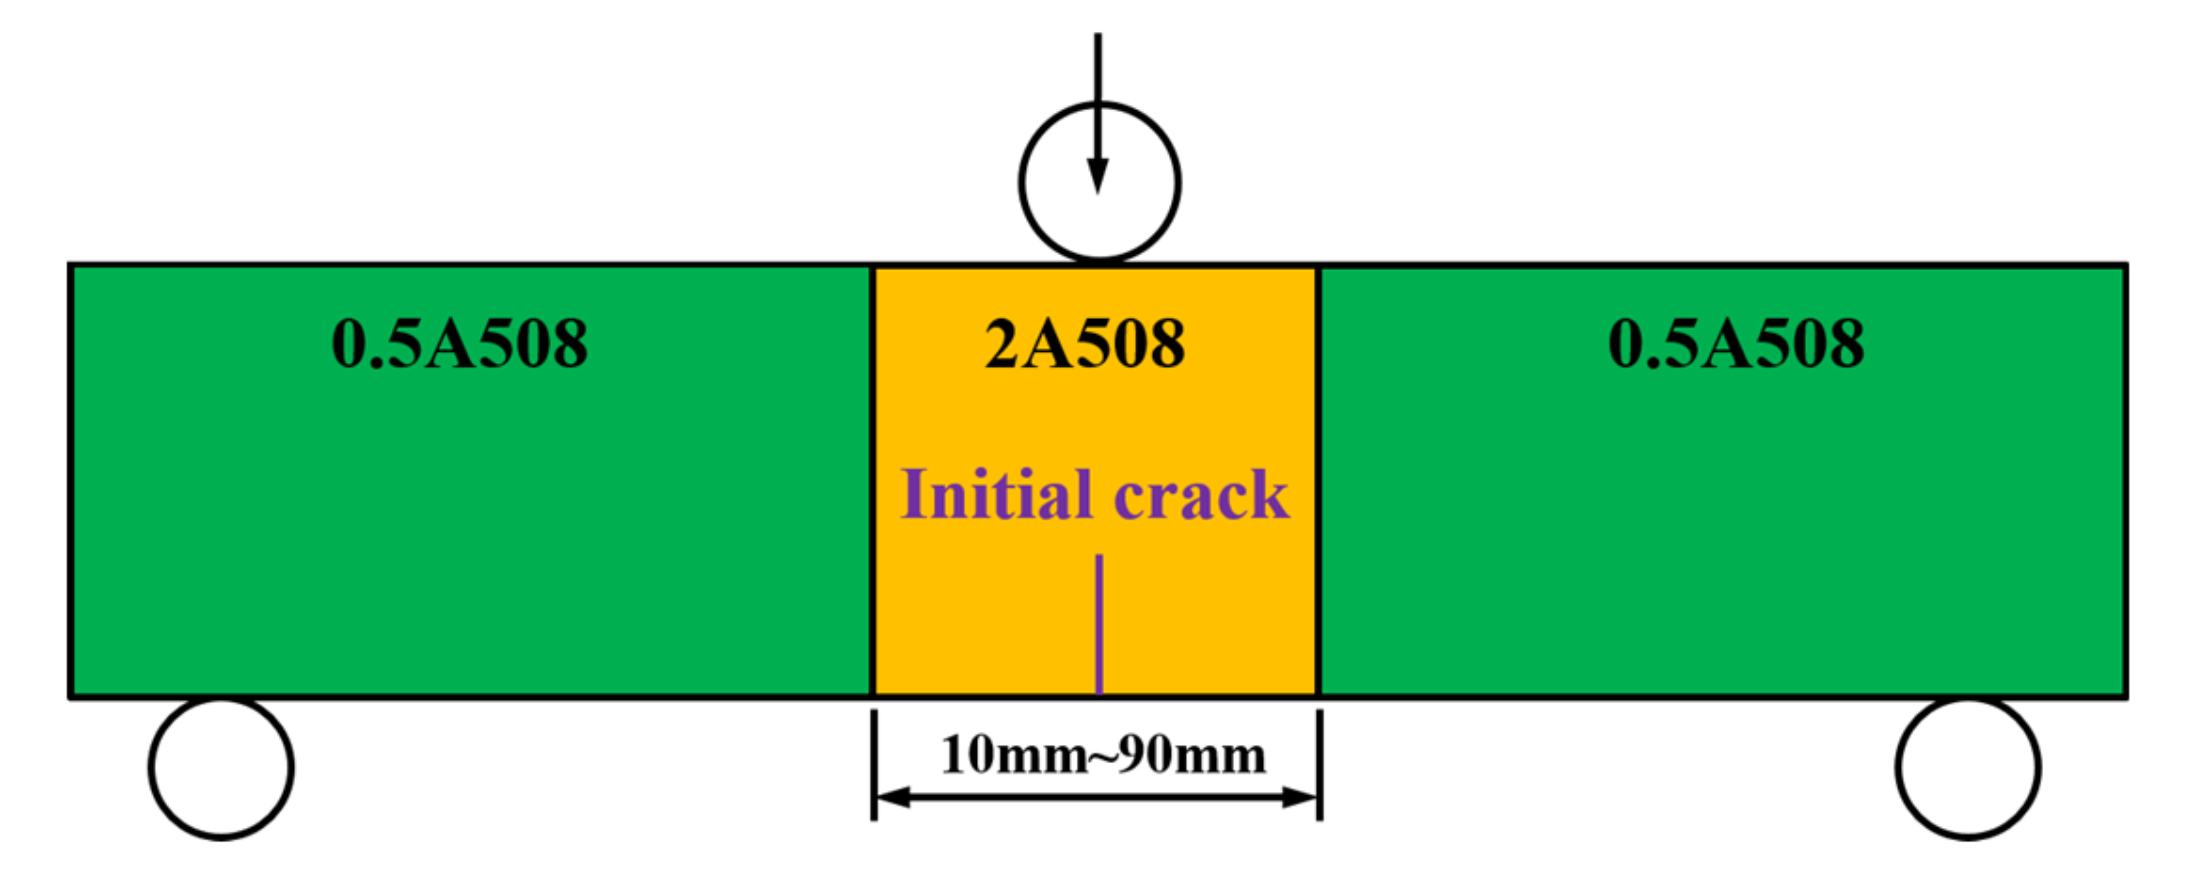
2.3. The Third Crack-Branching Model

In the third crack-branching model, all the materials of the left region, the center region, and the right region are fixed. Twice the true stress versus strain curve of the ductile material A508 was assigned to the center region, and half of the true stress versus strain curve of the ductile material A508 was assigned to the left region and the right region. Different from the first and second models whose widths of different regions are fixed, the center region width in the third model was changing from 10 to 90 mm (10, 20, 30, 40, 50, 60, 70, 80, and 90 mm), as shown in Figure 4.

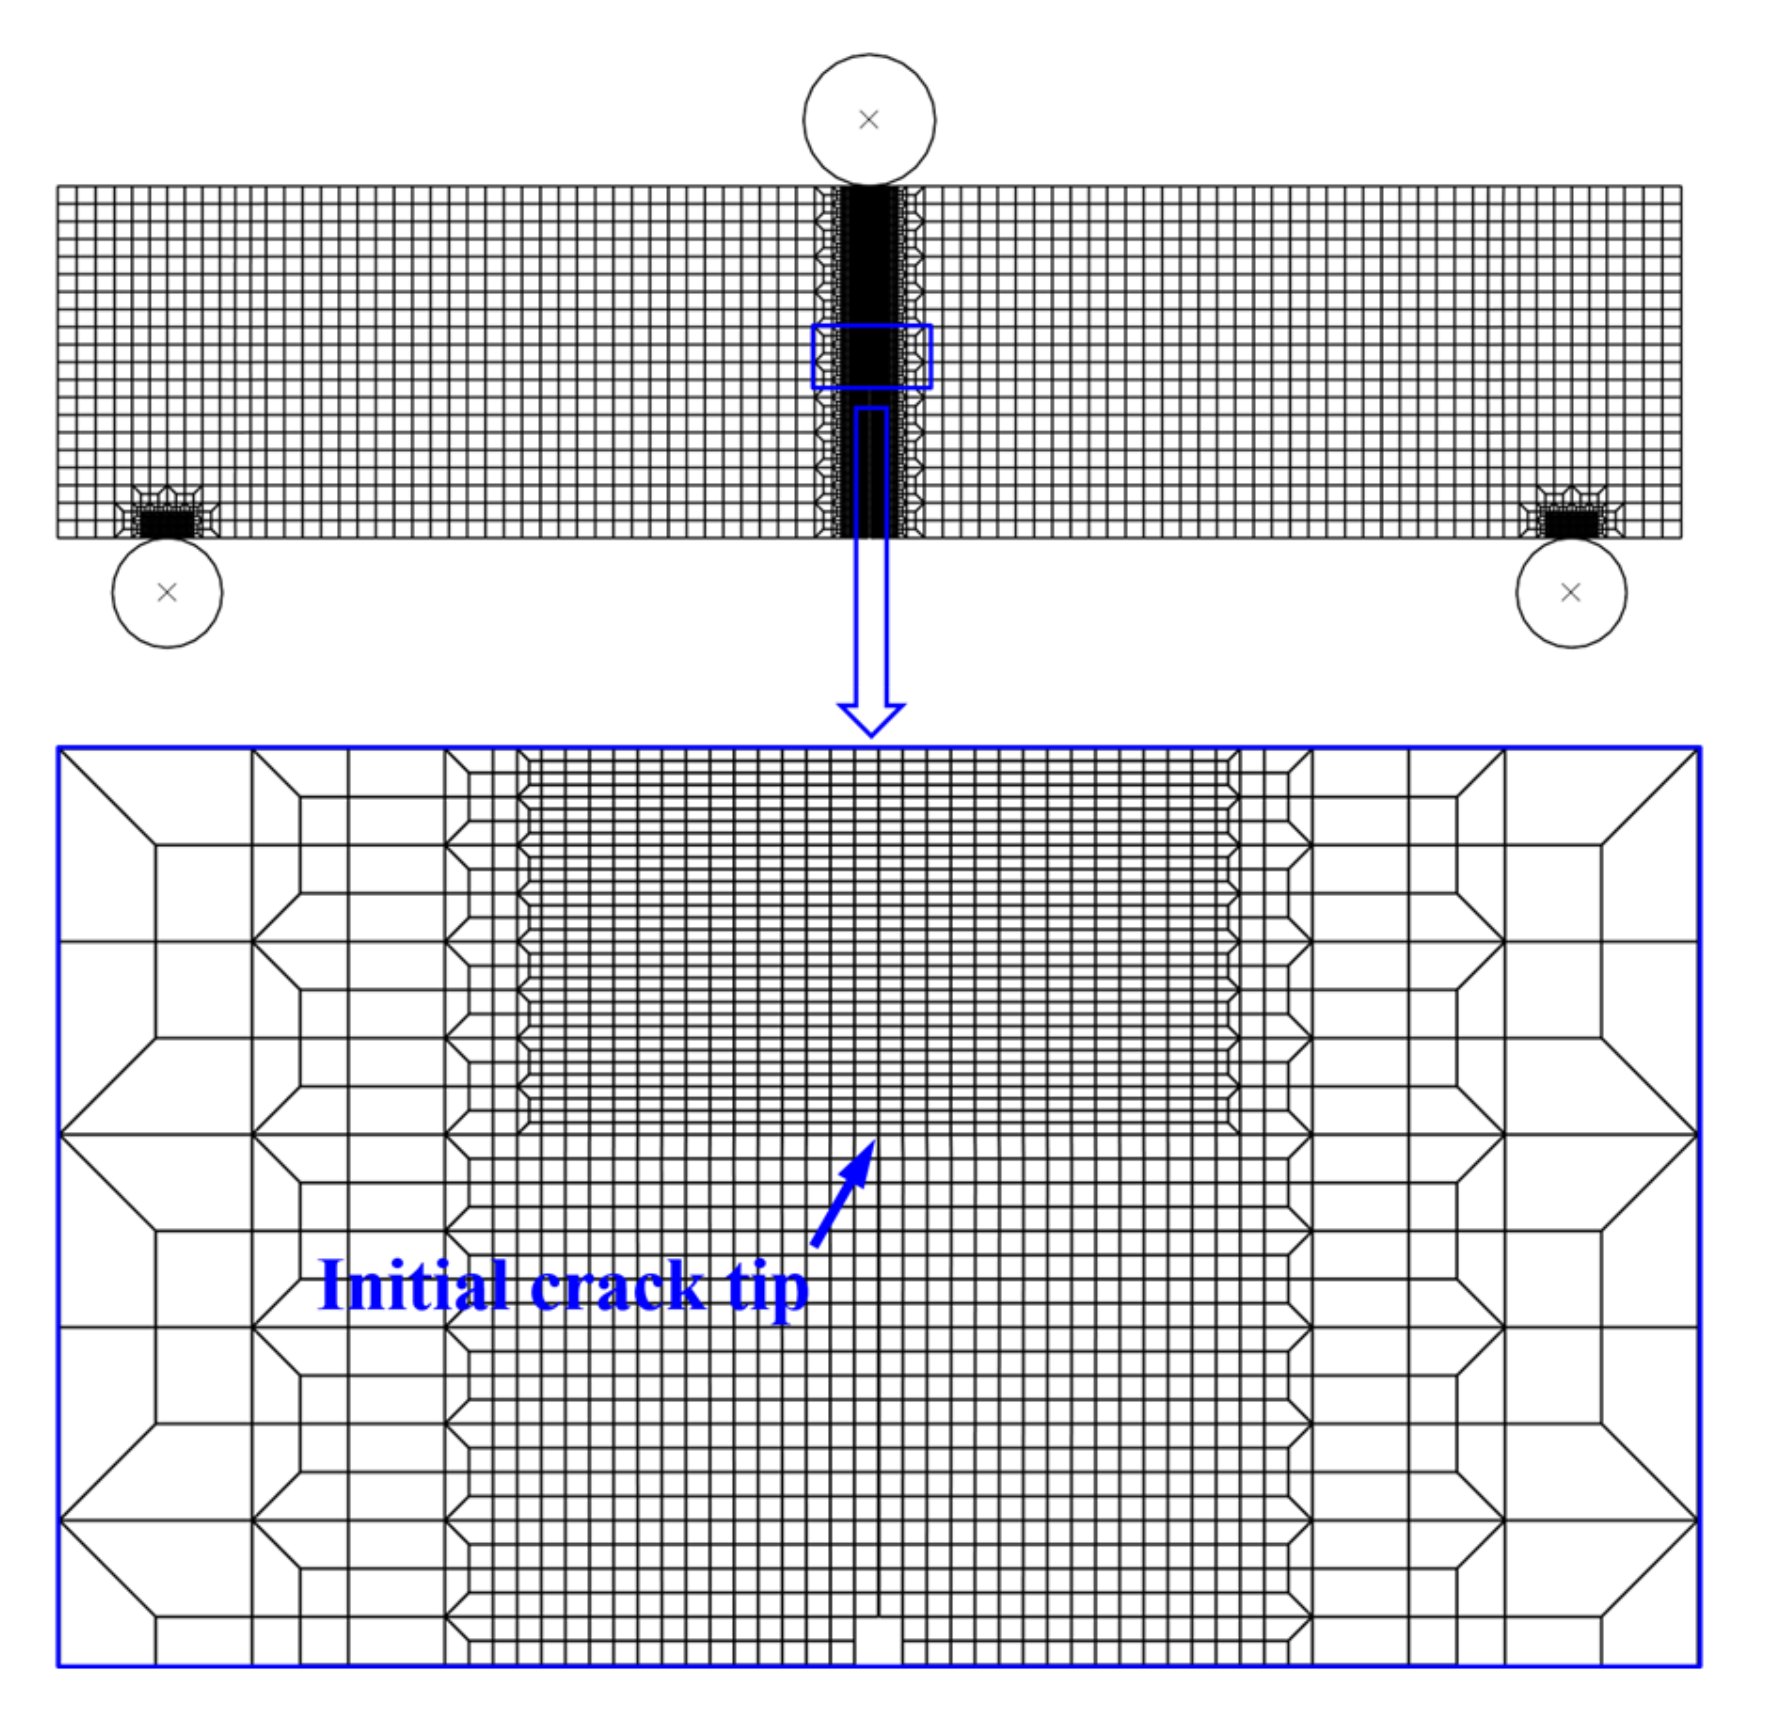
3. Finite Element Numerical Calculation

Crack propagation in ductile metals is a complex multiscale phenomenon governed by the initiation, growth, and coalescence of micro-voids. To observe the crack-branching behavior, the finite element analysis based on the Gurson–Tvergaard–Needleman (GTN) damage model [35,36,37,38,39] was chosen to obtain and monitor the whole crack propagation process in different designed crack-branching models.
The yield function of the GTN damage model was expressed as
ϕ σ m , σ e q , f * = σ e q 2 σ f 2 + 2 q 1 f * cosh 3 q 2 σ m 2 σ f 1 q 3 f * 2 = 0
where q1, q2, and q3 are parameters determined by ad hoc finite element (FE) simulations, in which σm is the mean stress, σeq is the equivalent stress, σf is the flow stress. The f* is the void volume fraction (VVF), and it is the replacement of f in the Gurson model. The relationship of them was expressed as
f * = f                                             if f f c f c + f F * f c f F f c f f c   if f c < f < f F f F *                                             if f f F
where fC is the critical VVF, fF is the final failure parameter, and fF* is calculated as
f F * = q 1 + q 1 2 q 3 / q 3 .
The change in VVF during an increment of deformation contains two parts: one due to the growth of existing voids, and the other due to the nucleation of new voids.
f = f g r o w t h + f n u c l e a t i o n
where
f g r o w t h = ( 1 f ) ε k k P
and
f n u c l e a t i o n = A ε p = f N S N 2 π exp [ 1 2 ( ε p ε N S N ) 2 ] ε p .
here, f is the VVF growth rate, f g r o w t h is the VVF growth rate due to the growth of existing voids, f n u c l e a t i o n is the VVF growth rate due to the nucleation of new voids, ε k k P is the change rate of plastic strain, ε p is equivalent plastic strain, and ε p is the change rate of equivalent plastic strain.
Generally, it contains nine parameters in the GTN damage model: q1, q2, q3, εN, SN, fN, f0, fC, and fF. Of these, q1, q2, and q3 are parameters determined by ad hoc FE simulations; εΝ, SN, and fN are void nucleation parameters; f0 is the initial VVF; fC is the critical VVF; and fF is the final failure parameter. When the VVF reaches the critical value fC, void coalescence occurs. When the VVF reaches the final value fF, fracture occurs. For the material A508, q1 = 1.5, q2 = 1, q3 = 2.25, εN =0.3, SN = 0.1, fN = 0.002, f0 = 0.0002, fC = 0.04, and fF = 0.17 [40,41].
The GTN damage model has been implemented in the ABAQUS code (6.14, Dassault Systèmes group company, Shanghai, China), and it was widely selected to obtain the crack propagation process [42,43,44,45]. Figure 5 presents the finite element meshes of the typical designed crack-branching model. The 2D plane strain four-node isoperimetric elements with reduced integration (CPE4R) was used, and the mesh size in the crack propagation region is 0.05 mm × 0.1 mm [42,43]. The crack propagation path in the propagation process can be observed from the finite element method simulation results directly.

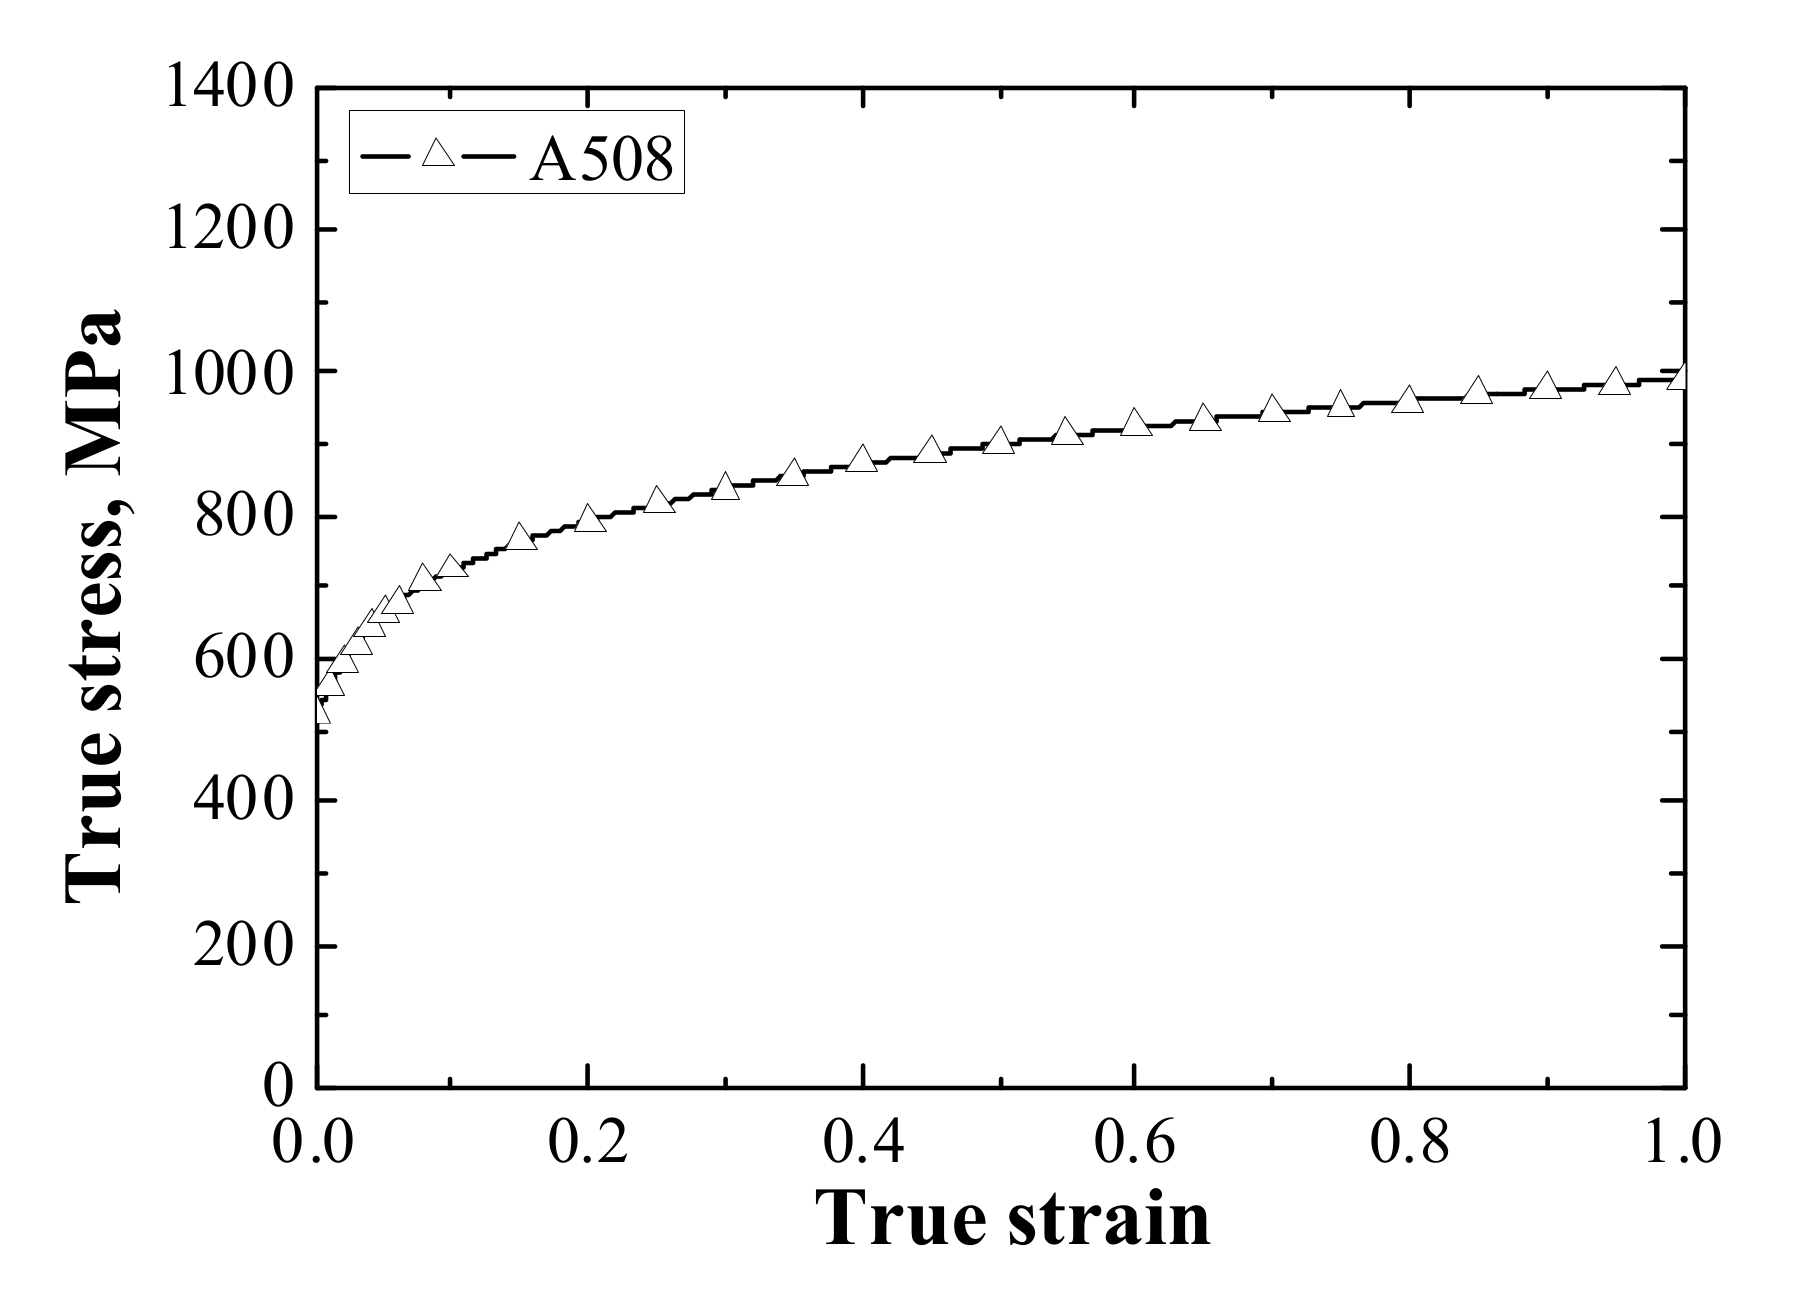
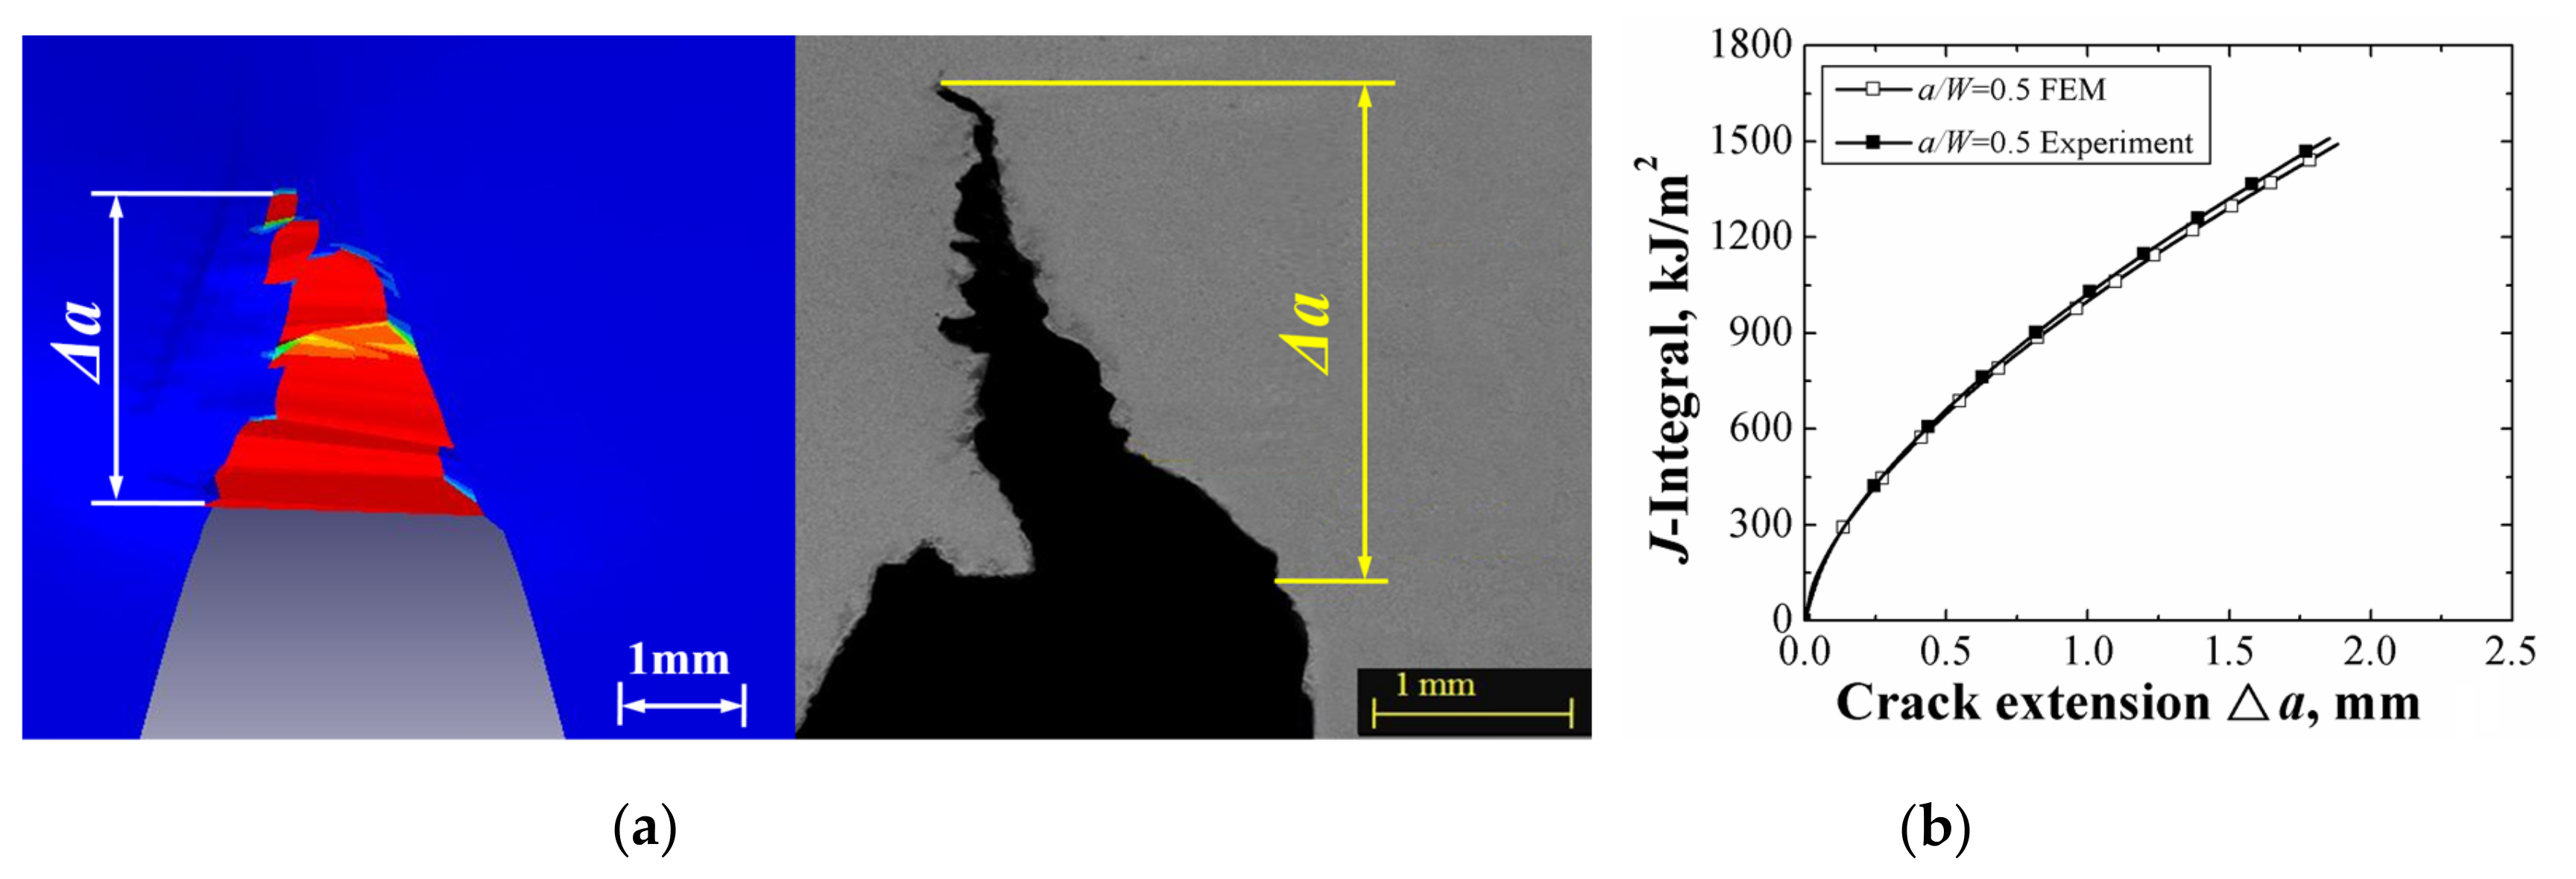
4. Verification of the Gurson-Tvergaard-Needleman Damage Model by Experimental Results

To ensure the accuracy of the finite element results obtained by the GTN damage model, some experiments have been performed and compared with the finite element analysis in the previous studies [44,46]. In the experiments, an Alloy52M dissimilar metal welded joint (DMWJ) that contains A508, austenitic stainless steel 316L, buttering layer material Alloy52Mb, and weld metal material Alloy52Mw was selected, and the single edge notched bend (SENB) specimens with five crack depths denoted as a/W = 0.2, 0.3, 0.5, 0.6, and 0.7 were manufactured from the DMWJ. The crack propagation paths and J-resistance curves of different SENB specimens were obtained and compared with the results obtained by the GTN damage model. The experiments were carried out by an Instron screw-driven machine at room temperature. The quasi-static loading was conducted by displacement controlled mode at a cross-head speed of 0.5 mm/min, and the load–load line displacement curves were automatically recorded by a computer aided control system of the testing machine. Figure 6 presents one of the comparisons of experimental results with finite element results for the SENB specimen with a/W = 0.5 [44,46]. It clearly demonstrates that the finite element result obtained by the GTN damage model is accurate, and the GTN damage model can be used to simulate the crack propagation process and obtain the crack propagation path.

5. Results and Discussion

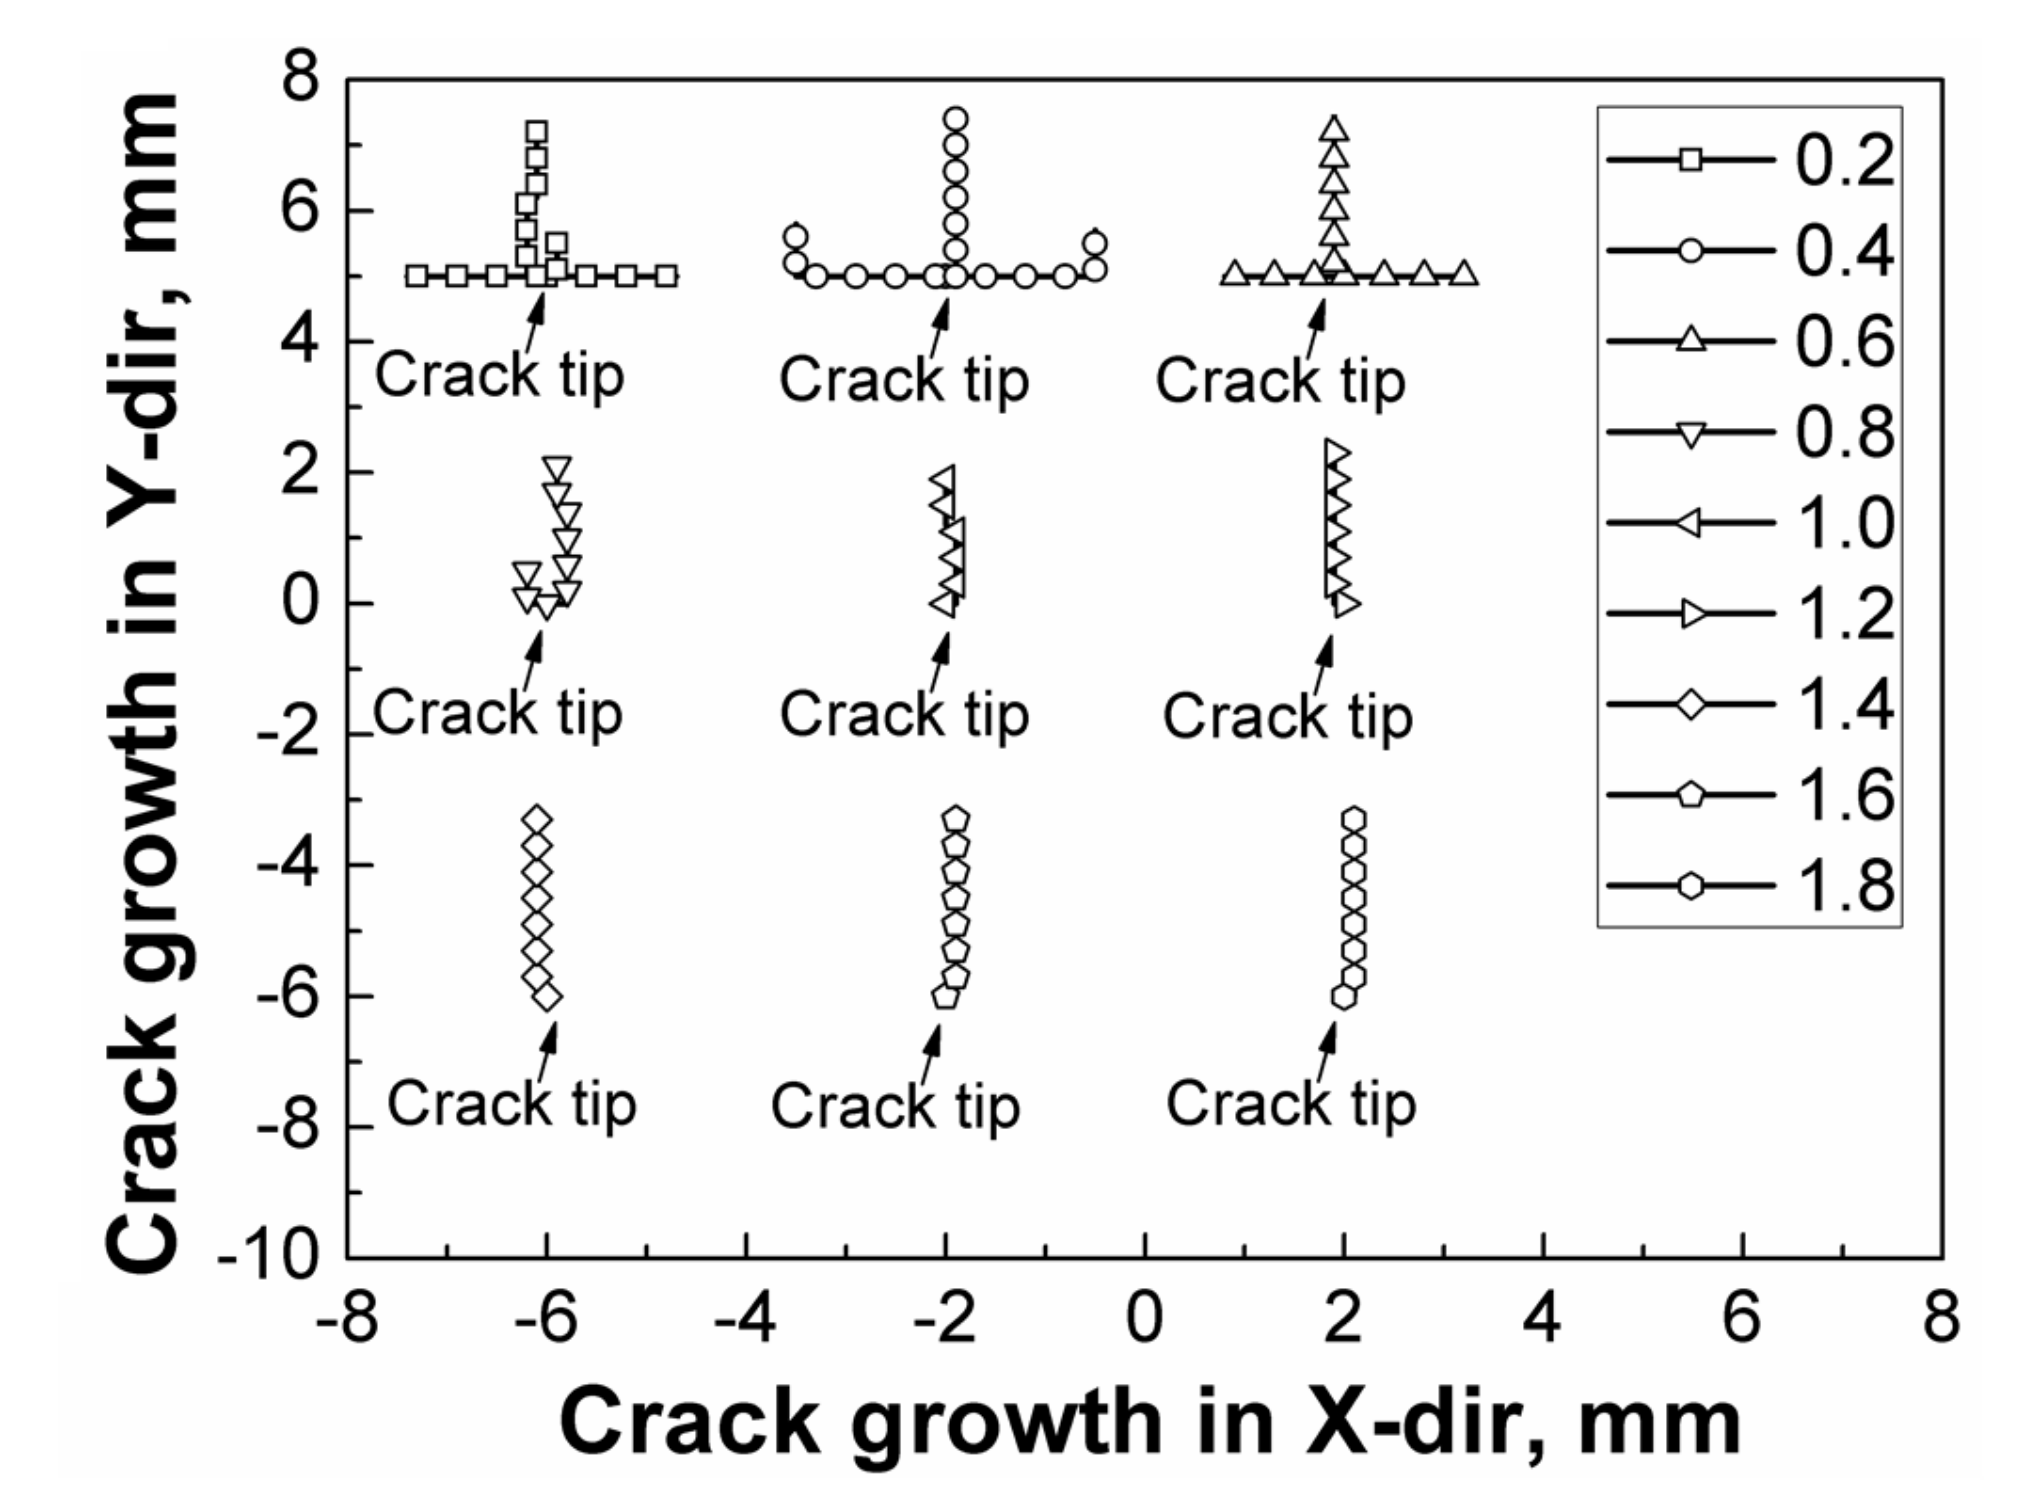
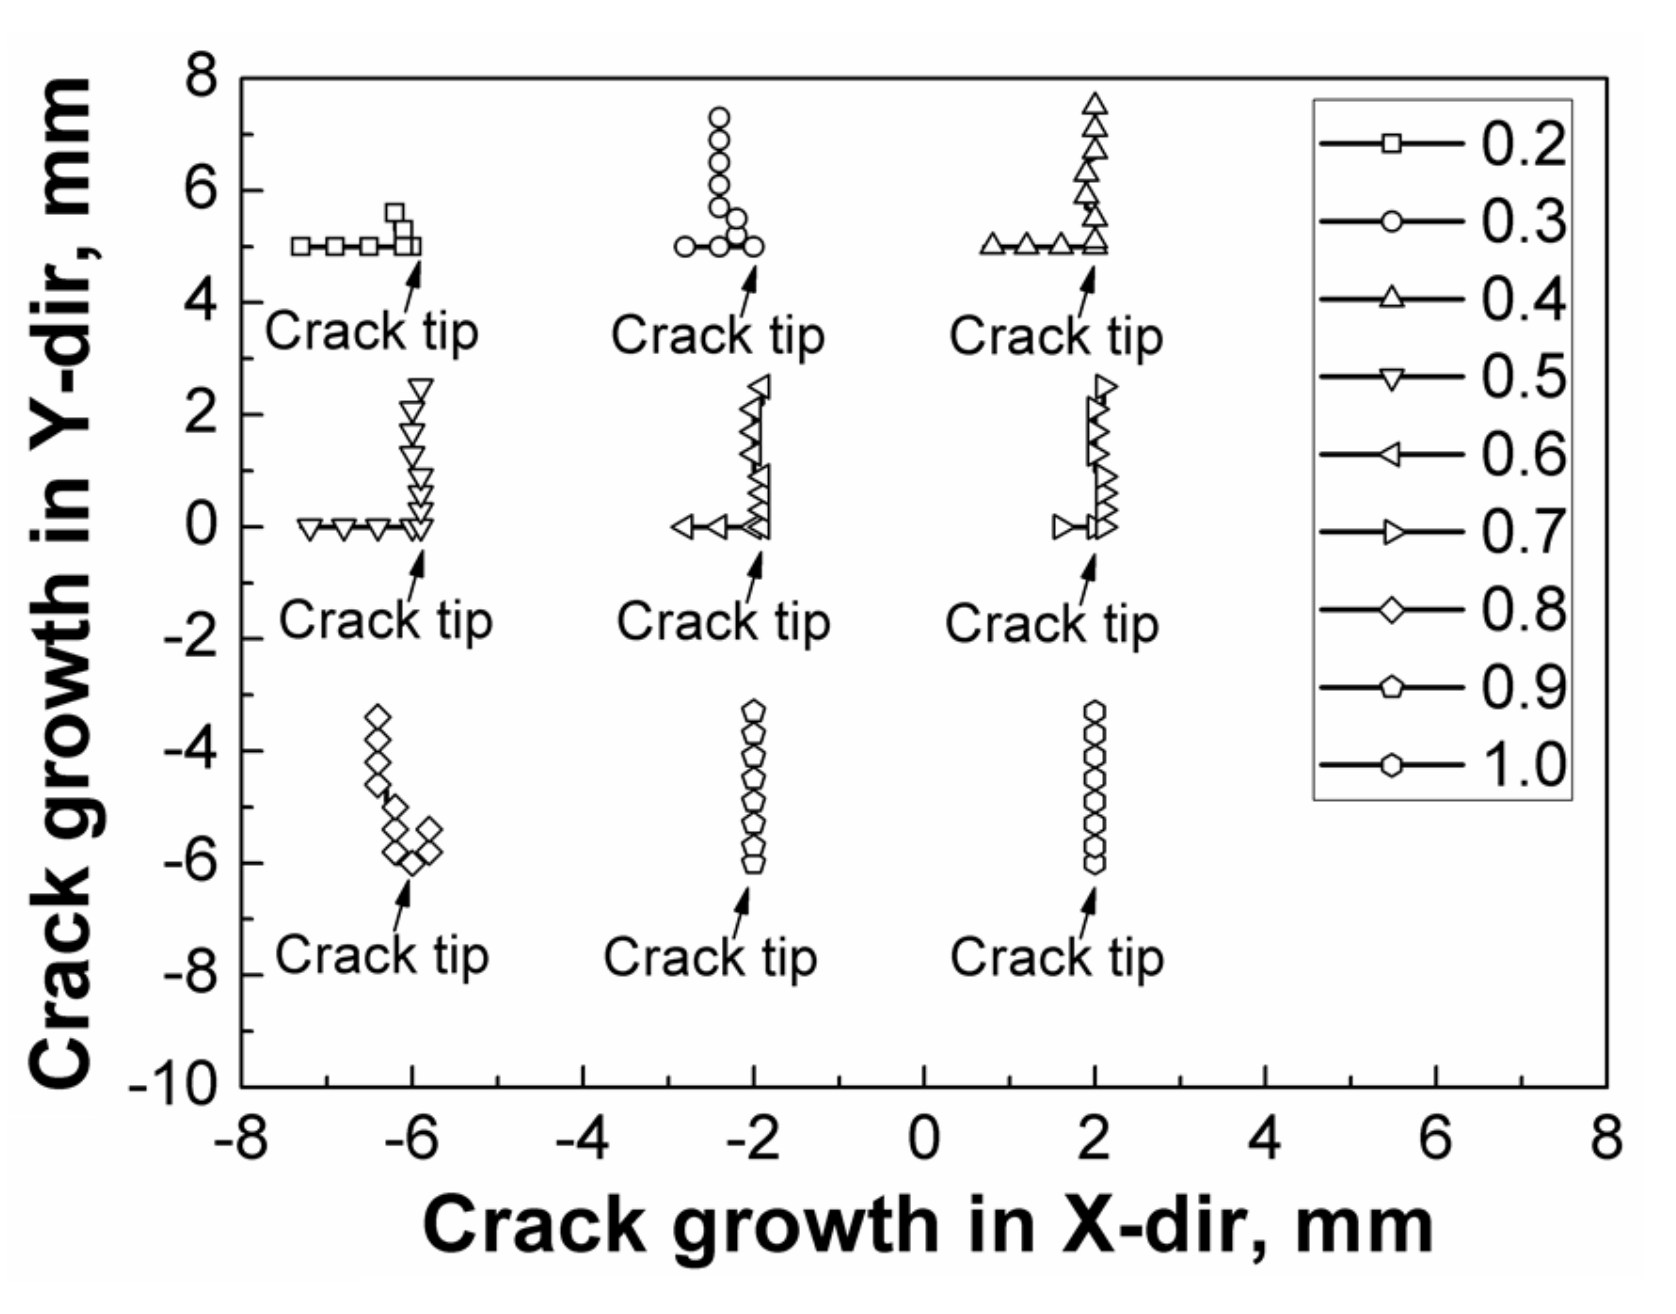
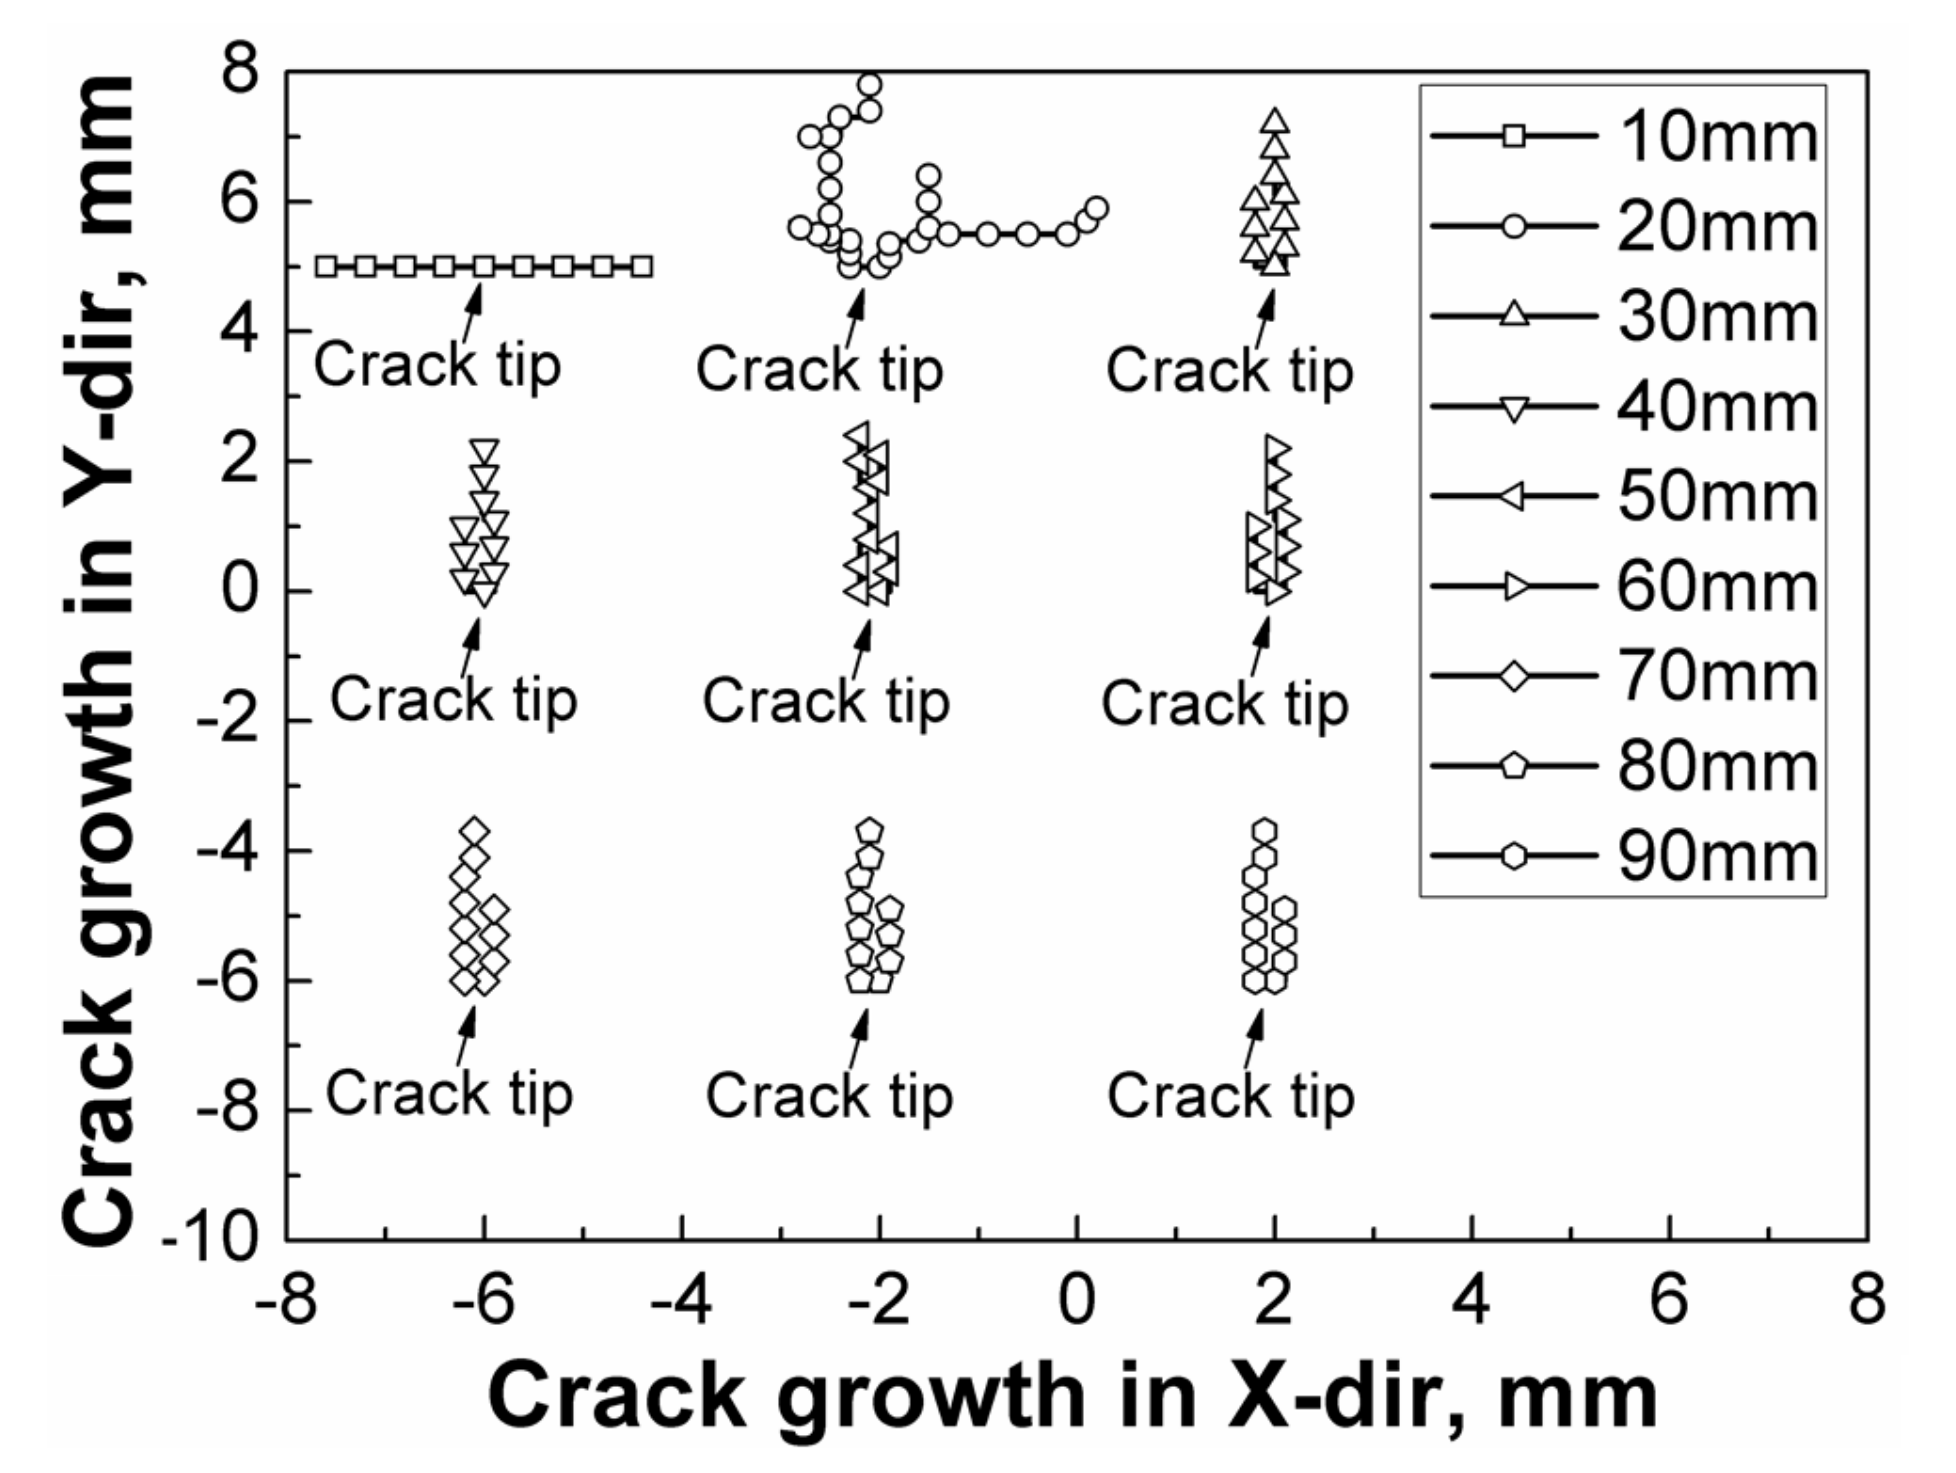
5.1. The First Crack-Branching Model

Figure 7 presents the crack propagation paths of all the first crack-branching models. Figure 8 presents the typical crack propagation paths when the models with 0.6 and 0.8 times the true stress versus strain curves of the ductile material A508 were assigned to the left region and the right region.
It can be found from Figure 7 and Figure 8 that when the model with 0.2 times the true stress versus strain curve of the ductile material A508 was assigned to the left region and the right region, the single crack splits into four branches under the highest strength mismatch. One of the branches deviates a little bit to the left side, one of the branches deviates a little bit to the right side, and the other two branches deviate to the left and right sides separately and grow along with the directions perpendicular to the initial crack. When the models with 0.4 and 0.6 times the true stress versus strain curves of the ductile material A508 were assigned to the left region and the right region, the single crack splits into three branches, as shown in Figure 8a. With decreasing strength mismatch, the branching phenomenon becomes weak. When the model with 0.8 times the true stress versus strain curve of the ductile material A508 was assigned to the left region and the right region, the single crack splits into two branches. One of the branches deviates a little bit to the left side, and one of the branches deviates a little bit to the right side, as shown in Figure 8b. Furthermore, when the model with equal to or higher than one time the true stress versus strain curve of the ductile material A508 was assigned to the left region and right region, the crack does not branch.
The results presented clearly demonstrate that the high strength mismatch induces branching. Since the crack growth path deflects to the side with low strength, when the strength mismatches on the left and right sides of the crack are similar, the crack has a tendency to spread to both the left and right sides and certainly in the direction of the initial crack. Under the combined action of them, the crack-branching behavior occurs. In addition, with gradual increasing of the strength mismatch, the crack-branching behavior becomes more apparent. It is not just the quantity of the branches that increases: the branch can even grow along with the direction perpendicular to the initial crack. When the material strengths of the left and right regions are equal to or higher than the center region where the initial crack is located, the crack-branching behavior does not occur.

5.2. The Second Crack-Branching Model

Figure 9 presents the crack propagation paths of all the second crack-branching models. Figure 10 presents the typical crack propagation paths when the models with 0.6 and 0.8 times the true stress versus strain curves of the ductile material A508 were assigned to the left region.
Different from the first crack-branching models, the material properties in the second crack-branching models are changing gradually from left to right. The left region has the lowest strength, while the right region has the highest strength. It can be found from Figure 9 and Figure 10 that when the models with 0.2–0.7 times the true stress versus strain curves of the ductile material A508 were assigned to the left region, the single crack splits into two branches. One of the branches deviates to the left side and grows along the direction perpendicular to the initial crack under high strength mismatch, and the propagation direction of the other branch changes from deviating a little bit to the left side to along the direction of the initial crack, as shown in Figure 10a. When the model with 0.8 times the true stress versus strain curve of the ductile material A508 was assigned to the left region, although it still has two crack branches, the branching phenomenon becomes weak under low strength mismatch. One of the short branches grows along the direction of the initial crack, and the other long branch deviates a little bit to the left side, as shown in Figure 10b. When the models with 0.9–1 times the true stress versus strain curves of the ductile material A508 were assigned to the left region, the crack does not branch.
Since the strength mismatches on both the left and right sides of the crack are different in this kind of model, the results demonstrate that the similar strength mismatch on each side of the crack, which is mentioned in Section 5.1, is a sufficient but not necessary condition for crack branching. As long as there is another large enough propagation trend that is different from the original crack propagation direction, the crack-branching behavior occurs. With increasing strength mismatch, the branching trend becomes more apparent.

5.3. The Third Crack-Branching Model

Figure 11 presents the crack propagation paths of all the third crack-branching models. The typical crack propagation paths when the widths of the center region are 20 and 50 mm are shown in Figure 12, respectively.
Different from the first and second crack-branching models, Figure 11 and Figure 12 present the crack-branching behavior under different center region widths. It found that when the center region width is 10 mm, the single crack splits into two branches. Since the center region is too narrow, the two branches do not propagate along the initial crack direction, but they deviate to the left and right sides separately and grow along with the direction perpendicular to the initial crack. When the center region width is 20 mm, the single crack splits into two branches firstly; then, more crack-branching behaviors occur in the crack propagation process. When the center region width is longer than 20 mm, the single crack splits into two branches. One of the branches deviates a little bit to the left side, and the other branch deviates a little bit to the right side. Especially, when the center region width is longer than 70 mm, the crack branch behaviors do not change. This is because there exists an effect range of material constraint in the welded joints. When the center region width is longer than 70 mm, it exceeds this effect range, and the fracture behaviors of weld joints are no longer influenced by the material mechanical properties that are located out of this effect range [47,48,49].
The results presented also demonstrate that the crack-branching behavior is also affected by the dimensions of different regions in welded joints. A high strength mismatch that is induced by both mechanical properties and dimensions of different regions is the key of crack branching in welded joints.

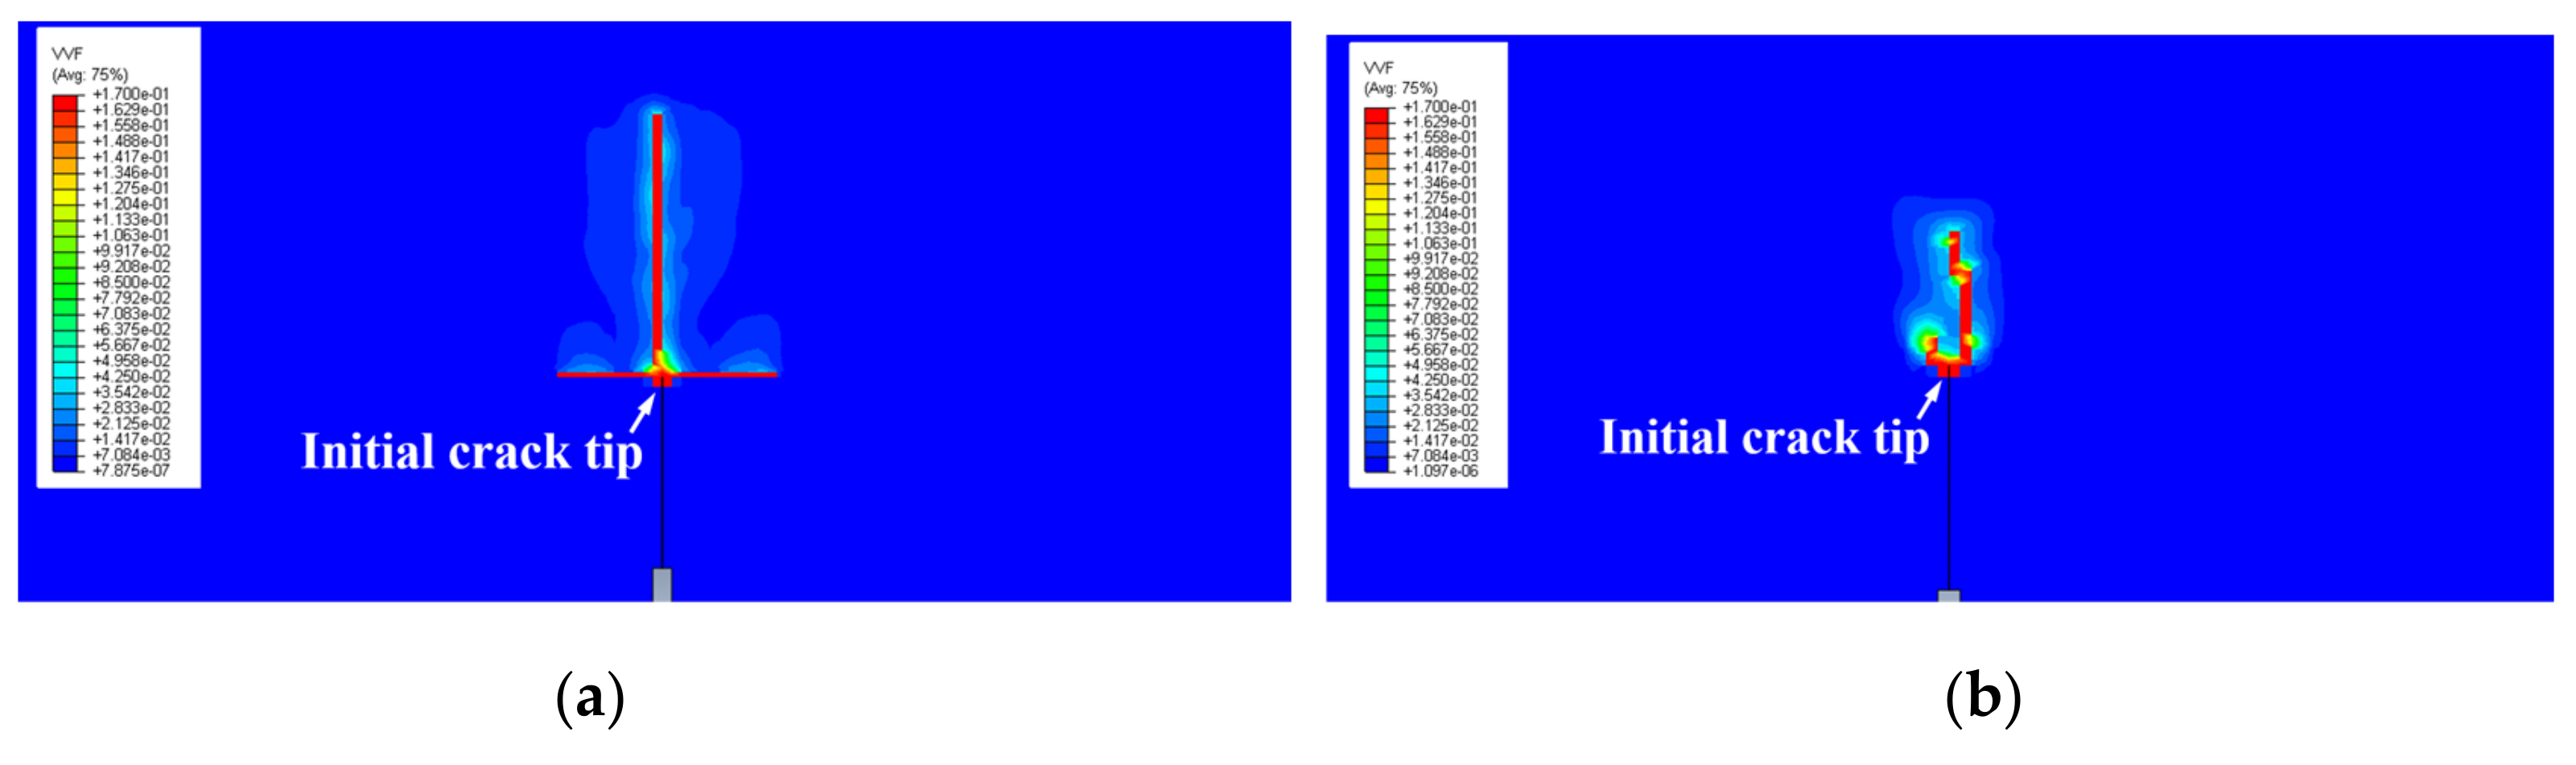
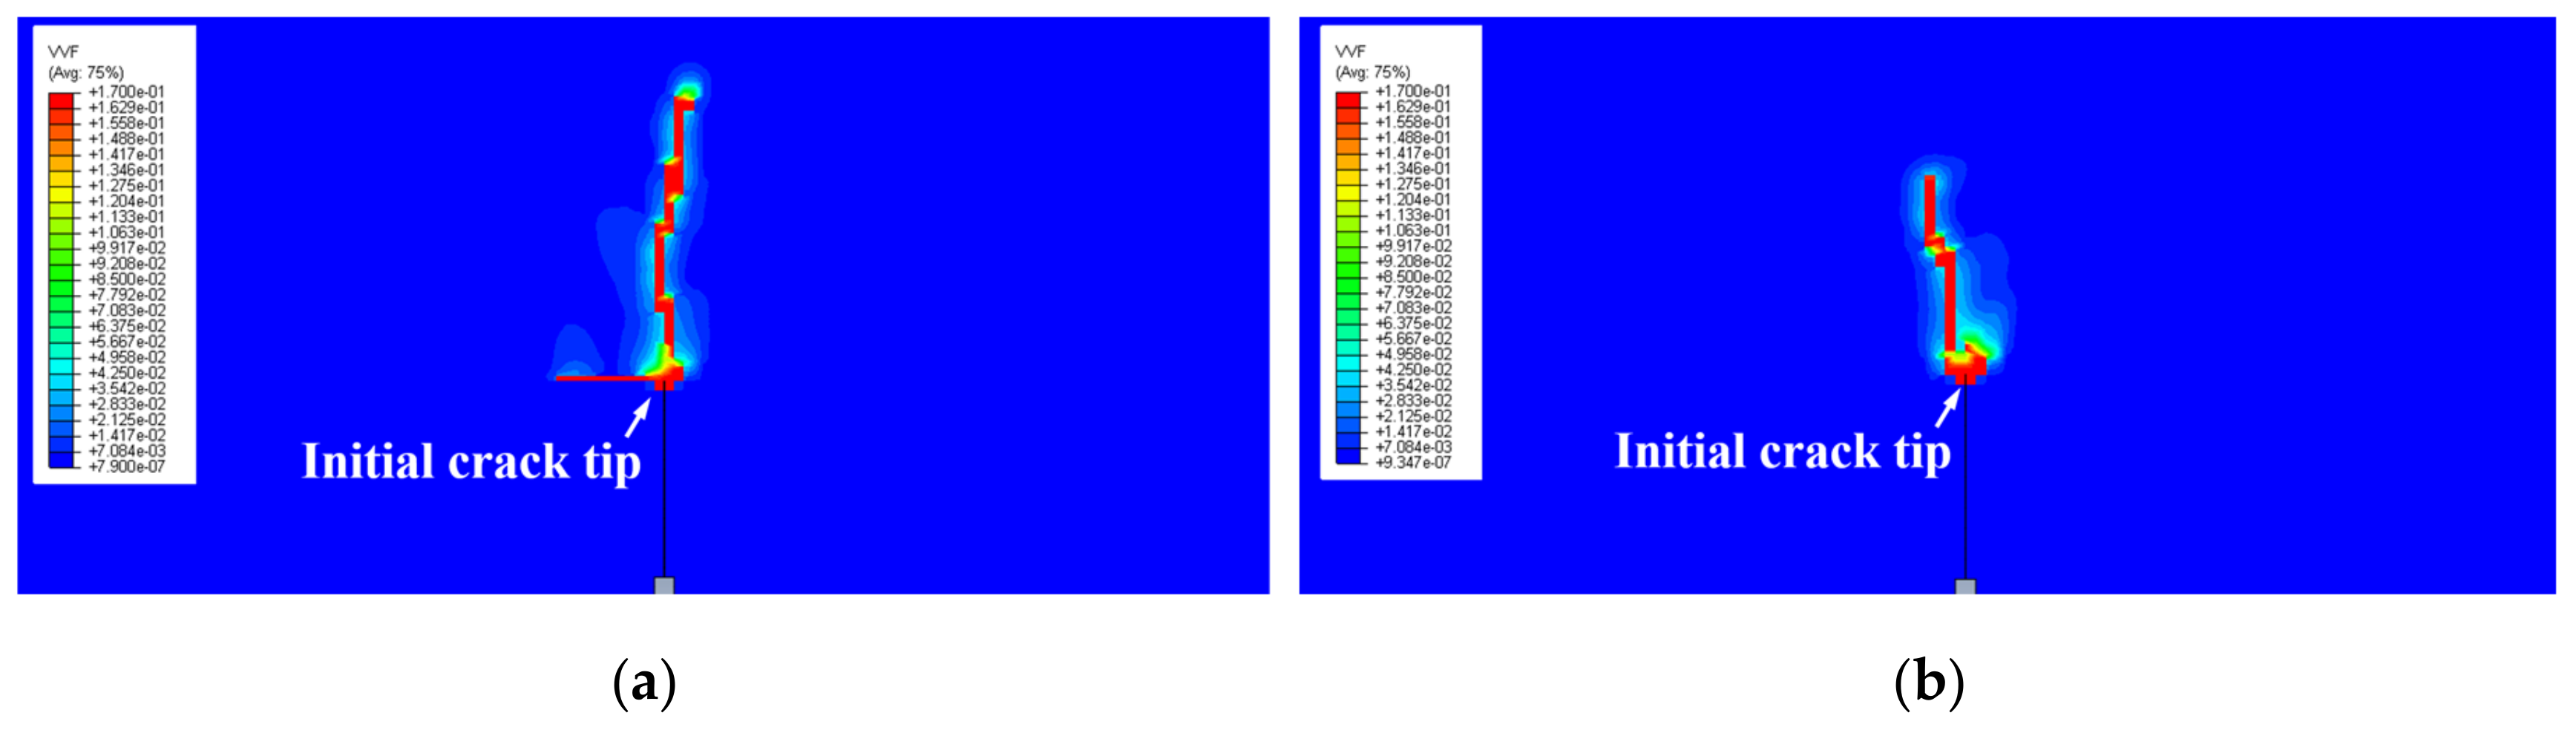
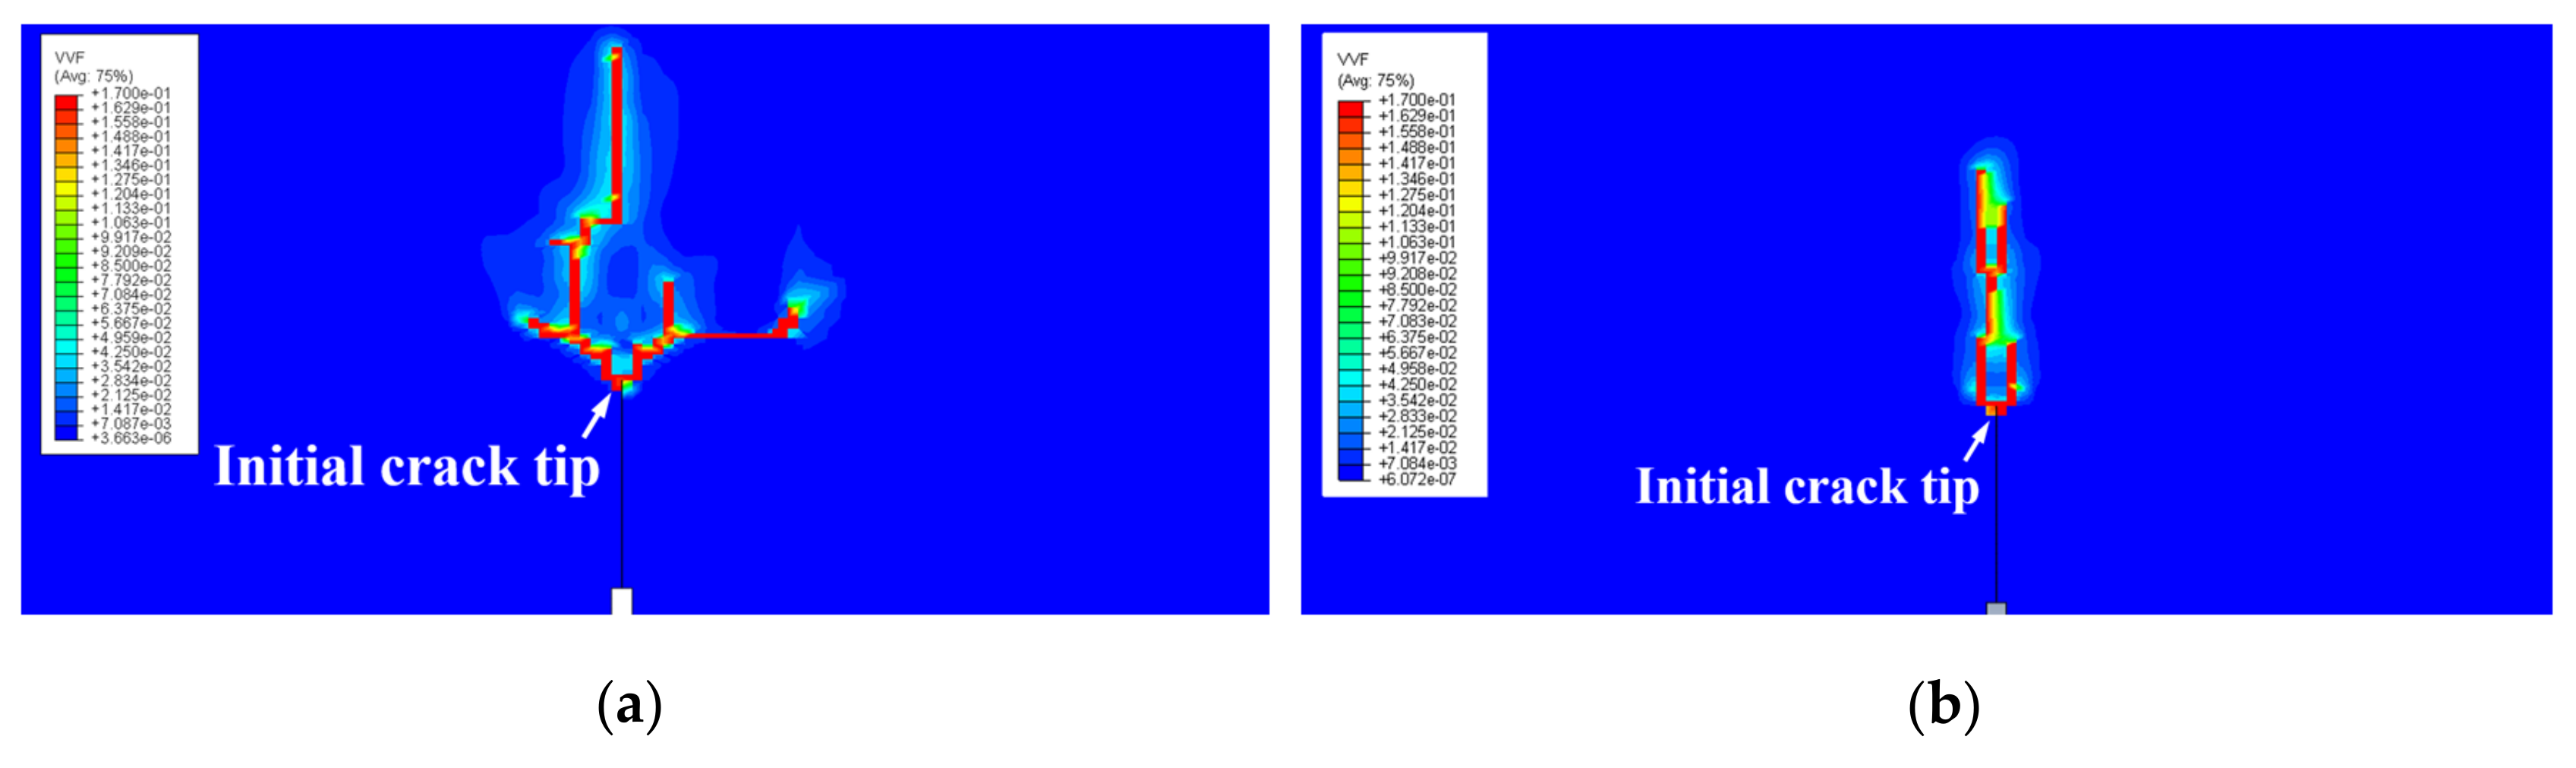
5.4. Crack-Branching Mechanism

In all the above models, the third crack-branching model has the most complex crack-branching behavior when the center region width is 20 mm, as shown in Figure 12a. Thus, in this section, this model was selected to analyze the crack-branching mechanism.
Figure 13 presents the VVF and stress distributions at the time of crack branching. Figure 13a presents the status when the first crack-branching event occurs, and Figure 13b presents the status when the second and third crack-branching events occur. It is found that each crack branching is accompanied by three local high stress concentrations at crack tip, which are produced by loading and strength mismatch. Three pulling forces are created by the three local high stress concentrations that pull the crack propagation along with the directions of stress concentrations.
It can also be found that one of the pulling forces lies in the original crack direction; the other two pulling forces lie in the two sides of the original crack, and they have a similar angle to that of the original crack direction. Under the combined action of the three pulling forces, crack branching occurs, and two new cracks are initiated from the middle of the pulling forces.
In general, the crack-branching behavior (Supplementary Materials) in welded joints was captured and analyzed in this study. Compared with the results obtained from the three kinds of crack-branching models, it can be found that the crack-branching behavior is closely related to high strength mismatch in welded joints. The high strength mismatch may be caused by the mechanical properties of the different regions (the first crack-branching model and the second crack-branching model), or it may be caused by the dimensions of the different regions (the third crack-branching model). With increasing strength mismatch, a crack may split into two, three, or more branches. Moreover, the branch can even grow along with the direction perpendicular to the initial crack under higher strength mismatch. These phenomena are dangerous for welded joints and need to be paid close attention.
In addition, the crack-branching mechanism was also analyzed in this study. Each crack branching is accompanied by three local high stress concentrations at the crack tip. The three local high stress concentrations were produced by loading and strength mismatch, and they will create three pulling forces. The pulling forces will give different propagation trends to the crack. Under the combined action of the three pulling forces, crack branching occurs.
However, there are also some deficiencies. The experimental results that correspond to the crack-branching models were not contained in this study. The main reason is that there exists a heat-affected zone, fusion zone, and near-interface zone in the welded joints. It is difficult to manufacture ideal welded joints the same as the designed models. Thus, for elaborating the problem simply and clearly, some basic models were designed, and only the finite element method was used in this study to obtain the crack-branching behavior. It is a pity that the results in this study do not provide an exact mechanical justification and crack-branching criterion.
In the future, the crack-branching criterion and the correlation of the crack-branching behavior with strength mismatch should be established, and the crack-branching behavior of welded joints can be judged and obtained directly rather than by finite element method simulations or experiments. Then, the results can provide scientific support for the structural integrity assessment and the design of welded joints.

6. Conclusions

(1)
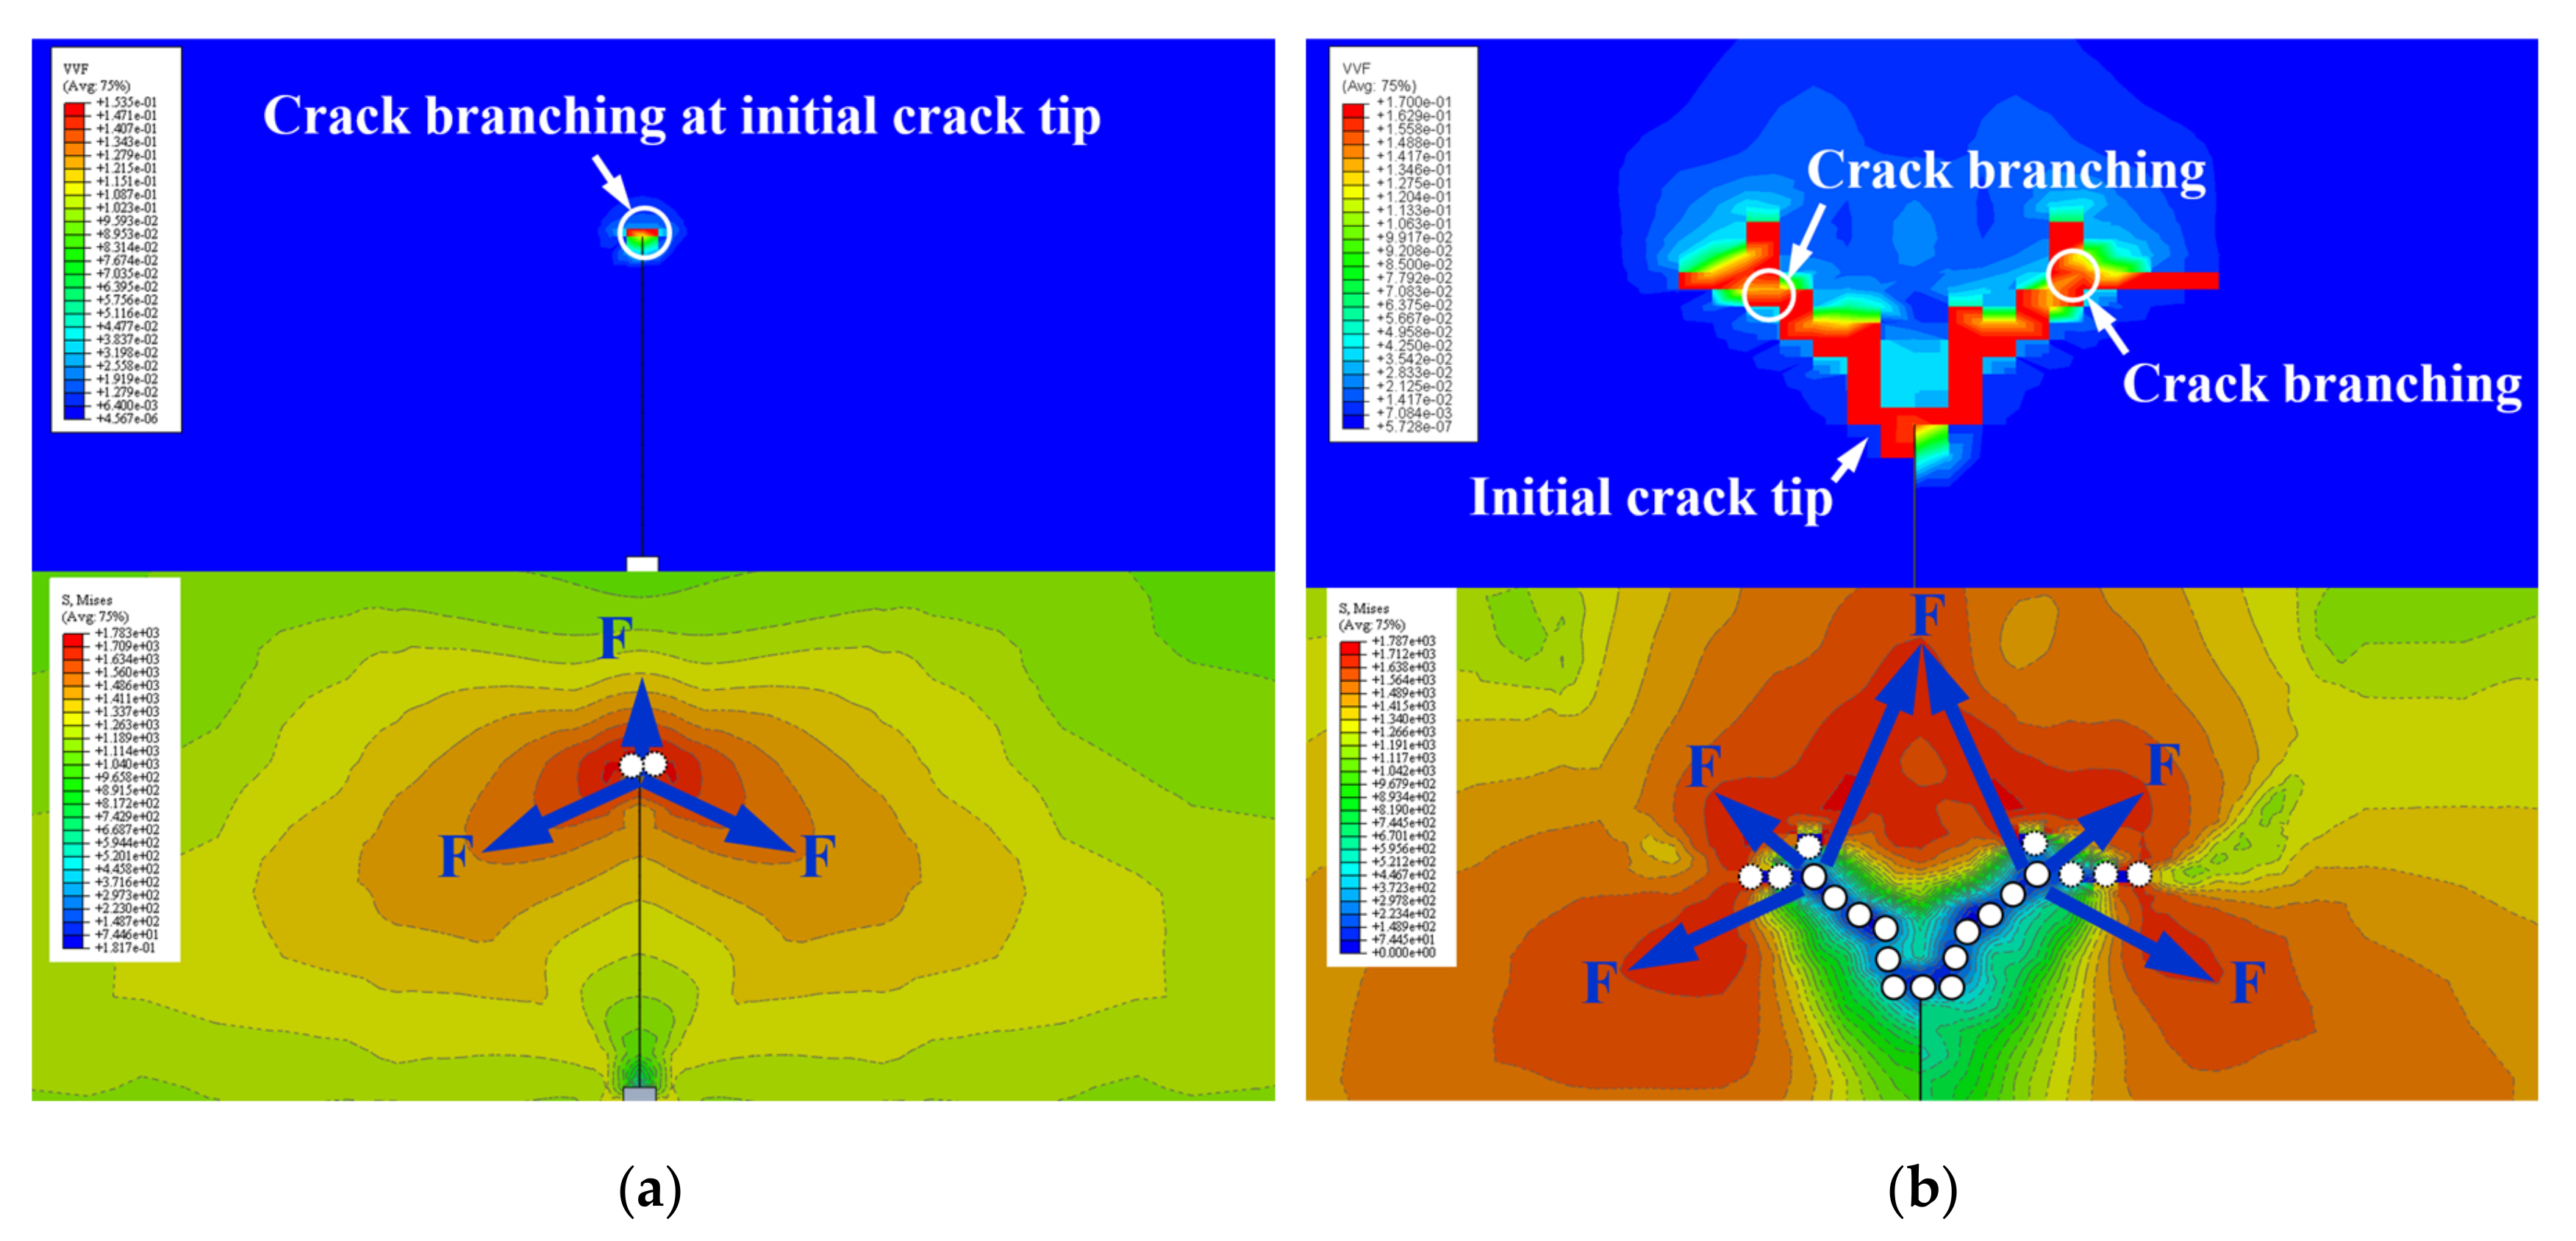
With gradual increasing of the strength mismatch, crack-branching behavior becomes more apparent. Not just the quantity of the branches increases, the branch can even grow along with the direction perpendicular to the initial crack.
(2)
The similar strength mismatch on each side of the crack is a sufficient but not necessary condition for crack branching. As long as there is another large enough propagation trend that is different from the original crack propagation direction, crack-branching behavior occurs. A high strength mismatch that is induced by both the mechanical properties and dimensions of different regions is the key of crack branching in welded joints.
(3)
Each crack branching is accompanied by three local high stress concentrations at the crack tip. Three pulling forces that are created by the three local high stress concentrations pull the crack propagation along with the directions of stress concentrations. Under the combined action of the three pulling forces, crack branching occurs, and two new cracks initiate from the middle of the pulling forces.
(4)
The finite element method based on the GTN damage model is an effective method to simulate the crack-branching behavior in welded joints during the crack propagation process.

Supplementary Materials

The following are available online at https://www.mdpi.com/2075-4701/10/10/1308/s1, Video S1: crack branching behavior.

Author Contributions

Conceptualization, J.Y.; methodology, J.Y.; software, W.W. and Q.Y.; validation, W.W., J.Y., H.C. and Q.Y.; writing—original draft preparation, W.W.; writing—review and editing, J.Y. and H.C. All authors have read and agreed to the published version of the manuscript.

Funding

This research was funded by (National Natural Science Foundation of China) grant number (51975378 and 51828501).

Acknowledgments

The authors would like to thank University of Shanghai for Science and Technology, University of Strathclyde and Shanghai Municipal Education Commission for their support.

Conflicts of Interest

The authors declare no conflict of interest.

References

  1. Cox, B.N.; Gao, H.; Gross, D.; Rittel, D. Modern topics and challenges in dynamic fracture. J. Mech. Phys. Solids 2005, 53, 565–596. [Google Scholar] [CrossRef]
  2. Bouchbinder, E.; Fineberg, J.; Marder, M. Dynamics of simple cracks. Annu. Rev. Condens. Matter Phys. 2010, 1, 371–395. [Google Scholar] [CrossRef] [Green Version]
  3. Forquin, P. An optical correlation technique for characterizing the crack velocity in concrete. Eur. Phys. J. Spec. Top. 2012, 206, 89–95. [Google Scholar] [CrossRef]
  4. Curbach, M.; Eibl, J. Crack velocity in concrete. Eng. Fract. Mech. 1990, 35, 321–326. [Google Scholar] [CrossRef]
  5. Ožbolt, J.; Sharma, A.; Reinhardt, H.W. Dynamic fracture of concrete-compact tension specimen. Int. J. Solids Struct. 2011, 48, 1534–1543. [Google Scholar] [CrossRef]
  6. Ožbolt, J.; Bošnjak, J.; Sola, E. Dynamic fracture of concrete compact tension specimen: Experimental and numerical study. Int. J. Solids Struct. 2013, 50, 4270–4278. [Google Scholar] [CrossRef] [Green Version]
  7. Ožbolt, J.; Bede, N.; Sharma, A.; Mayer, U. Dynamic fracture of concrete L-specimen: Experimental and numerical study. Eng. Fract. Mech. 2015, 148, 27–41. [Google Scholar] [CrossRef]
  8. Zhang, Q.B.; Zhao, J. A review of dynamic experimental techniques and mechanical behaviour of rock materials. Rock Mech. 2014, 47, 1411–1478. [Google Scholar] [CrossRef] [Green Version]
  9. Mecholsky, J.J., Jr.; DeLellis, D.P.; Mecholsky, N.A. Relationship between fractography, fractal analysis and crack branching. J. Eur. Ceram. Soc. 2020, 40, 4722–4726. [Google Scholar] [CrossRef]
  10. Nakamura, N.; Kawabata, T.; Takashima, Y.; Yanagimoto, F. Effect of the stress field on crack branching in brittle material. Theor. Appl. Fract. Mech. 2020, 128, 102583. [Google Scholar] [CrossRef]
  11. Chen, Z.; Ju, J.W.; Su, G.; Huang, X.; Li, S.; Zhai, L. Influence of micro-modulus functions on peridynamics simulation of crack propagation and branching in brittle materials. Eng. Fract. Mech. 2019, 216, 106498. [Google Scholar] [CrossRef]
  12. Kou, M.M.; Lian, Y.J.; Wang, Y.T. Numerical investigations on crack propagation and crack branching in brittle solids under dynamic loading using bond-particle model. Eng. Fract. Mech. 2019, 212, 41–56. [Google Scholar] [CrossRef]
  13. Li, J.; Xie, Y.J.; Zheng, X.Y.; Cai, Y.M. Underlying fracture trends and triggering on Mode-II crack branching and kinking for quasi-brittle solids. Eng. Fract. Mech. 2019, 211, 382–400. [Google Scholar] [CrossRef]
  14. Bouchbinder, E.; Mathiesen, J.; Procaccia, I. Branching instabilities in rapid fracture: Dynamics and geometry. Phys. Rev. E 2005, 71, 056118. [Google Scholar] [CrossRef] [PubMed] [Green Version]
  15. Boué, T.G.; Cohen, G.; Fineberg, J. Origin of the microbranching instability in rapid cracks. Phys. Rev. Lett. 2015, 114, 054301. [Google Scholar] [CrossRef]
  16. Karma, A.; Lobkovsky, A.E. Unsteady crack motion and branching in a phase-field model of brittle fracture. Phys. Rev. Lett. 2004, 92, 245510. [Google Scholar] [CrossRef] [PubMed] [Green Version]
  17. Falk, M.L.; Needleman, A.; Rice, J.R. A critical evaluation of cohesive region models of dynamic fracture. J. Phys. IV 2001, 11, 43–50. [Google Scholar]
  18. Zhou, F.; Molinari, J.F.; Shioya, T. A rate-dependent cohesive model for simulating dynamic crack propagation in brittle materials. Eng. Fract. Mech. 2005, 72, 1383–1410. [Google Scholar] [CrossRef]
  19. Belytschko, T.; Chen, H.; Xu, J.; Zi, G. Dynamic crack propagation based on loss of hyperbolicity and a new discontinuous enrichment. Int. J. Numer. Meth. Eng. 2003, 58, 1873–1905. [Google Scholar] [CrossRef]
  20. Xu, D.; Liu, Z.; Liu, X.; Zeng, Q.; Zhuang, Z. Modeling of dynamic crack branching by enhanced extended finite element method. Comput. Mech. 2014, 54, 489–502. [Google Scholar] [CrossRef]
  21. Henry, H. Study of the branching instability using a phase field model of inplane crack propagation. EPL-Europhys. Lett. 2008, 83, 16004. [Google Scholar] [CrossRef]
  22. Bleyer, J.; Roux-Langlois, C.; Molinari, J.F. Dynamic crack propagation with a variational phase-field model: Limiting speed, crack branching and velocity-toughening mechanisms. Int. J. Fract. 2017, 204, 79–100. [Google Scholar] [CrossRef] [Green Version]
  23. Hofacker, M.; Miehe, C. Continuum phase field modeling of dynamic fracture: Variational principles and staggered FE implementation. Int. J. Fract. 2012, 178, 113–129. [Google Scholar] [CrossRef]
  24. Hofacker, M.; Miehe, C. A phase field model of dynamic fracture: Robust field updates for the analysis of complex crack patterns. Int. J. Numer. Meth. Eng. 2013, 93, 276–301. [Google Scholar] [CrossRef]
  25. Karma, A.; Kessler, D.A.; Levine, H. Phase-field model of mode III dynamic fracture. Phys. Rev. Lett. 2001, 87, 045501. [Google Scholar] [CrossRef] [PubMed] [Green Version]
  26. Henry, H.; Adda-Bedia, M. Fractographic aspects of crack branching instability using a phase-field model. Phys. Rev. E 2013, 88, 060401. [Google Scholar] [CrossRef] [Green Version]
  27. Bobaru, F.; Zhang, G. Why do cracks branch? A peridynamic investigation of dynamic brittle fracture. Int. J. Fract. 2015, 196, 59–98. [Google Scholar] [CrossRef]
  28. Lloberas-Valls, O.; Huespe, A.E.; Oliver, J.; Dias, I.F. Strain injection techniques in dynamic fracture modeling. Comput. Method Appl. Mech. 2016, 308, 499–534. [Google Scholar] [CrossRef] [Green Version]
  29. Linder, C.; Armero, F. Finite elements with embedded branching. Finite Elem. Anal. Des. 2009, 45, 280–293. [Google Scholar] [CrossRef]
  30. Geelen, R.J.M.; Liu, Y.; Dolbow, J.E.; Rodríguez-Ferran, A. An optimization-based phase-field method for continuous-discontinuous crack propagation. Int. J. Numer. Meth. Eng. 2018, 116, 1–20. [Google Scholar] [CrossRef] [Green Version]
  31. Wu, T.; Carpiuc-Prisacari, A.; Poncelet, M.; De Lorenzis, L. Phase-field simulation of interactive mixed-mode fracture tests on cement mortar with full-field displacement boundary conditions. Eng. Fract. Mech. 2019, 182, 658–688. [Google Scholar] [CrossRef]
  32. Yang, J.; Wang, G.Z.; Xuan, F.Z.; Tu, S.T.; Liu, C.J. An experimental investigation of in-plane constraint effect on local fracture resistance of a dissimilar metal welded joint. Mater. Des. 2014, 53, 611–619. [Google Scholar] [CrossRef]
  33. Yang, J.; Wang, G.Z.; Xuan, F.Z.; Tu, S.T.; Liu, C.J. Out-of-plane constraint effect on local fracture resistance of a dissimilar metal welded joint. Mater. Des. 2014, 55, 542–550. [Google Scholar] [CrossRef]
  34. Wang, H.T.; Wang, G.Z.; Xuan, F.Z.; Liu, C.J.; Tu, S.T. Local mechanical properties and microstructures of Alloy52M dissimilar metal welded joint between A508 ferritic steel and 316L stainless steel. Adv. Mater. Res. 2012, 509, 103–110. [Google Scholar] [CrossRef]
  35. Gurson, A.L. Continuum theory of ductile rupture by void nucleation and growth: Part I-Yield criteria and flow rules for porous ductile media. J. Eng. Mater. Technol. 1977, 99, 2–15. [Google Scholar] [CrossRef]
  36. Chu, C.C.; Needleman, A. Void nucleation effects in biaxially stretched sheets. J. Eng. Mater. Technol. 1980, 102, 249–256. [Google Scholar] [CrossRef]
  37. Tvergaard, V. Influence of voids on shear band instabilities under plane strain conditions. Int. J. Fract. 1981, 17, 389–407. [Google Scholar] [CrossRef]
  38. Tvergaard, V. On localization in ductile materials containing spherical voids. Int. J. Fract. 1982, 18, 157–169. [Google Scholar]
  39. Tvergaard, V.; Needleman, A. Analysis of the cup-cone fracture in a round tensile bar. Acta Metal. 1984, 32, 157–169. [Google Scholar] [CrossRef]
  40. Benseddiq, N.; Imad, A. A ductile fracture analysis using a local damage model. Int. J. Pres. Ves. Pip. 2008, 85, 219–227. [Google Scholar] [CrossRef]
  41. Yang, J.; Wang, G.Z.; Xuan, F.Z.; Tu, S.T. Unified characterisation of in-plane and out-of-plane constraint based on crack-tip equivalent plastic strain. Fatigue Fract. Eng. Mater. Struct. 2013, 36, 504–514. [Google Scholar] [CrossRef]
  42. Østby, E.; Thaulow, C.; Zhang, Z.L. Numerical simulations of specimen size and mismatch effects in ductile crack growth-Part I: Tearing resistance and crack growth paths. Eng. Fract. Mech. 2007, 74, 1770–1792. [Google Scholar] [CrossRef]
  43. Østby, E.; Thaulow, C.; Zhang, Z.L. Numerical simulations of specimen size and mismatch effects in ductile crack growth-Part II: Near-tip stress fields. Eng. Fract. Mech. 2007, 74, 1793–1809. [Google Scholar] [CrossRef]
  44. Yang, J. Micromechanical analysis of in-plane constraint effect on local fracture behavior of cracks in the weakest locations of dissimilar metal welded joint. Acta Metall. Sin. 2017, 30, 840–850. [Google Scholar] [CrossRef]
  45. Penuelas, I.; Betegon, C.; Rodriguez, C. A ductile failure model applied to the determination of the fracture toughness of welded joints. Numerical simulation and experimental validation. Eng. Fract. Mech. 2006, 73, 2756–2773. [Google Scholar] [CrossRef]
  46. Wang, H.T.; Wang, G.Z.; Xuan, F.Z.; Tu, S.T. An experimental investigation of local fracture resistance and crack growth paths in a dissimilar metal welded joint. Mater. Des. 2013, 44, 179–189. [Google Scholar] [CrossRef]
  47. Yang, J.; Wang, L. Effect Range of the Material Constraint—I. Center Crack. Materials 2019, 12, 67. [Google Scholar] [CrossRef] [Green Version]
  48. Dai, Y.; Yang, J.; Wang, L. Effect Range of the Material Constraint—II. Interface Crack. Metals 2019, 9, 696. [Google Scholar] [CrossRef] [Green Version]
  49. Dai, Y.; Yang, J.; Chen, H.F. Effect range of the material constraint in different strength mismatched laboratory specimens. Appl. Sci. 2020, 10, 2434. [Google Scholar] [CrossRef] [Green Version]
Figure 1. The true stress versus strain curve of the ductile material A508.
Metals 10 01308 g001
Figure 2. The structure and materials of the first crack-branching model.
Metals 10 01308 g002
Figure 3. The structure and materials of the second crack-branching model.
Metals 10 01308 g003
Figure 4. The structure and materials of the third crack-branching model.
Metals 10 01308 g004
Figure 5. The finite element meshes of the typical designed crack-branching model.
Metals 10 01308 g005
Figure 6. The comparison of finite element results obtained by the Gurson–Tvergaard–Needleman (GTN) damage model with experimental results: (a) crack propagation paths; (b) J-resistance curves.
Metals 10 01308 g006
Figure 7. The crack propagation paths of all the first crack-branching models.
Metals 10 01308 g007
Figure 8. The typical crack propagation paths when 0.6 times (a) and 0.8 times (b) the true stress versus strain curves of the ductile material A508 were assigned to the left region and the right region.
Metals 10 01308 g008
Figure 9. The crack propagation paths of all the second crack-branching models.
Metals 10 01308 g009
Figure 10. The typical crack propagation paths when the models with 0.6 times (a) and 0.8 times (b) the true stress versus strain curves of the ductile material A508 were assigned to the left region.
Metals 10 01308 g010
Figure 11. The crack propagation paths of all the third crack-branching models.
Metals 10 01308 g011
Figure 12. The typical crack propagation paths when the widths of the center region were 20 mm (a) and 50 mm (b).
Metals 10 01308 g012
Figure 13. The void volume fraction (VVF) and stress distributions when the first crack-branching event occurs (a) and the second and third crack-branching events (b).
Metals 10 01308 g013

