Article

Finite Element Analysis and Experimental Evaluation of Residual Stress of Zr-4 alloys Processed through Swaging

by
Gaurav Singh
1,
Bijit Kalita
1,
K. I. Vishnu Narayanan
2,
Umesh Kumar Arora
2,
Manas M. Mahapatra
3 and
Rengaswamy Jayaganthan
1,*
1
Department of Engineering Design, IIT Madras, Chennai 600036, India
2
Nuclear Fuel Complex, Hyderabad, Telangana 500062, India
3
School of Mechanical Sciences, Indian Institute of Technology Bhubaneswar, Argul, Jatani 751013, India
*
Author to whom correspondence should be addressed.
Metals 2020, 10(10), 1281; https://doi.org/10.3390/met10101281
Submission received: 31 August 2020 / Revised: 19 September 2020 / Accepted: 19 September 2020 / Published: 25 September 2020
(This article belongs to the Section Metal Casting, Forming and Heat Treatment)

Abstract

:
Zirconium alloy has been extensively used as a cladding material in nuclear power reactors due to its low neutron absorption cross section, excellent mechanical properties, and corrosion resistance. The influence of the swaging parameter, feed rate (0.7, 1.25, 2 m/min) on residual stress induced in Zr-4 alloy is investigated in the present work. A three-dimensional finite element model was implemented in the Deform 3D software to simulate the rotary swaging (RS) process over a circular rod of Zr-4 alloy. The simulation results based on the 3D framework provide a detailed insight of residual stress, true stress versus true strain and force applied over the rod during the multiple pass swaging process; the results are compared with experimental results. The experimental hole drilling method is used to determine the residual stresses on swaged zirconium alloy at different feed rates (0.7, 1.25, and 2 m/min). A similar trend of residual stress between experimental and numerical results from the surface to the center on the swaged rod samples is observed. The same magnitude of residual stress at the surface of the swaged Zr-4 rod is also observed. It is found to be compressive at the surface and tensile in the center of the samples, as observed in the present work.

1. Introduction

Zirconium alloys processed through the swaging technique are used in nuclear power reactors and chemical industries due to their excellent tensile properties, fracture toughness and corrosion resistance. Swaging is a metal forming process by which the diameter of a rod or tube is reduced by forcing it into a die with the help of a reciprocating blow. The forming dies of the swaging machine are arranged concentrically around the work piece (Figure 1a). The swaging dies perform high frequency radial movements with short strokes. Rotary swaging (RS) can be performed under hot and cold conditions, depending on the swaged material, required surface quality and final properties [1,2]. Infeed rotary swaging, the work piece is fed axially inside the set of dies but in the recess swaging process, the work piece is not fed axially forward or outward (Figure 1a). The sinking zone is much smaller than the forging zone. Therefore, the infeed swaging process is often utilized in the situation where the work piece is necked from one end. The recess swaging process is often used to reduce the diameter at a certain position of the work piece, or to form a concave profile [1,2,3,4,5,6].
The work piece can be classified into three zones when it is inside the dies; they are the sinking zone, the forging zone and the sizing zone (Figure 1b) [3]. Similarly, the dies can be classified into three zones such as the reduction, calibration and exit zones. The outside part at the sinking zone suffers from triaxial compressive stress as it is in direct contact with the die and therefore, the deformation of this part is more severe. The outside part at the sizing zone suffers from axial tensile stress due to the axial elongation. The axial elongation of the work piece as well as the necking predicted in the simulation are caused by the axial tensile stress by virtue of the deformation occurring in the sizing zone [1]. During the rotary swaging process, the forming of the work piece takes place in the swaging head in small steps by a radial oscillating movement of the tools. A rotary swaging process utilizing an energy-controlled method was discussed in [1]. The deformation of the tube mainly occurs at the sinking zone. The radial action of the dies is generated by rotation of the driven swaging spindle due to the cam shaped outline of the shoe. Through the roll-off-process between the shoes and the cylinder rollers, the dies are moved inwards simultaneously at every overrun of the cams. The cross section of the axially fed work piece becomes reduced. Due to the rotation of the swaging spindle relative to the work piece, a constant circumferential shaping can be obtained [7,8].
Various parameters of swaging can affect the microstructure, mechanical properties and residual stresses on the materials being processed. The die angle, die stroke, feed velocity, and the friction coefficient would affect the deformation of the work piece. Incremental forming processes have been studied in recent years, in most cases using finite element modelling (FEM) due to its high precision. Specifically, FEM is used in rotary swaging in order to study the strain and stress distributions in the work piece [4], especially the influence of the axial feed velocity on the strain field [5], the influence of friction and the die angle on residual stresses [6] and temperature distribution during the process [9,10]. Axisymmetric quadrilateral full integration elements were chosen to develop the finite element analysis (FEA) model of rotary swaging for an Mg alloy [11]. FEA was conducted for the tungsten heavy alloy using FORGE software; the highest strain was observed in the surface regions, which were directly affected by the swaging dies [12]. Using Forge NxT commercial software, FEA was conducted for an elastic-viscoplastic material model [12].
Swaging has led to a substantial increase in the ultimate tensile strength and a decrease in ductility [13,14]. The finite element (FE) model has shown the variation of strain from surface to central axis of swaged Al–Cu clad composite [15]. The residual stress component in the axial direction is much larger than that in other directions and as a result, it becomes one of the basic factors causing transverse surface cracks in the subsequent rotary swaging (RS) passes [16]. The zones of swaging are explicitly shown using ABAQUS software (6.16, Dassault Systèmes®, Vélizy-Villacoublay, France). The axial reaction was compared using lubricant as well as without lubricant [17]. A combined friction law was used to model the friction in the die-workpiece interface for recess swaging [18]. Forge 2011 3D was used for FEA of copper AISI C11000 tube that suffers triaxial stress during the rotary swaging process [3]. Fluctuations in the stroke height, which are in the range of the tolerance of the components of the swaging head, has led to strong fluctuations in residual stress distribution [2]. The 2D axisymmetric and 3D FE analysis is used in modelling residual stresses and forging load in the cold radial forging process. Metal flow in the deformation gap has been performed using the finite element method in the real swaging process [19]. The Lagrange type incompressibility condition and boundary conditions for velocity were considered as reported in the literature [20]. The local strain distribution calculations were verified using experimentally available data on Inconel 718 [21]. FEM analysis based on plane 2D elements was used for determining the state of stress and analysis of the metal flow in swaging [8].
Zirconium alloy is used in nuclear fission reactor applications due to its superior mechanical properties compared to other structural material like stainless steel [22]. Zirconium alloys have a good combination of strength and ductility, high corrosion and oxidation resistance and a low neutron absorption cross section area [23,24,25,26]. Residual stresses are induced into the materials due to plastic deformation, annealing, phase transformation and welding in material components [27]. Residual stress is an important criterion for choosing the cladding material for nuclear applications because of severe plastic deformation processes such as rotary swaging, extrusion, the rolling process, and hot pressure torsion and dissimilar metal welding used for processing this alloy [28,29,30]. Residual stresses are measured by different methods such as, X-Ray diffraction (XRD), hole drilling and deep hole drilling, and the hole contour method and block removal [31]. XRD has the ability to measure only surface residual stresses, while semi destructive techniques like deep hole drilling are able to measure the residual stress up to 750 mm depth in the material [32]. Various studies have been carried out on other alloys such as titanium alloys, tungsten-based alloys and copper alloys. The effect of rotary swaging and annealing on residual stress for WNiCo powder-based pseudo alloy was predicted using numerical and experimental techniques (XRD technique) [33]. It was reported that swaging at room temperature introduced higher compressive stresses which decreased after the post heat treatment process [13,33]. Residual stress analyses through X-ray diffraction and the elastoplastic self-consistent (EPSC) model were made on cold pilgered zirconium alloy [34]. The contribution and magnitude of the first and second order residual stresses were evaluated using inputs from the modeling [34]. It is possible to determine the basic characteristics of strain distribution, the strain rate, the local strain intensities, and the displacement rates of the work piece, as well as the swaging force. To understand residual stresses, Henriksen et.al conducted a series of tests and stated that grain deformation in the surface layer generates residual stresses [35]. Therefore, according to his study, mechanical deformation is the key factor for residual stress generation in the materials. A parametric study of machining parameters in order to understand the impact on the residual stresses in materials is reported using an arbitrary Lagrangian-Eulerian (ALE) finite element approach [36].

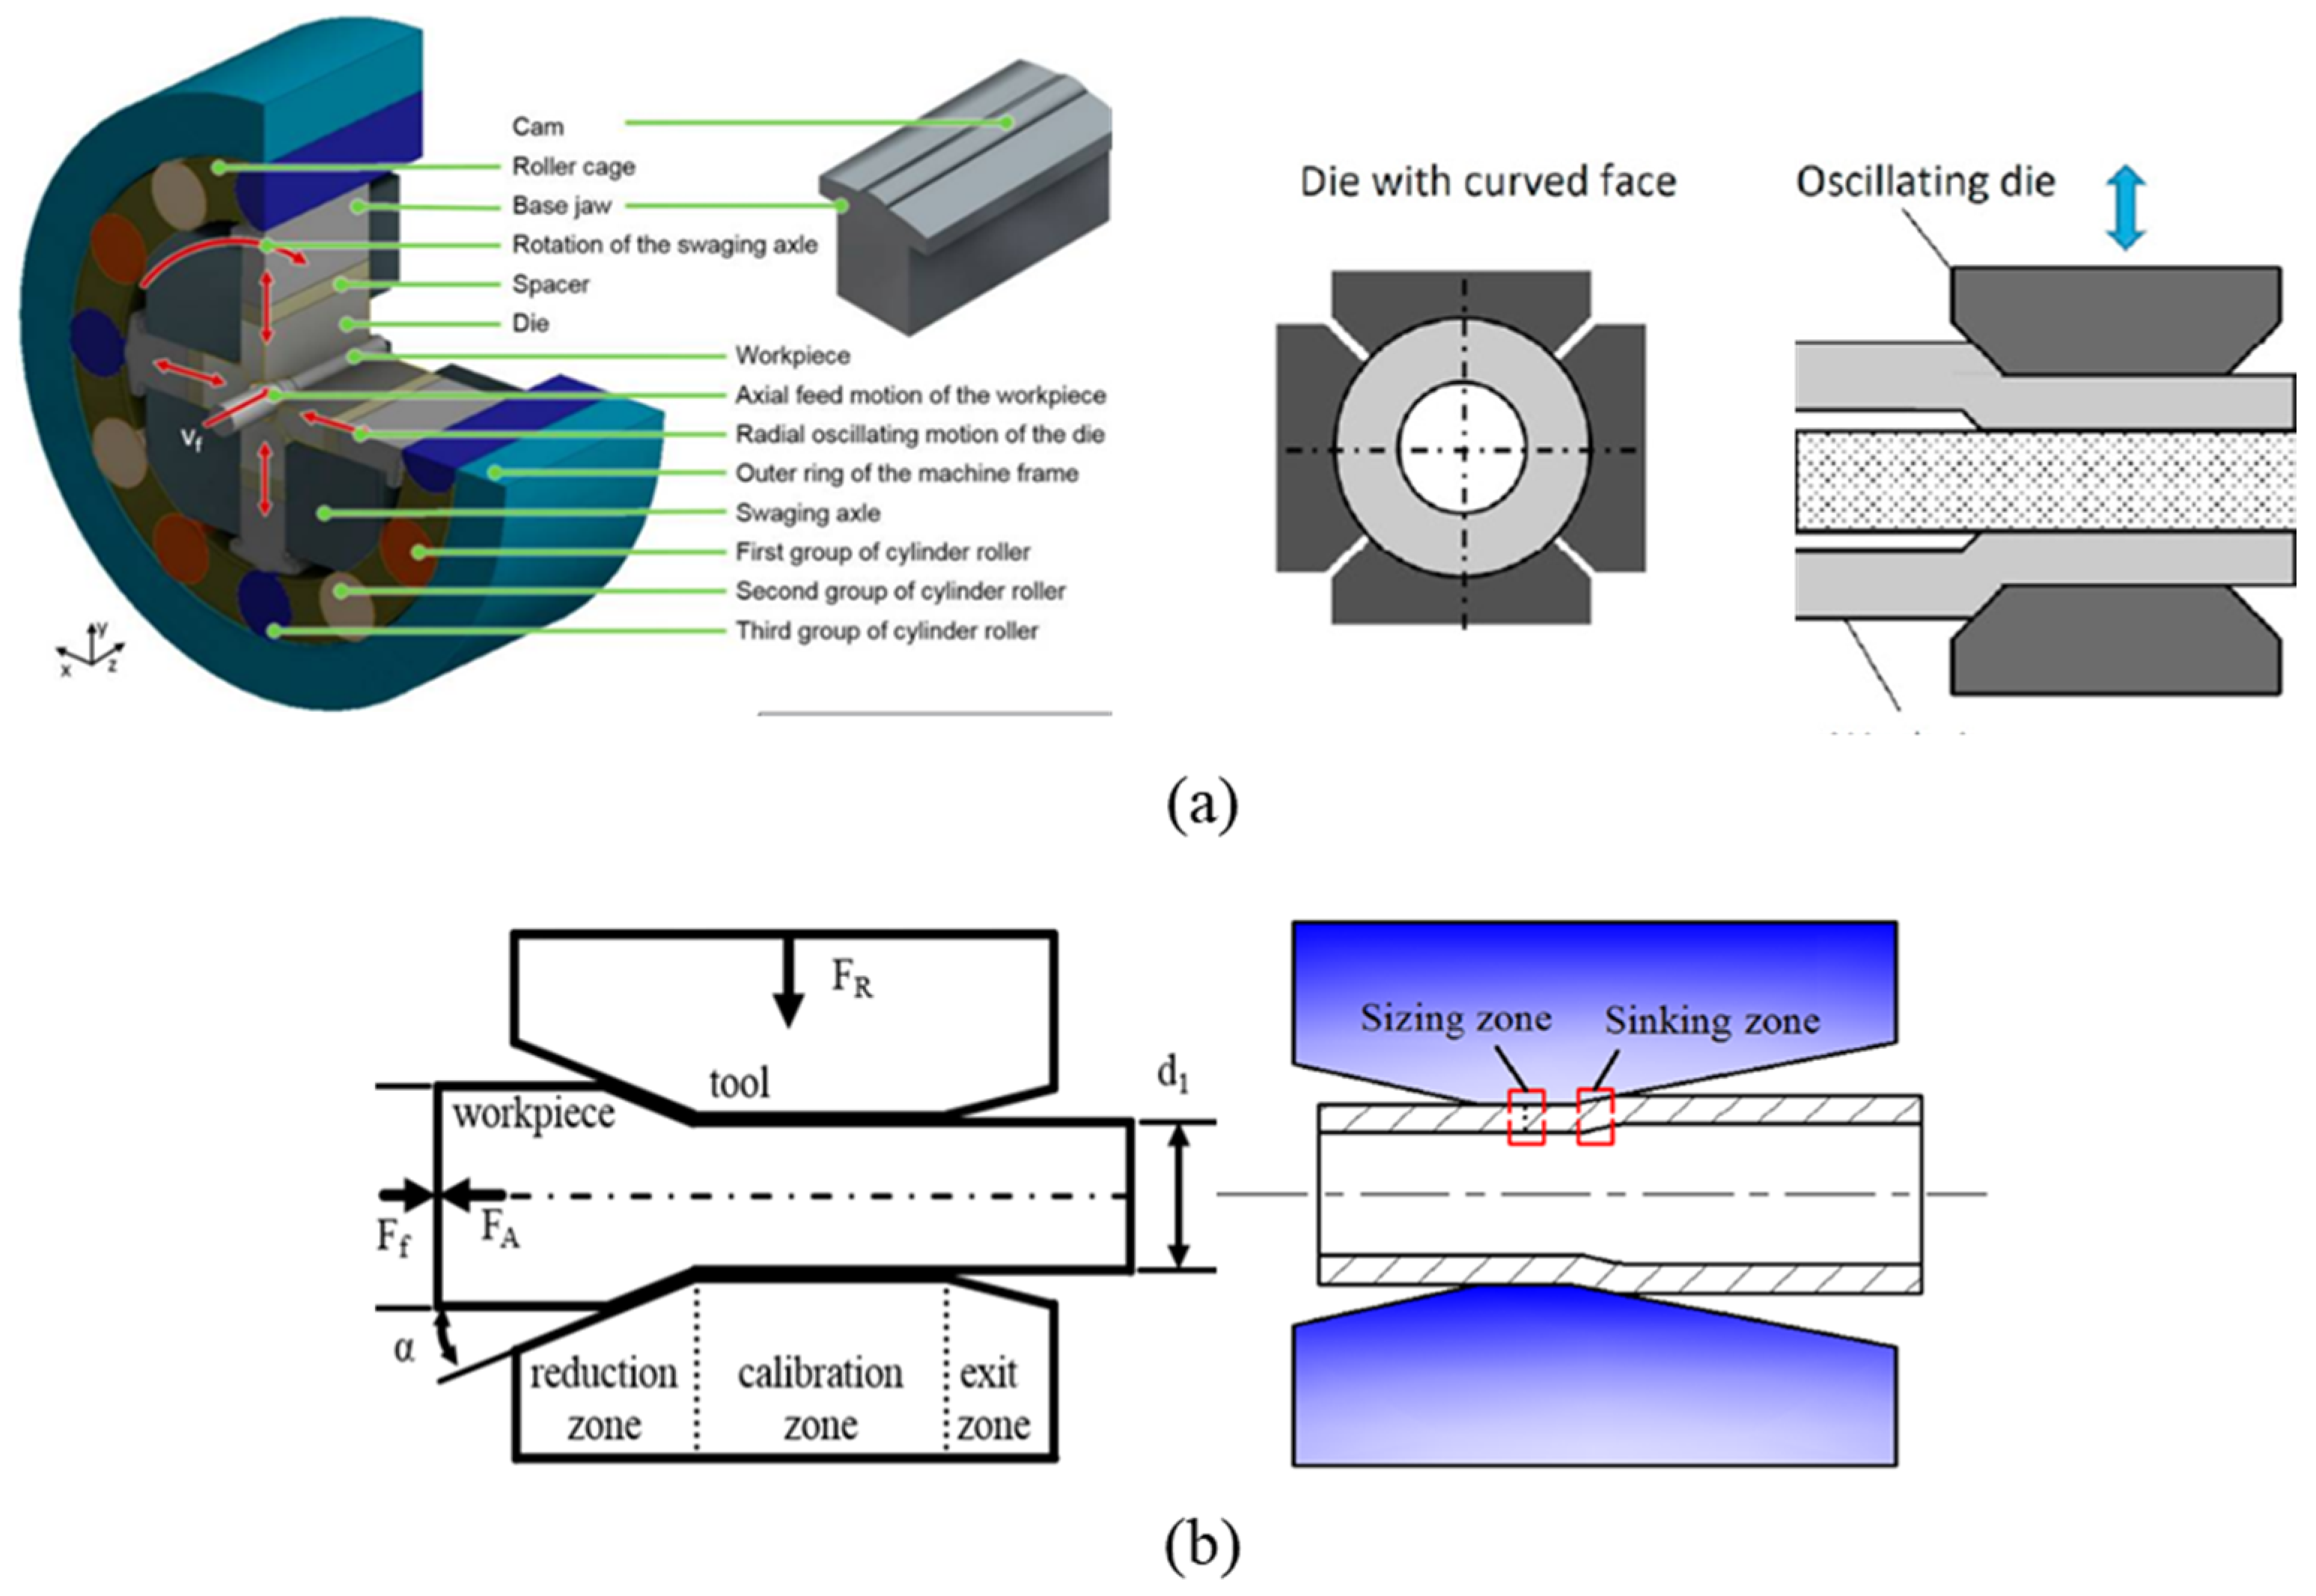
2. Finite Element Analysis

FE analysis is a consequence of the trend followed by industry in the past few decades towards an improvement of the process and the use of total quality programs. There is an increasing demand in recent times to produce more output with better quality and lower costs. Consequently, the use of computer modelling has become increasingly appealing to industry. Its application provides important design information on the shape and integrity of the part, the required force, wear on tools and an understanding of the metal working process, where conventional analytical methods are restricted to the steady-state stage of the process. Thus, conventional methods cannot provide an insight into the dynamic changes that occur during the initial stage of the process. In addition, the simulations are advantageous for their ability to easily vary geometry and boundary conditions, consequently facilitating detailed studies of deformation patterns. The process (billet, tools), once modelled, can be used for a large variety of investigations by simply changing the boundary conditions in the model.
The literatures on determination of residual stress in zirconium alloy by numerical and experimental methods is limited. A 3D finite element model based on plastic as well as elastic-plastic formulation are developed using the commercial finite element software DEFORM 3D (12.1, Scientific Forming Technologies Corporation Columbus, Ohio, Unites States) in the present work to analyse the residual stress in zircaloy-4 (Zr-4 alloy). DEFORM 3D uses the finite element method to solve large deformation problems and an automatic mesh generator (AMG) to automatically provide an optimized remeshing capability.
The implicit FE method was used for the analysis, where equilibrium global equations were simultaneously solved implicitly with the Newton-Raphson (N-R) method. The iterative approach used in the implicit FE method may have issues achieving convergence for non-linear material [37]. Explicit FE results are compared with the results of an implicit formulation and computing times were benchmarked for different problems [38]. Implicit FEA in 3D is computationally expensive, but recent works have shown that it can scale well on large high-performance computing machines or clouds [39].

2.1. Modelling

Considering that rotary swaging is a cold forming process, the following assumptions were considered to analyze the processing of Zr-4 alloys: (a) the material is uniform and isotropic, (b) the interface of the dies and the work piece are under isothermal conditions, and (c) the gravity and inertial force are ignored. The friction condition in the die–work piece interface was modelled by the combined (hybrid) friction law, which is the combination of two friction models. The friction model is assumed to be sliding velocity dependent, with a friction coefficient of 0.4, which is commonly used for cold forging conditions. The swaging dies moved radially toward the rod and deformed it. The initial length and diameter of the rod were 500 and 21 mm, respectively. Table 1 shows some process parameters used for the FE modeling of Zircaloy-4.
The Lagrangian incremental model is generally used for all the conventional applications like forming, heat transfer or heat-treatment. It is also useful for modelling the transient phase of processes like rolling, machining, extrusion, drawing, cogging etc. The main advantage is due to easier remeshing, which is useful for large scale deformation as well. However, in case of large deformations, the mesh quality quickly degrades, leading to inaccuracy or even instability, and remeshing is inevitable. Mesh generation for such remeshing can not only be time and resource consuming, but there would also be an error associated with the projection of the solution onto the new mesh; it is the major drawback of the arbitrary Lagrangian-Eulerian (ALE) method.
The convergence of an elasto-plastic solution is dependent on the initial guess of the stress–strain state. There are three initial guess solutions available: (1) the elastic solution, which uses purely elastic deformation data, (2) the plastic solution, which uses plastic deformation data to generate the initial guess, and (3) the previous step solution, which uses the elasto-plastic solution from the previous step to generate the initial guess. In most of the cases, the latter, previous step solution seems to give the best convergence.
The Newton-Raphson (N-R) method is used to solve the problem. It is recommended because generally it converges in fewer iteration than the other available methods [37]. However, solutions are more likely to fail to converge with this method than with other methods. Whereas, the direct iteration method is more likely to converge than the N-R method, but to do so, will generally require more iterations. In the Deform software, matrix equations take care of solving especially large-scale deformation problems.

2.2. Material

In order for a simulation to achieve a high level of accuracy, it is important to have an understanding of the material properties required to specify a material used in DEFORM 3D. The Zr-4 alloy, with an equivalent stress–strain relationship at room temperature, was used for the analysis. The Create a New Material option is used to define the Zr-4 alloy. The rod was assumed to be elasto-plastic. For elastic data, elastic properties like Young’s modulus, Poisson’s ratio and the thermal expansion coefficient were used for the deformation analysis. Assuming that there was no internal heat generation, a Young’s modulus of 99 GPa and a Poisson’s ratio of 0.37 were considered for the simulation. For plastic material, the tabular data format was used. This format is the most versatile format as it can represent any material where flow stress can be given as a function of strain, strain rate, and temperature. This flow stress curve is used to determine the residual stress analysis from the simulation. The Von Mises stress criterion is imposed during simulation. The die and manipulator are considered as rigid bodies for this analysis.

2.3. Mesh

The geometry of the elasto-plastic work specimen is meshed with finite element meshes of tetrahedron elements (shown in Figure 2a); the mesh of the work piece (initial diameter of 21 mm and length of 500 mm) consisted of 27,806 elements and 7142 nodes. For plastic material, brick mesh elements with 6500 elements and 7878 nodes are generated. Deform 3D provides the facilities for automatic remesh wherever necessary. Remeshing criteria were selected as it is the most convenient way to handle the remeshing of objects undergoing large plastic deformation. Remeshing is the process of replacing a distorted mesh with a new undistorted mesh and interpolating the field variables (strain, velocity, damage, and temperature etc.) from the old mesh to the new mesh.

2.4. Boundary Condition

Contact boundary conditions display inter-object boundary contact conditions on a given object. Contact boundary conditions are applied to nodes of a slave object (work piece), and specified contact between those nodes and the surface of a master object (die and manipulator). In master–slave combination, in case of a single deforming object, the deforming object should always be the slave object. In case of multiple deforming bodies, the object with the finer mesh at the interface of the two objects should be the slave object. Contact must be specified for every pair of deformable objects that may contact each other during the simulation. At the interface between two objects, the constant friction coefficient is specified. A separation criteria was imposed for inter object relationships. The dies are assigned a sliding velocity of 30 mm/s over the work piece.

2.5. Residual Stress Analysis Using FEM

Prediction and control of residual stresses and stress concentration in the materials is essential for understanding the fracture toughness and fatigue life of the components. Residual stresses in the work piece are periodically introduced during in various thermo-mechanical forming processes. To predict residual stress values from the simulations of the swaged Zr-4 alloy, 20 measuring points were chosen along the diameter, using the point-tracking technique. The dies are taken away from the tube. These steps provide significant time to recover the elastic part of the formulation. The stress remaining in the tube after the relaxation period was assumed to be the residual stress.

3. Experimental-Residual Stress Measurement

The through thickness residual stresses are measured by using the deep hole drilling technique. The main advantage of using this technique is due to the fact that it can measure the residual stress fields through the thickness of the swaged rod samples. The tests are carried out in four steps:
  • A through reference hole is drilled at the measured location using gun drilling.
  • The measurement of the reference hole diameter is made at pre-decided angles for each increment in the depth direction.
  • A core of material containing the reference hole is trepanned free of the rest of the material using an electric discharge machine (EDM) (Makino, Mason, Ohio, United States).
  • The reference hole diameter is again measured to calculate the magnitude of residual stress fields from the amount of deformation observed in the inner core column of trepanning process.
The following Equations (1) and (2) were used to determine the residual stresses (σy, σz):
ε y = d y d y = 1 E [ 3 σ y σ z ]
ε z = d z d z = 1 E [ 3 σ z σ y ]
where, ε y and ε z are measured strains in the y and z directions, respectively; d y and z are the change in diameters in the y and z directions, respectively; d y and d z are the initial diameters, in the y and z directions, respectively; E is Young’s modulus; and σ y and σ z are the stresses in the y and z directions, respectively [31,40]. The through thickness residual stress measurement is explained in detail in our earlier work [40].
The Zr-4 alloys are produced by the induction melting process and swaged up to a 16.2 mm rod from 21 mm rod samples in 5 passes (NFC Hyderabad, India). The composition of Zr-4 alloy is shown in Table 2. The through thickness residual stresses measured by the deep hole drilling technique of 25% (18.2 mm rod) swaged samples (0.7 m/min, 1.25 m/min and 2 m/min) and 40% (16.2 mm rod) swaged samples (0.7 m/min). The residual stresses along both the directions (axial and radial directions) peak near the middle point in the thickness direction and accordingly the stress patterns are represented for the swaged bars, as shown in Figure 2b. Samples are polished by emery papers because surface defects may affect the strain relaxation readings. Young’s modulus and Poisson’s ratio of Zr-4 alloy are 99 GPa and 0.37, respectively [23,24]. The tensile properties (yield strength and tensile strength) of Zr-4 alloys are taken from our earlier work [23]. The scanning electron microscopy-based electron backscattered diffraction (EBSD) (FEI, Hillsboro, OH, USA) was carried out on 25% of the samples at different feed rates for kernel average misorientation (KAM) mapping. The samples were polished with up to 2000 µm emery papers, followed by alumina and colloidal cloth polishing. Electropolishing was done using 80% methanol and 20% perchloric acid for 17 s at −30 °C.

4. Results and Discussion

4.1. FEM Results

A rod with initial diameter of 21 mm and length of 500 mm was considered for plastic deformation, with single pass to reduce the diameter of the rod by 1 mm. The final length is calculated as 513.21 mm. The true σ versus the true ε curve is plotted using origin software for the swaged piece and is shown in Figure 3a.
During the swaging process, due to the tolerance applied to the dies (3 or 4), the swaged work piece is not uniform, as some flash was produced on the outer surface of the rod as shown in Figure 3b. To avoid this problem the work piece is allowed to rotate after each bite/blow. With this rotation, it is possible to have a uniform surface of the swaged rod. The rotation angle per bite of 15 degrees was assumed, which does not lead to a uniform surface. Later, the rotation of 90 degrees was used to ensure a better surface after the operation.
Now, considering an elasto-plastic case, the rod of 500 mm length was deformed for three consecutive passes; in the first pass the diameter of the work piece was reduced from 21 mm to 20 mm and in the next two passes, it was reduced to a final diameter of 18.2 mm. The final length obtained after two subsequent passes is 540.671 mm, as shown in Figure 4a. The stress distribution contour over a particular cross section of the rod is displayed after slicing the rod as shown in Figure 4b.
A path operation was performed over the swaged work piece for a random cross section, as shown in Figure 5, using the point tracking option of the software to see the σ and ϵ variation across the cross section. Stress/strain generated is the maximum at the surface and gradually decreases towards the center of the work piece. Hence, the surface is the highly stressed region, as can be seen from Figure 4b.
From this analysis, the load applied by the die on the work piece has been generated. Figure 6a indicates the Z-load and Figure 6b indicates the Y-load. The load at the top and bottom are almost the same. The maximum value is located where the load is exerted by the right and the minimum value is exerted by the left; as measured along the Z direction.
In Figure 6b, the load exerted by the right die and the left die, which are in the horizontal direction, are the maximum and the top/bottom die exerts minimum load on the work piece as it measures the load in the Y direction. At the same time, all four dies exert the same amount of load over the work piece, to have uniform deformation. The effective stress with respect to time is plotted from elasto-plastic data undergoing multi-pass swaging. From Figure 7, it is clear that the value of stress increases with the number of passes. Actually, the results presented here refer to the working stress during the swaging process and the results give the value of the residual stress after successful completion of the swaging process. From the load curve, it can be observed that at the same time all four dies exert equal amounts of load over the work piece; this leads to a uniform homogeneous deformation in the axial direction of the swaged Zr-4 rod.
Moreover, for the above cases, the die has been designed for the optimum value of the required diameter of the rod. However, as our analysis is limited to a very small value of diameter reduction, the appropriate consideration of the die geometry would play a significant role. Here, the dies have been designed according to the required diameter (e.g., 21-20, 20-19, etc.), i.e., different die geometry is used for each 1 mm reduction of diameter.
As a post-processing result of this analysis, a 20 mm diameter rod is obtained with an incremental length. Now, instead of a multi pass operation, the obtained 20 mm diameter rod is imported to the next set of simulations using the respective die. Assuming a similar condition of all other parameters involved, the swaging process is completed for the next 1 mm diameter reduction. Repeating this procedure for subsequent steps (e.g., 19 to 18.2 mm and 18.2 to 17.4 mm), a final swaged rod of diameter nearly equal to 16.2 mm is obtained (Figure 8a). True σ versus the ϵ curve is obtained from experimental as well as numerical analysis and they are plotted together and shown in Figure 8b.
Our analysis is based on a varying axial feed rate. The variation of effective stress was estimated for different feed rates (0.7 m/min, 1.25 m/min and 2 m/min). Using Deform 3D, the time step is specified as 0.5 s for a bite and accordingly, the axial feed per bite has been calculated and is given as input in the pre-processor. According to the parameters, die velocity and stroke in the radial direction is fixed. The obtained results are shown below.
Residual stresses in the work material are periodically distributed during the forming process. To ensure a stress value from the simulations that describe a homogeneous residual stress state, 20 measuring points were chosen along the diameter; the positions are seen in Figure 5. The residual stresses were extracted after the die was released from the work piece, with subsequent cooling to room temperature. It is observed that with an increasing number of passes, the value of residual stress also increases. This can be observed from the FEM analysis for the different number of passes. The residual stresses were measured along the radial direction of the rod at different cross sections of the swaged work piece.
Numerical simulation was performed to predict the residual stress over the surface as well as over the cross-section of the 25% swaged samples, with different feed rates using DEFORM 3D software. This result (Figure 9a–c) shows the compressive residual stress at the surface and the tensile residual stress at the center in the radial direction of the rod. The obtained results qualitatively match with the experiment data. It may be because of varying parameters involved in the complete swaging process, such as die geometry, die movement velocity, and swaging stroke. In the next step, die geometry was varied according to the required diameter, i.e., 5 nos. of die sets (one die set contains 4 segments) for swaging the bar from ϕ 21 to ϕ 16.2 mm: 1 set: ϕ 21 to ϕ 20 mm; 1 set: ϕ 20 to ϕ 19 mm; 1 set: ϕ 19 to ϕ 18.2 mm; 1 set: ϕ 18.2 to ϕ 17.4 mm; 1 set: ϕ 17.4 to ϕ 16.2 mm.
Parameters play a significant role in the variation of residual stresses. A better value of the obtained residual stresses has been noticed in the below figures (Figure 10) when appropriate die geometry is used. Also, in next step, simulated results have shown a better trend with values matching with the experimental results, obtained by employing 30 mm/sec die movement velocity. There is evidence of inhomogeneous deformation of swaged Zr-4 alloy as the feed rate is increased from 0.7 m/min to 2 m/min in the case of the 25% swaged rod, measured in the radial direction. As seen from Figure 10a–c, the magnitude of the residual stress at the surface is −0.588 MPa at 0.7 m/min. It increases to −62.8 MPa at 1.25 m/min and −88.2 MPa for 2 m/min.

4.2. Deep Hole Drilling

For the 25% swaged samples (18.2 mm swaged rod), residual stress results are shown in Figure 11a–c. It is observed that as the diameter decreases through swaging operation, and the magnitude of the residual stresses increases as is evident from Figure 11d for the 16.2 mm rod (0.7 m/min feed rate). This is attributed to high cold work, which would lead to higher flow stress as well as higher residual stress.
For the 25% swaged alloy, deep hole drilling results indicate the compressive stresses at the surface and tensile stresses at center for 0.7 m/min, 1.25 m/min and 2 m/min feed rates. The magnitude of compressive residual stress increases with increasing feed rates. This is due to the higher amount of deformation induced during higher feed rates. Deep hole drilling measurements show the compressive stress at the surface and the tensile stress at the center for both the axial and radial directions.
Figure 12a–c shows the kernel average misorientation of 25% swaged Zr-4 alloys at different feed rates. This result shows that the amount of strain increases with increasing feed rates (from 0.7 m/min to 2 m/min). That also supports the trend of surface residual stress measured through experimental and numerical methods.

4.3. Experimental vs. Numerical

Experimental and numerical results obtained from the FE analysis of residual stresses are plotted together and compared in Figure 13a–c.
The residual stress predicted by numerical modelling is in tandem with the deep hole drilling technique for the 25% (18.2 mm rod) swaged samples. For the 25% swaged alloy, deep hole drilling results reveal compressive stresses at the surface and tensile stresses at the center. For the 25% swaged alloy, numerical modelling showed (in the radial direction, Z) compressive stresses at the surface and tensile stresses at the center. Both experimental and numerical methods show similar residual stress magnitudes quantitatively at the surface of the swaged rod. For the 0.7 m/min feed rate, deep hole drilling and numerical methods have shown 6 MPa and −0.9 MP, respectively. In the case of 1.25 m/min feed rate, deep hole drilling technique showed −52 MPa and −41.4 MPa from the numerical method. For the 2 m/min feed rate, deep hole drilling showed −86 MPa and −74 MPa with the numerical method. Both numerical and experimental methods predicted a similar trend in variation of tensile residual stresses but they differ slightly in their magnitude. These results are for swaged samples at different feed rates and it suggests that increasing the feed rate increases the compressive residual stresses on the surface while tensile stresses are nearly similar on increasing the feed rates. With these results, we suggest that 1.25 m/min feed rate is good for producing swaged Z-4 alloy, because of the good combination of mechanical properties of tensile strength (535.50 MPa), ductility (19.84%) and fracture toughness (44.37 MPa·m0.5) reported in our earlier work [24]. Further annealing treatment will decrease the tensile residual stress at the center of Zr-4 alloy rod. Numerical results could be improved further by using more refined meshes and minor time steps in order to match closely with experimental results. To improve the die design, die movement velocity with or without lubricant during swaging could also contribute to obviate the detrimental effect of residual stress in the alloy.

5. Conclusions

Numerical and experimental investigations are carried out to investigate the influence of the feed rate in the radial direction on residual stresses of a swaged zircaloy-4 rod. The following conclusions are made based on the present work:
  • Numerical and experimental results both show a similar trend of residual stresses from the surface to center on the 25% swaged rod at different feed rates (0.7 m/min, 1.25 m/min and 2 m/min). Almost the same magnitude of residual stress on the surface as well as center of the 25% swaged rod are observed.
  • Deep hole drilling results show an increase in magnitude of residual stress on increasing the percentage of cold work. This is due to increase in the amount of deformation, which leads to an increase in yield strength at higher cold work on zirconium alloys.
  • The inhomogeneous deformation observed from the surface to the center (in the radial direction) on the 25% swaged rod (0.7 m/min, 1.25 m/min and 2 m/min) as observed in residual stress magnitude for both experimental and numerical methods.
  • It can be concluded from the load curve that at the same time all four dies exert an equal amount of load over the work piece, it results in a uniform homogeneous deformation in the axial direction of the swaged Zr-4 rod.
  • The axial (X) and radial (Z) residual stresses on the surface are compressive and thus, can help in preventing crack propagation and can enhance product life. On the other hand, the stresses towards the center of the rod are tensile and thus, may assist the propagation of possible cracks. Hence, there is a need to undergo heat treatment before use.

Author Contributions

G.S. and B.K., conceptualized, procured and analyzed data, and wrote the manuscript; K.I.V.N. and U.K.A., provided the methodology (the swaging process) and resources for samples; M.M.M., provided the facilities for hole drilling and carrying out the experiments; R.J., directed the research, wrote the manuscript and provided comments in the manuscript. All authors have read and agreed to the published version of the manuscript.

Funding

This research was funded by the Board of Research in Nuclear Sciences (BRNS), Mumbai, India (grant no. EDD/16/17/034/BRNS/RJAG.)

Acknowledgments

The authors would like to thank the Board of Research in Nuclear Sciences (BRNS), Mumbai, India for sponsoring this work.

Conflicts of Interest

The authors declare that they have no conflict of interest.

References

  1. Zhang, Q.; Jin, K.; Mu, D.; Zhang, Y.; Li, Y. Energy-controlled rotary swaging process for tube workpiece. Int. J. Adv. Manuf. Technol. 2015, 80, 2015–2026. [Google Scholar] [CrossRef]
  2. Ishkina, S.; Charni, D.; Herrmann, M.; Liu, Y.; Epp, J.; Schenck, C.; Kuhfuss, B.; Zoch, H.W. Influence of Process Fluctuations on Residual Stress Evolution in Rotary Swaging of Steel Tubes. Materials 2019, 12, 855. [Google Scholar] [CrossRef] [Green Version]
  3. Zhang, Q.; Jin, K.; Mu, D.M.; Ma, P.; Tian, J. Rotary Swaging Forming Process of Tube Workpieces. Procedia Eng. 2014, 81, 2336–2341. [Google Scholar] [CrossRef] [Green Version]
  4. Ameli, A.; Movahhedy, M.R. A parametric study on residual stresses and forging load in cold radial forging process. Int. J. Adv. Manuf. Technol. 2007, 33, 7–17. [Google Scholar] [CrossRef]
  5. Brenneis, M.; Groche, P. Smart Components through Rotary Swaging. Key Eng. Mater. 2012, 504–506, 723–728. [Google Scholar] [CrossRef]
  6. Domblesky, J.P.; Shivpuri, R. Development and validation of a finite-element model for multiple-pass radial forging. J. Mater. Process. Technol. 1995, 55, 432–441. [Google Scholar] [CrossRef]
  7. Yuan, L.; Wang, W.; Li, Y.; Yang, M.; Zhang, H.; Zhang, W. Effect of annealing temperature on texture and residual stress of Ti-6Al-4V alloy seamless tubing processed by cold rotary swaging. Vacuum 2020, 177, 109399. [Google Scholar] [CrossRef]
  8. Ishkina, S.; Schenck, C.; Herrmann, M.; Kuhfuss, B. Visualization of Axial Material Flow by Eccentric Thread Swaging. Procedia Manuf. 2020, 47, 1339–1344. [Google Scholar] [CrossRef]
  9. Grosman, F.; Piela, A. Metal flow in the deformation gap at primary swaging. J. Mater. Process. Technol. 1996, 56, 404–411. [Google Scholar] [CrossRef]
  10. Piela, A. Analysis of the metal flow in swaging—numerical modelling and experimental verification. Int. J. Mech. Sci. 1997, 39, 221–231. [Google Scholar] [CrossRef]
  11. Rong, L.; Nie, Z.-R.; Zuo, T.-Y. FEA modeling of effect of axial feeding velocity on strain field of rotary swaging process of pure magnesium. Trans. Nonferr. Met. Soc. China 2006, 16, 1015–1020. [Google Scholar] [CrossRef]
  12. Macháčková, A.; Krátká, L.; Petrmichl, R.; Kunčická, L.; Kocich, R. Affecting Structure Characteristics of Rotary Swaged Tungsten Heavy Alloy Via Variable Deformation Temperature. Materials 2019, 12, 4200. [Google Scholar] [CrossRef] [Green Version]
  13. Kocich, R.; Kunčická, L.; Dohnalík, D.; Macháčková, A.; Šofer, M. Cold rotary swaging of a tungsten heavy alloy: Numerical and experimental investigations. Int. J. Refract. Met. Hard Mater. 2016, 61, 264–272. [Google Scholar] [CrossRef]
  14. Han, C.; Wen, S.; Ye, F.; Wu, W.; Xue, S.; Liang, Y.; Liu, B.; Lin, J. Deformation twinning in equiaxed-grained Fe-6.5 wt.%Si alloy after rotary swaging. J. Mater. Sci. Technol. 2020, 49, 25–34. [Google Scholar] [CrossRef]
  15. Kocich, R.; Kunčická, L.; Davis, C.F.; Lowe, T.C.; Szurman, I.; Macháčková, A. Deformation behavior of multilayered Al-Cu clad composite during cold-swaging. Mater. Des. 2016, 90, 379–388. [Google Scholar] [CrossRef]
  16. Rong, L.; Nie, Z.; Zuo, T. 3D finite element modeling of cogging-down rotary swaging of pure magnesium square billet-Revealing the effect of high-frequency pulse stroking. Mater. Sci. Eng. A 2007, 464, 28–37. [Google Scholar] [CrossRef]
  17. Herrmann, M.M. Graded Structured Tools for Dry Rotary Swaging. Dry Met. Form. Open Access J. 2018, 4, 018–024. [Google Scholar]
  18. Zhang, Q.; Mu, D.; Jin, K.; Liu, Y. Recess swaging method for manufacturing the internal helical splines. J. Mater. Process. Technol. 2014, 214, 2971–2984. [Google Scholar] [CrossRef]
  19. Moumi, E.; Ishkina, S.; Kuhfuss, B.; Hochrainer, T.; Struss, A.; Hunkel, M. 2D-simulation of Material Flow During Infeed Rotary Swaging Using Finite Element Method. Procedia Eng. 2014, 81, 2342–2347. [Google Scholar] [CrossRef] [Green Version]
  20. Ripoll, M.R.; Weygand, S.M.; Riedel, H. Reduction of tensile residual stresses during the drawing process of tungsten wires. Mater. Sci. Eng. A 2010, 527, 3064–3072. [Google Scholar] [CrossRef]
  21. Kortabarria, A.; Arrazola, P.J.; Ostolaza, K. Multi Revolution Finite Element Model to Predict Machining Induced Residual Stresses in Inconel 718. Procedia CIRP 2013, 8, 111–116. [Google Scholar] [CrossRef] [Green Version]
  22. Király, M.; Antók, D.M.; Horváth, L.; Hózer, Z. Evaluation of axial and tangential ultimate tensile strength of zirconium cladding tubes. Nucl. Eng. Technol. 2018, 50, 425–431. [Google Scholar] [CrossRef]
  23. Singh, G.; Tiwari, A.; Agarwal, V.; Jayaganthan, R.; Vishnu Narayanan, K.I.; Arora, U.K.; Srivastava, D. Tensile and Fracture Behaviour of Zr-4 Alloy Processed Through Swaging. Trans. Indian Inst. Met. 2020, 73, 955–965. [Google Scholar] [CrossRef]
  24. Singh, G.; Jayaganthan, R.; Arora, U.K.; Vishnu Narayanan, K.I.; Srivastava, D. Texture Analysis and Fracture Behavior of Zircaloy-4 Processed Through Swaging. Metallogr. Microstruct. Anal. 2020, 9, 273–284. [Google Scholar] [CrossRef]
  25. Ferrando, W.A. PROCESSING AND USE OF ZIRCONIUM BASED MATERIALS. Adv. Mater. Manuf. Process. 1988, 3, 195–231. [Google Scholar] [CrossRef]
  26. Yoon, J.; Kim, J.; Kim, H.; Won, C.; Song, Y.; Park, S.H. Calibration of hoop stress in ring tensile test with Zircaloy-4 tube. J. Mech. Sci. Technol. 2017, 31, 4183–4188. [Google Scholar] [CrossRef]
  27. Kim, J.-S.; Kim, M.-W.; Yang, J.-S. Investigation on effect of thermal aging embrittlement on residual stresses of austenitic stainless steel repair welds in nuclear components subject to seismic loads. J. Mech. Sci. Technol. 2020, 34, 2821–2831. [Google Scholar] [CrossRef]
  28. Yan, M.; Wang, C.; Luo, T.; Li, Y.; Feng, X.; Huang, Q.; Yang, Y. Effect of Pulsed Magnetic Field on the Residual Stress of Rolled Magnium Alloy AZ31 Sheet. Acta Metall. Sin. (Engl. Lett.) 2020. [Google Scholar] [CrossRef]
  29. Sastry, C.C.; Abeens, M.; Pradeep, N.; Manickam, M.A.M. Microstructural analysis, radiography, tool wear characterization, induced residual stress and corrosion behavior of conventional and cryogenic trepanning of DSS 2507. J. Mech. Sci. Technol. 2020, 34, 2535–2547. [Google Scholar] [CrossRef]
  30. Yoon, S.C.; Horita, Z.; Kim, H.S. Finite element analysis of plastic deformation behavior during high pressure torsion processing. J. Mater. Process. Technol. 2008, 201, 32–36. [Google Scholar] [CrossRef]
  31. Taraphdar, P.K.; Thakare, J.G.; Pandey, C.; Mahapatra, M.M. Novel residual stress measurement technique to evaluate through thickness residual stress fields. Mater. Lett. 2020, 277, 128347. [Google Scholar] [CrossRef]
  32. Liu, Z.G.; Wong, T.I.; Huang, W.; Sridhar, N.; Wang, S.J. Effect of Surface Polishing Treatment on the Fatigue Performance of Shot-Peened Ti-6Al-4V Alloy. Acta Metall. Sin. (Engl. Lett.) 2017, 30, 630–640. [Google Scholar] [CrossRef]
  33. Kunčická, L.; Macháčková, A.; Lavery, N.P.; Kocich, R.; Cullen, J.C.T.; Hlaváč, L.M. Effect of thermomechanical processing via rotary swaging on properties and residual stress within tungsten heavy alloy. Int. J. Refract. Met. Hard Mater. 2020, 87, 105120. [Google Scholar] [CrossRef]
  34. Gloaguen, D.; Berchi, T.; Girard, E.; Guillén, R. Examination of residual stresses and texture in zirconium alloy cladding tubes after a large plastic deformation: Experimental and numerical study. J. Nucl. Mater. 2008, 374, 138–146. [Google Scholar] [CrossRef] [Green Version]
  35. Henriksen, E.K. Residual Stresses in Machined Surfaces; ASME: New York, NY, USA, 1948. [Google Scholar]
  36. Stenberg, N.; Proudian, J. Numerical Modelling of Turning to Find Residual Stresses. Procedia CIRP 2013, 8, 258–264. [Google Scholar] [CrossRef] [Green Version]
  37. Koric, S.; Thomas, B.G. Efficient thermo-mechanical model for solidification processes. Int. J. Numer. Methods Eng. 2006, 66, 1955–1989. [Google Scholar] [CrossRef]
  38. Harewood, F.J.; McHugh, P.E. Comparison of the implicit and explicit finite element methods using crystal plasticity. Comput. Mater. Sci. 2007, 39, 481–494. [Google Scholar] [CrossRef]
  39. Koric, S.; Gupta, A. Sparse matrix factorization in the implicit finite element method on petascale architecture. Comput. Methods Appl. Mech. Eng. 2016, 302, 281–292. [Google Scholar] [CrossRef] [Green Version]
  40. Taraphdar, P.K.; Mahapatra, M.M.; Pradhan, A.K.; Singh, P.K.; Sharma, K.; Kumar, S. Evaluation of through-thickness residual stresses in narrow gap dissimilar weld joint of ferritic to austenitic stainless steel. In Proceedings of the 64th Congress of Indian Society of Theoretical and Applied Mechanics (ISTAM 2019), Bhubaneswar, India, 9–12 December 2019. [Google Scholar]
Figure 1. (a) A Lebel diagram of a swaging head [2] and (b) the zones of the swaging process [3], with permission from Elsevier, 2020.
Metals 10 01281 g001
Figure 2. (a) The mesh domain of the work piece, and (b) axial (X), circumferential (Y) and radial (Z) directions are shown in Zr-4 swaged rod samples.
Metals 10 01281 g002
Figure 3. (a) The true σ versus the true ε of the work piece, obtained from numerical data, and (b) the flash produced over the outer surface of the work piece
Metals 10 01281 g003
Figure 4. (a) The final length of the swaged rod, and (b) the stress distribution over a particular cross section.
Metals 10 01281 g004
Figure 5. Point tracking along the cross section of the rod.
Metals 10 01281 g005
Figure 6. The load applied on the rod (a) along the Z direction, and (b) along the Y direction.
Metals 10 01281 g006
Figure 7. The effective stress for three subsequent swaging passes.
Metals 10 01281 g007
Figure 8. (a) The cross section of the 16.2 mm rod, and (b) the comparison of numerical and experimental true σ and ϵ curves of the swaged piece.
Metals 10 01281 g008
Figure 9. The predicted residual stresses in the radial direction for the 25% swaged samples (a) at 0.7 m/min feed rate, (b) at 1.25 m/min feed rate and (c) at 2 m/min feed rate.
Metals 10 01281 g009
Figure 10. The residual stresses in the radial direction with different die geometries and die movement velocities (a) at 0.7 m/min, (b) at 1.25 m/min and (c) at 2 m/min feed rate.
Metals 10 01281 g010
Figure 11. The residual stress variation with depth for the 25% swaged samples: (a) 0.7 m/min, (b) 1.25/min, (c) 2 m/min and (d) 0.7 m/min for the 40% swaged sample.
Metals 10 01281 g011
Figure 12. Kernel average misorientation (KAM) images of (a) 0.7 m/min, (b) 1.25 m/min and (c) 2 m/min of the 25% swaged (surface).
Metals 10 01281 g012
Figure 13. The comparison between experimental residual stresses (a) 0.7 m/min, (b) 1.25 m/min and (c) 2 m/min and the numerically predicted residual stresses for the 25% swaged Zr-4 sample.
Metals 10 01281 g013
Table 1. List of parameters used in the finite element modelling (FEM) simulation of the swaging process.
Parameters for FEABefore SimulationAfter Simulation
Diameter (mm)2120–19–18.2–17.4–16.2
Temperature (°C)2020
Swaging stroke (mm)1010
Number of bites (L/f + 1) = 51
Length of work piece(L)500 mm580 mm
Axial feed per bite (f)Varies (10 mm)
Rotation per bite45, 90 degree
Die movement velocity30 mm/sec
Number of pass1 to 5
Rotation per pass180 degree (For multiple pass)
Pass schedule for round bar21 to 20 mm, 20 to 19 mm, 19 to 18.2 mm, 18.2 to 17.4 mm, 17.4 to 16.2 mm
Swaging through feed rate for bars0.7 m/min, 1.25 m/min, 2 m/min
Table 2. The composition of Zr-4 alloy.
Alloying ElementSn%Fe%Cr%O%H ppmZr%
Composition (Wt.%)1.460.110.220.1321Bal.

