Effect of Direct Energy Deposition Process Parameters on Single-Track Deposits of Alloy 718


Abstract
1. Introduction
2. Materials and Methods
3. Results and Discussions
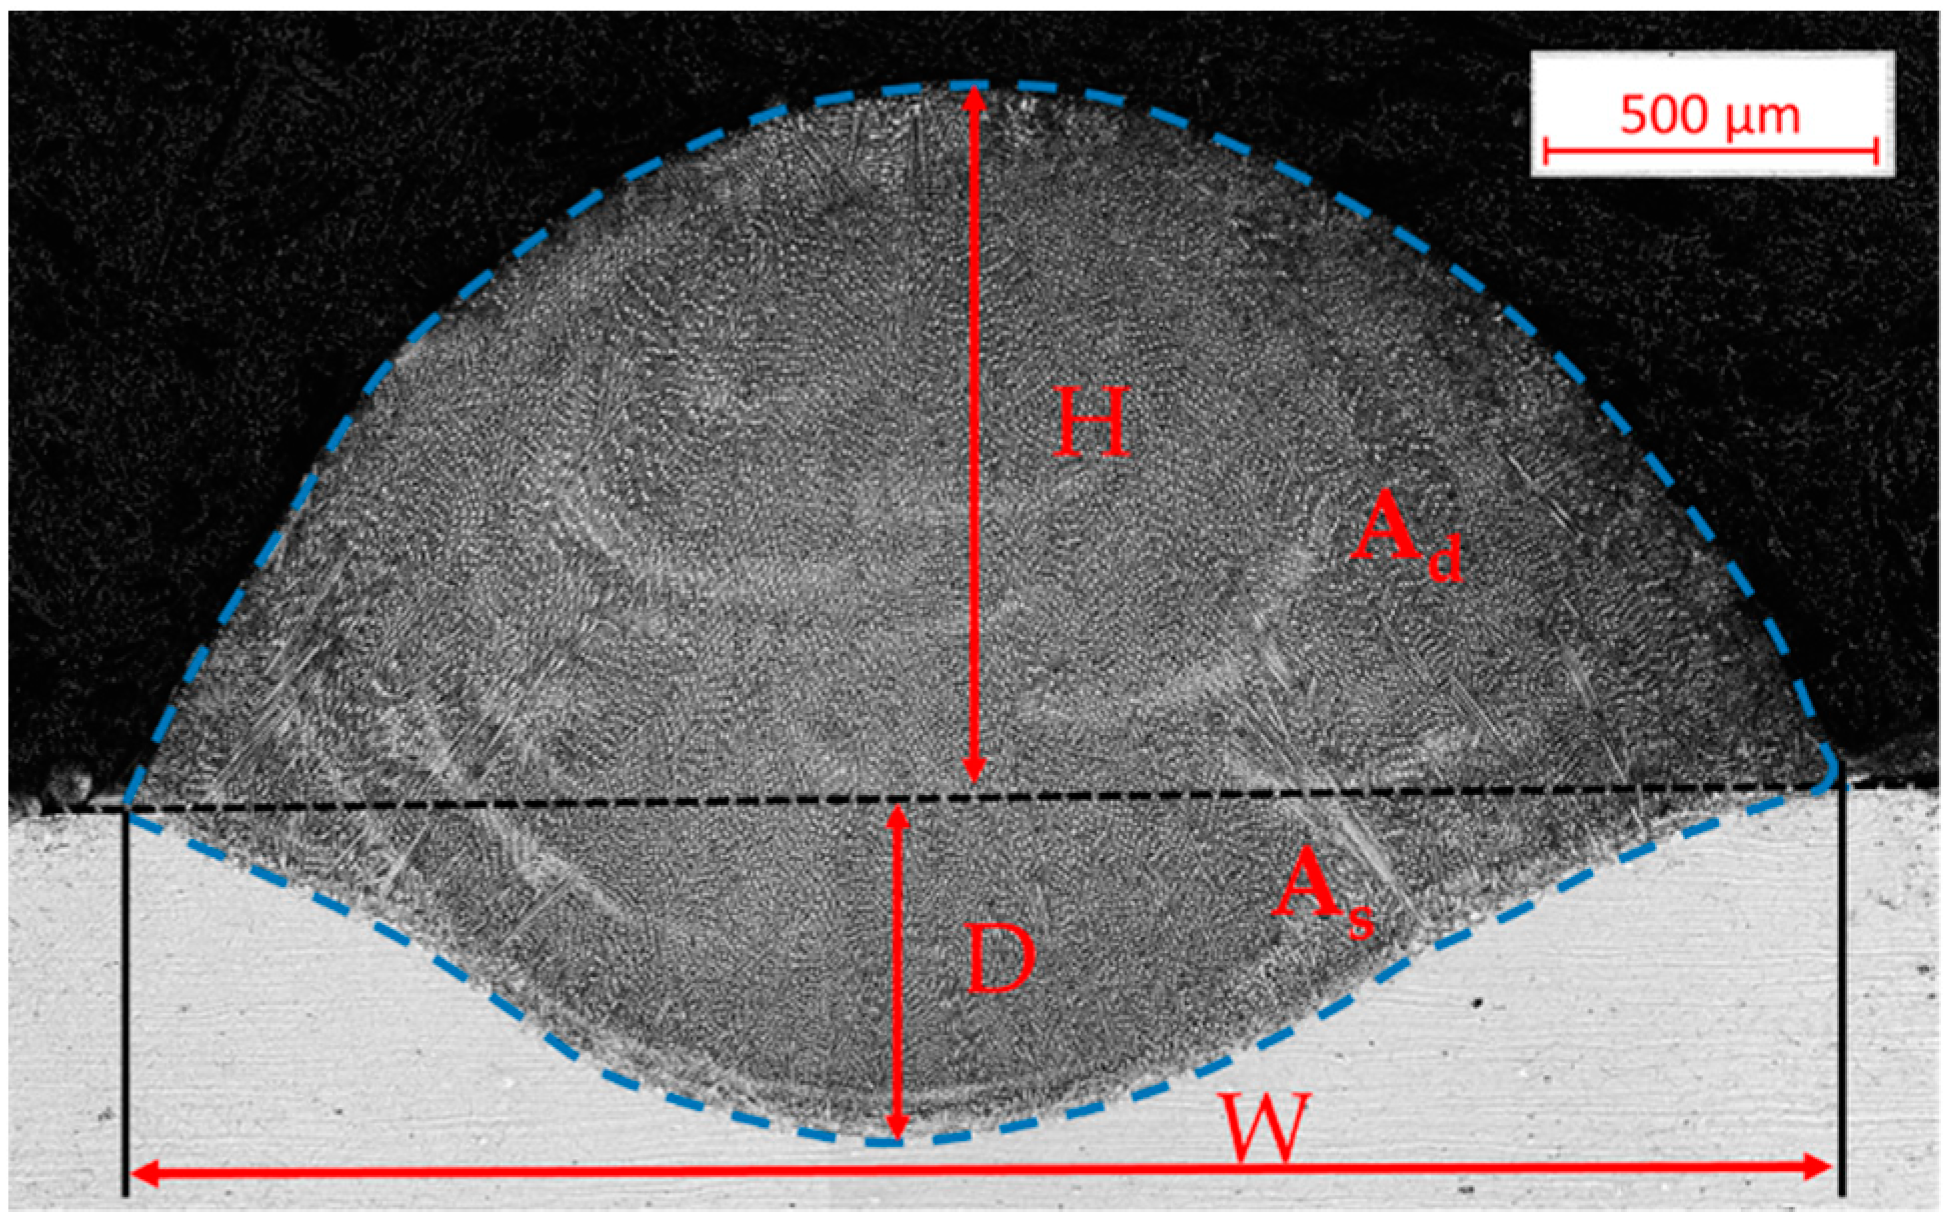
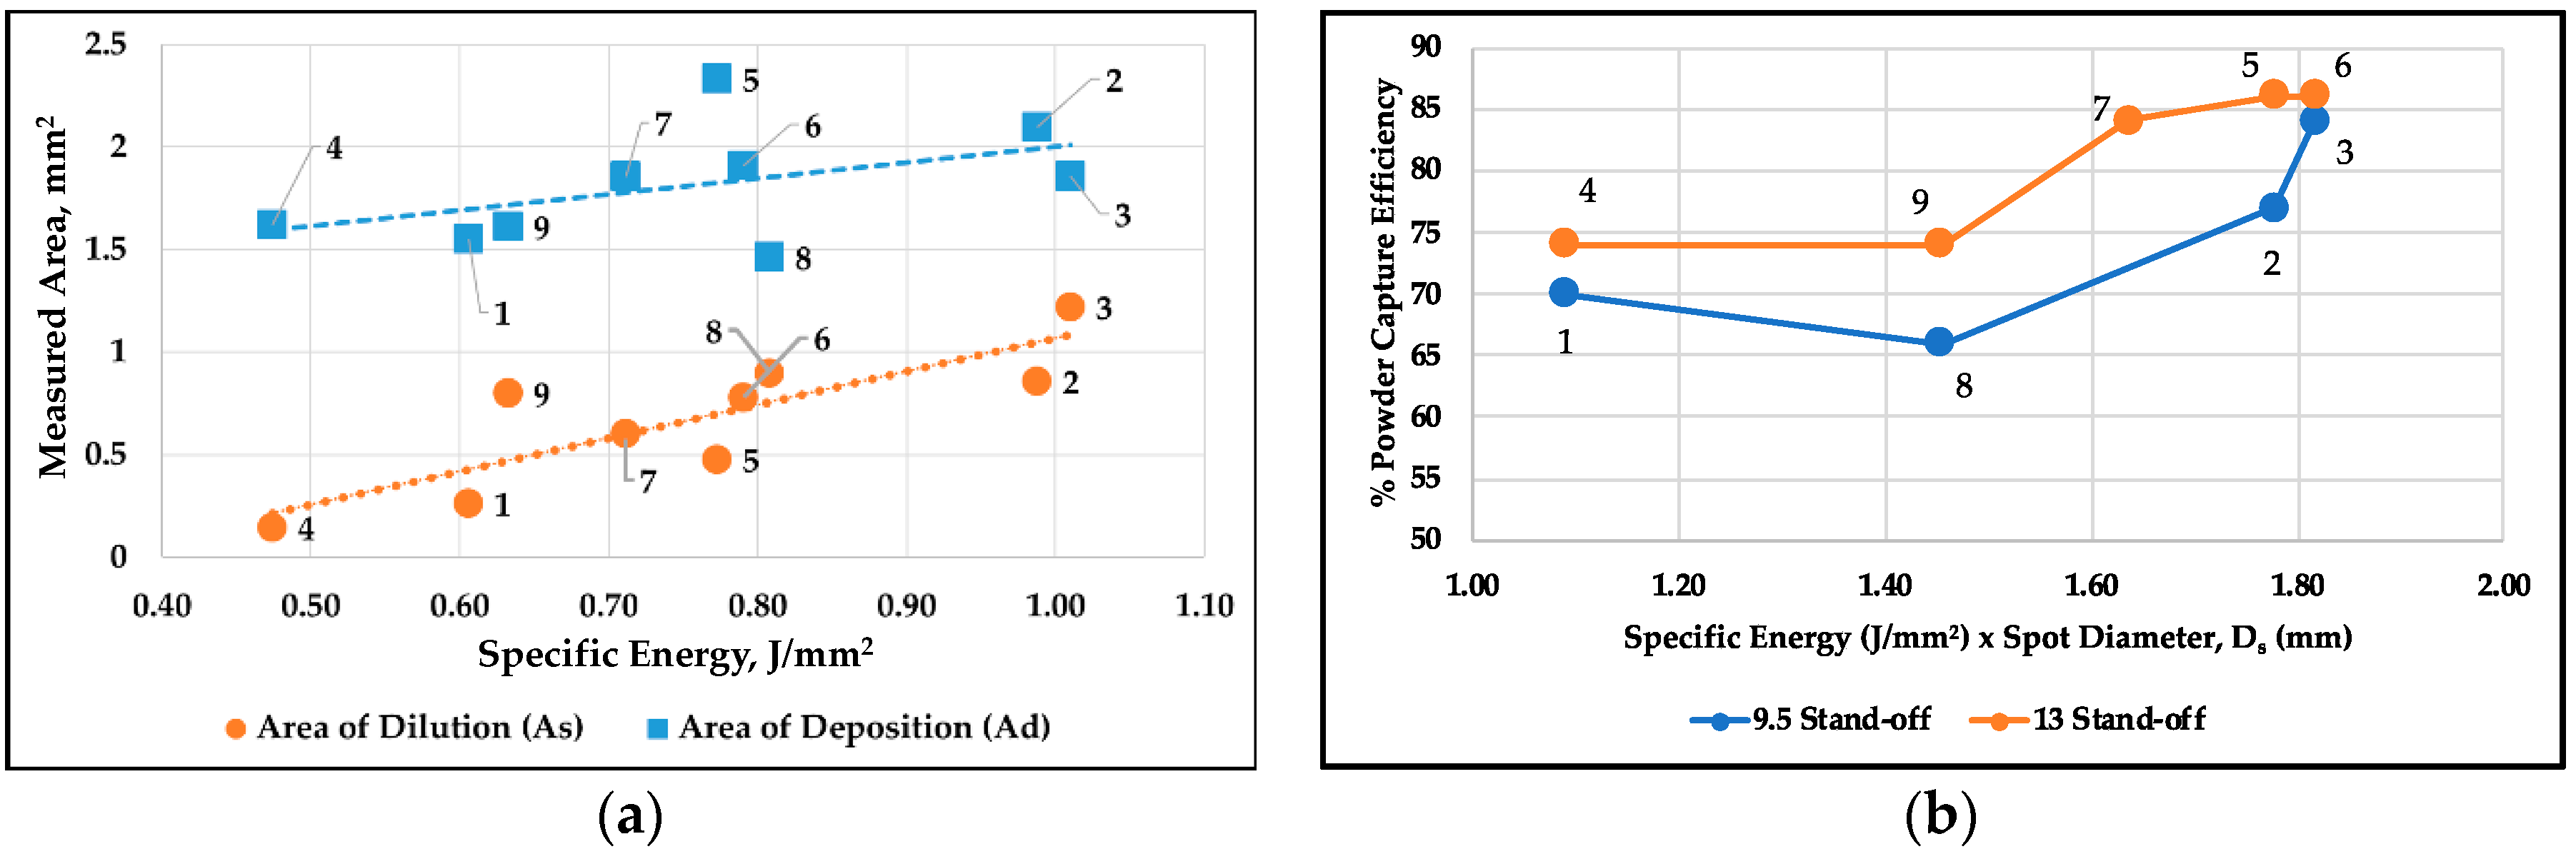
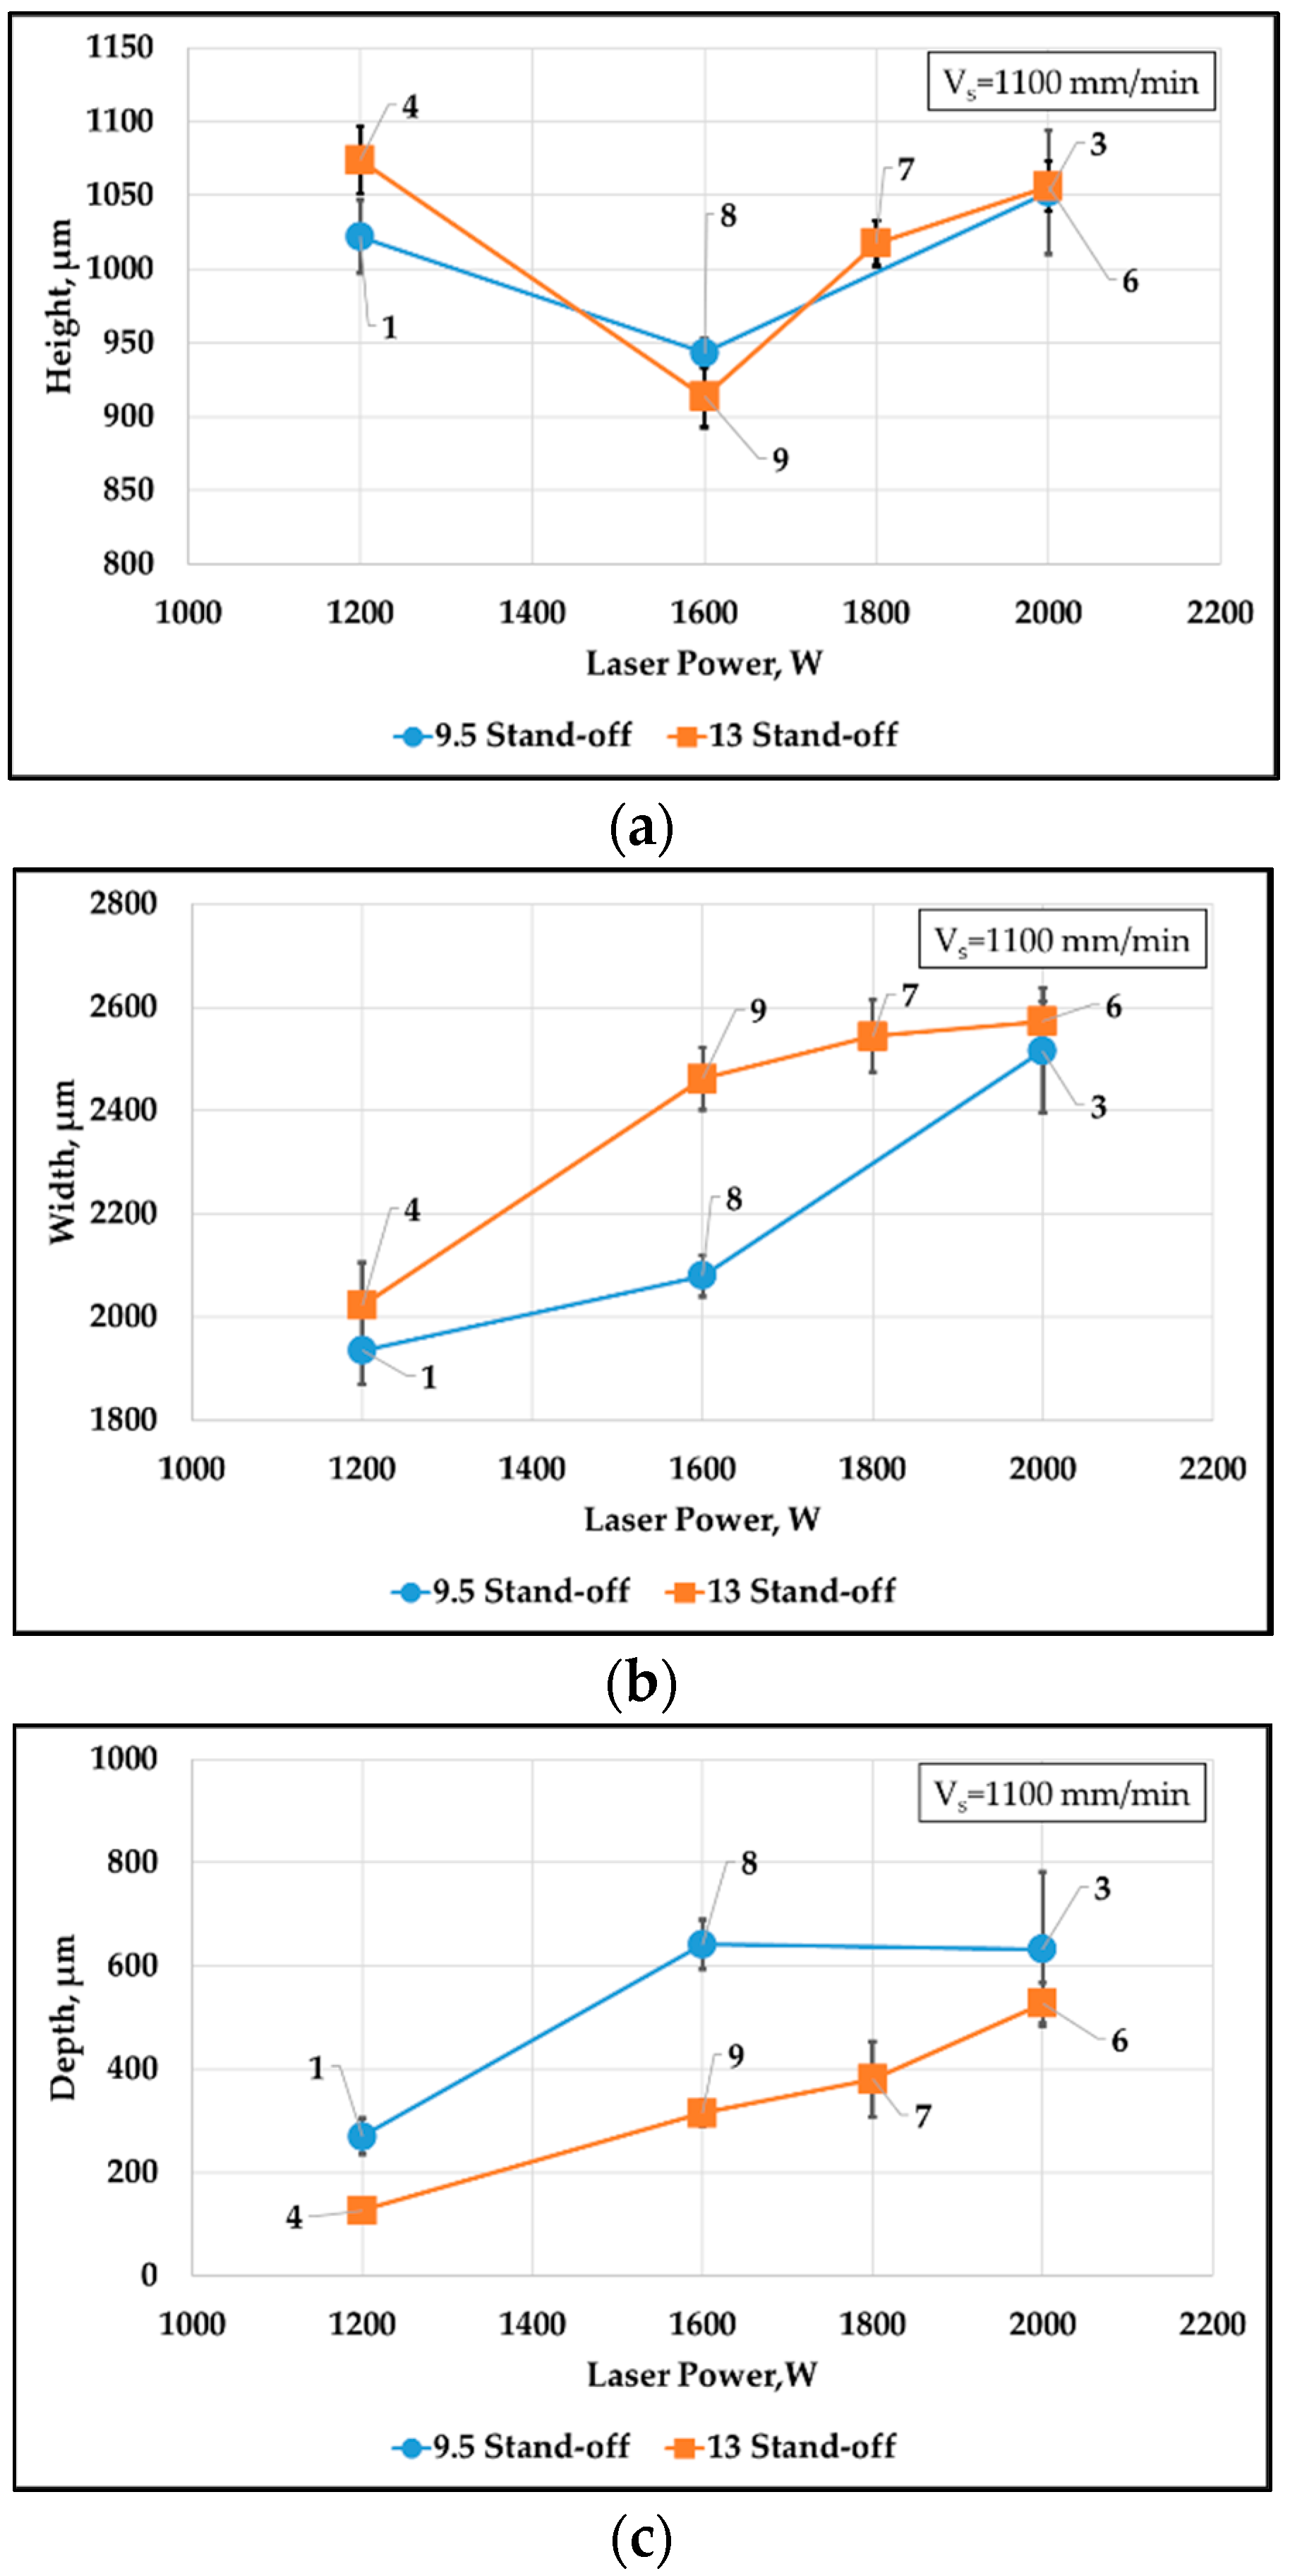
3.1. Deposit Geometry
3.1.1. Effect of Laser Power and Laser Stand-Off Distance on the Geometry of Deposits
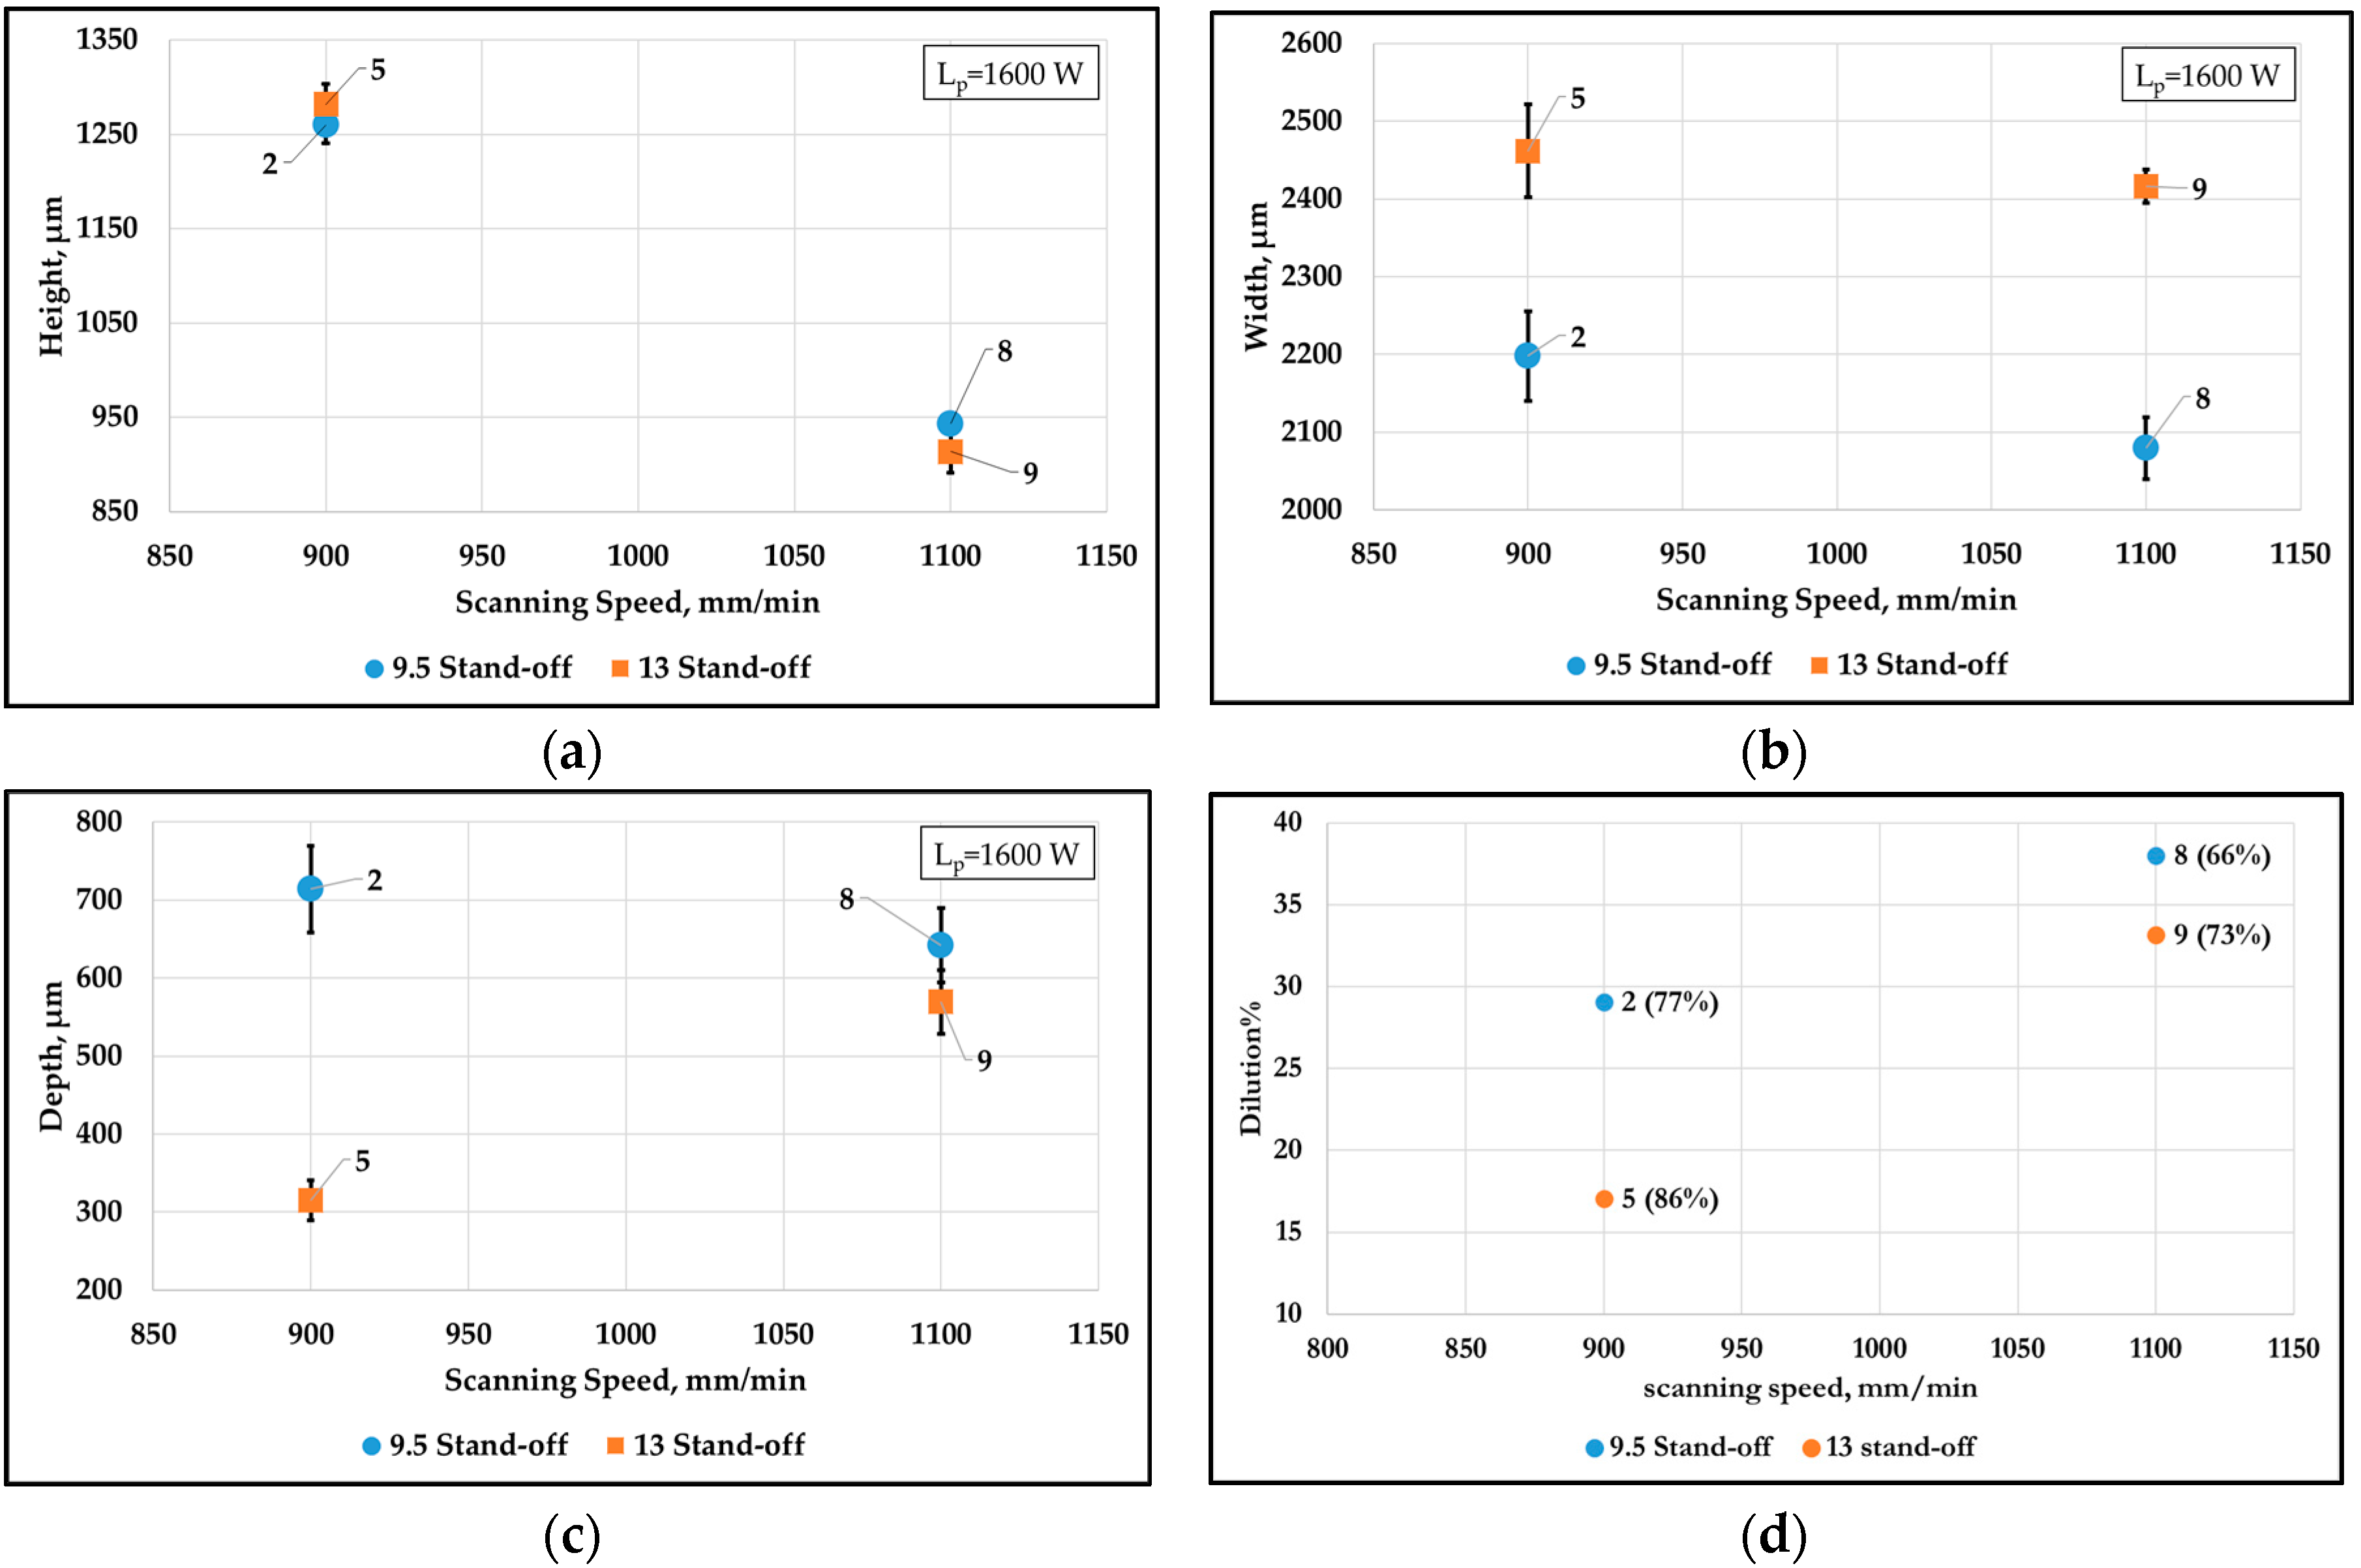
3.1.2. Effect of Scanning Speed and Laser Stand-Off Distance on the Geometry of Deposits
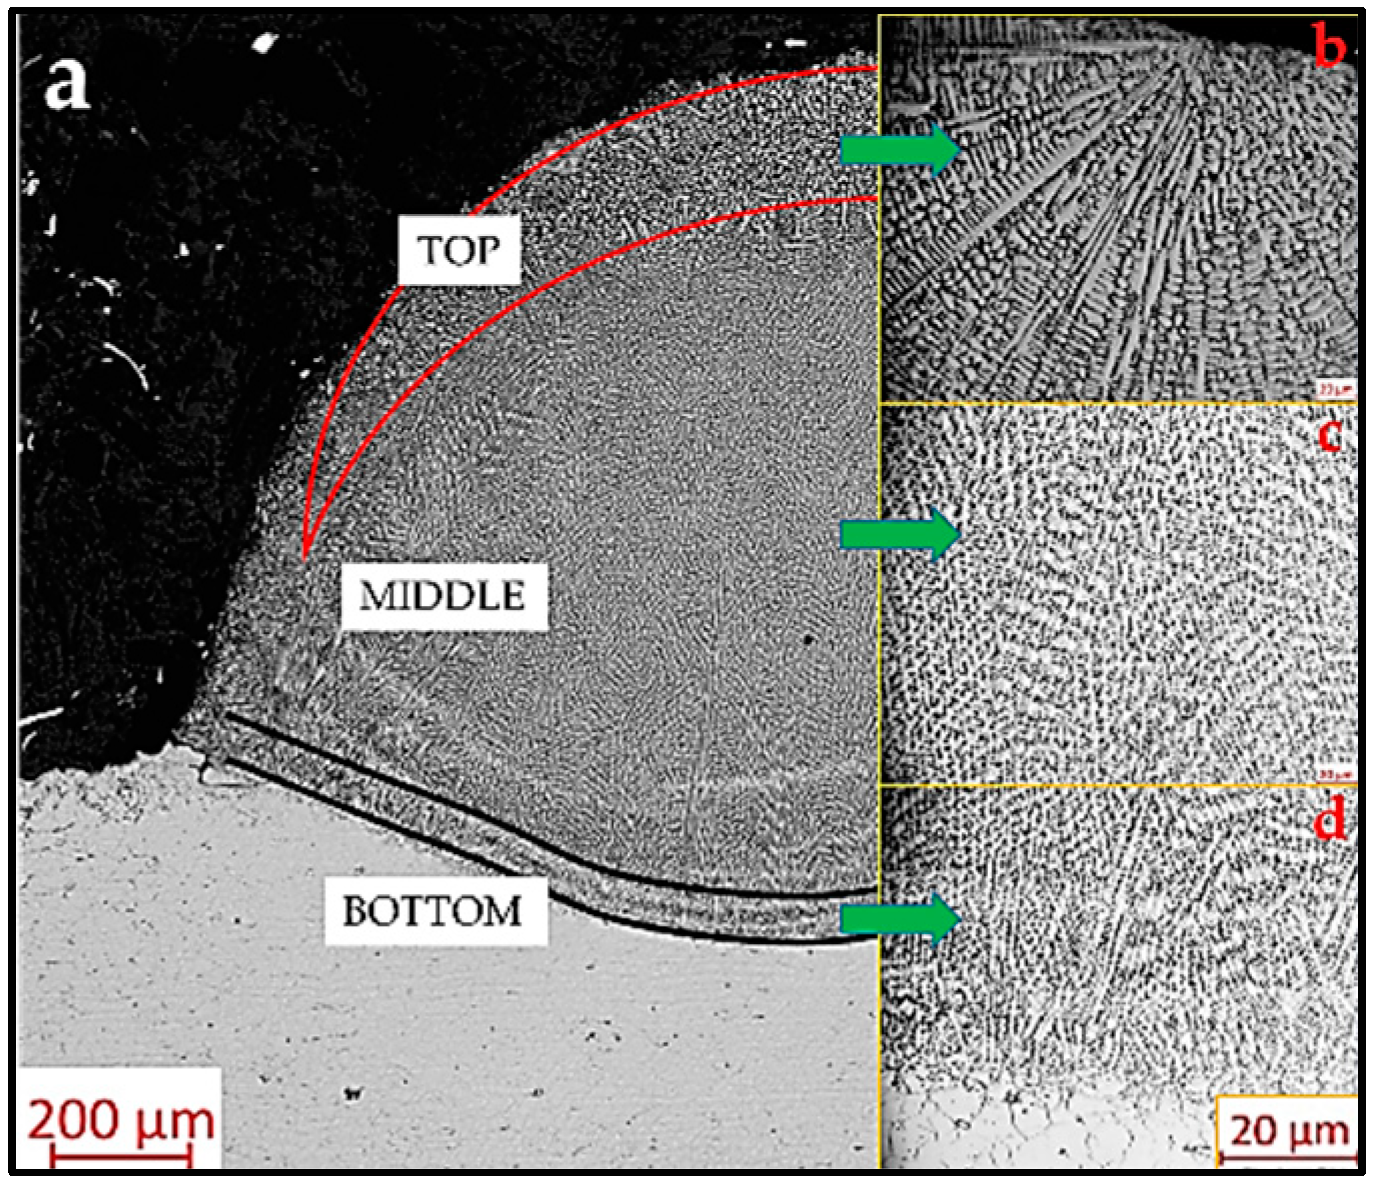
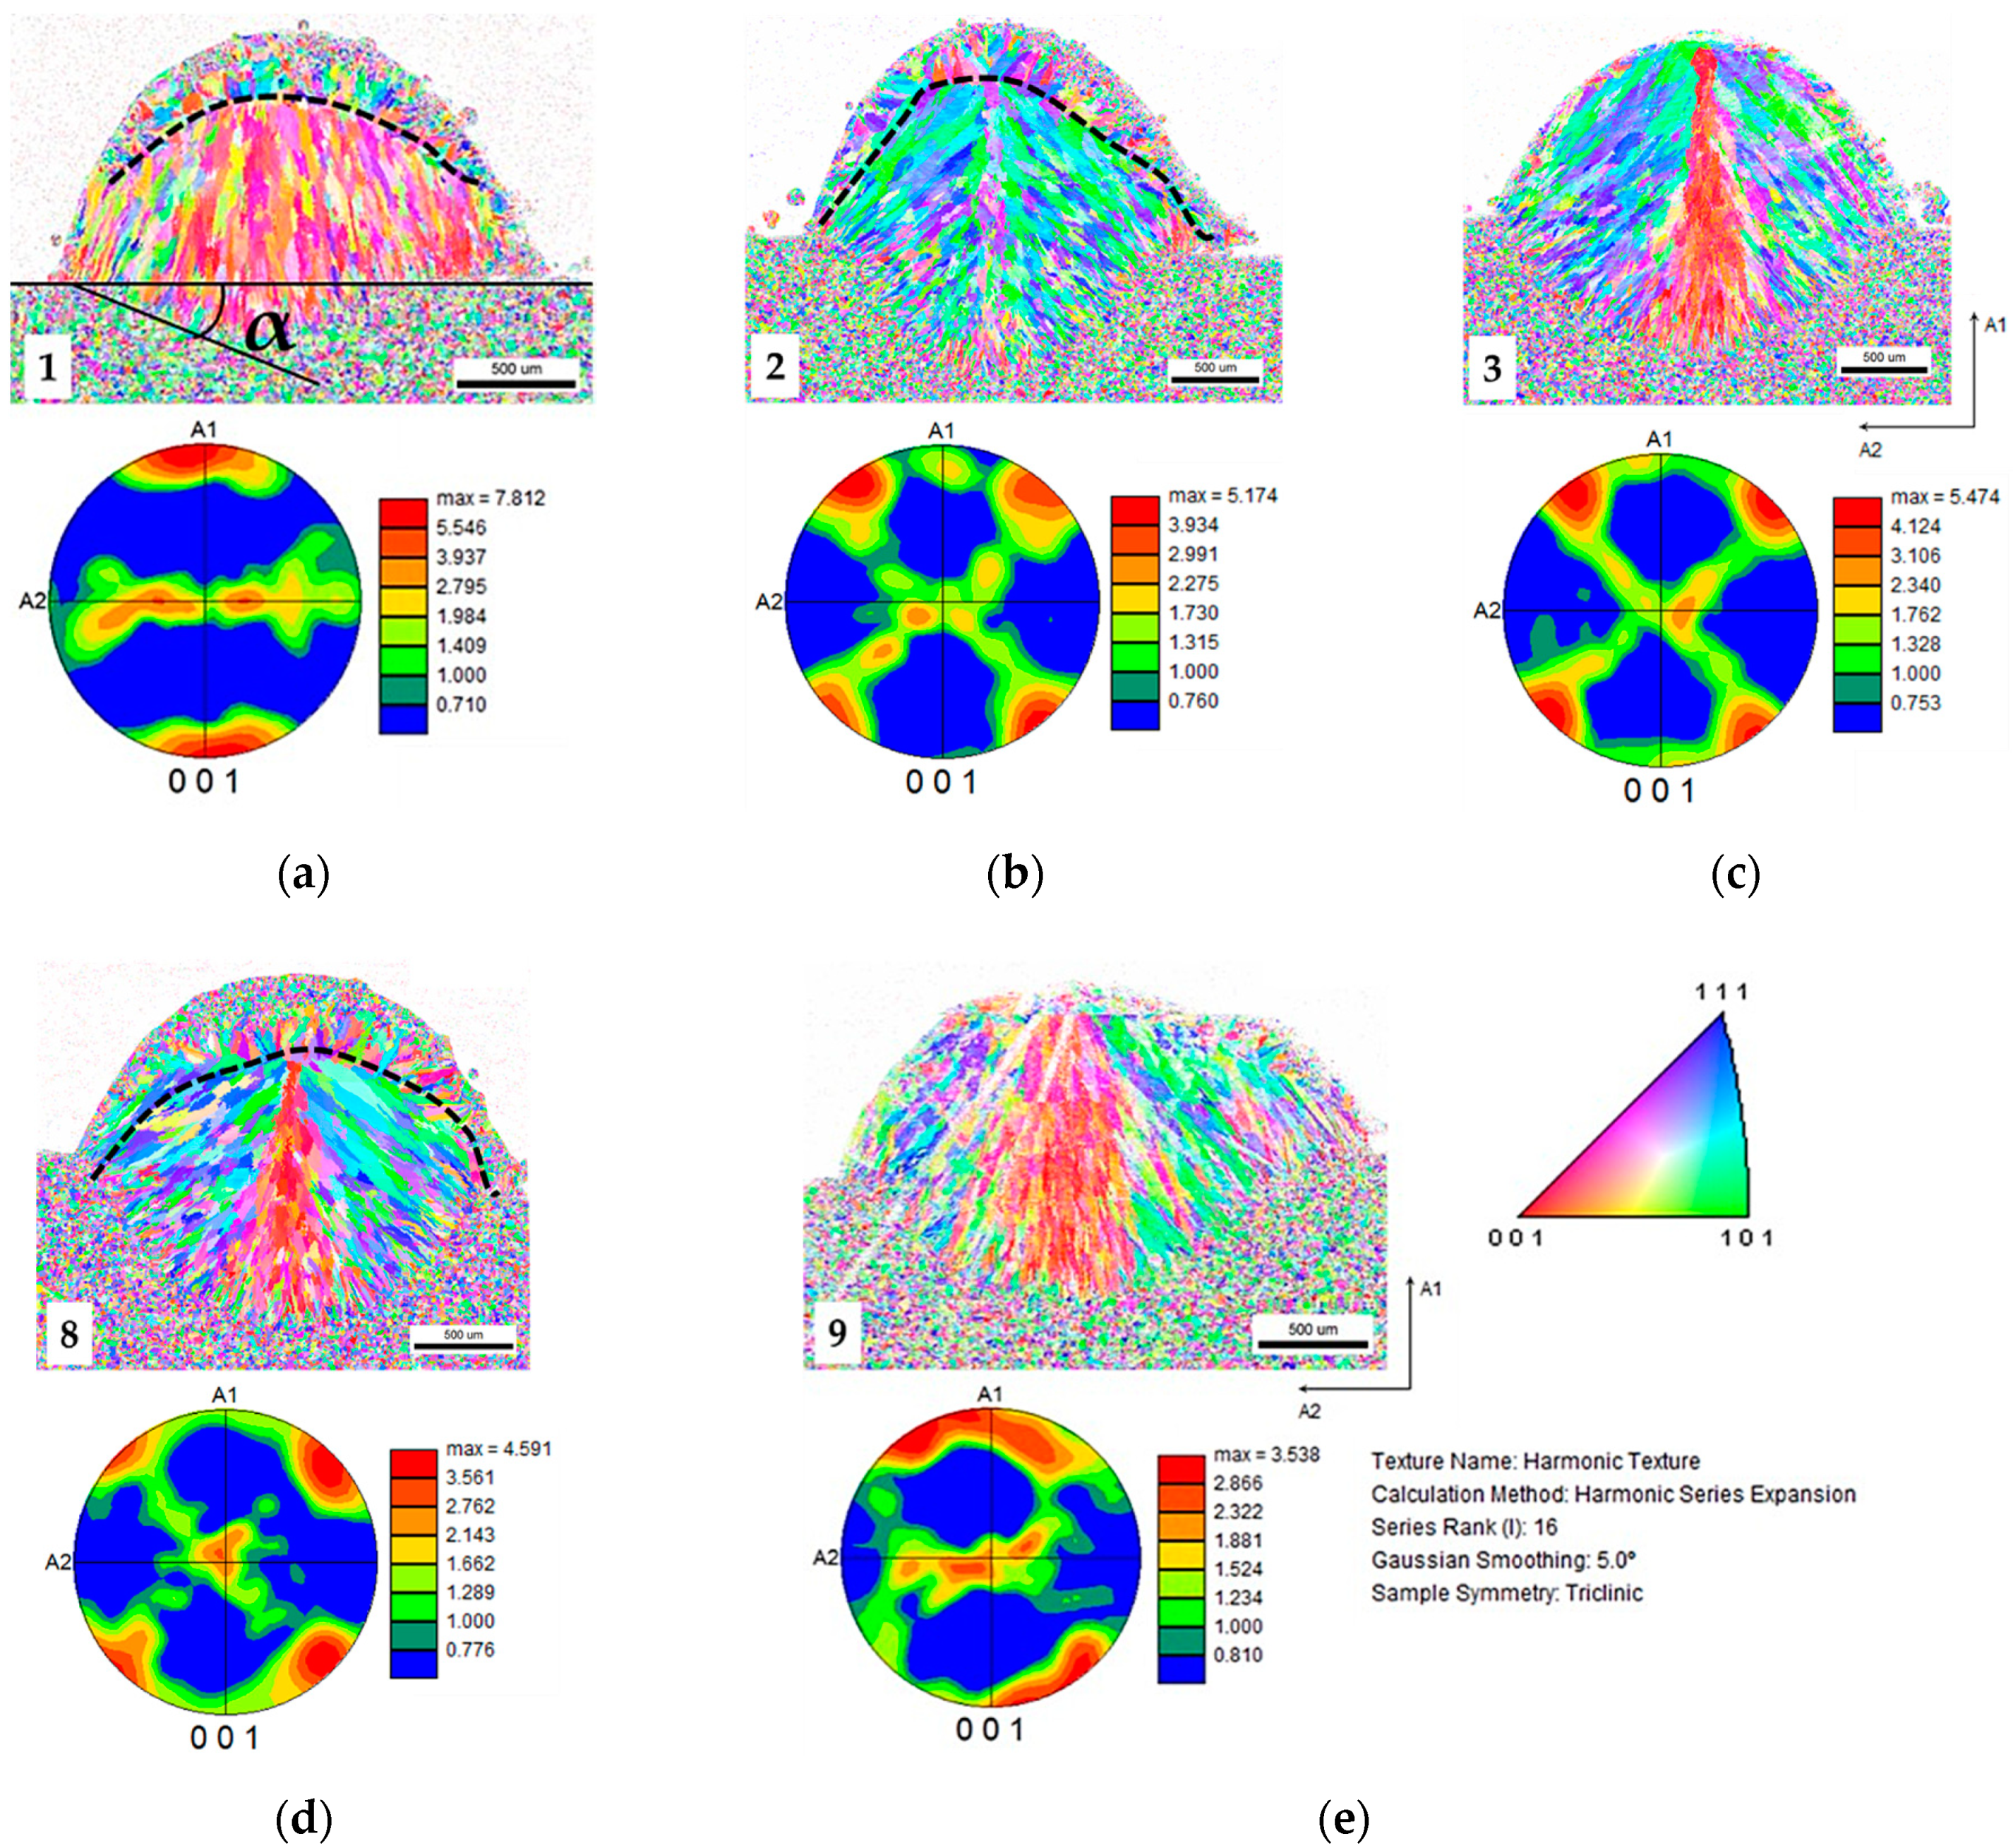
3.2. Grain Morphology
3.2.1. EBSD Mapping
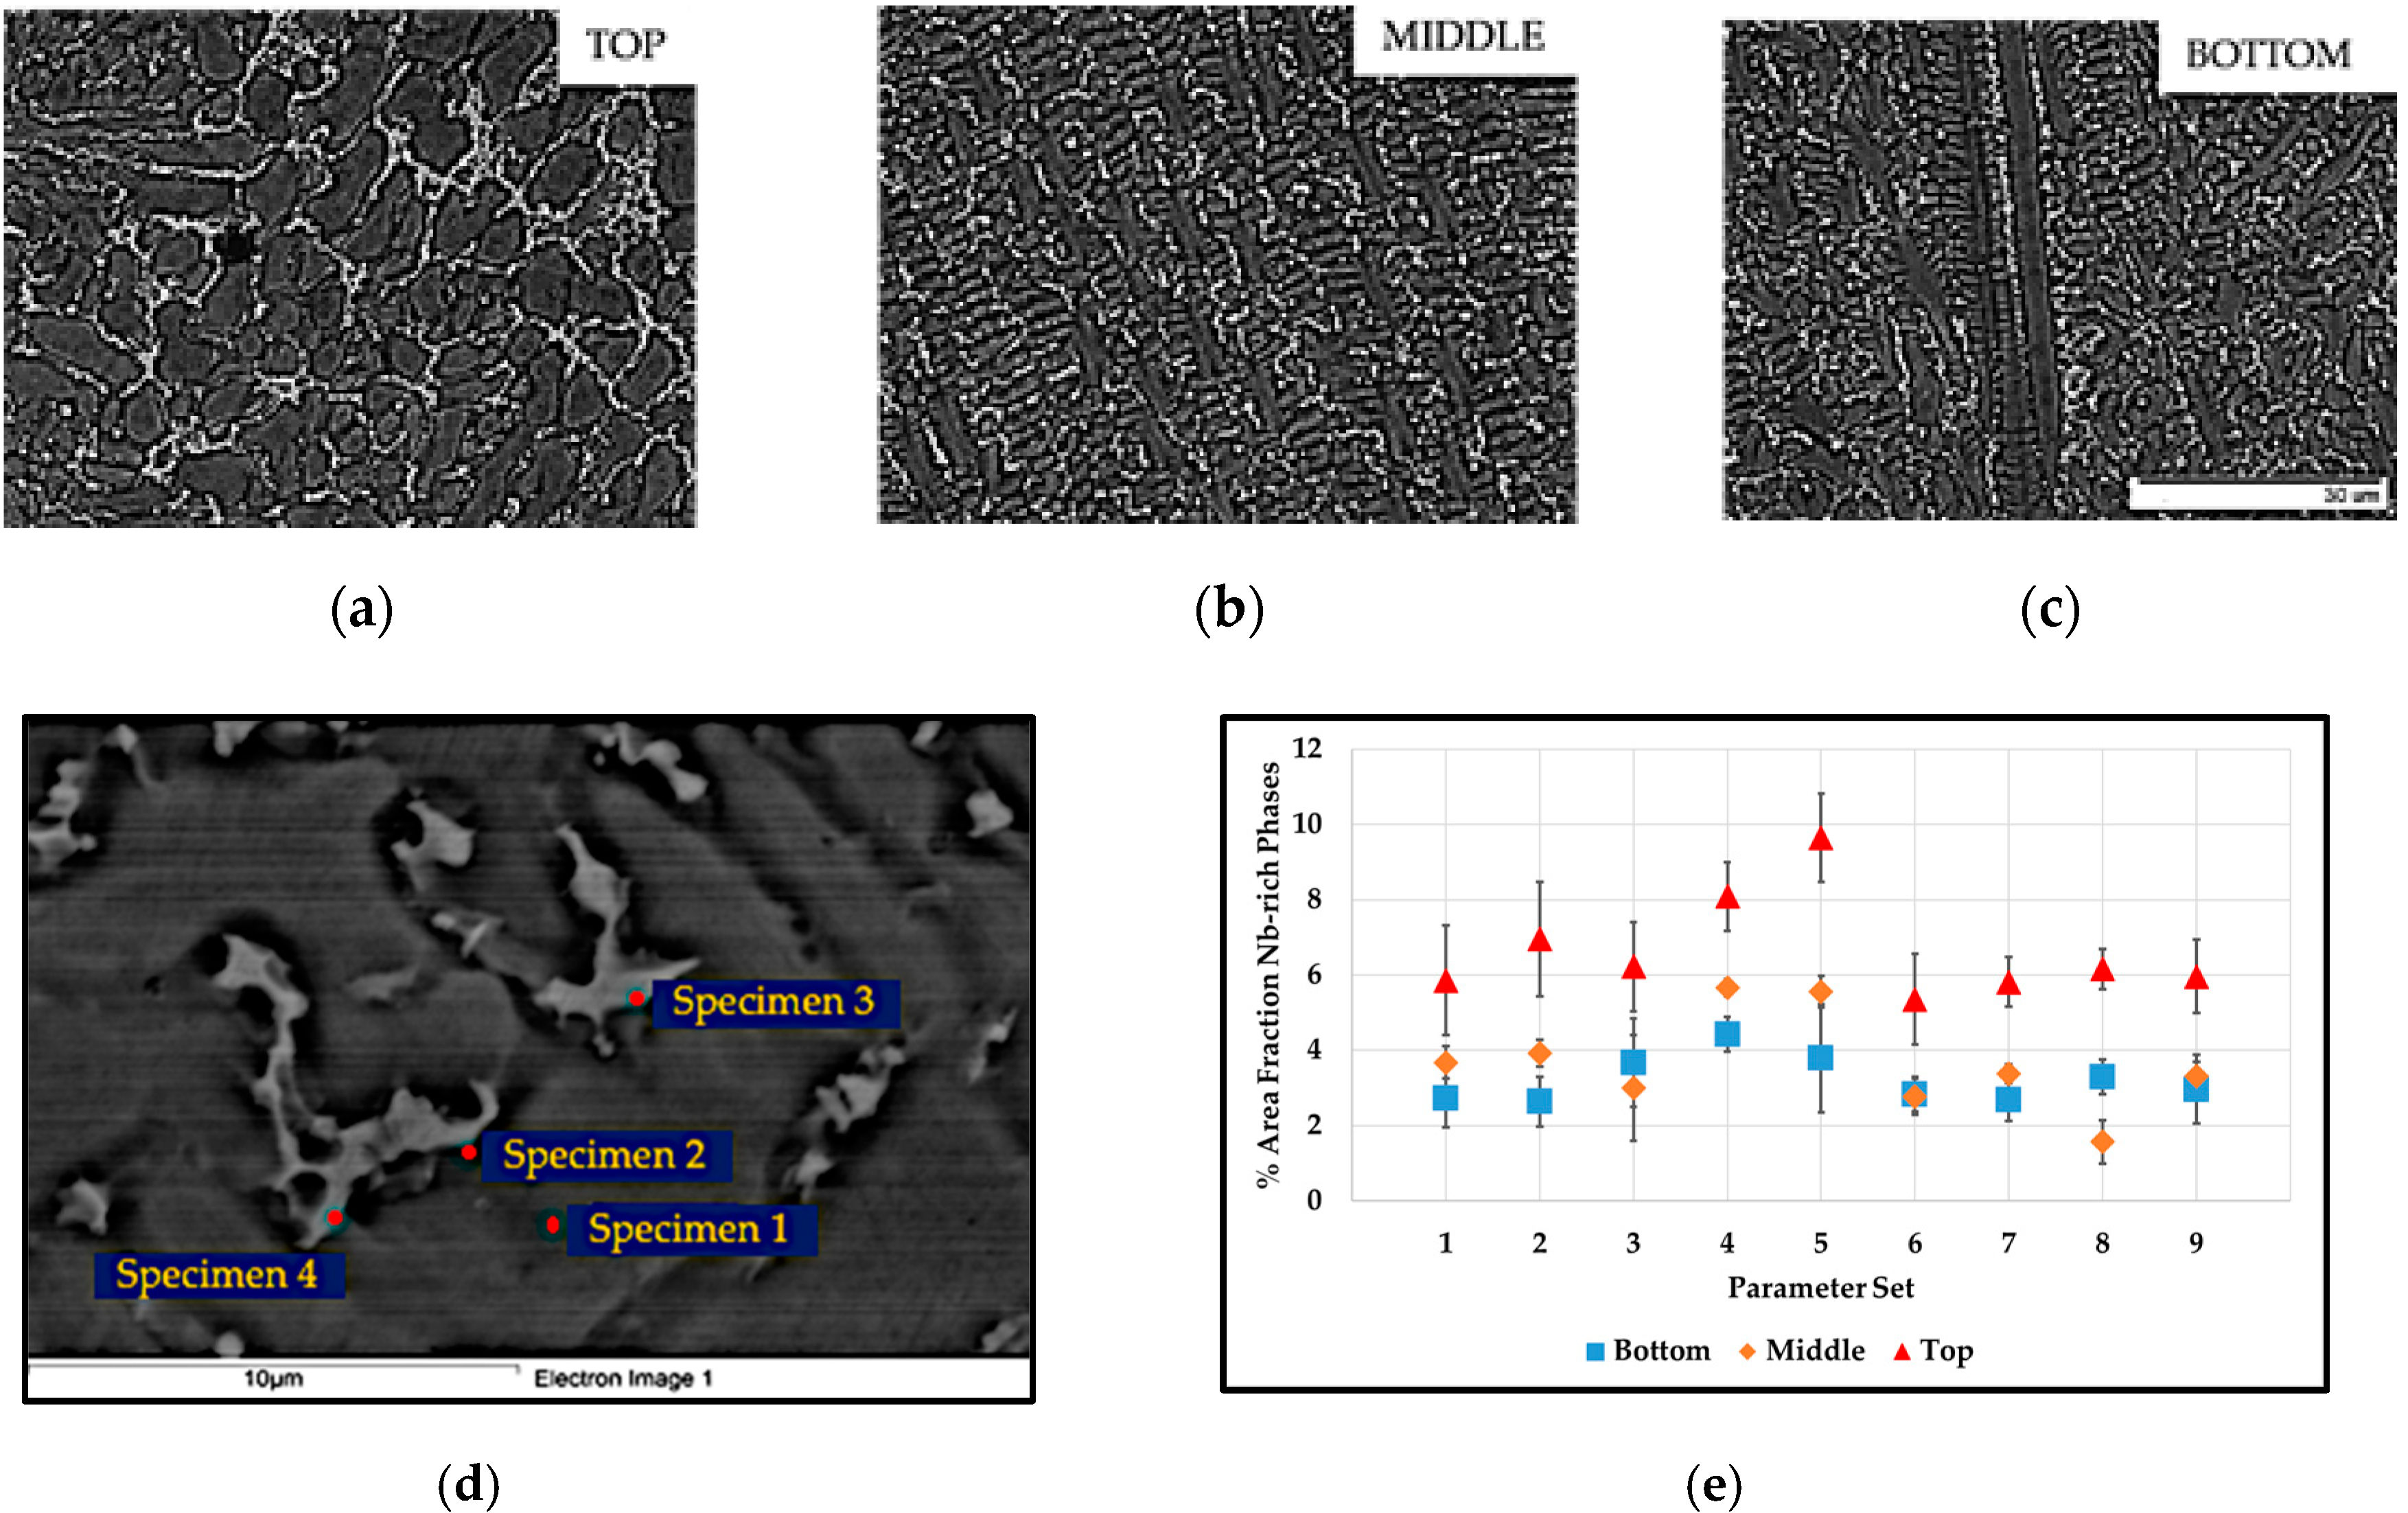
3.2.2. Nb-Rich Eutectic Phases
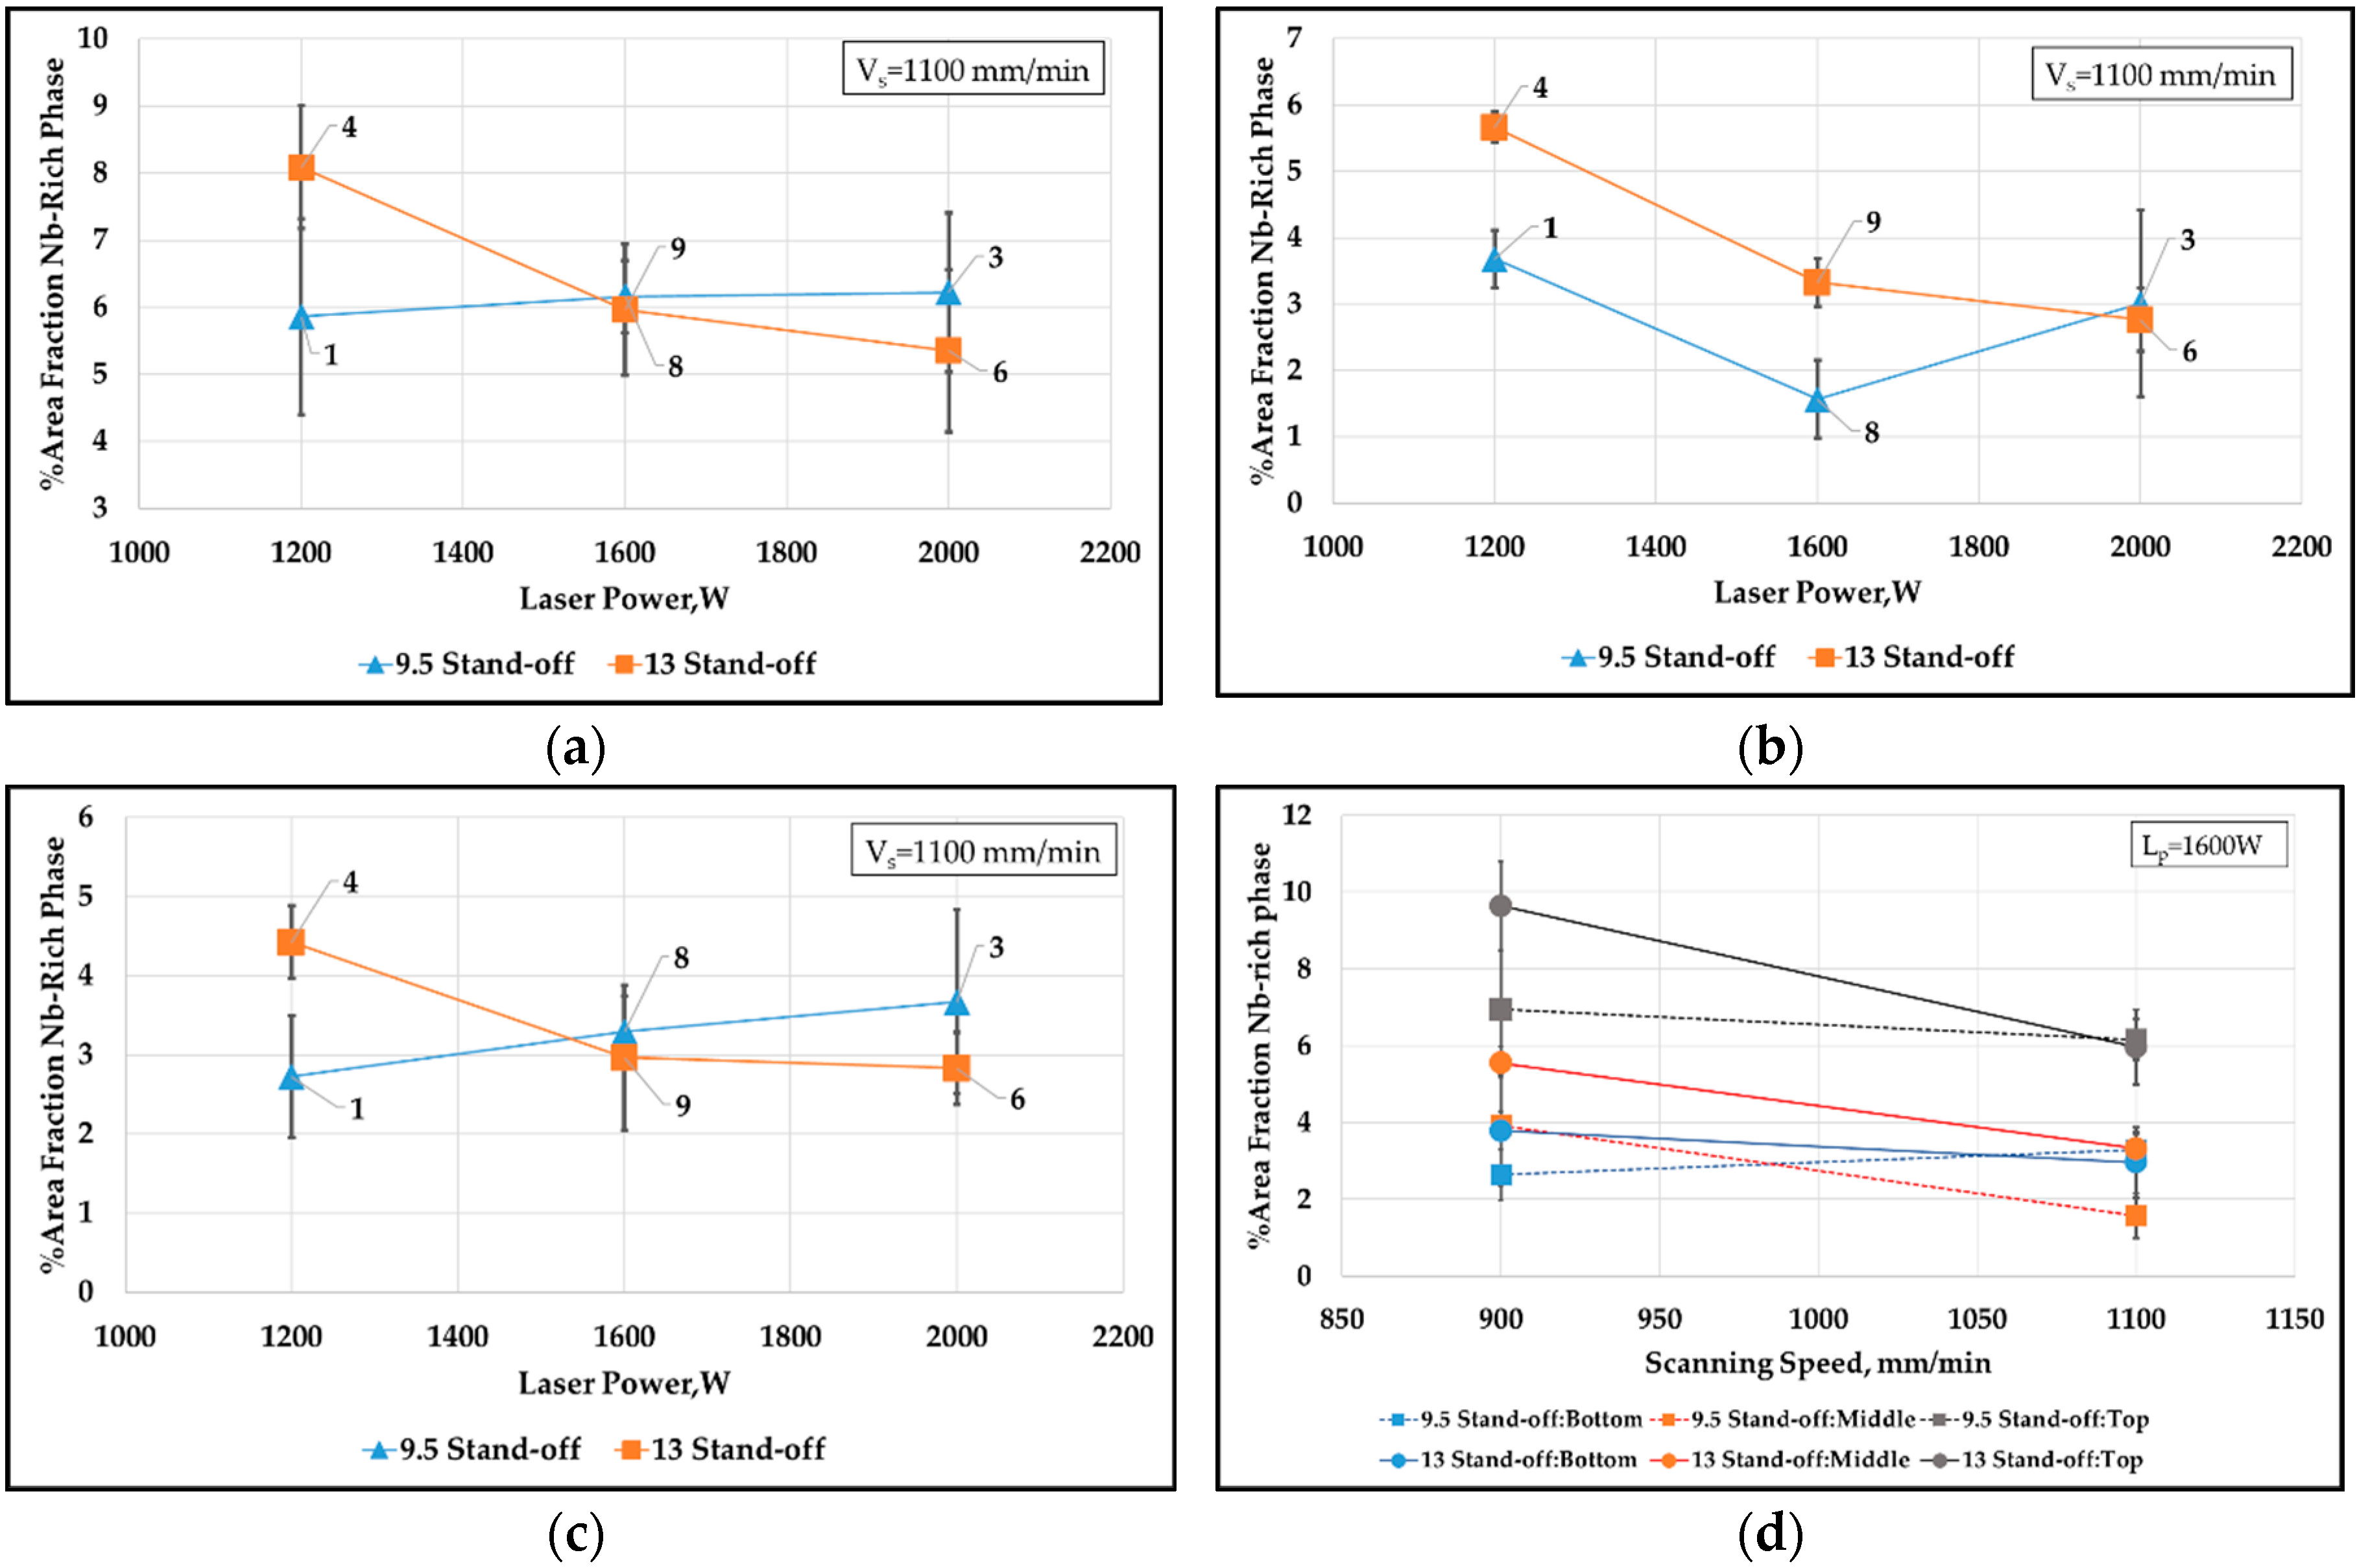
3.3. Effect of Laser Power, Scanning Speed and Laser Stand-Off Distance on Nb-Rich Phase Fraction
4. Conclusions
Author Contributions
Funding
Acknowledgments
Conflicts of Interest
References
- Domenico, A.; Angelastro, A.L.S. Experimental Analysis of the Direct Laser Metal Deposition Process. In New Trends in Technologies: Devices, Computer, Communication and Industrial Systems; IntechOpen: London, UK, 2010. [Google Scholar] [CrossRef]
- Graf, B.; Ammer, S.; Gumenyuk, A.; Rethmeier, M. Design of Experiments for Laser Metal Deposition in Maintenance, Repair and Overhaul Applications. Procedia CIRP 2013, 11, 245–248. [Google Scholar] [CrossRef]
- Boisselier, D.; Sankaré, S. Influence of Powder Characteristics in Laser Direct Metal Deposition of SS316L for Metallic Parts Manufacturing. Phys. Procedia 2012, 39, 455–463. [Google Scholar] [CrossRef]
- Witzel, J.; Kelbassa, I.; Gasser, A.; Backes, G. Increasing the deposition rate of inconel 718 for LMD. In Proceedings of the International Congress on Applications of Lasers & Electro-Optics, Anaheim, CA, USA, 16–20 October 2016; pp. 304–310. [Google Scholar]
- Abioye, T.E.; Farayibi, P.K.; Kinnel, P.; Clare, A.T. Functionally graded Ni-Ti microstructures synthesised in process by direct laser metal deposition. Int. J. Adv. Manuf. Technol. 2015, 79, 843–850. [Google Scholar] [CrossRef][Green Version]
- Shah, K.; Haq, I.u.; Khan, A.; Shah, S.A.; Khan, M.; Pinkerton, A.J. Parametric study of development of Inconel-steel functionally graded materials by laser direct metal deposition. Mater. Des. (1980–2015) 2014, 54, 531–538. [Google Scholar] [CrossRef]
- Shah, K.; Izhar U., H.; Shah, S.A.; Khan, F.U.; Khan, M.T.; Khan, S. Experimental study of direct laser deposition of Ti-6Al-4V and Inconel 718 by using pulsed parameters. Sci. World J. 2014, 2014, 841549. [Google Scholar] [CrossRef] [PubMed]
- Zhong, C.; Gasser, A.; Schopphoven, T.; Poprawe, R. Experimental study of porosity reduction in high deposition-rate Laser Material Deposition. Opt. Laser Technol. 2015, 75, 87–92. [Google Scholar] [CrossRef]
- Sui, S.; Zhong, C.; Chen, J.; Gasser, A.; Huang, W.; Schleifenbaum, J.H. Influence of solution heat treatment on microstructure and tensile properties of Inconel 718 formed by high-deposition-rate laser metal deposition. J. Alloys Compd. 2018, 740, 389–399. [Google Scholar] [CrossRef]
- Zhong, C.; Biermann, T.; Gasser, A.; Poprawe, R. Experimental study of effects of main process parameters on porosity, track geometry, deposition rate, and powder efficiency for high deposition rate laser metal deposition. J. Laser Appl. 2015, 27. [Google Scholar] [CrossRef]
- Zhong, C.; Gasser, A.; Kittel, J.; Wissenbach, K.; Poprawe, R. Improvement of material performance of Inconel 718 formed by high deposition-rate laser metal deposition. Mater. Des. 2016, 98, 128–134. [Google Scholar] [CrossRef]
- Zhong, C.; Gasser, A.; Kittel, J.; Fu, J.; Ding, Y.; Poprawe, R. Microstructures and tensile properties of Inconel 718 formed by high deposition-rate laser metal deposition. J. Laser Appl. 2016, 28. [Google Scholar] [CrossRef]
- Elefterie, C.F.; Guragata, C.; Bran, D.; Ghiban, B. Aeronautical requirements for Inconel 718 alloy. IOP Conf. Ser. Mater. Sci. Eng. 2017, 209. [Google Scholar] [CrossRef]
- Radavich, J.F. Superalloy 718—A Look at the First 30 Years. JOM 2012, 40, 35. [Google Scholar] [CrossRef]
- Loria, E.A. The Status and Prospects of Alloy 718. JOM 2012, 40, 36–41. [Google Scholar] [CrossRef]
- Radhakrishna, C.; Rao, K.P.; Srinivas, S. Laves phase in superalloy 718 weld metals. J. Mater. Sci. Lett. 1995, 14, 1810–1812. [Google Scholar] [CrossRef]
- Cieslak, M.J.; Knorovsky, G.A.; Headley, T.J.; Romig, J.A.D. The Solidification Metallurgy of Alloy 718 and Other Nb-Containing Superalloys. In Proceedings of the Superalloys 718 Metallurgy and Applications (1989), Pittsburgh, PA, USA, 12–14 June 1989; pp. 59–68. [Google Scholar]
- Ogborn, J.S.; Olson, D.L.; Cieslak, M.J. Influence of solidification on the microstructural evolution of nickel base weld metal. Mater. Sci. Eng. A 1995, 203, 134–139. [Google Scholar] [CrossRef]
- Knorovsky, G.A.; Cieslak, M.J.; Headley, T.J.; Romig, A.D.; Hammetter, W.F. INCONEL 718: A solidification diagram. Metall. Trans. A 1989, 20, 2149–2158. [Google Scholar] [CrossRef]
- Janaki Ram, G.D.; Venugopal Reddy, A.; Prasad Rao, K.; Madhusudhan Reddy, G. Control of Laves phase in Inconel 718 GTA welds with current pulsing. Sci. Technol. Weld. Join. 2013, 9, 390–398. [Google Scholar] [CrossRef]
- Manikandan, S.G.K.; Sivakumar, D.; Rao, K.P.; Kamaraj, M. Effect of weld cooling rate on Laves phase formation in Inconel 718 fusion zone. J. Mater. Process. Technol. 2014, 214, 358–364. [Google Scholar] [CrossRef]
- Manikandan, S.G.K.; Sivakumar, D.; Rao, K.P.; Kamaraj, M. Effect of enhanced cooling on microstructure evolution of alloy 718 using the gas tungsten arc welding process. Weld. World 2016, 60, 899–914. [Google Scholar] [CrossRef]
- Xiao, H.; Li, S.; Han, X.; Mazumder, J.; Song, L. Laves phase control of Inconel 718 alloy using quasi-continuous-wave laser additive manufacturing. Mater. Des. 2017, 122, 330–339. [Google Scholar] [CrossRef]
- Xiao, H.; Li, S.M.; Xiao, W.J.; Li, Y.Q.; Cha, L.M.; Mazumder, J.; Song, L.J. Effects of laser modes on Nb segregation and Laves phase formation during laser additive manufacturing of nickel-based superalloy. Mater. Lett. 2017, 188, 260–262. [Google Scholar] [CrossRef]
- Chen, Y.; Guo, Y.; Xu, M.; Ma, C.; Zhang, Q.; Wang, L.; Yao, J.; Li, Z. Study on the element segregation and Laves phase formation in the laser metal deposited IN718 superalloy by flat top laser and gaussian distribution laser. Mater. Sci. Eng. A 2019, 754, 339–347. [Google Scholar] [CrossRef]
- Amine, T.; Newkirk, J.W.; Liou, F. Investigation of effect of process parameters on multilayer builds by direct metal deposition. Appl. Therm. Eng. 2014, 73, 500–511. [Google Scholar] [CrossRef]
- Nie, P.; Ojo, O.A.; Li, Z. Modeling analysis of laser cladding of a nickel-based superalloy. Surf. Coat. Technol. 2014, 258, 1048–1059. [Google Scholar] [CrossRef]
- Nie, P.; Ojo, O.A.; Li, Z. Numerical modeling of microstructure evolution during laser additive manufacturing of a nickel-based superalloy. Acta Mater. 2014, 77, 85–95. [Google Scholar] [CrossRef]
- Parimi, L.L.; Ravi, A.G.; Clark, D.; Attallah, M.M. Microstructural and texture development in direct laser fabricated IN718. Mater. Charact. 2014, 89, 102–111. [Google Scholar] [CrossRef]
- Dinda, G.P.; Dasgupta, A.K.; Mazumder, J. Texture control during laser deposition of nickel-based superalloy. Scr. Mater. 2012, 67, 503–506. [Google Scholar] [CrossRef]
- Chen, B.; Mazumder, J. Role of process parameters during additive manufacturing by direct metal deposition of Inconel 718. Rapid Prototyp. J. 2017, 23, 919–929. [Google Scholar] [CrossRef]
- Segerstark, A.; Andersson, J.; Svensson, L.-E. Investigation of laser metal deposited Alloy 718 onto an EN 1.4401 stainless steel substrate. Opt. Laser Technol. 2017, 97, 144–153. [Google Scholar] [CrossRef]
- ASTM. F3055-14a, Standard Specification for Additive Manufacturing Nickel Alloy (UNS N07718) with Powder Bed Fusion; ASTM International: West Conshohocken, PA, USA, 2014. [Google Scholar] [CrossRef]
- ASTM. B670-07, Standard Specification for Precipitation-Hardening Nickel Alloy (UNS N07718) Plate, Sheet, and Strip for High-Temperature Service; ASTM International: West Conshohocken, PA, USA, 2018. [Google Scholar] [CrossRef]
- International, A. ASTM E112-13, Standard Test Methods for Determining Average Grain Size; ASTM: West Conshohocken, PA, USA, 2013. [Google Scholar] [CrossRef]
- de Oliveira, U.; Ocelík, V.; De Hosson, J.T.M. Analysis of coaxial laser cladding processing conditions. Surf. Coat. Technol. 2005, 197, 127–136. [Google Scholar] [CrossRef]
- Corbin, D.J.; Nassar, A.R.; Reutzel, E.W.; Beese, A.M.; Kistler, N.A. Effect of directed energy deposition processing parameters on laser deposited Inconel® 718: External morphology. J. Laser Appl. 2017, 29. [Google Scholar] [CrossRef]
- DuPont, J.N. Fundamentals of Weld Solidification. In Welding Fundamentals and Processes; Lienert, T.S.T., Babu, S., Acoff, V., Eds.; ASM International: West Conshohocken, PA, USA, 2011; pp. 96–114. [Google Scholar] [CrossRef]
- Trivedi, R.; David, S.A.; Eshelman, M.A.; Vitek, J.M.; Babu, S.S.; Hong, T.; DebRoy, T. In situobservations of weld pool solidification using transparent metal-analog systems. J. Appl. Phys. 2003, 93, 4885–4895. [Google Scholar] [CrossRef]
- David, S.A.; Babu, S.S.; Vitek, J.M. Welding: Solidification and microstructure. JOM 2003, 55, 14–20. [Google Scholar] [CrossRef]
- Antonsson, T.; Fredriksson, H. The effect of cooling rate on the solidification of INCONEL 718. Metall. Mater. Trans. B 2005, 36, 85–96. [Google Scholar] [CrossRef]
- Patel, A.D.; Murty, Y.V. Effect of Cooling Rate on Microstructural Development in Alloy 718. In Superalloys 718, 625, 706 and Various Derivatives; Carpenter Technology Corporation: Pittsburgh, PA, USA, 2001; pp. 124–132. [Google Scholar]
- Dong, H.B.; Yang, X.L.; Lee, P.D.; Wang, W. Simulation of equiaxed growth ahead of an advancing columnar front in directionally solidified Ni-based superalloys. J. Mater. Sci. 2004, 39, 7207–7212. [Google Scholar] [CrossRef]
- Gäumann, M.; Henry, S.; Cléton, F.; Wagnière, J.D.; Kurz, W. Epitaxial laser metal forming: Analysis of microstructure formation. Mater. Sci. Eng. A 1999, 271, 232–241. [Google Scholar] [CrossRef]
- Hunt, J.D. Steady state columnar and equiaxed growth of dendrites and eutectic. Mater. Sci. Eng. 1984, 65, 75–83. [Google Scholar] [CrossRef]
- Kurz, W.; Bezençon, C.; Gäumann, M. Columnar to equiaxed transition in solidification processing. Sci. Technol. Adv. Mater. 2001, 2, 185–191. [Google Scholar] [CrossRef]
- Gäumann, M.; Bezençon, C.; Canalis, P.; Kurz, W. Single-crystal laser deposition of superalloys: Processing–microstructure maps. Acta Mater. 2001, 49, 1051–1062. [Google Scholar] [CrossRef]
- Porter, A.D.; Easterling, K.E.; Sherif, M.Y. Phase Transformations in Metals and Alloys, 3rd ed.; CRC Press: Boca Raton, FL, USA, 2009; p. 536. [Google Scholar] [CrossRef]


| Elements | Ni | Cr | Fe | Nb + Ta | Mo | C | Ti | Al |
|---|---|---|---|---|---|---|---|---|
| Powder | 52.89 | 18.7 | 18.52 | 4.9 | 2.94 | 0.05 | 0.92 | 0.61 |
| Substrate | 53.57 | 18.7 | 17.58 | 4.97 | 2.89 | 0.04 | 0.91 | 0.59 |
| Elements | Co | Ta | B | Cu | Mn | Si | P | S |
| Powder | 0.11 | <0.01 | <0.001 | <0.1 | 0.05 | 0.19 | 0.005 | 0.004 |
| Substrate | 0.25 | 0.004 | 0.002 | 0.23 | 0.09 | 0.06 | 0.008 | 0.001 |
| Laser Power, P (W) | Scanning Speed, V (mm/min) | Laser Stand-Off Distance, Lo (mm) | Designation |
|---|---|---|---|
| 1200 | 1100 | 9.5 | 1 |
| 1600 | 900 | 9.5 | 2 |
| 2000 | 1100 | 9.5 | 3 |
| 1200 | 1100 | 13 | 4 |
| 1600 | 900 | 13 | 5 |
| 2000 | 1100 | 13 | 6 |
| 1800 | 1100 | 13 | 7 |
| 1600 | 1100 | 9.5 | 8 |
| 1600 | 1100 | 13 | 9 |
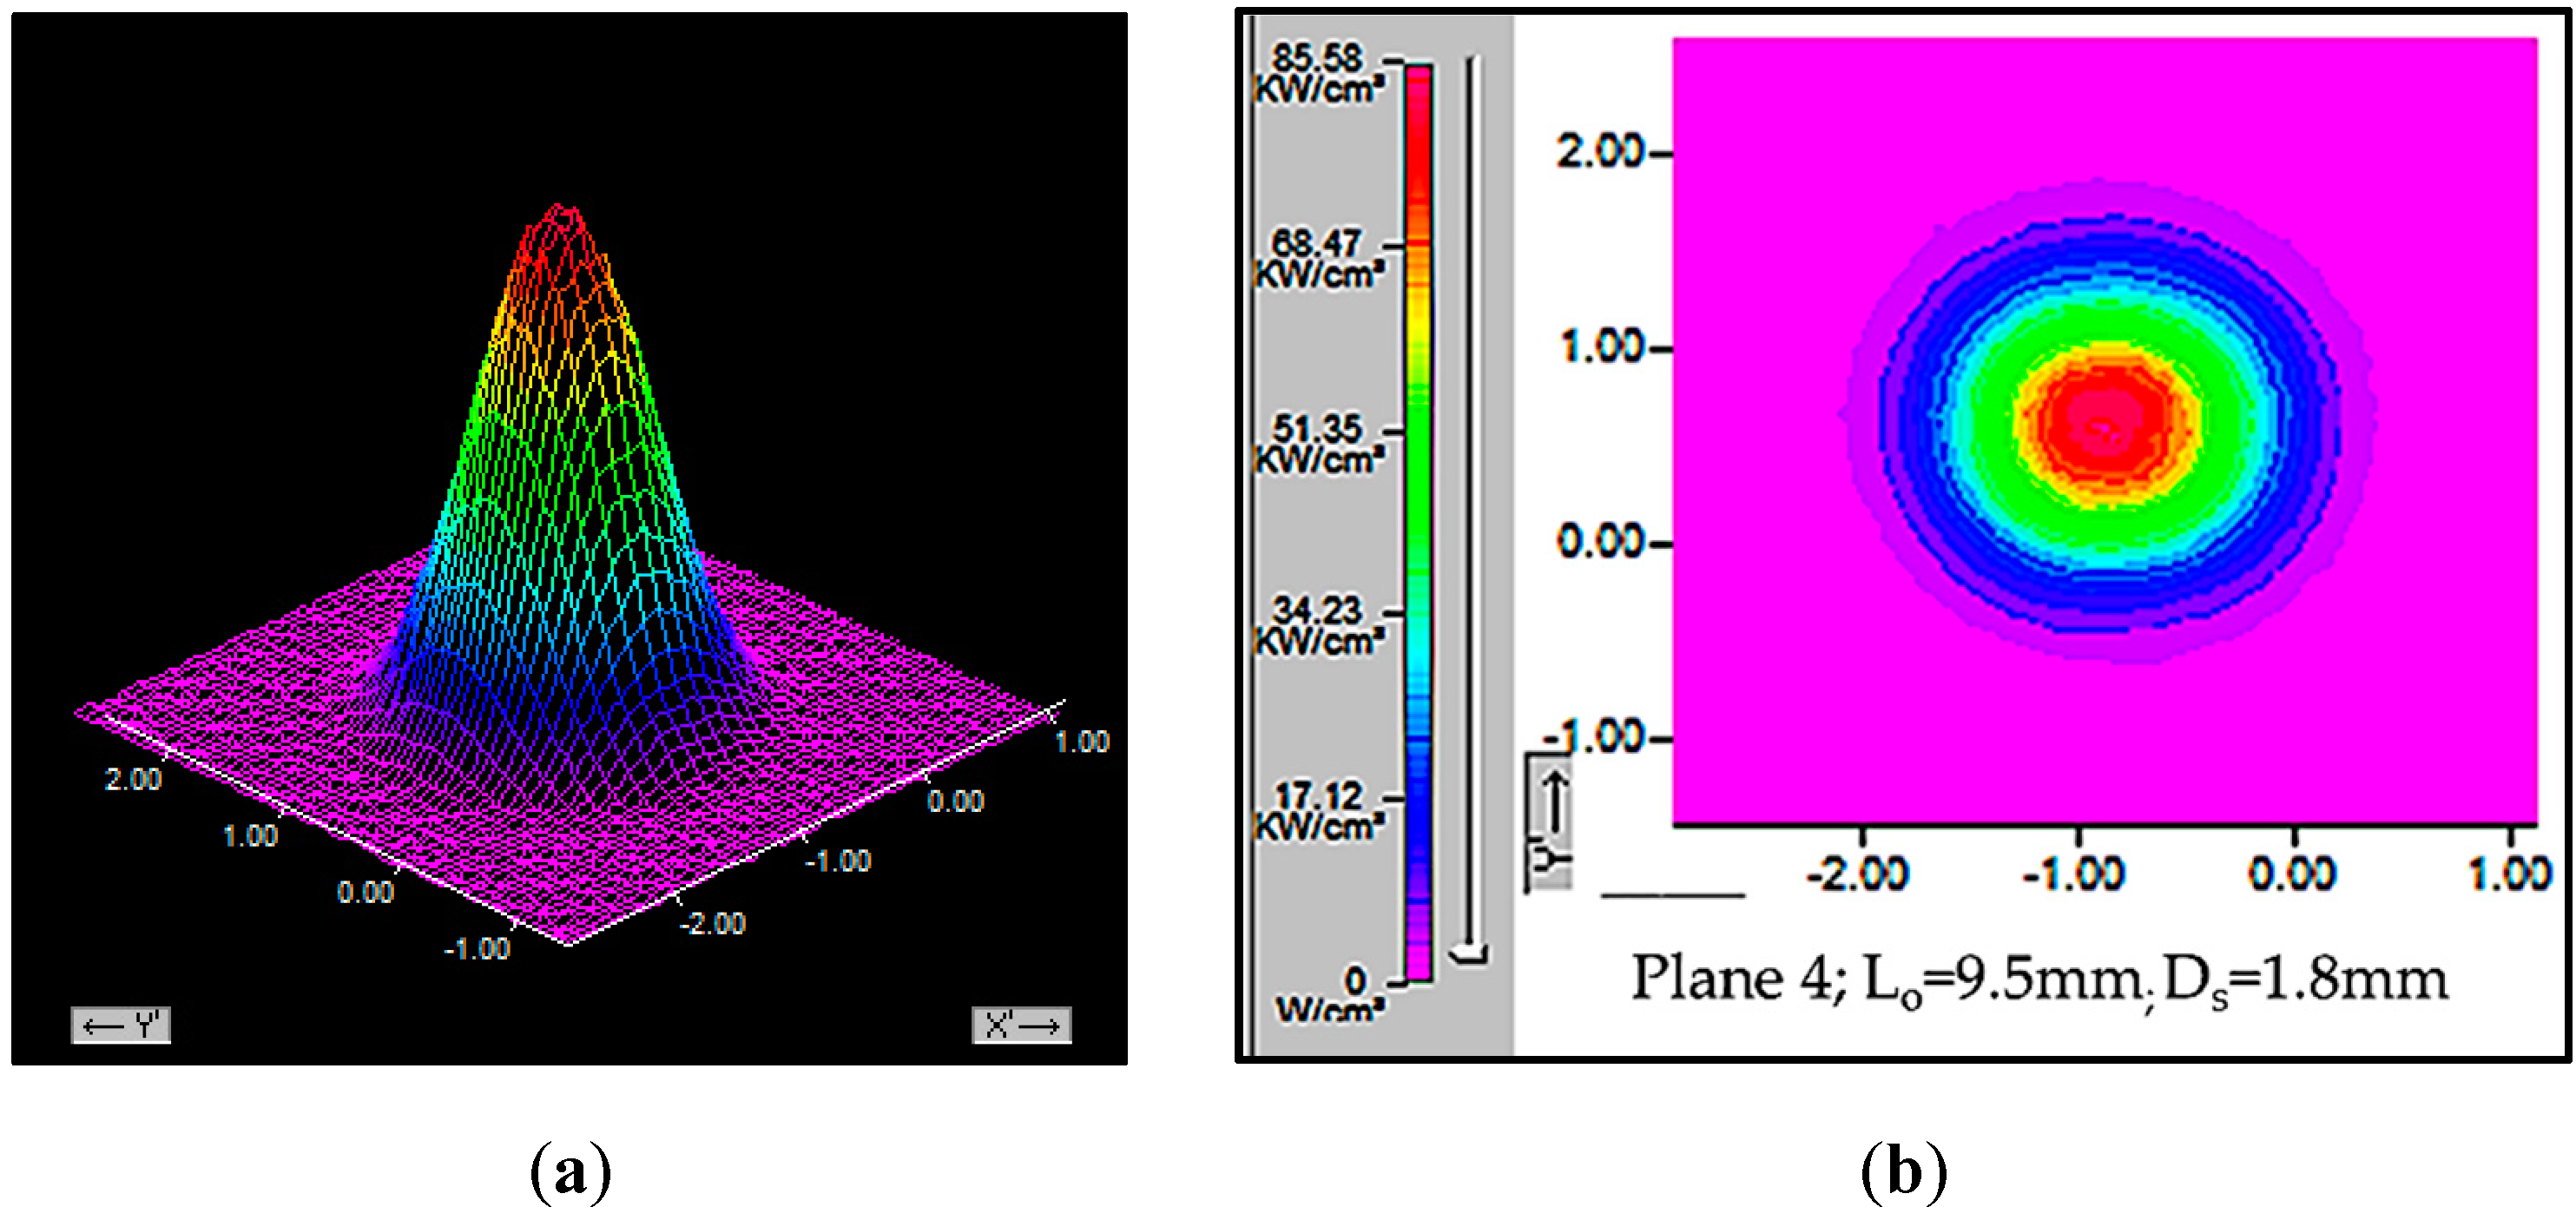
| Laser Power P in W | Peak Power Intensity | |
|---|---|---|
| Lo = 9.5 mm | Lo = 13 mm | |
| Peak Power, kW/cm2 | Peak Power, kW/cm2 | |
| 1200 | 85.6 | 52.6 |
| 1600 | 114 | 70 |
| 2000 | 142.5 | 87.7 |
| Element | Weight % | |||
|---|---|---|---|---|
| Spectrum 1 | Spectrum 2 | Spectrum 3 | Spectrum 4 | |
| Ni | 46.86 | 38.14 | 45.11 | 40.67 |
| Cr | 18.03 | 13.02 | 11.77 | 13.54 |
| Fe | 17.95 | 11.05 | 10.05 | 11.43 |
| Nb | 2.2 | 13.06 | 16.3 | 17.89 |
| Al | 0.47 | 0.34 | 0.28 | 0.3 |
| Ti | 0.52 | 1.19 | 1.33 | 1.65 |
| Mo | 2.79 | 3.99 | - | - |
| C | 0.22 | 5.3 | 3.73 | 4.68 |
© 2020 by the authors. Licensee MDPI, Basel, Switzerland. This article is an open access article distributed under the terms and conditions of the Creative Commons Attribution (CC BY) license (http://creativecommons.org/licenses/by/4.0/).
Share and Cite
Sreekanth, S.; Ghassemali, E.; Hurtig, K.; Joshi, S.; Andersson, J. Effect of Direct Energy Deposition Process Parameters on Single-Track Deposits of Alloy 718. Metals 2020, 10, 96. https://doi.org/10.3390/met10010096
Sreekanth S, Ghassemali E, Hurtig K, Joshi S, Andersson J. Effect of Direct Energy Deposition Process Parameters on Single-Track Deposits of Alloy 718. Metals. 2020; 10(1):96. https://doi.org/10.3390/met10010096
Chicago/Turabian StyleSreekanth, Suhas, Ehsan Ghassemali, Kjell Hurtig, Shrikant Joshi, and Joel Andersson. 2020. "Effect of Direct Energy Deposition Process Parameters on Single-Track Deposits of Alloy 718" Metals 10, no. 1: 96. https://doi.org/10.3390/met10010096
APA StyleSreekanth, S., Ghassemali, E., Hurtig, K., Joshi, S., & Andersson, J. (2020). Effect of Direct Energy Deposition Process Parameters on Single-Track Deposits of Alloy 718. Metals, 10(1), 96. https://doi.org/10.3390/met10010096