The Influence of Texture on the Ductile-to-Brittle Transition Behavior in Fe20Cr4.5Al Oxide Dispersion Strengthened Alloy


Abstract

1. Introduction
2. Materials and Methods
- Hot isostatically pressed at 1050 °C + 1330 °C/1 h, hereafter denoted “Random”. This material supplied as bar of 100 mm diameter presents a ferritic bimodal grain structure consisting of fine equiaxed grains of 2 µm diameter decorating the grain boundaries of large equiaxed grains of 25 µm in diameter [14] (Figure 1a). In this condition, the material presents a random texture with a weak component characterized by a <100> crystalline direction parallel to the bar axis [14].
- Hot swaged at 1050 °C + 1330 °C/1 h bar of 9.5 mm in diameter, hereafter denoted “<100>”. The resulting microstructure consists of very elongated and coarse grains of 150 µm in diameter and up to 5103 µm in length with the long axis parallel to the bar axis [14] (Figure 1b). In this condition, a strong η-fiber (<100>II bar axis) was developed [14].
- Hot extruded at 1050 °C + 1330 °C/1 h of 60 mm diameter hereafter denoted as “<110>”. The microstructure consists of ferritic submicrometric grains elongated in the longitudinal direction of the bar of 1.3 µm length and 0.7 µm in diameter [14] (Figure 1c). This material is characterized by a very strong α-fiber (<110>II bar axis), [12].
- Recrystallized hot extruded bar of 50 mm diameter in the as-delivered condition from the manufacturer, hereafter denoted “<111>”. This material presents the most coarse and elongated grains with 3·mm in diameter and of about 20 mm in length, [14] (Figure 1d). Agglomeration of small grains of about 50 µm diameter was also observed [14], which indicates that the recrystallization process has not been completed. In this condition, the 5 to 10 grains that fill up the bar cross section present a <111> preferential crystalline orientation parallel to the longitudinal direction of the bar [14].
3. Results
3.1. Main Texture Components
3.2. Hardness Tests
3.3. Tensile Tests
Fractographic Analysis of Fracture Surface of Tensile Specimens
3.4. Charpy Tests
Fractographic Analysis of Fracture Surface of Charpy Specimens
4. Discussion
4.1. Hardness
4.2. Tensile Tests
4.3. Charpy Tests
5. Conclusions
- Tensile curves and fractographic analysis reveal that the fracture of tensile specimens tested at −196 °C develops from the propagation of a microcrack-like defect after the onset of yielding.
- Two criteria to determine the cleavage mechanism have been analyzed. One of macroscopic nature, based on the Normal Stress Law, and the other of microscopic nature, which assumes that fracture occurs from the propagation of a microcrack-like defect. The results show that the applied tensile stress for cleavage fracture is considerably over-predicted with the Normal Stress Law while the second criterion gives accurate predictions.
- The effect of texture on the cleavage strength of tensile specimens can be properly predicted with the kinking crack model.
- The lower shelf values determined for the conditions studied are the same regardless of the texture and microstructure. The effect of texture on the notch toughness was noted where plastic flow predominates, i.e., in the ductile to brittle transition temperature and in the upper shelf energy.
Author Contributions
Funding
Acknowledgments
Conflicts of Interest
References
- Dahl, W. Steel: A Handbook for Materials Research and Engineering; Springer: Berlin, Germany; New York, NY, USA; Verlag Stahleisen: Düsseldorf, Germany, 1992. [Google Scholar]
- Morrison, W.B. Influence of testing direction on the mechanical properties of vvrought steel. Met. Technol. 1975, 2, 33–41. [Google Scholar] [CrossRef]
- Larson, F.; Zarkades, A. Properties of Textural Titanium Alloys; Batelle Columbus Laboratories: Columbus, OH, USA, 1974. [Google Scholar]
- Chao, J.; Capdevila, C. Anisotropy in mechanical properties and fracture behavior of an oxide dispersion Fe20Cr5Al alloy. Metall. Mater. Trans. A 2014, 45, 3767–3780. [Google Scholar] [CrossRef]
- Kasada, R.; Lee, S.G.; Isselin, J.; Lee, J.H.; Omura, T.; Kimura, A.; Okuda, T.; Inoue, M.; Ukai, S.; Ohnuki, S.; et al. Anisotropy in tensile and ductile–brittle transition behavior of ODS ferritic steels. J. Nucl. Mater. 2011, 417, 180–184. [Google Scholar] [CrossRef]
- Hosford, W.F.; Backofen, W.A. Strength and Plasticity of Textured Metals in Fundamentals of Deformation Processing; Syracuse University Press: Syracuse, NY, USA, 1964. [Google Scholar]
- Allen, N.P.; Earley, C.C.; Hale, K.F.; Rendall, J.H. Fracture of cold-worked iron. J. Iron Steel Inst. 1964, 202, 808. [Google Scholar]
- Echeverria, A.; Linaza, M.A.; Rodriguez-Ibabe, J.M. Cleavage Fracture Micromechanisms in Ti, Ti-V and C-Mn-B Microalloyed Bainitic Steels. In Proceedings of the International Conference on Microalloying in Steels, Donostia-San Sebastian, Spain, 7–9 September 1998; RodriguezIbabe, J.M., Gutierrez, I., Lopez, B., Eds.; Trans Tech Publications Ltd.: Zuerich, Switzerland, 1998; Volume 284, pp. 351–358. [Google Scholar]
- Echeverria, A.; Rodriguez-Ibabe, J. Brittle fracture micromechanisms in bainitic microalloyed steels. Int. J. Fract. 1998, 89, L39–L44. [Google Scholar]
- Inagaki, H.; Kurihara, K.; Kozasu, I. Influence of crystallographic texture on strength and toughness of control-rolled high-tensile strength steel. Trans. Iron Steel Inst. Jpn. 1977, 17, 75–81. [Google Scholar] [CrossRef]
- Koh, B.H.J.; Kwa, C.A.; Manoharan, M. Mixed-mode impact behaviour of a low carbon steel. Int. J. Fract. 1996, 77, R77–R81. [Google Scholar] [CrossRef]
- Chao, J.; Aranda, M.M.; Rementeria, R.; Serrano, M.; Capdevila, C. On the anisotropy of the ductile to Brittle Transition behavior in a wrought and in two oxide dispersion strengthened FeCrAl steels. Metall. Mater. Trans. A Phys. Metall. Mater. Sci. 2019, 50A, 625–640. [Google Scholar] [CrossRef]
- Chao, J.; Rementeria, R.; Aranda, M.; Capdevila, C.; Gonzalez-Carrasco, J.L. Comparison of ductile-to-Brittle Transition behavior in two similar ferritic oxide dispersion strengthened alloys. Materials 2016, 9, 637. [Google Scholar] [CrossRef]
- Chao, J.; Cristina, M.C.; Gonzalez-Carrasco, J.L.; Gonzalez-Doncel, G. Effect of the thermomechanical processing on the mechanical properties of MA 956 alloy. In Materials for Advanced Power Engineering; Lecomte-Beckers, J., Carton, M., Schubert, F., Ennis, P.J., Eds.; Forschungszentrum Jülich GmbH: Julich, Germany, 1998; Volume 2, pp. 827–833. [Google Scholar]
- Hupalo, M.F.; Terada, M.; Kliauga, A.M.; Padilha, A.F. Microstructural characterization of INCOLOY alloy MA 956. Materialwiss. Werkstofftech. 2003, 34, 505–508. [Google Scholar] [CrossRef]
- Czyrskafilemonowicz, A.; Wrobel, M.; Dubiel, B.; Ennis, P.J. Transmission electron-microscopy study of dislocation-dispersoid interaction in deformed incoloy ma956. Scr. Metall. Mater. 1995, 32, 331–335. [Google Scholar] [CrossRef]
- Garfinkle, M.; Garlick, R.G. A stereographic representation of knoop hardness anisotropy. Trans. Metall. Soc. AIME 1968, 242, 809. [Google Scholar]
- Masumoto, H.; Kikuchi, M. Elastic anisotropy and its temperature dependence of single crystals of fe-19.43 percent cr alloy. Trans. Jpn. Inst. Met. 1971, 12, 90. [Google Scholar] [CrossRef][Green Version]
- Chao, J.; Gonzalez-Carrasco, J.L. Influencia del procesado de la aleación MA956 sobre la temperatura de transición ductil-fragil. In VIII Congreso Nacional de Propiedades Mecánicas de Sólidos; Amigó, V., Ed.; Universidad Politécnica de Valencia: Gandia, Spain, 2002; pp. 385–390. [Google Scholar]
- Danniels, F.W.; Dunn, G.C. The effect of orientation on Knoop hardness on single crystals of zinc and silicon ferrite. Trans. Am. Soc. Met. 1949, 41, 419–442. [Google Scholar]
- Lim, Y.Y.; Chaudhri, M.M. The influence of grain size on the indentation hardness of high-purity copper and aluminium. Philos. Mag. A 2002, 82, 2071–2080. [Google Scholar] [CrossRef]
- Schmid, E.; Boas, W. Plasticity of Crystals, with Special Reference to Metals; Chapman & Hall: London, UK, 1968. [Google Scholar]
- Hosford, W.F. The Mechanics of Crystals and Textured Polycrystals; Oxford University Press: New York, NY, USA, 1993. [Google Scholar]
- Houtte, V. Some Recent Developments in the Theories for Deformation Texture Prediction; Netherlands Soc for Materials Science: Zwijndrecht, The Netherlands, 1984; pp. 7–23. [Google Scholar]
- Noble, F.W.; Hull, D. Deformation of single crystals of iron 3% Silicon. Philos. Mag. 1965, 12, 777–796. [Google Scholar] [CrossRef]
- Busby, J.T.; Hash, M.C.; Was, G.S. The relationship between hardness and yield stress in irradiated austenitic and ferritic steels. J. Nucl. Mater. 2005, 336, 267–278. [Google Scholar] [CrossRef]
- Higgy, H.R.; Hammad, F.H. Effect of fast-neutron irradiation on mechanical-properties of stainless-steels—aisi types 304, 316 and 347. J. Nucl. Mater. 1975, 55, 177–186. [Google Scholar] [CrossRef]
- Lai, M.O.; Lim, K.B. On the prediction of tensile properties from hardness tests. J. Mater. Sci. 1991, 26, 2031–2036. [Google Scholar] [CrossRef]
- Pavlina, E.J.; Van Tyne, C.J. Correlation of yield strength and tensile strength with hardness for steels. J. Mater. Eng. Perform. 2008, 17, 888–893. [Google Scholar] [CrossRef]
- Ishlinsky, A.J. Some applications of statistics in describing deformation laws. Acad. Sci. USSR 1944, 45, 179–180. [Google Scholar]
- British, S.I. Fracture Mechanics Toughness Tests Part 2: Method for Determination of KIc, Critical CTOD and Critical J Values of Welds in Metallic Materials; British Standard Institution: London, UK, 1997; Volume BS 7448-2. [Google Scholar]
- Sohncke, L. Über die Cohäsion des Steinsalzes in krystallographisch verschiedenen Richtungen. Ann. Phys. Chem. 1869, 17, 177–200. [Google Scholar] [CrossRef]
- Hahn, G.T. The influence of microstructure on brittle-fracture toughness. Metall. Trans. A 1984, 15, 947–959. [Google Scholar] [CrossRef]
- McMahon, C.J.; Cohen, M. Initiation of cleavage in polycrystalline iron. Acta Metall. 1965, 13, 591. [Google Scholar] [CrossRef]
- Rodriguez-Ibabe, J.M. The role of microstructure in toughness behaviour of microalloyed steels. In Proceedings of the International Conference on Microalloying in Steels; RodriguezIbabe, J.M., Gutierrez, I., Lopez, B., Eds.; Trans Tech Publications Ltd.: Zuerich, Switzerland, 1998; Volume 284, pp. 51–62. [Google Scholar]
- Griffith, A.A., VI. The phenomena of rupture and flow in solids. In Philosophical Transactions of the Royal Society of London. Series A, Containing Papers of a Mathematical or Physical Character; Royal Society: London, UK, 1921; Volume 221, pp. 163–198. [Google Scholar]
- Irwin, G.R. Fracture. In Elasticity and Plasticity/Elastizität und Plastizität; Flügge, S., Ed.; Springer: Berlin/Heidelberg, Germany, 1958; pp. 551–590. [Google Scholar] [CrossRef]
- Tada, H.; Paris, P.C.; Irwin, G.R. The Stress Analysis of Cracks Handbook; Paris Productions & (Del Research Corp.): Saint Louis, MO, USA, 1985. [Google Scholar]
- Bilby, B.A.; Cardew, G.E.; Howard, I.C. Stress intensity factors at the tips of kinked and forked cracks. In Analysis and Mechanics; Taplin, D.M.R., Ed.; Pergamon: Oxford, UK, 1978; pp. 197–200. [Google Scholar] [CrossRef]
- Cotterell, B.; Rice, J. Slightly curved or kinked cracks. Int. J. Fract. 1980, 16, 155–169. [Google Scholar] [CrossRef]
- Baczynski, G.J.; Jonas, J.J.; Collins, L.E. The influence of rolling practice on notch toughness and texture development in high-strength linepipe. Metall. Mater. Trans. A 1999, 30, 3045–3054. [Google Scholar] [CrossRef]
- Ju, J.B.; Lee, J.S.; Jang, J.I. Fracture toughness anisotropy in a API steel line-pipe. Mater. Lett. 2007, 61, 5178–5180. [Google Scholar] [CrossRef]


| C | Si | Mn | P | S | Cr | Al | Ti | Co | Ni | Cu | O | Y | N | H (ppm) |
|---|---|---|---|---|---|---|---|---|---|---|---|---|---|---|
| 0.01 | 0.12 | 0.10 | 0.01 | 0.01 | 19.30 | 4.70 | 0.44 | 0.07 | 0.10 | 0.02 | 0.11 | 0.38 | 0.02 | 11.00 |
| Condition | Imax (ODF) | ||
|---|---|---|---|
| <100> | <110> | <111> | |
| Random | 2.1 | 2.2 | 1.8 |
| <100> | 8.2 | 0.5 | 0.8 |
| <110> | 1.1 | 9.1 | 1.5 |
| <111> | 4.2 | 2.4 | 7.8 |
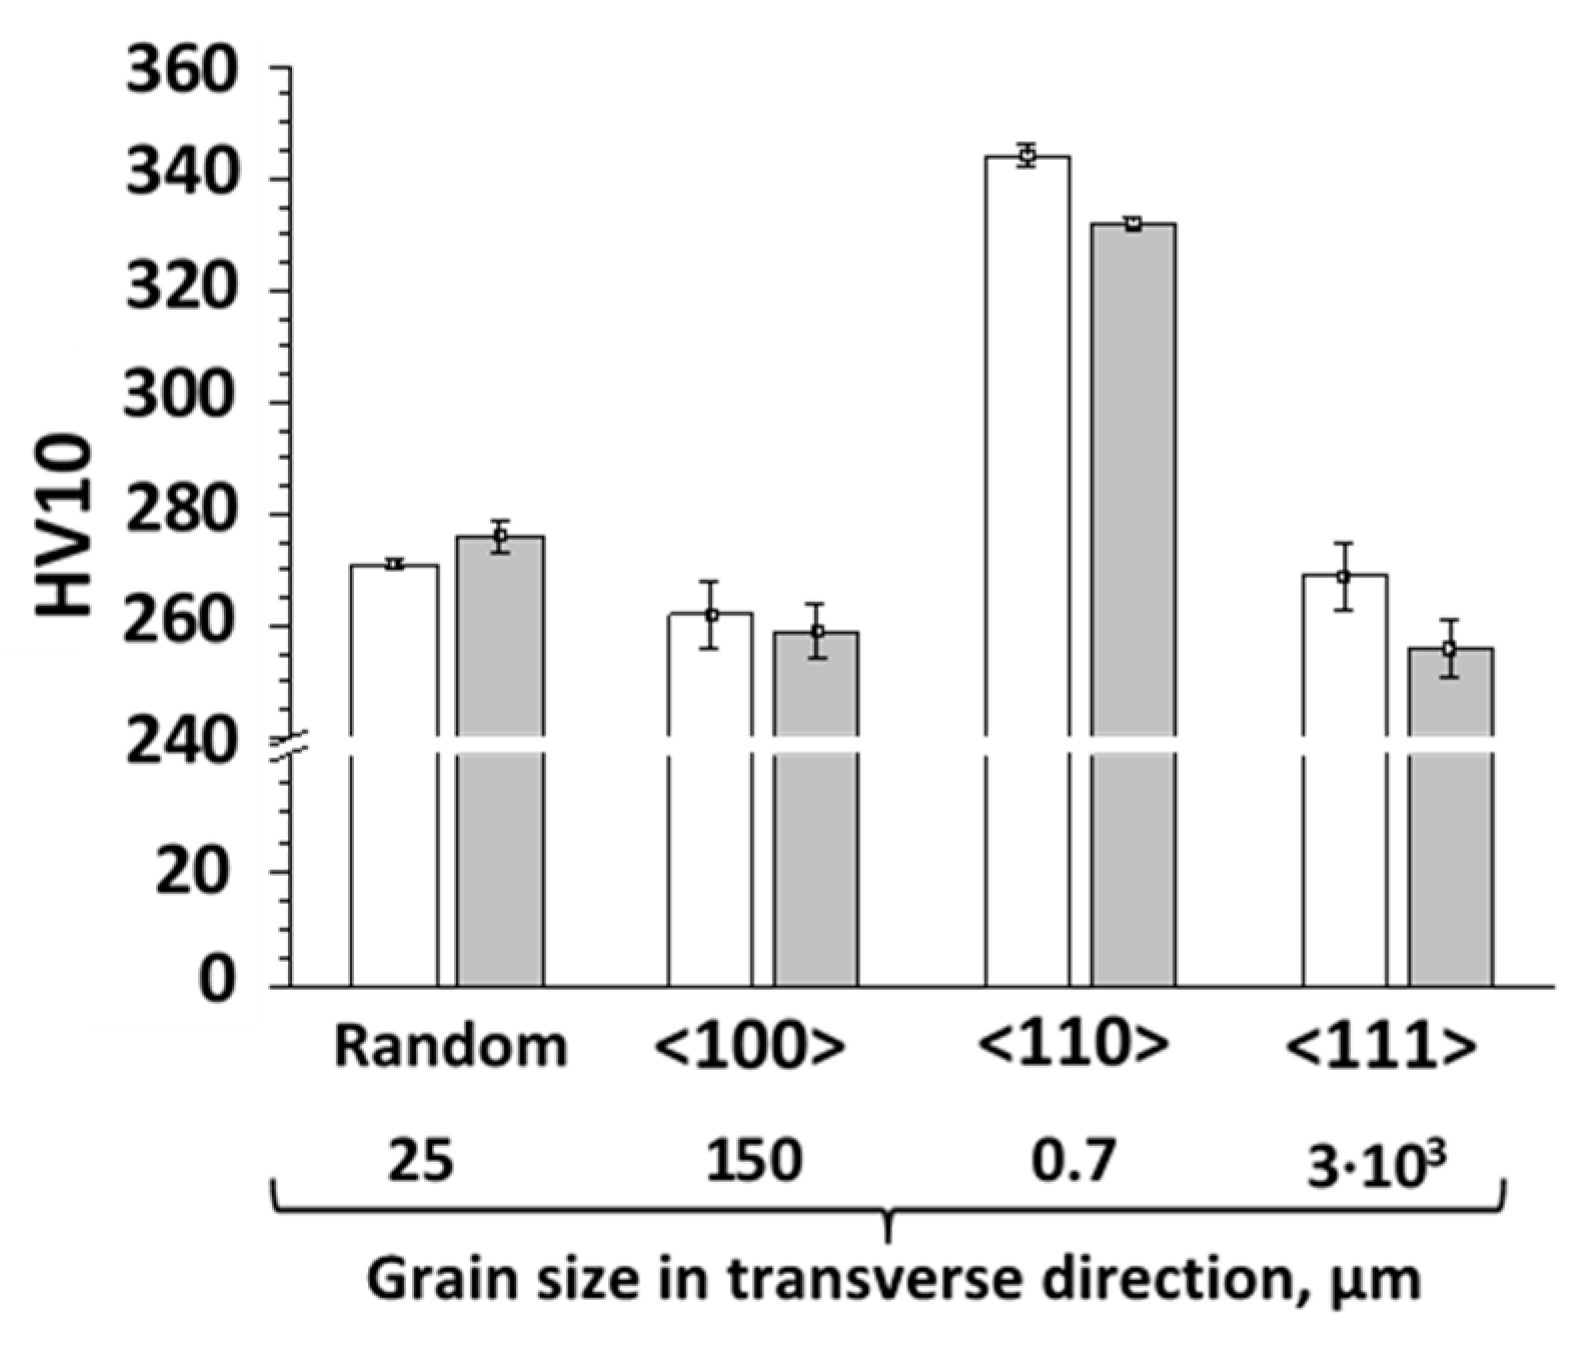
| Condition | Sample Orientation | Grain Size, µm | Vickers Hardness | Knoop Hardness | ||
|---|---|---|---|---|---|---|
| Mean | SD * | Mean | SD * | |||
| Random | T | 25 | 271 | 1 | 247 | 37 |
| L | 276 | 3 | 247 | 28 | ||
| <100> | T | 150 | 262 | 6 | 235 | 29 |
| L | 259 | 5 | 245 | 26 | ||
| <110> | T | 0.7 | 344 | 1 | 317 | 21 |
| L | 332 | 1 | 325 | 22 | ||
| <111> | T | 3 × 10³ | 269 | 6 | 246 | 37 |
| L | 256 | 5 | 247 | 42 | ||
| Condition | Tensile Properties | Taylor’s Factor | Impact Bending | ||||||
|---|---|---|---|---|---|---|---|---|---|
| T/°C | E/GPa | YS/MPa | UTS/MPa | ε/% | LSE/J | USE/J | DBTT/°C | ||
| Random | 20 | 200 | 648 | 804 | 8.7 | 2.7 | 2 | 24 | −20 |
| −196 | 1100 | 1160 | 3.0 | ||||||
| <100> | 20 | 160 | 636 | 732 | 26.2 | 2.4 | 2 | 42 | 8 |
| −196 | 1104 | 1104 | 0 | ||||||
| <110> | 20 | 185 | 790 | 970 | 25.8 | 2.5 | 2 | 35 | −70 |
| −196 | 1290 | 1455 | 25.2 | ||||||
| <111> | 20 | 290 | 810 | 816 | 7.8 | 3.2 | 2 | 33 | −40 |
| −196 | 1596 | 1596 | 0 | ||||||
| Condition | α, degrees | β, degrees | Experimental | Predicted | ||
|---|---|---|---|---|---|---|
| σF/MPa | σN/MPa | σfK/MPa | σfS/MPa | |||
| Random | - | - | 1160 | - | 1230 | 1230 |
| <100> | 0 | 0 | 1104 | 1104 | 1104 | 1104 |
| <110> | 45 | 45 | 1610 (*) | 2208 | 1388 | 1531 |
| <111> | 55 | 35 | 1596 | 3356 | 1886 | 2230 |
© 2020 by the authors. Licensee MDPI, Basel, Switzerland. This article is an open access article distributed under the terms and conditions of the Creative Commons Attribution (CC BY) license (http://creativecommons.org/licenses/by/4.0/).
Share and Cite
Chao, J.; Capdevila, C. The Influence of Texture on the Ductile-to-Brittle Transition Behavior in Fe20Cr4.5Al Oxide Dispersion Strengthened Alloy. Metals 2020, 10, 87. https://doi.org/10.3390/met10010087
Chao J, Capdevila C. The Influence of Texture on the Ductile-to-Brittle Transition Behavior in Fe20Cr4.5Al Oxide Dispersion Strengthened Alloy. Metals. 2020; 10(1):87. https://doi.org/10.3390/met10010087
Chicago/Turabian StyleChao, Jesus, and Carlos Capdevila. 2020. "The Influence of Texture on the Ductile-to-Brittle Transition Behavior in Fe20Cr4.5Al Oxide Dispersion Strengthened Alloy" Metals 10, no. 1: 87. https://doi.org/10.3390/met10010087
APA StyleChao, J., & Capdevila, C. (2020). The Influence of Texture on the Ductile-to-Brittle Transition Behavior in Fe20Cr4.5Al Oxide Dispersion Strengthened Alloy. Metals, 10(1), 87. https://doi.org/10.3390/met10010087