Comparison between Shot Peening, Cavitation Peening, and Laser Peening by Observation of Crack Initiation and Crack Growth in Stainless Steel

Abstract
1. Introduction
2. Experimental Apparatus and Procedure
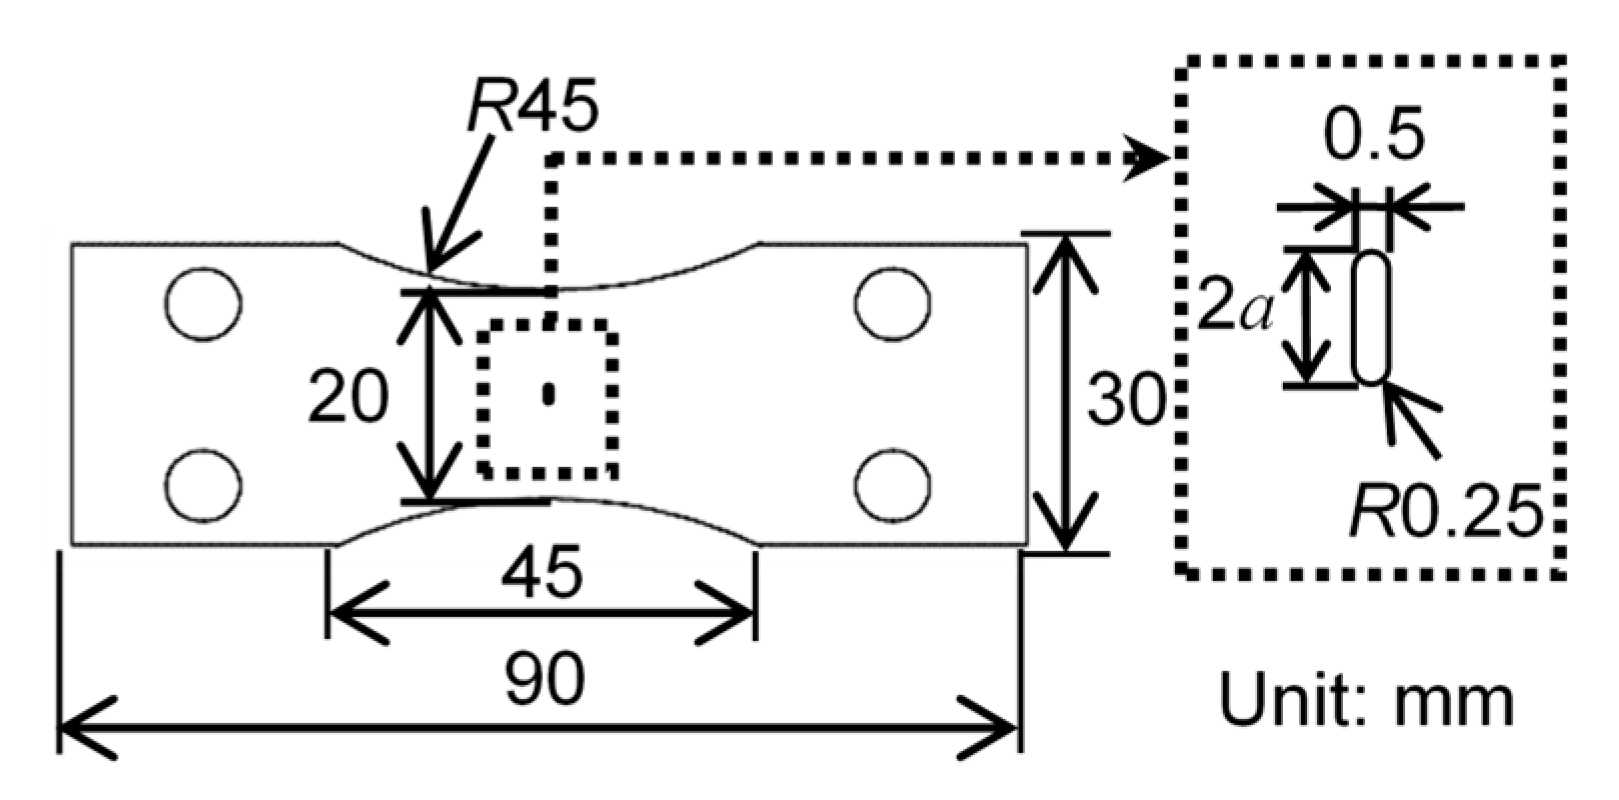
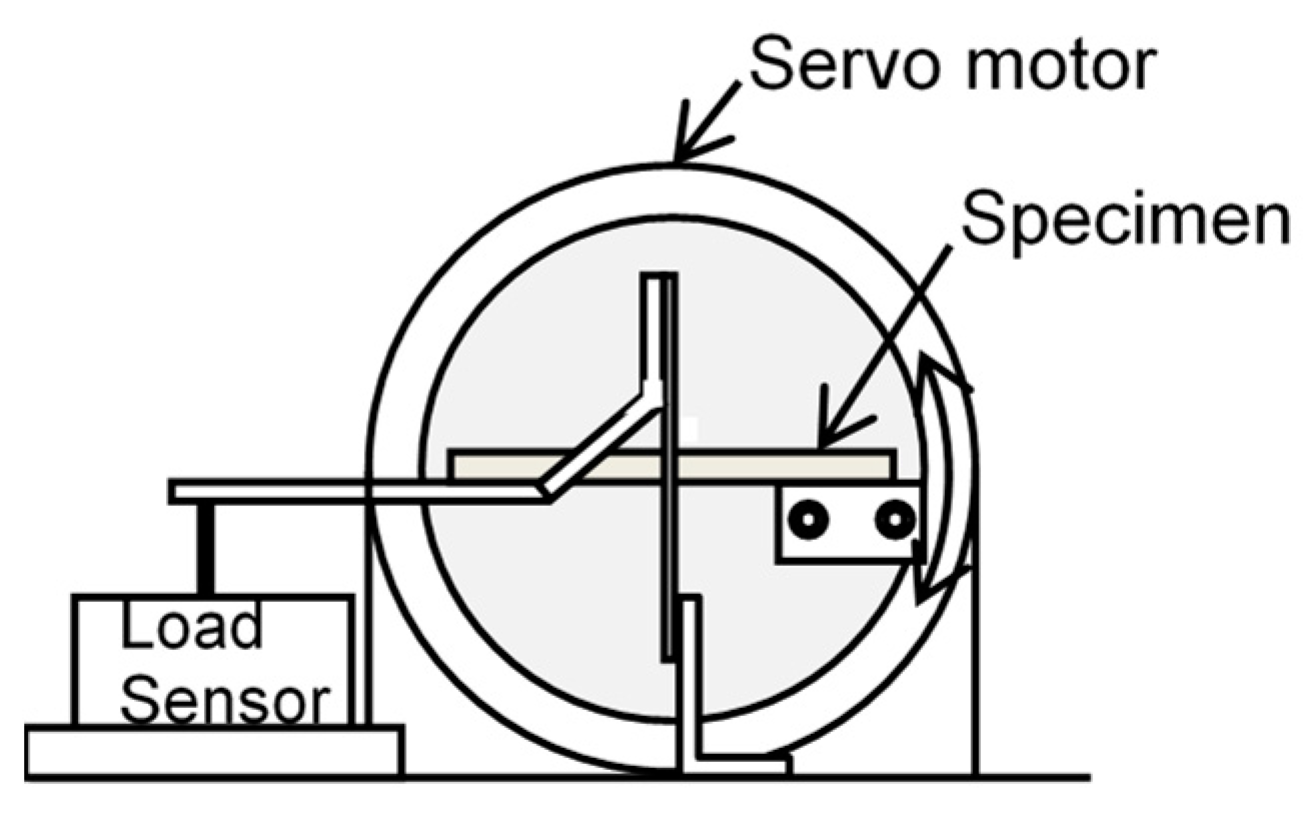
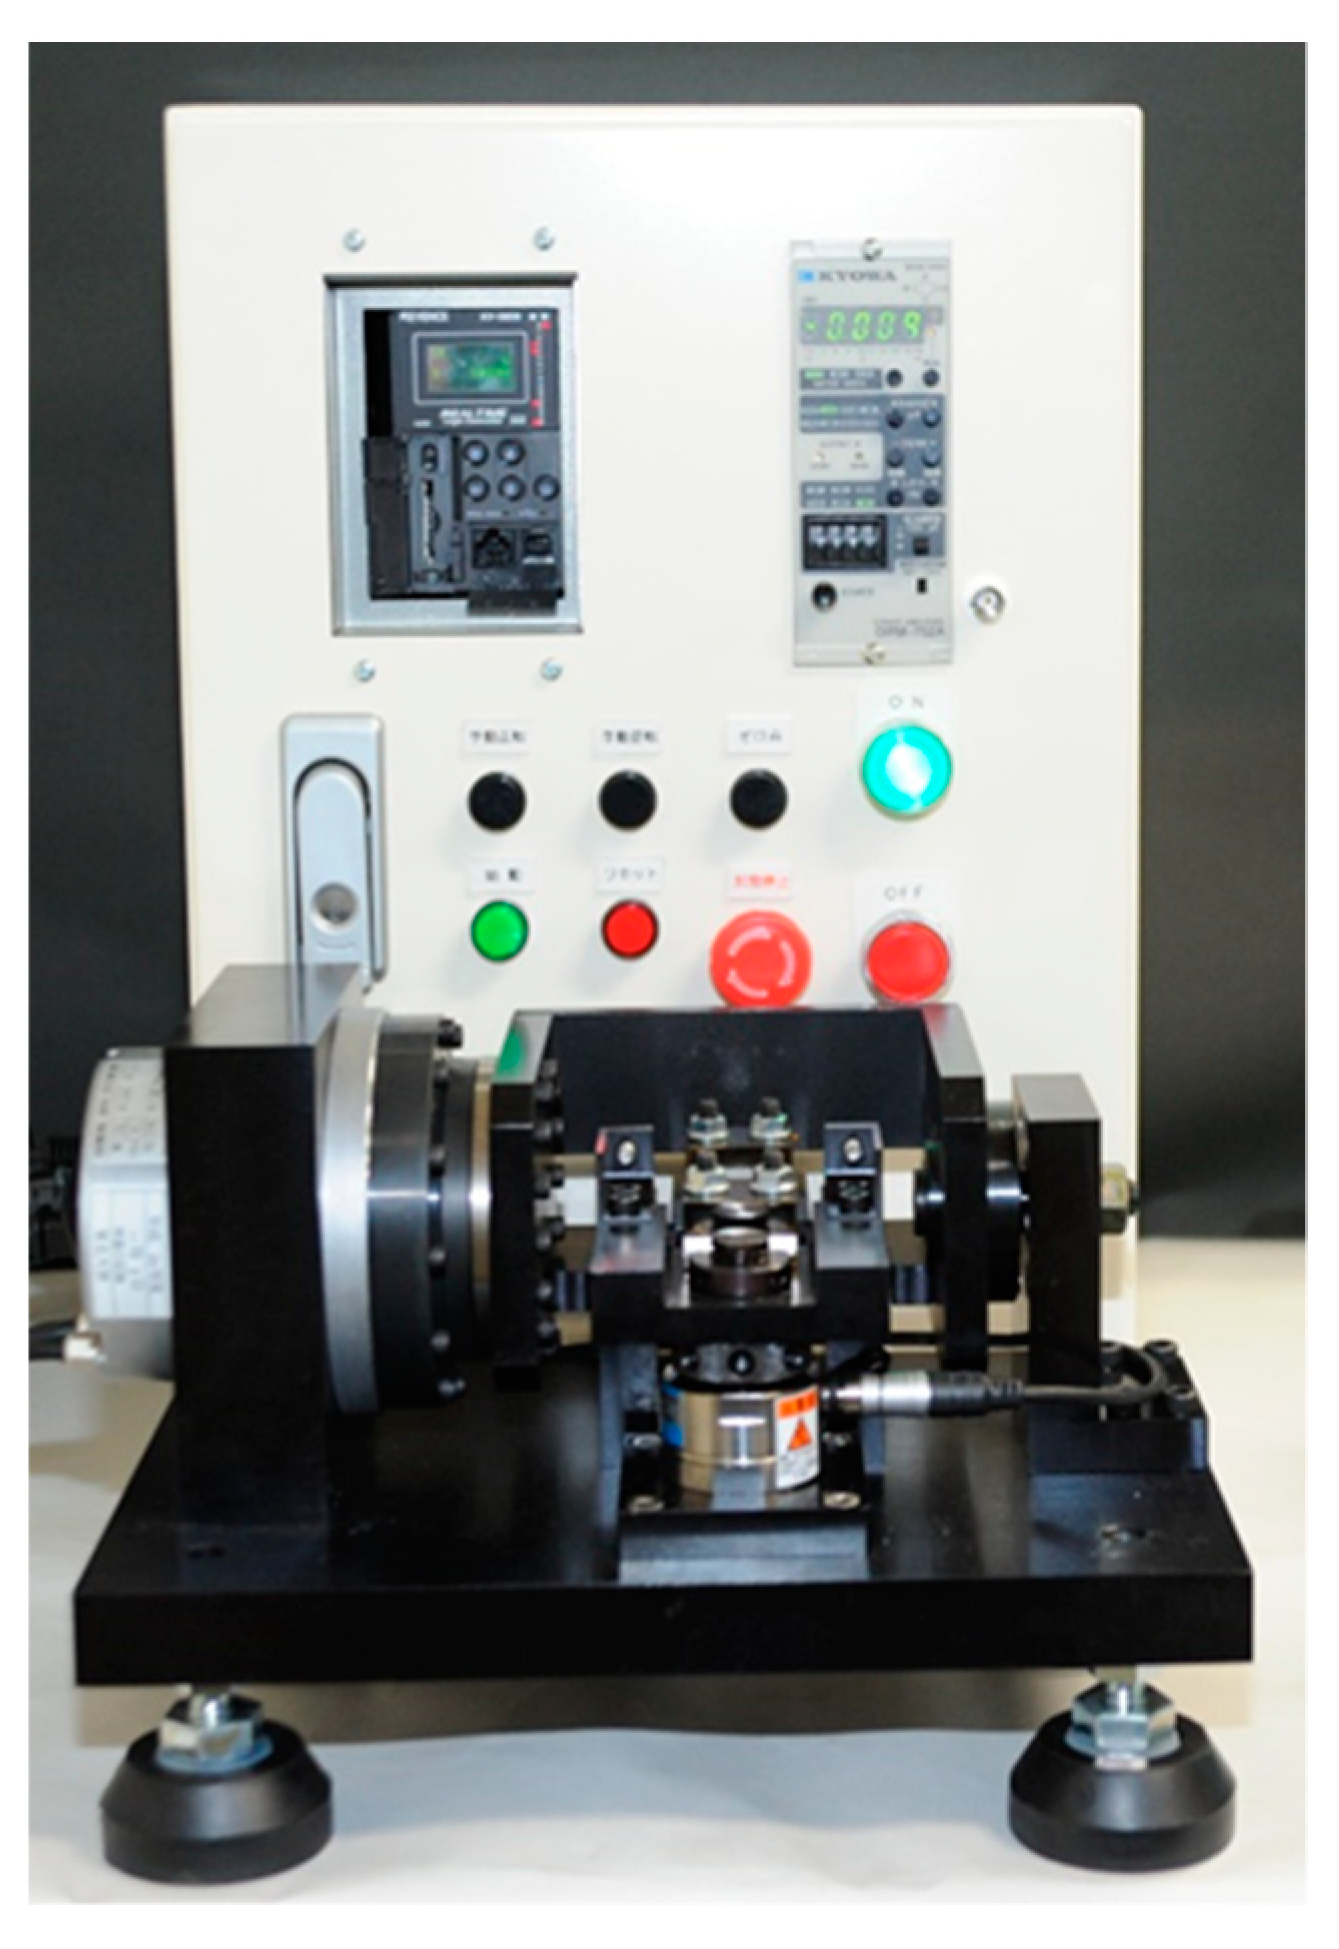
2.1. Crack Growth Test
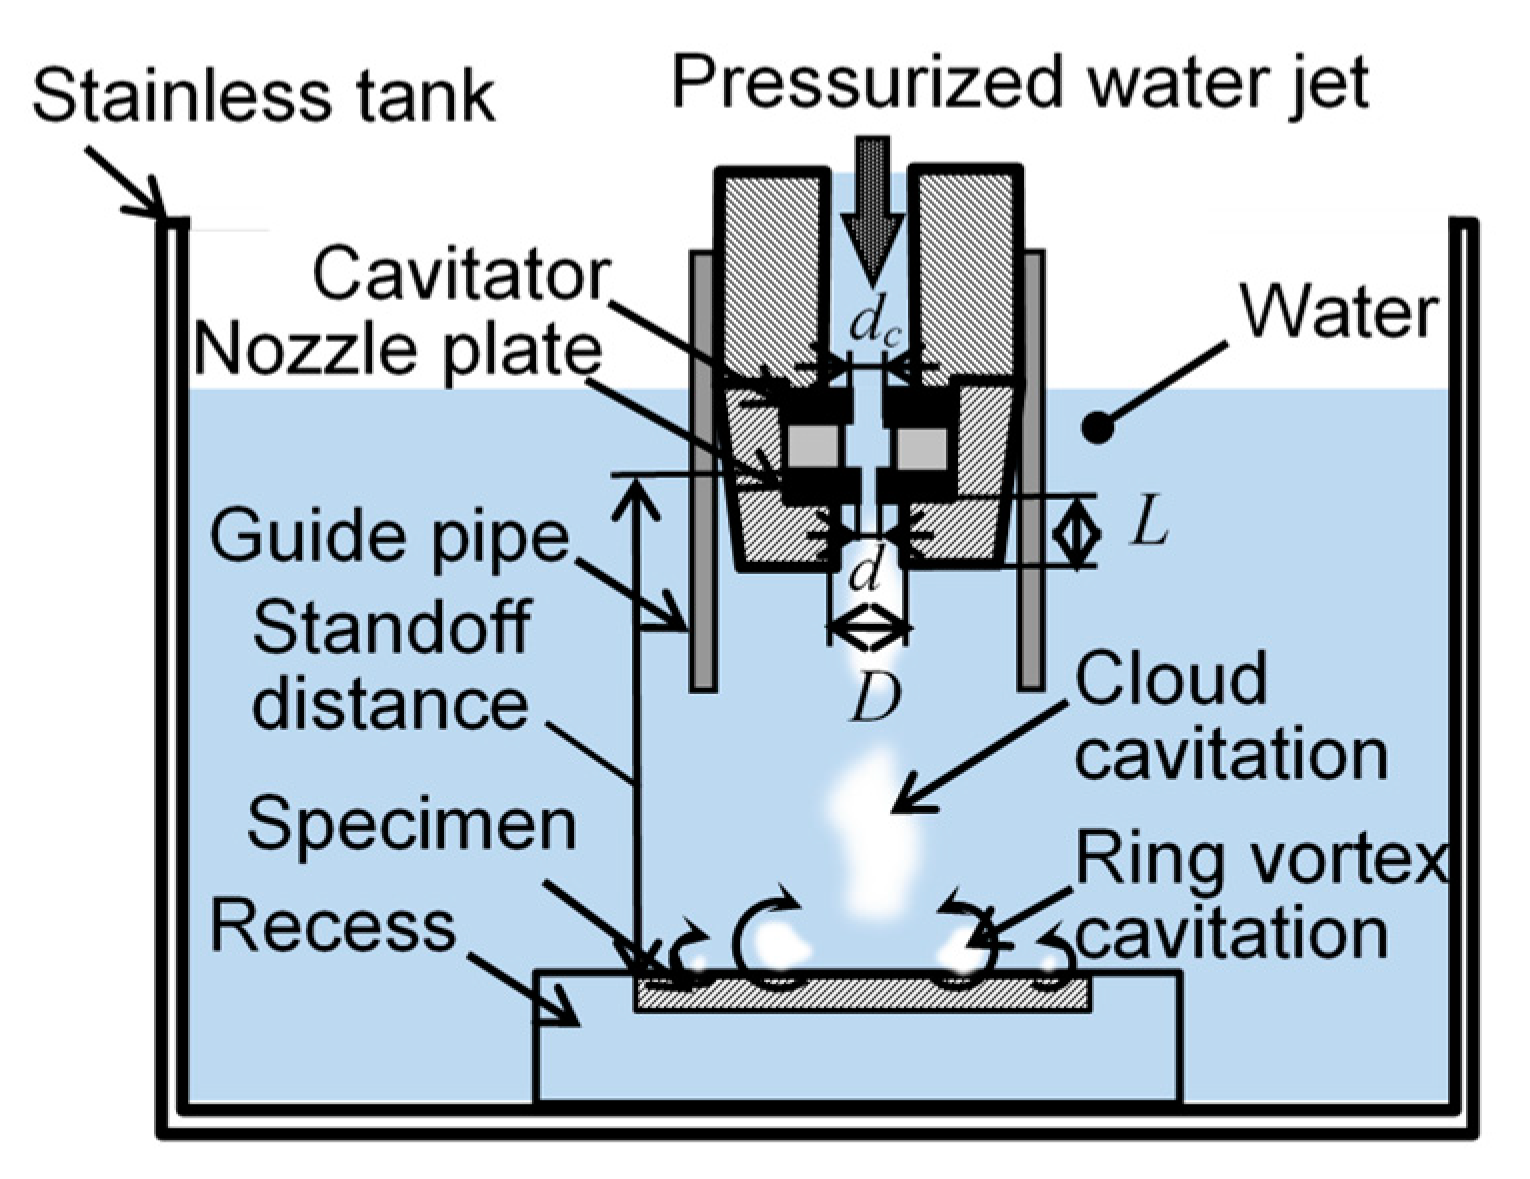
2.2. Submerged Water Jet System
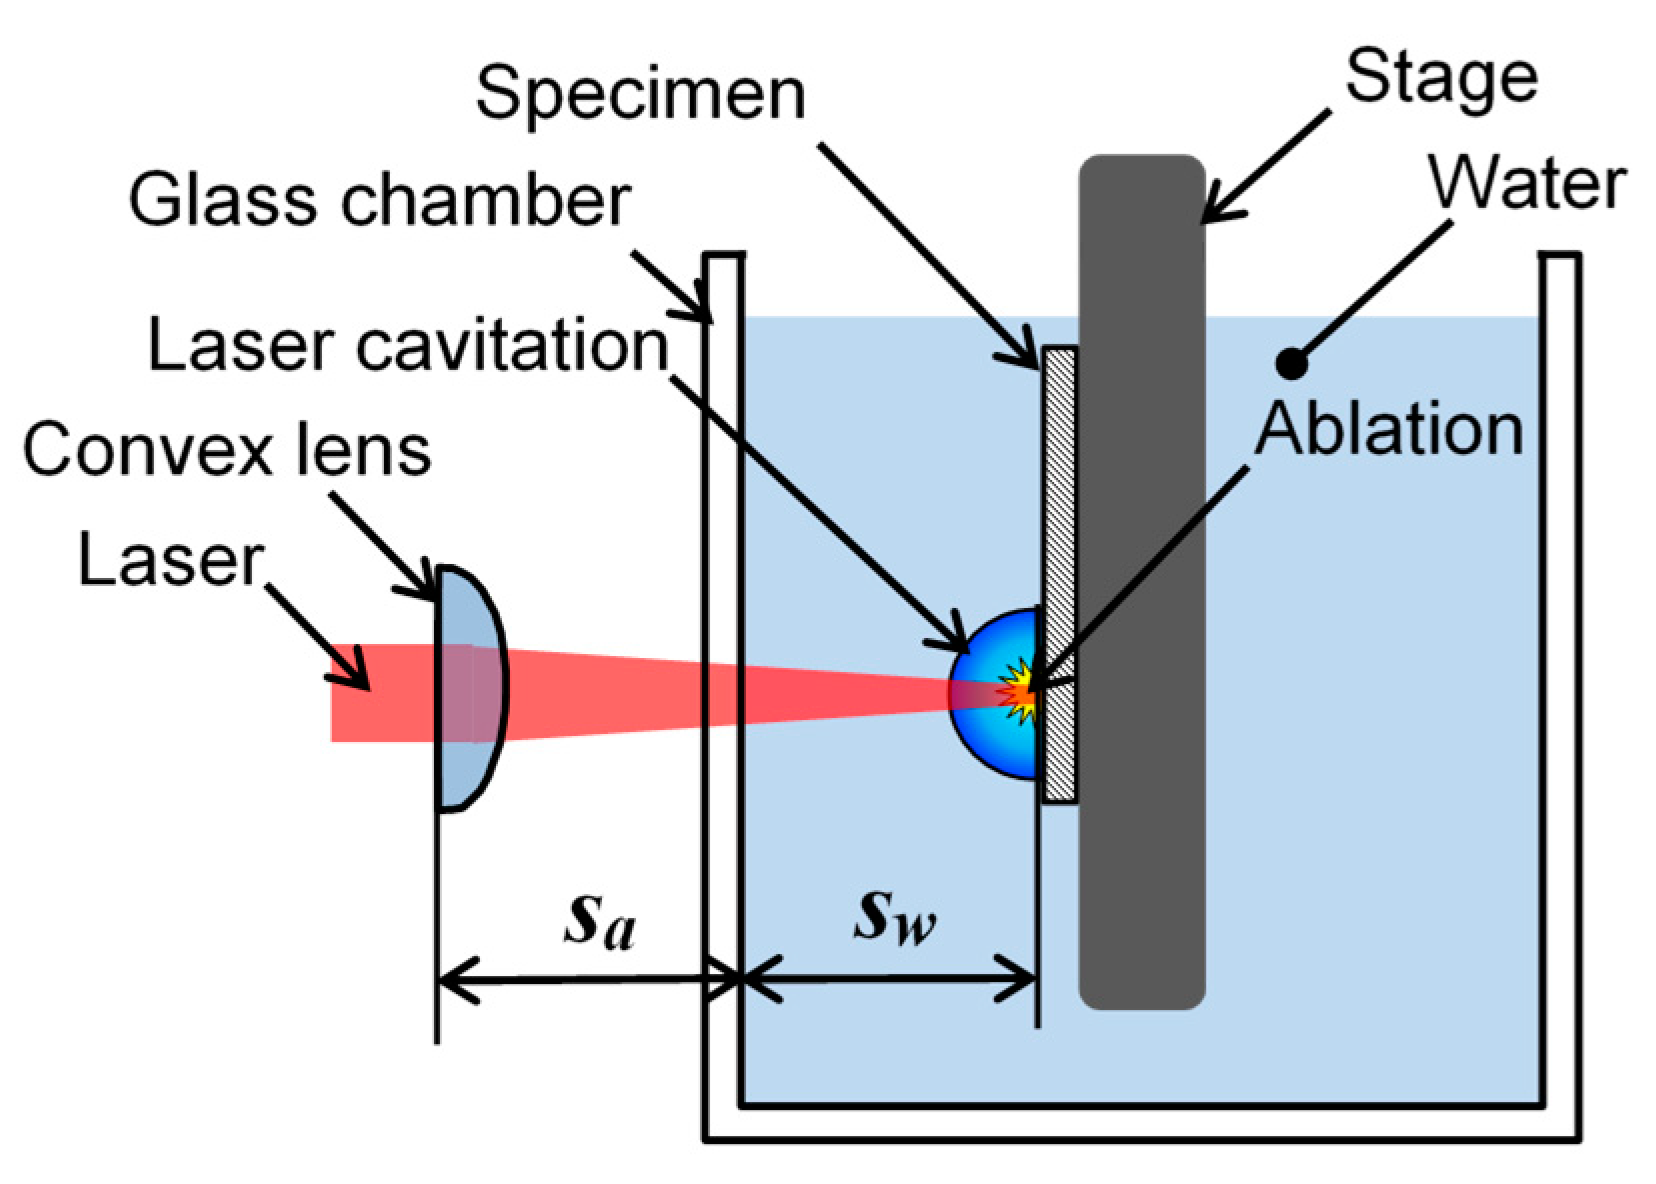
2.3. Submerged Pulse Laser System
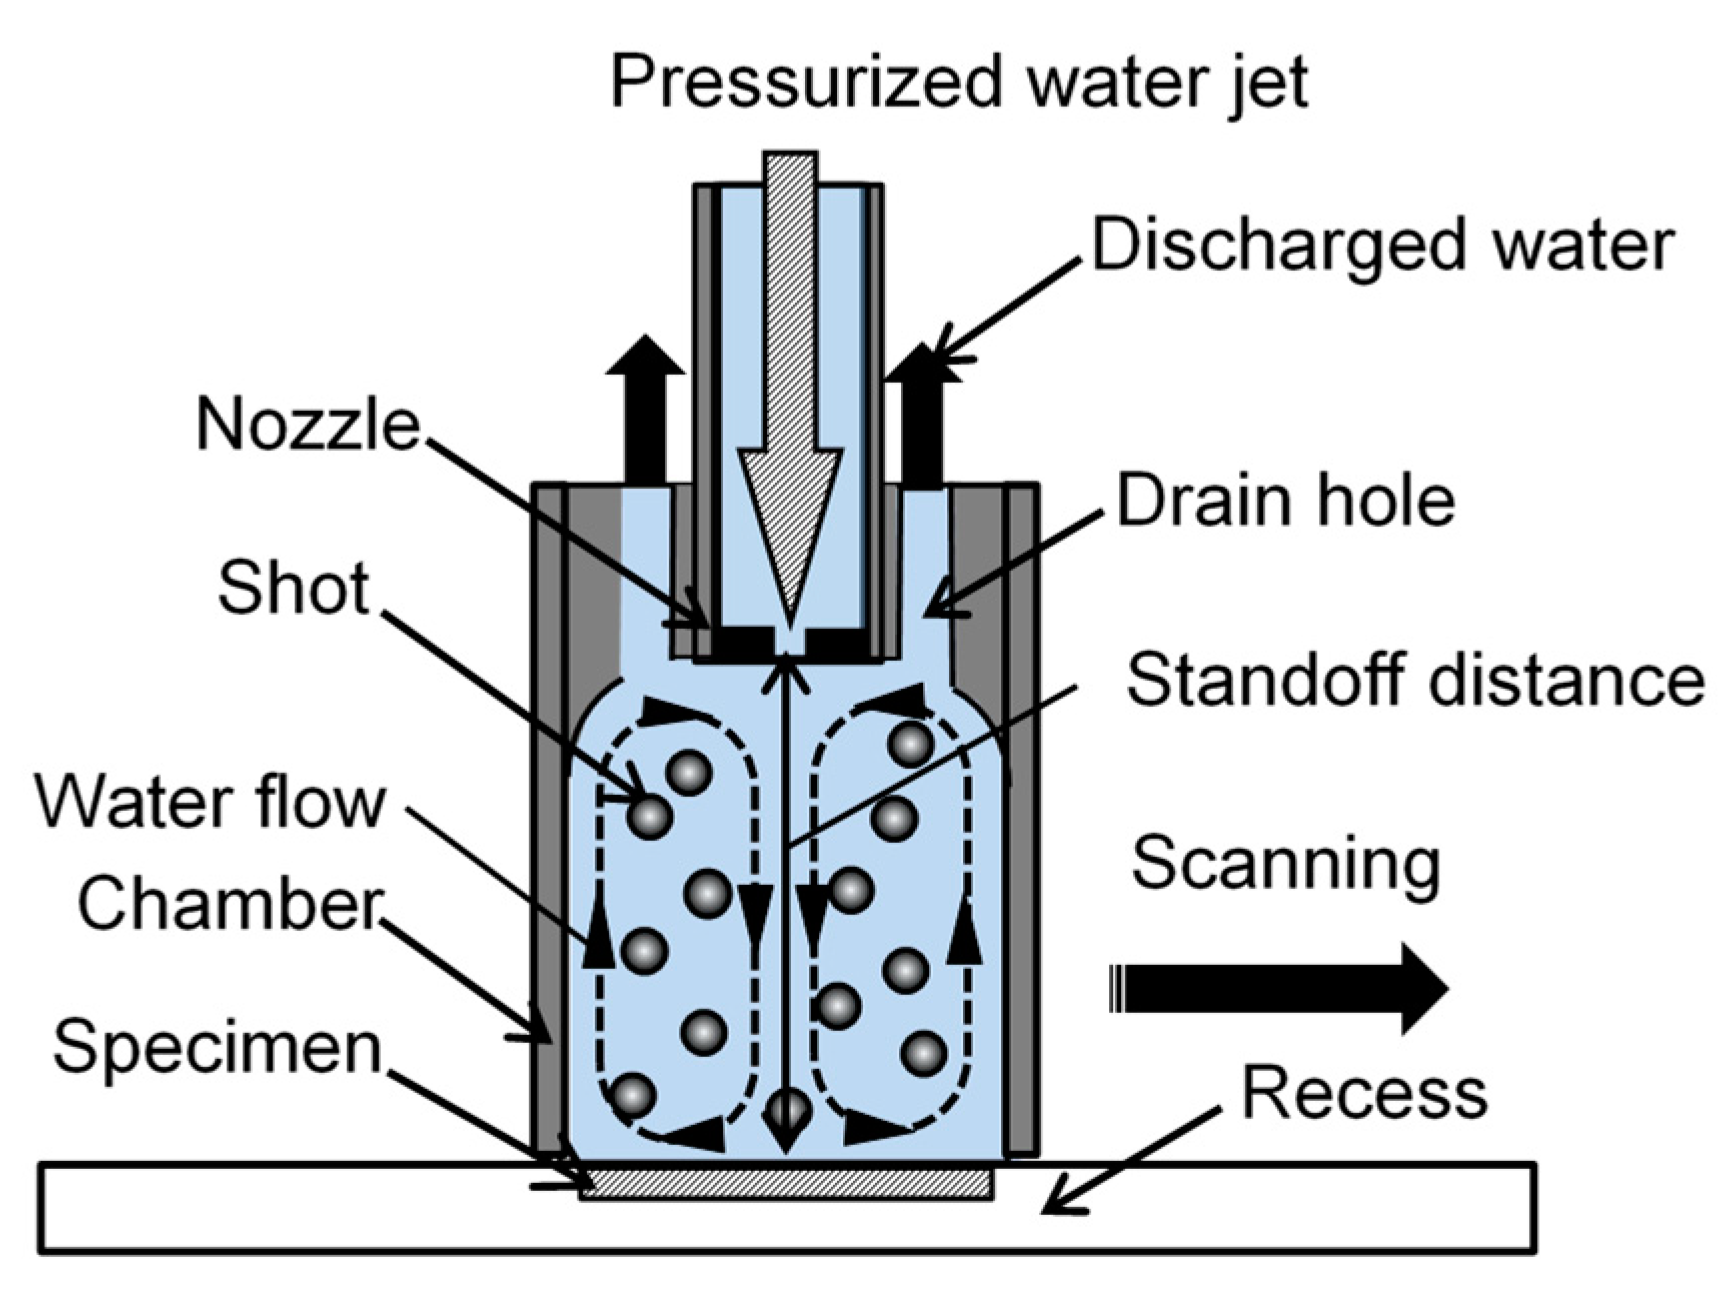
2.4. Recirculating Shot Peening Accelerated by Water Jet System
3. Results
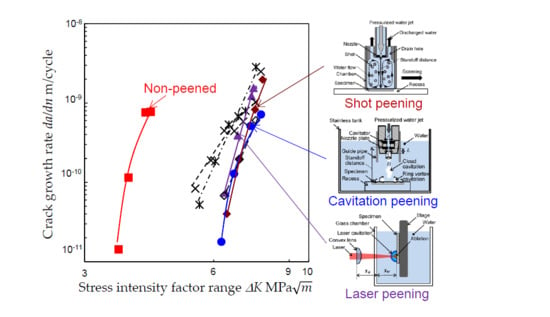
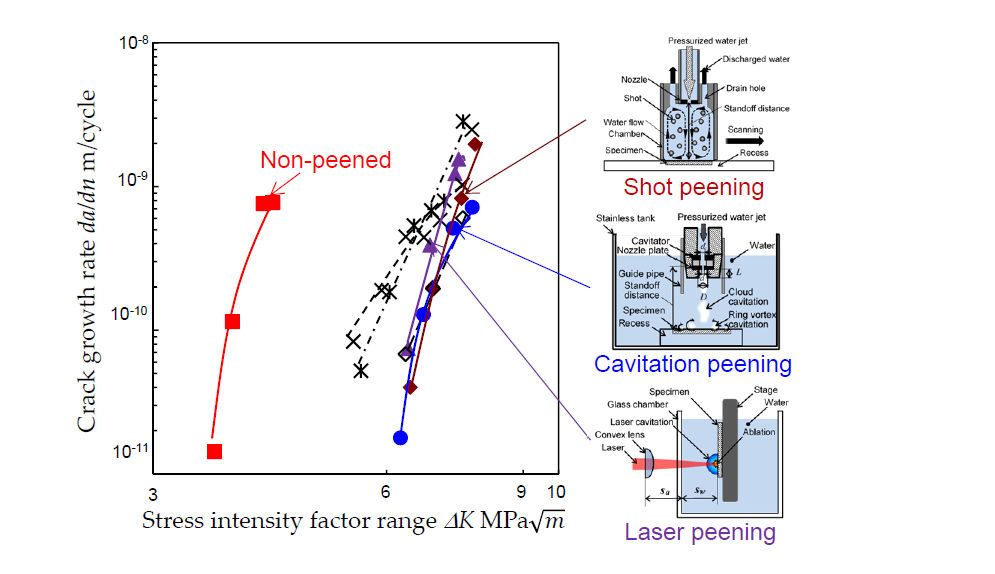
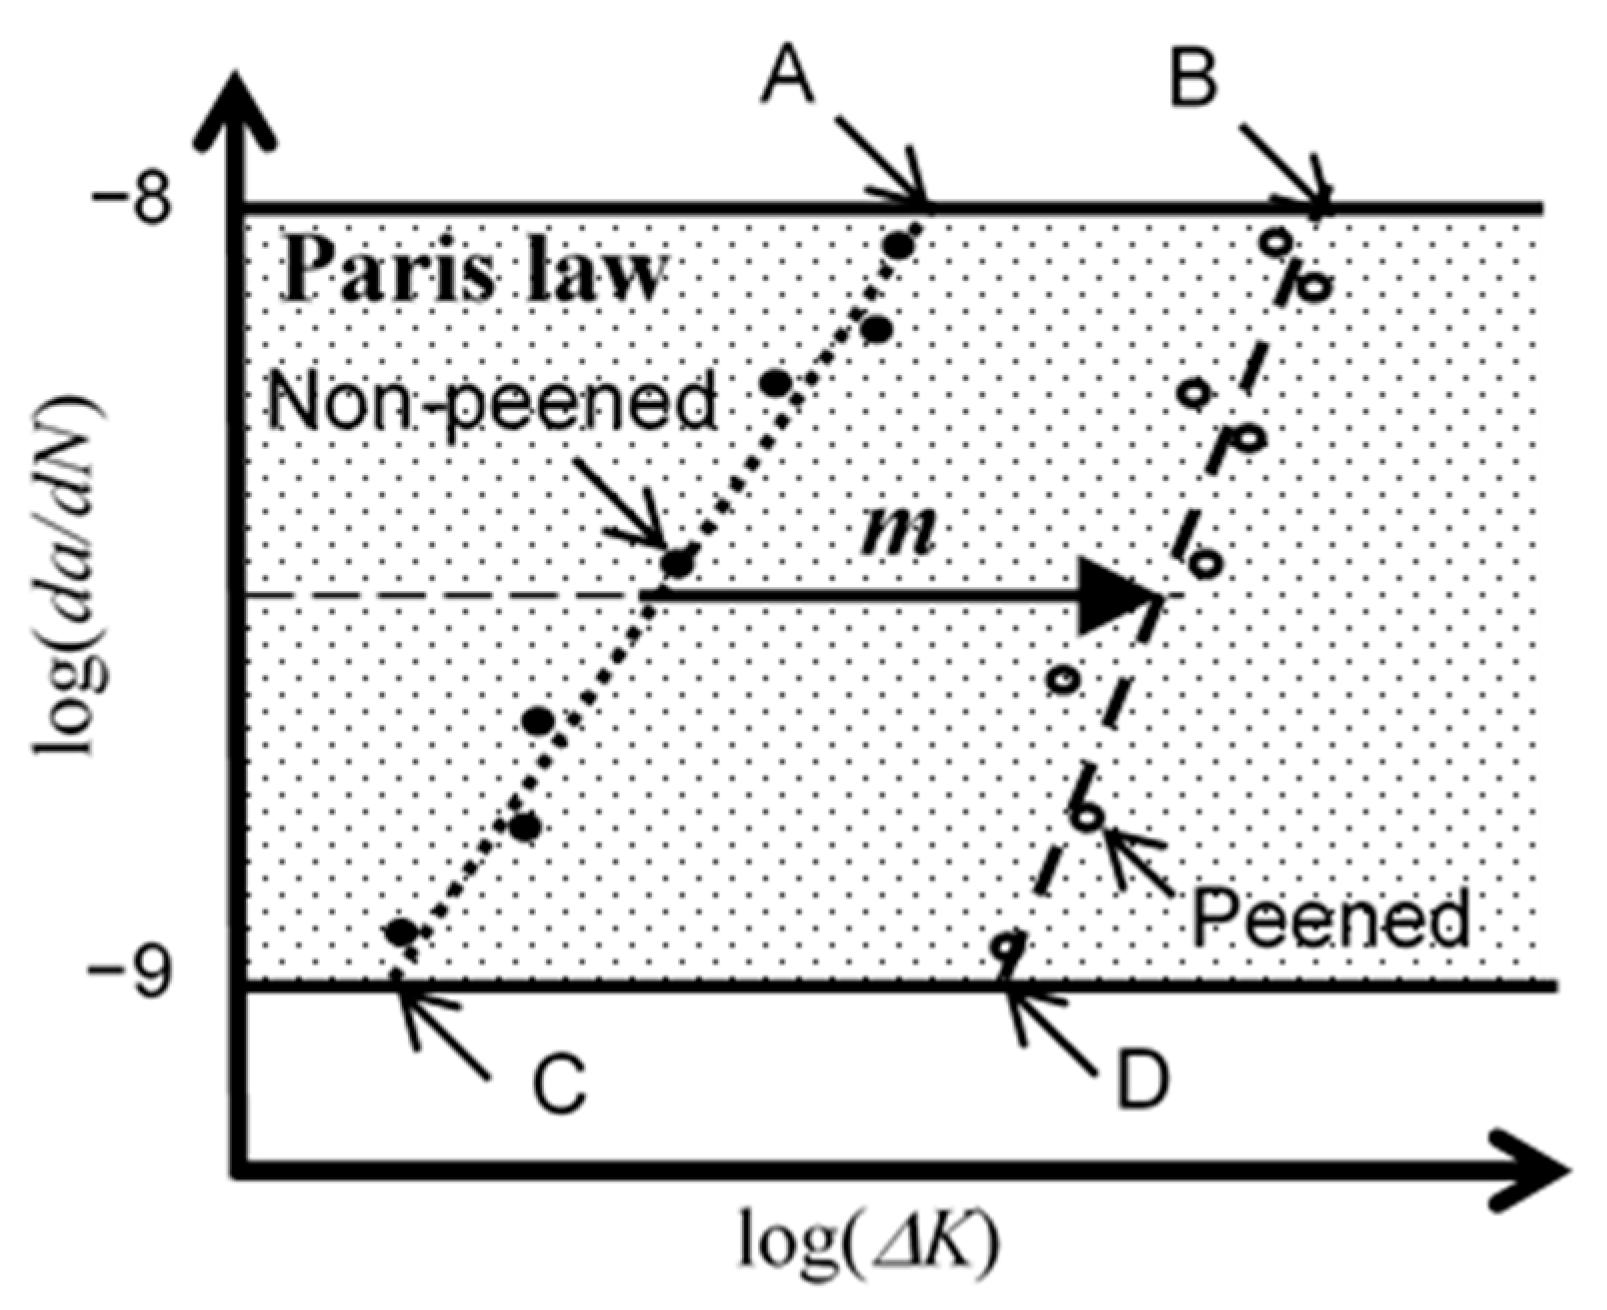
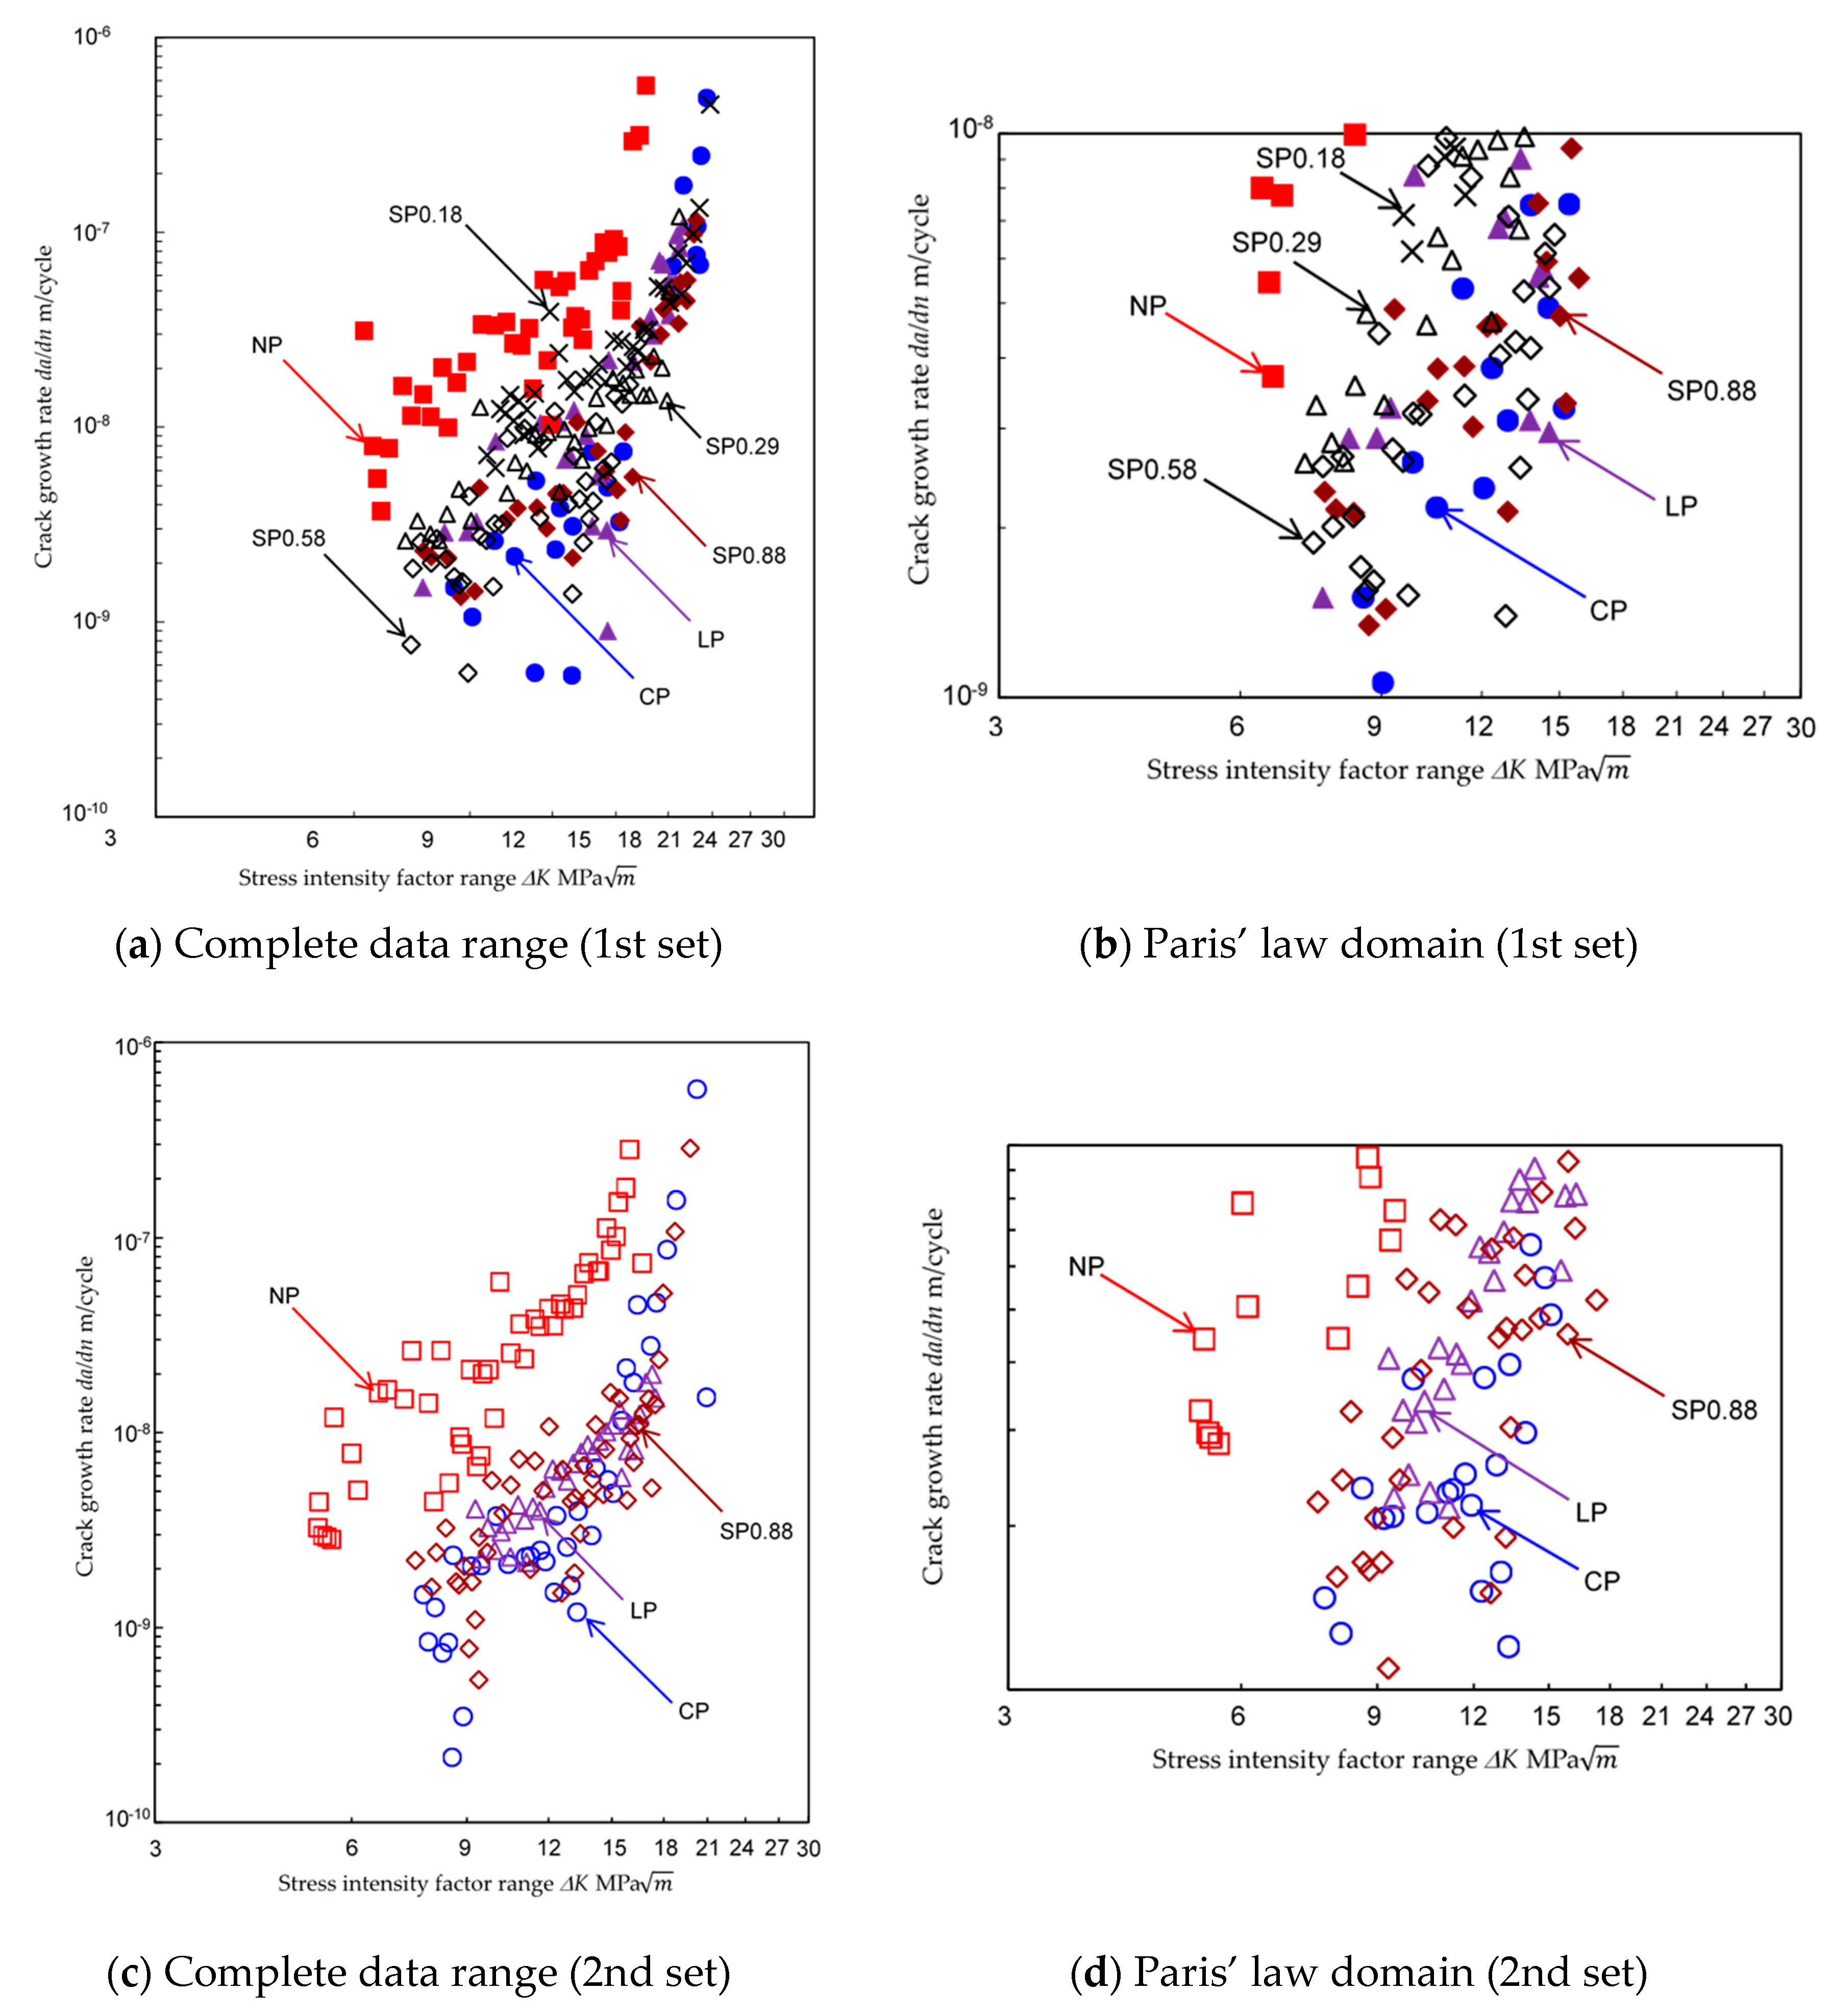
3.1. Improvement of ∆Kth and ∆(∆K) by Peening
3.2. Effect of the Mechanical Properties on ∆Kth and ∆(∆K)
4. Discussions
5. Conclusions
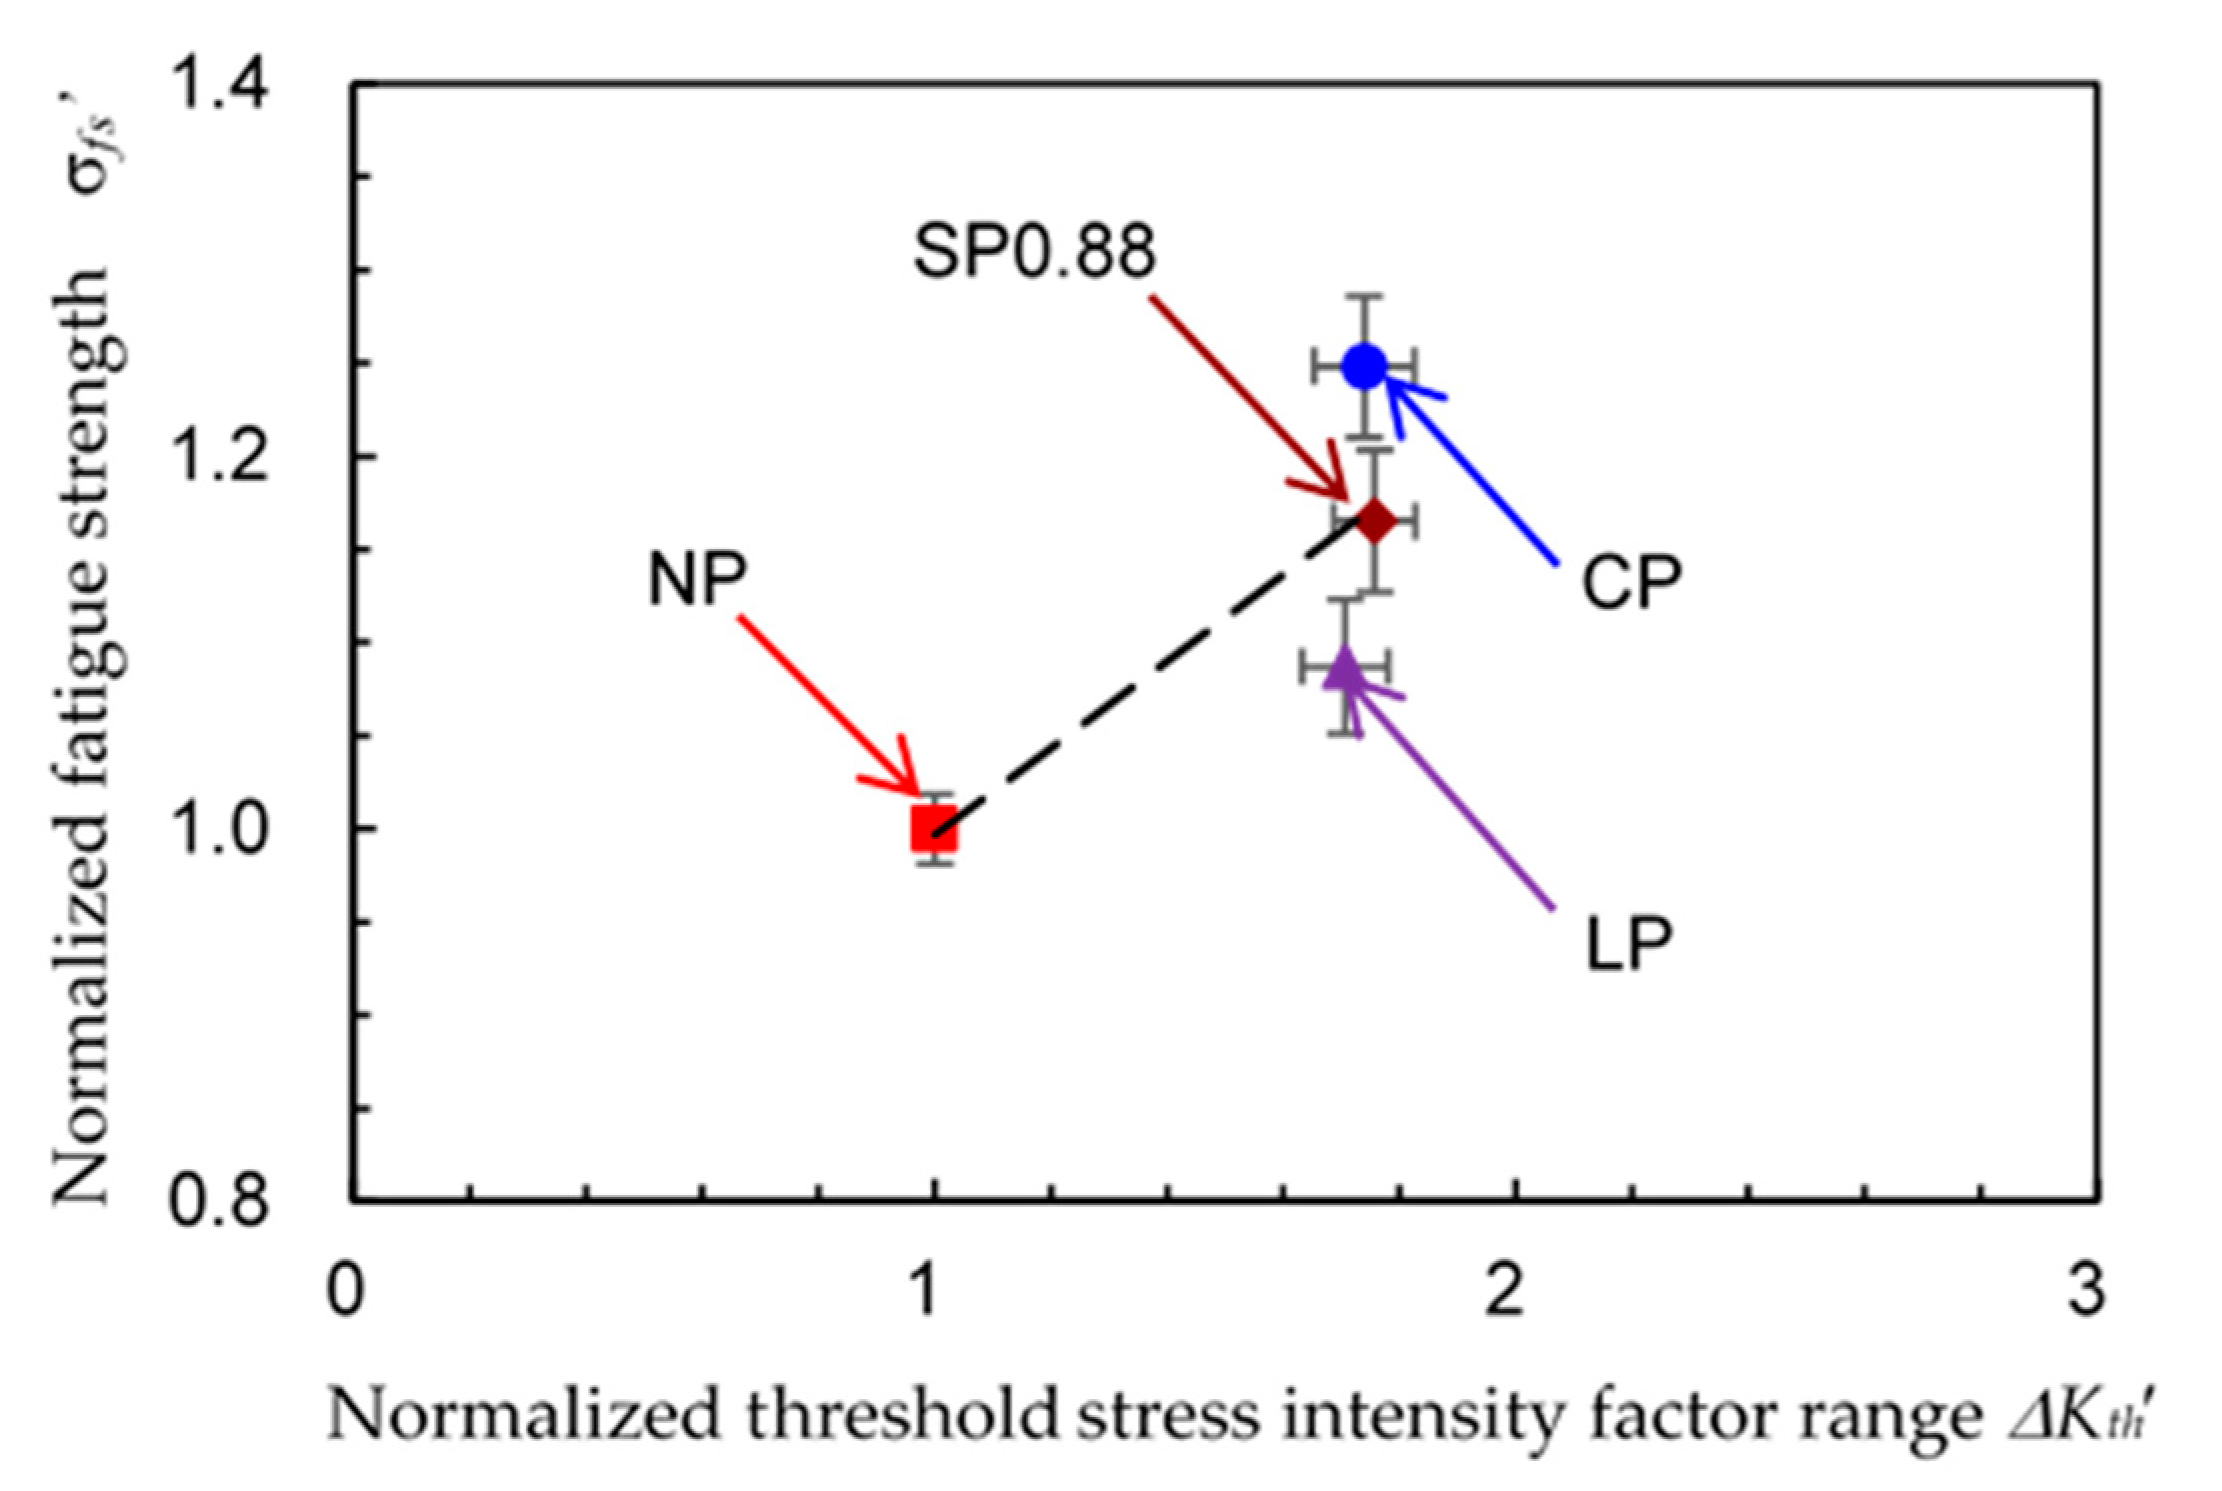
- (1)
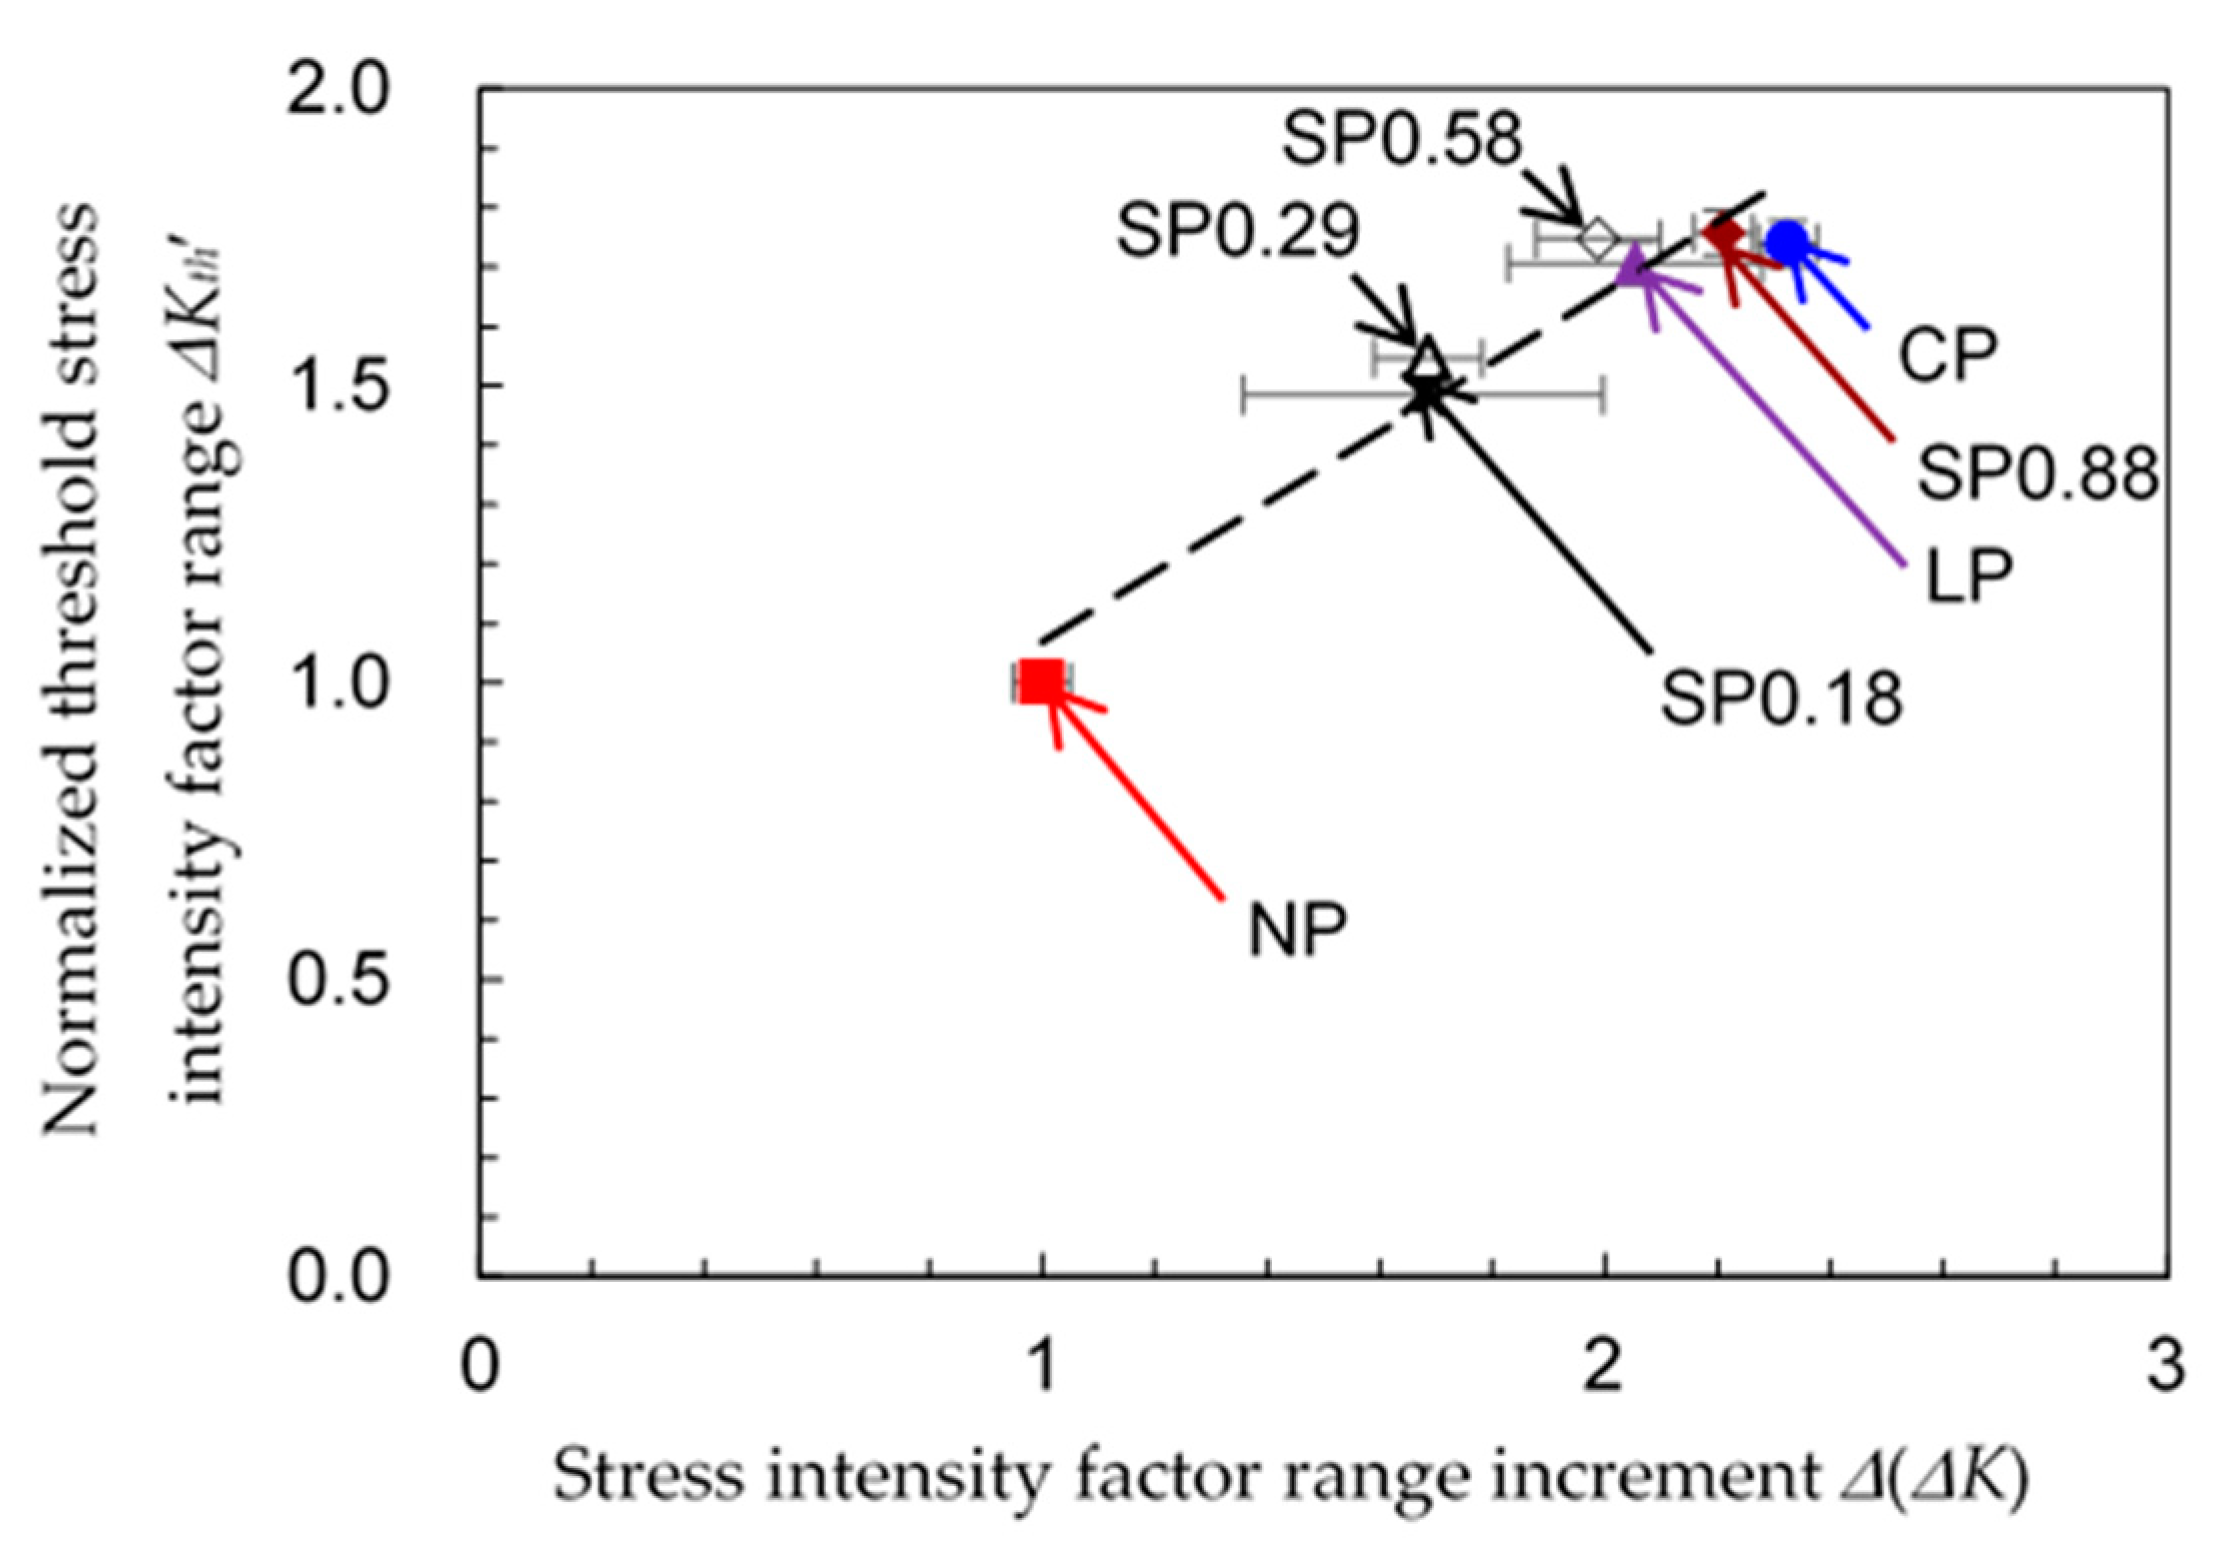
- The values of ∆Kth’ and ∆(∆K) are roughly in a linear relationship, even though the specimens were treated using different peening methods. Please note that ∆Kth’ is ∆Kth normalized by non-peened one. The reduction in crack growth after cavitation peening is larger than that after the other peening methods at equivalent values of ∆Kth’.
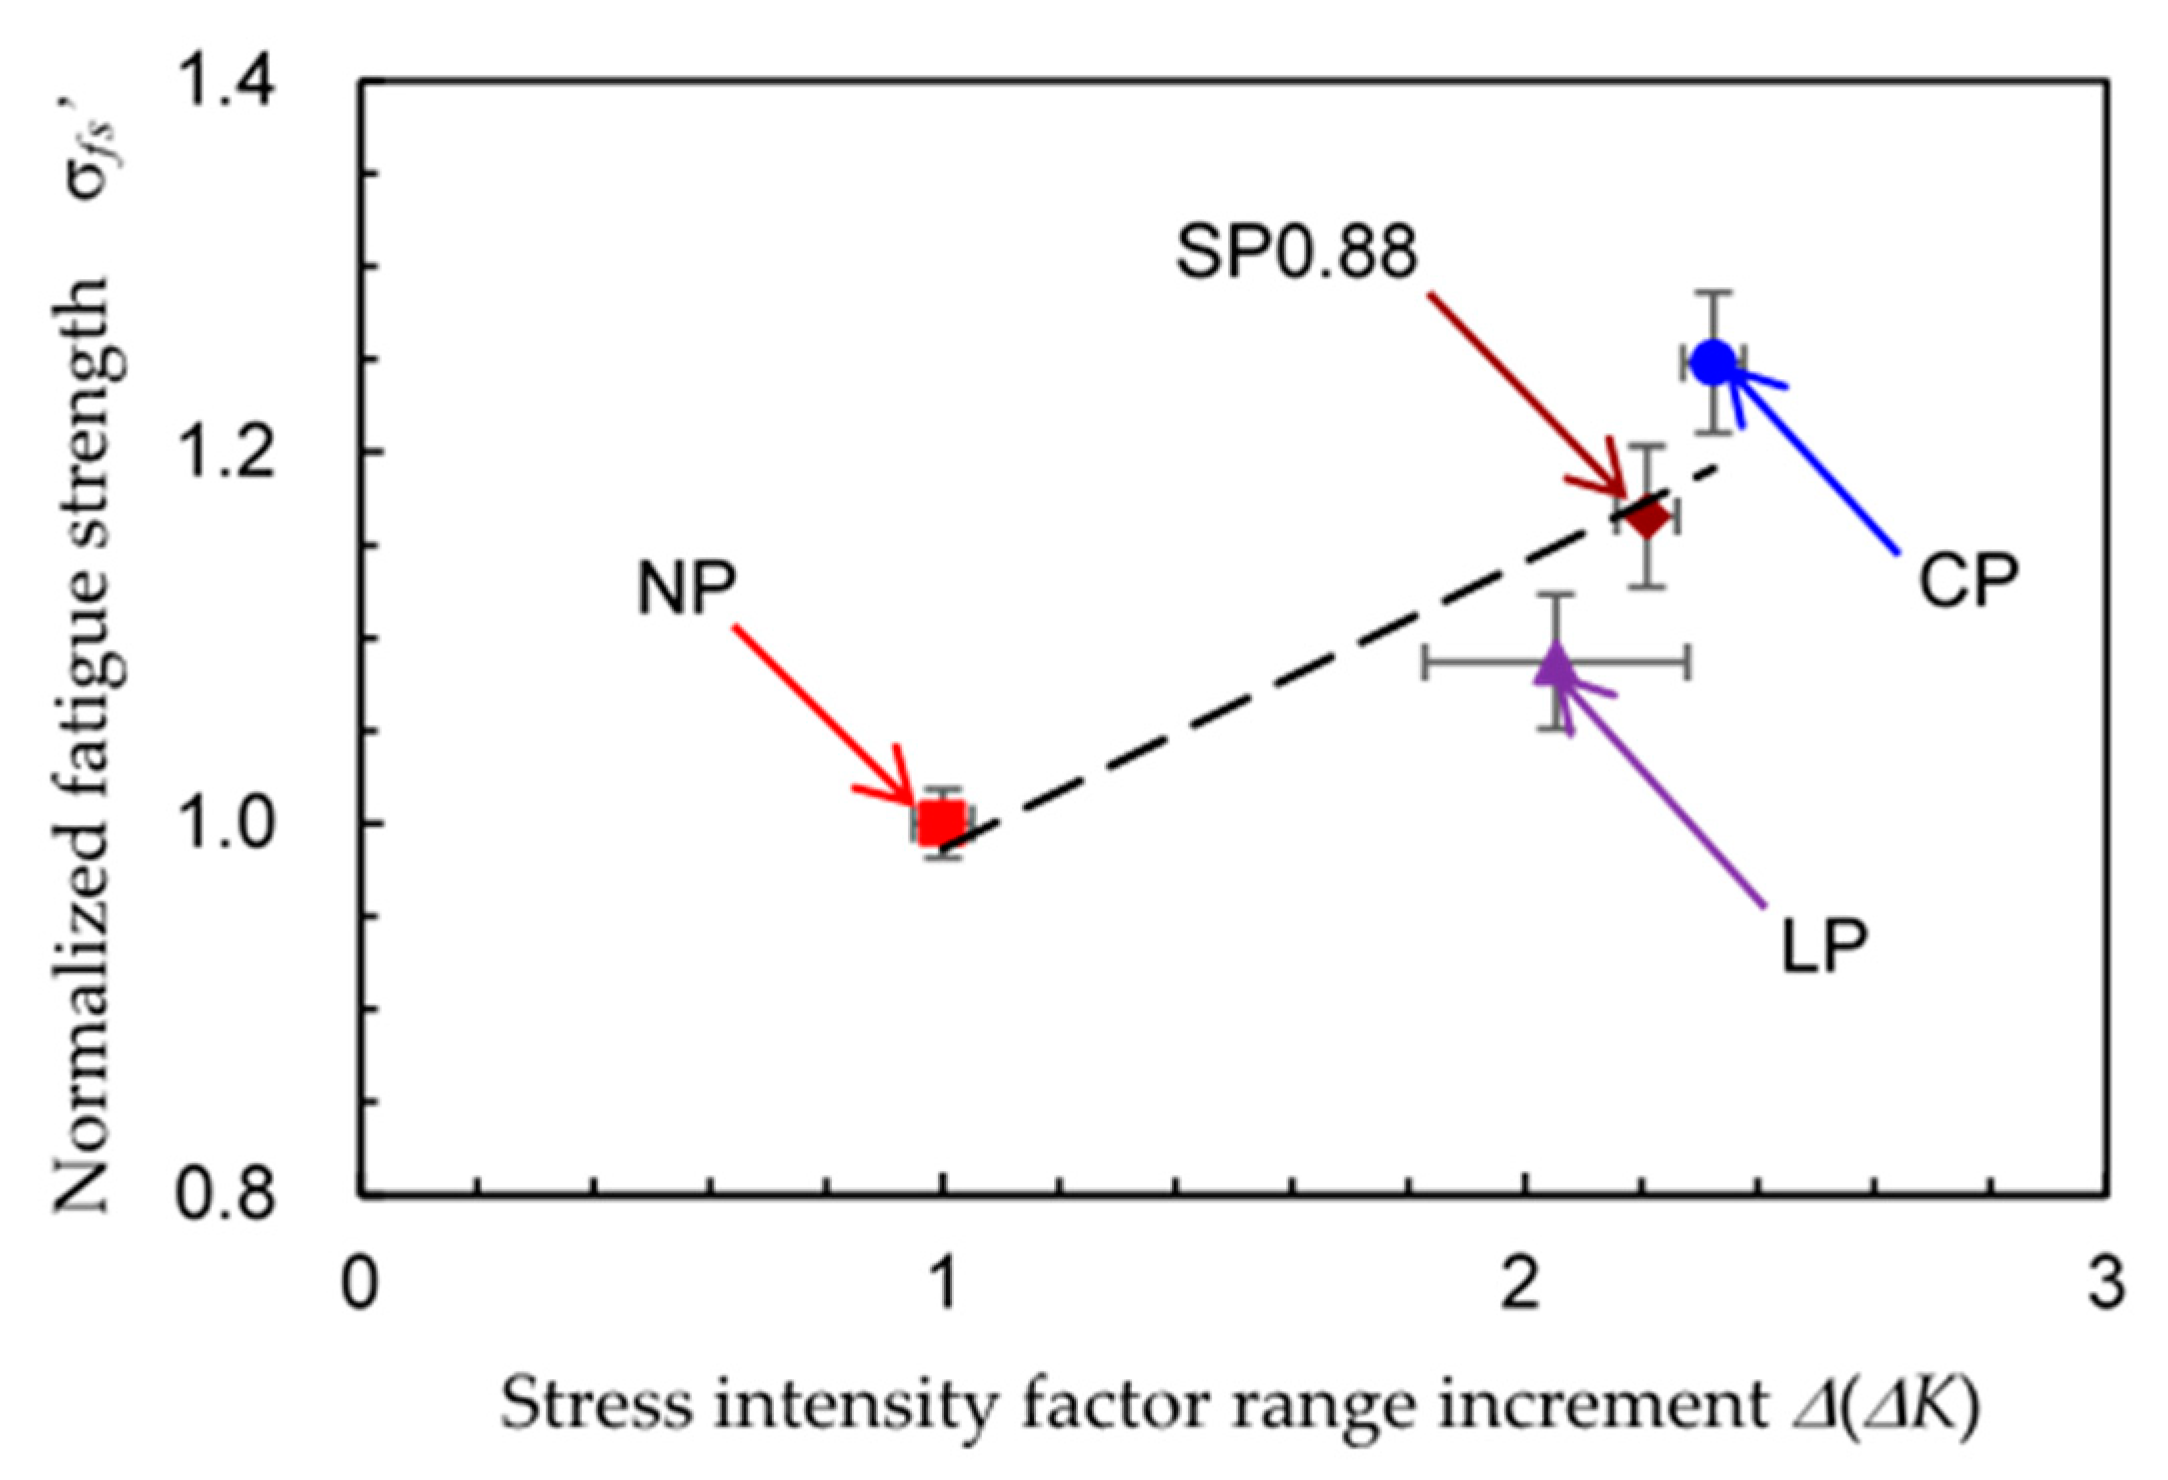
- (2)
- The correlation between ∆(∆K) and the fatigue strength of the stainless steel specimens treated by the various peening processes is better than that between ∆Kth’ and the fatigue strength.
- (3)
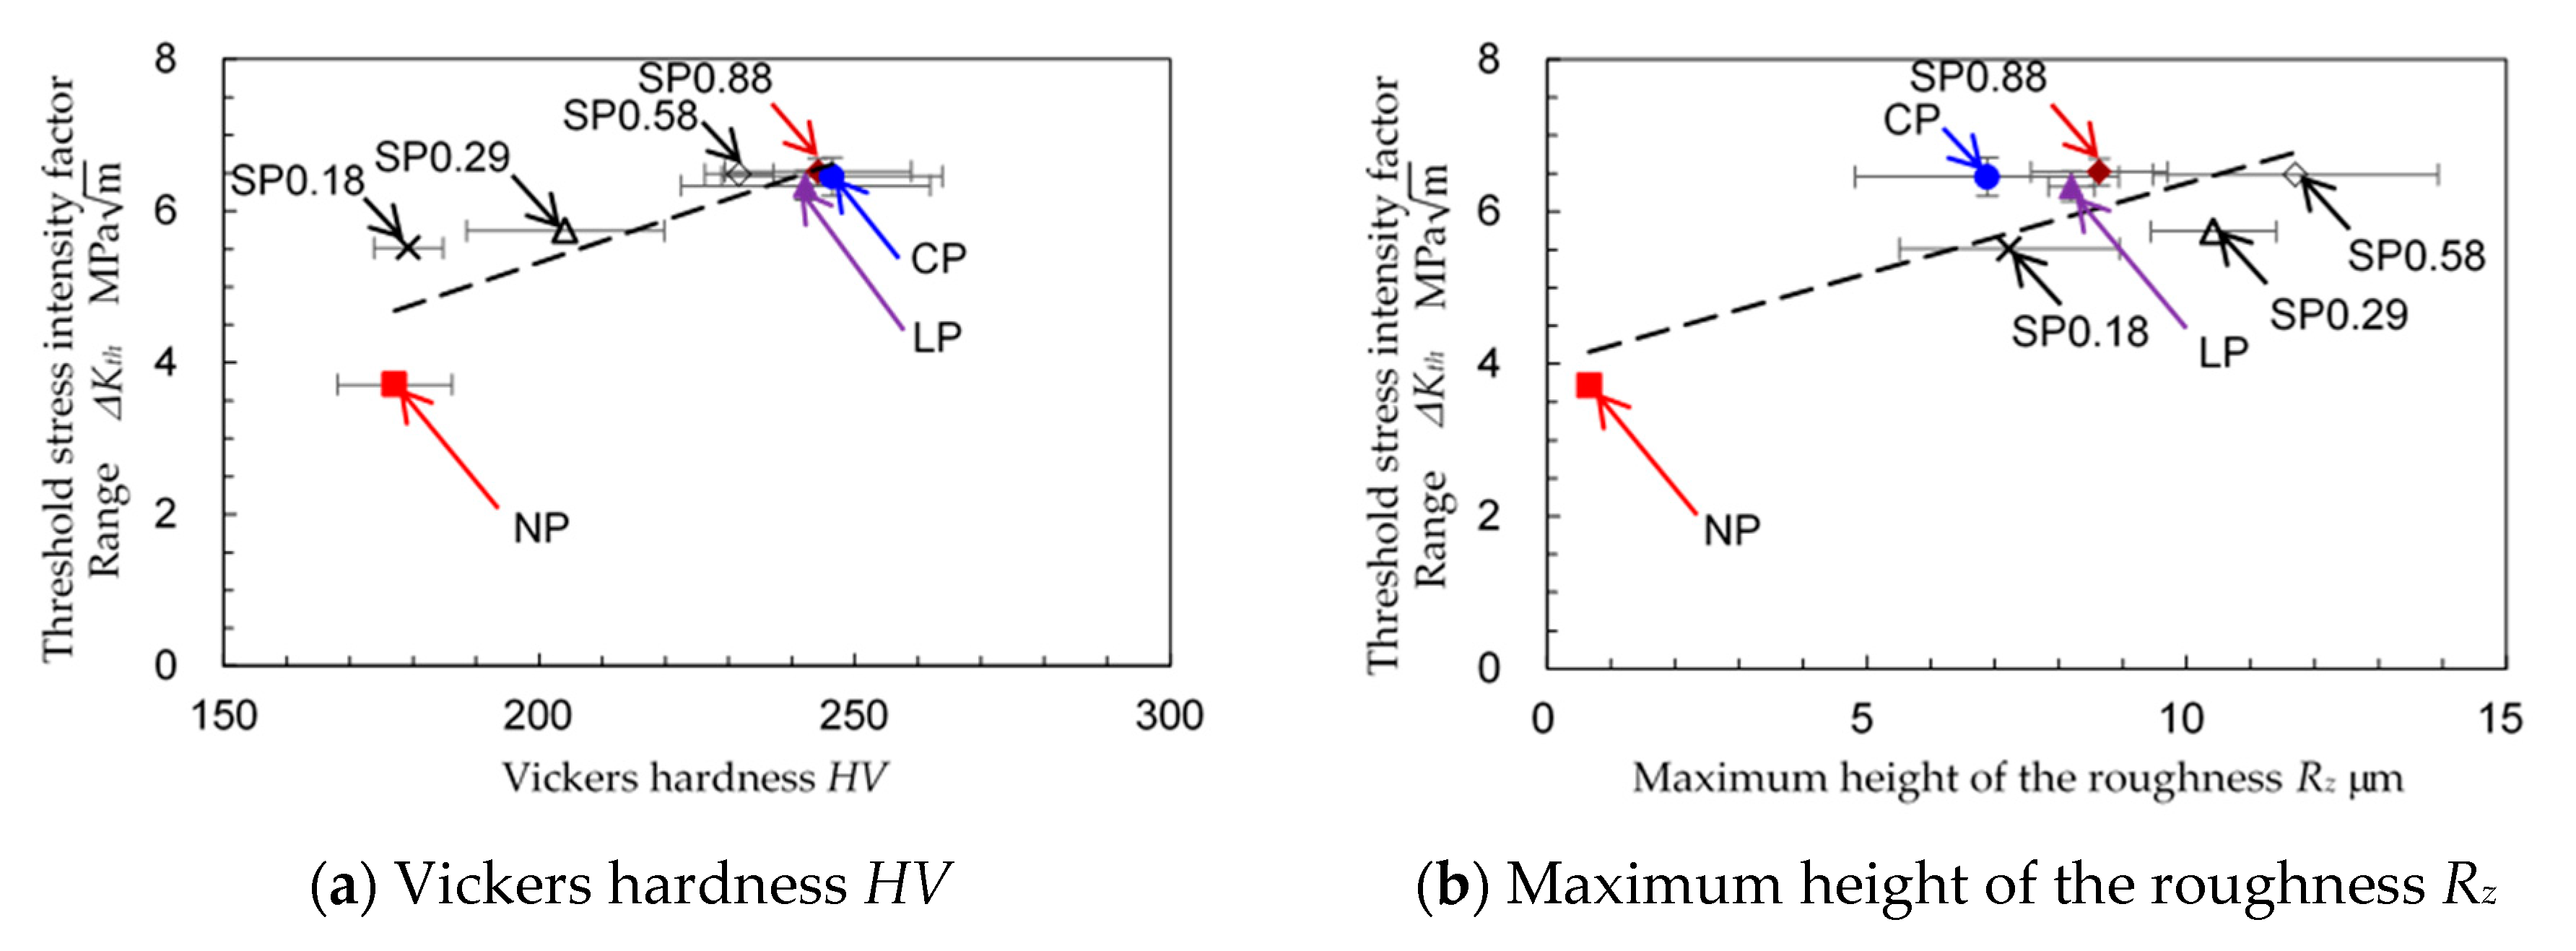
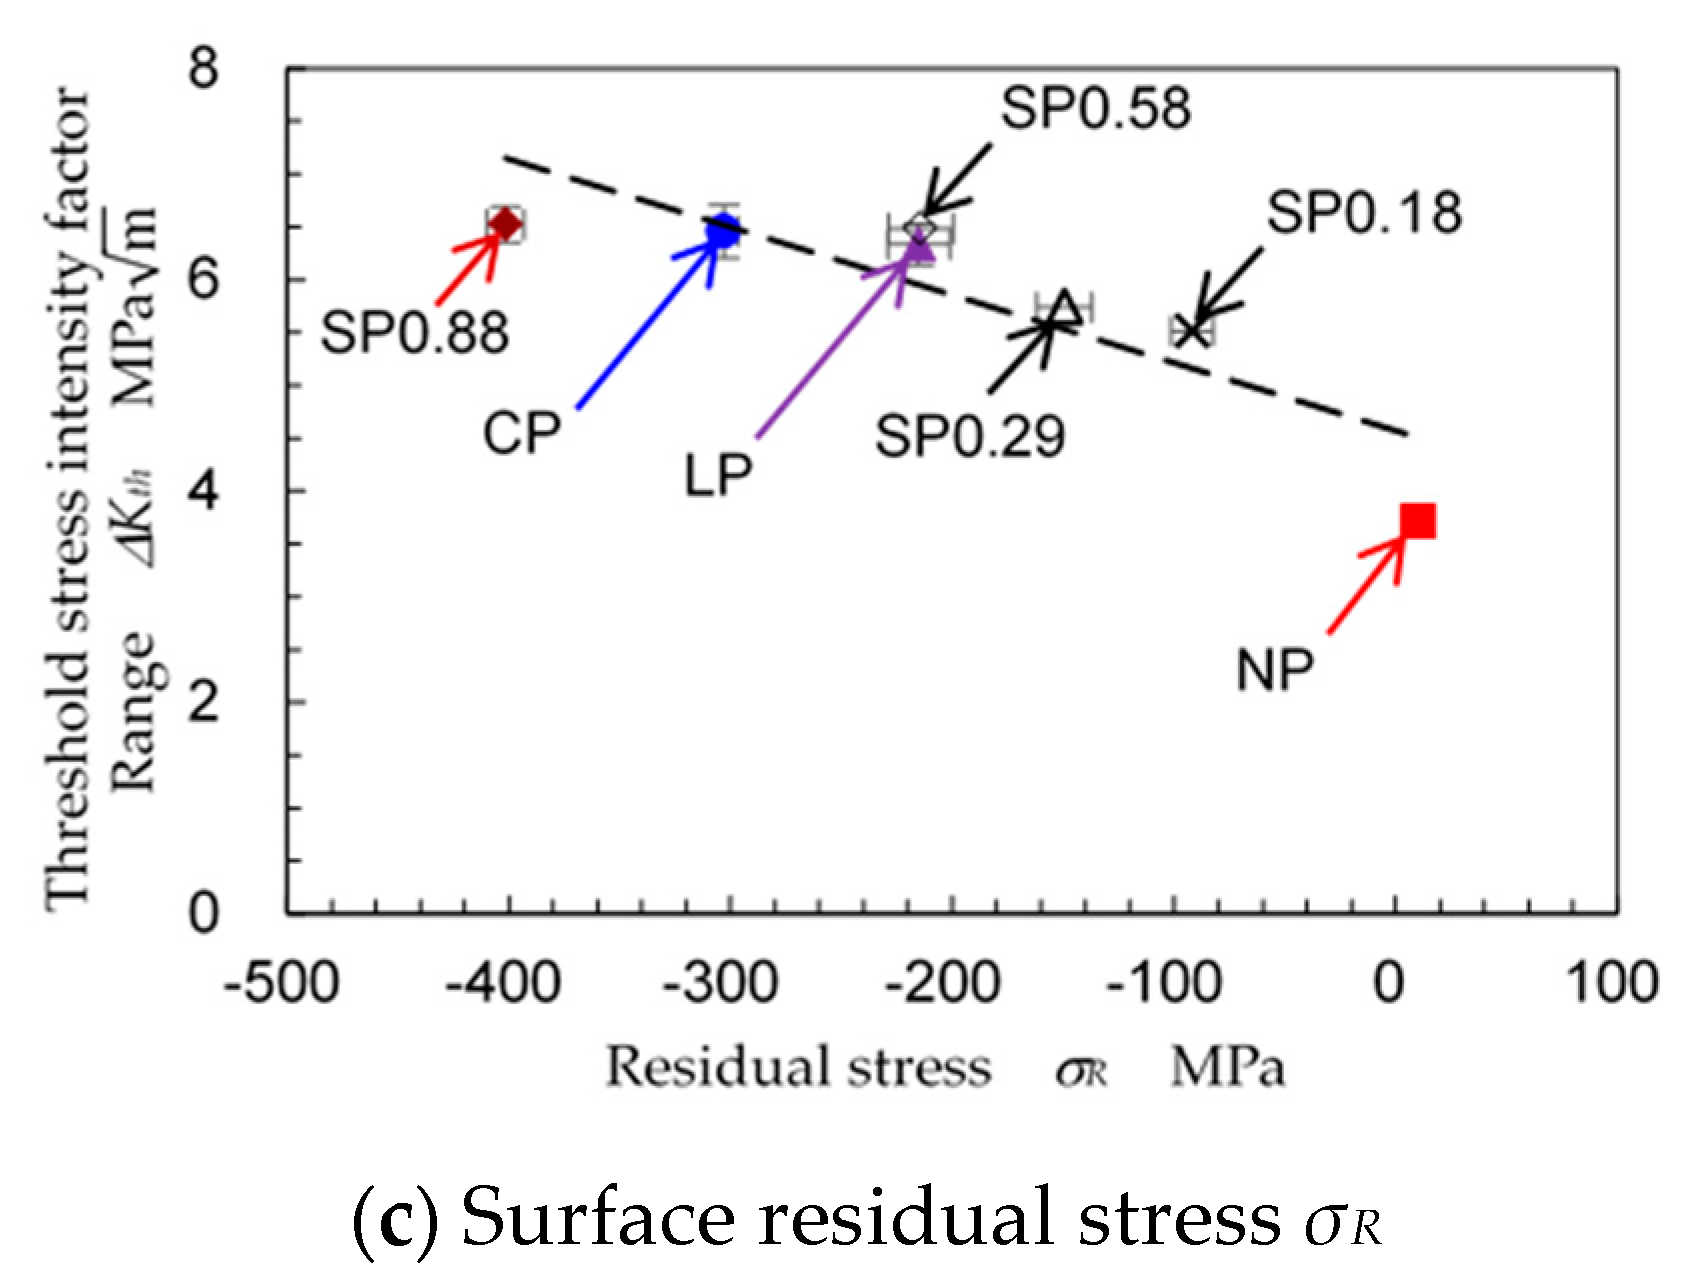
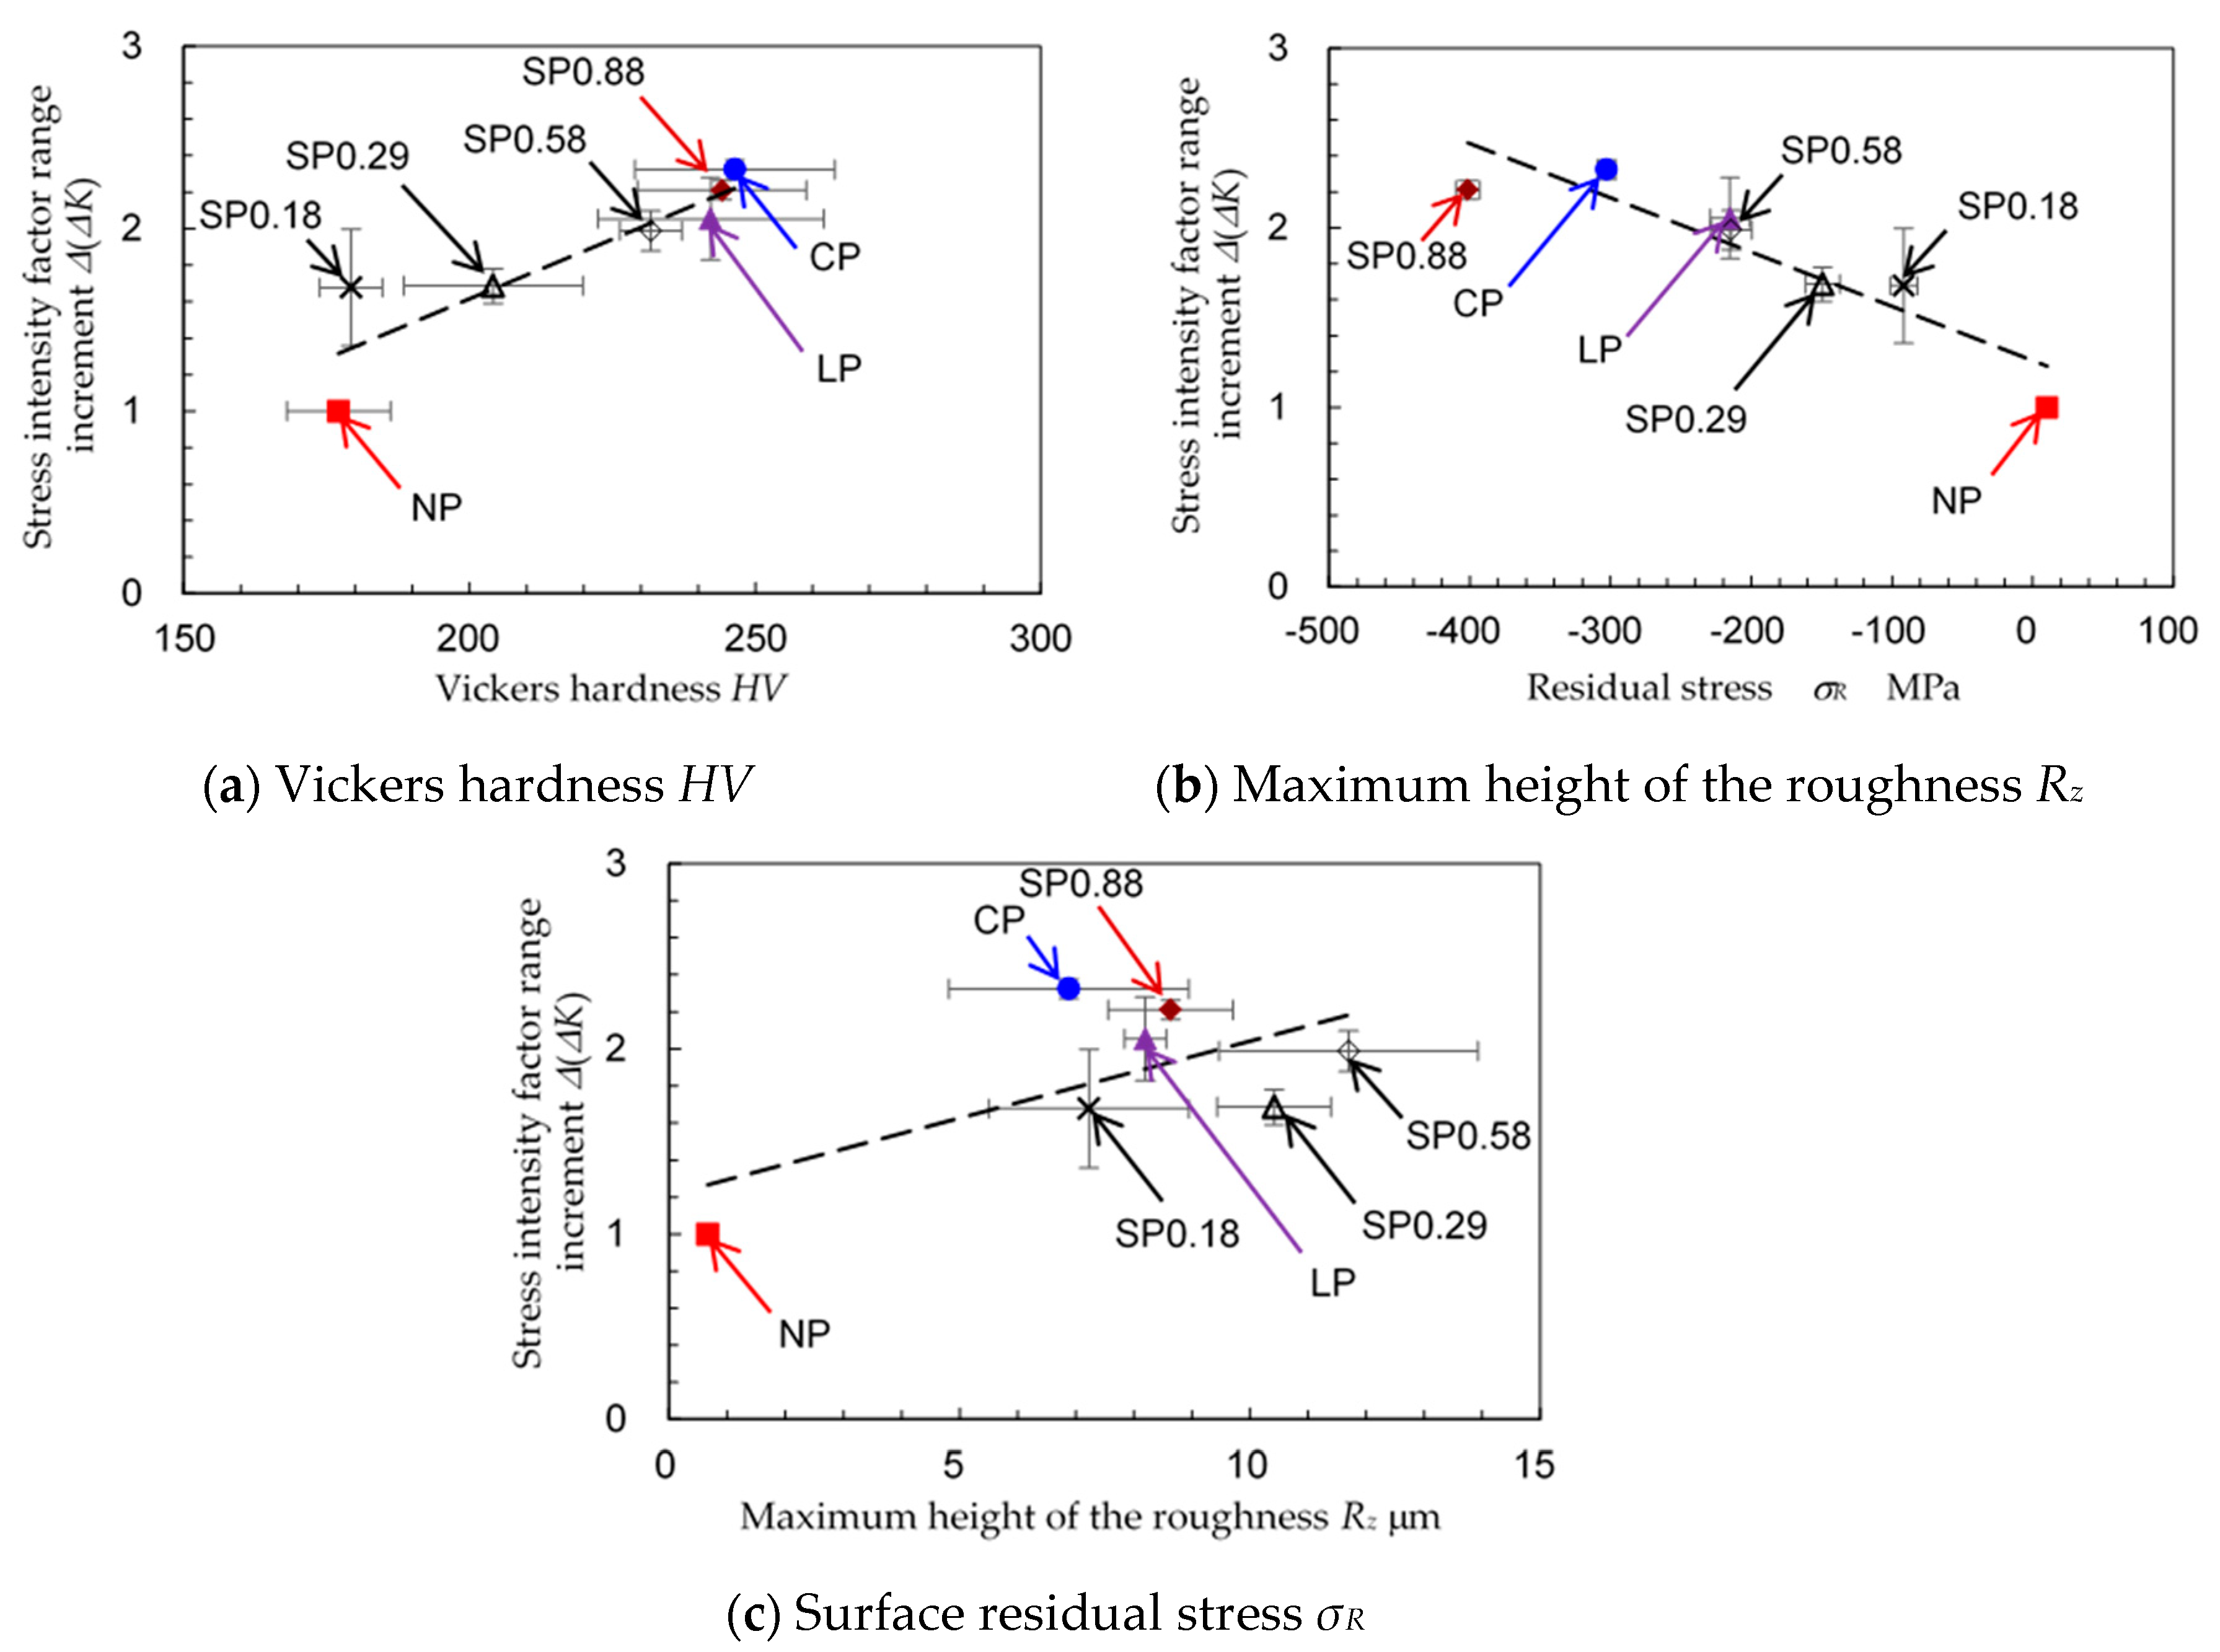
- ∆Kth and ∆(∆K) are increased with increasing surface hardness and compressive residual stress.
- (4)
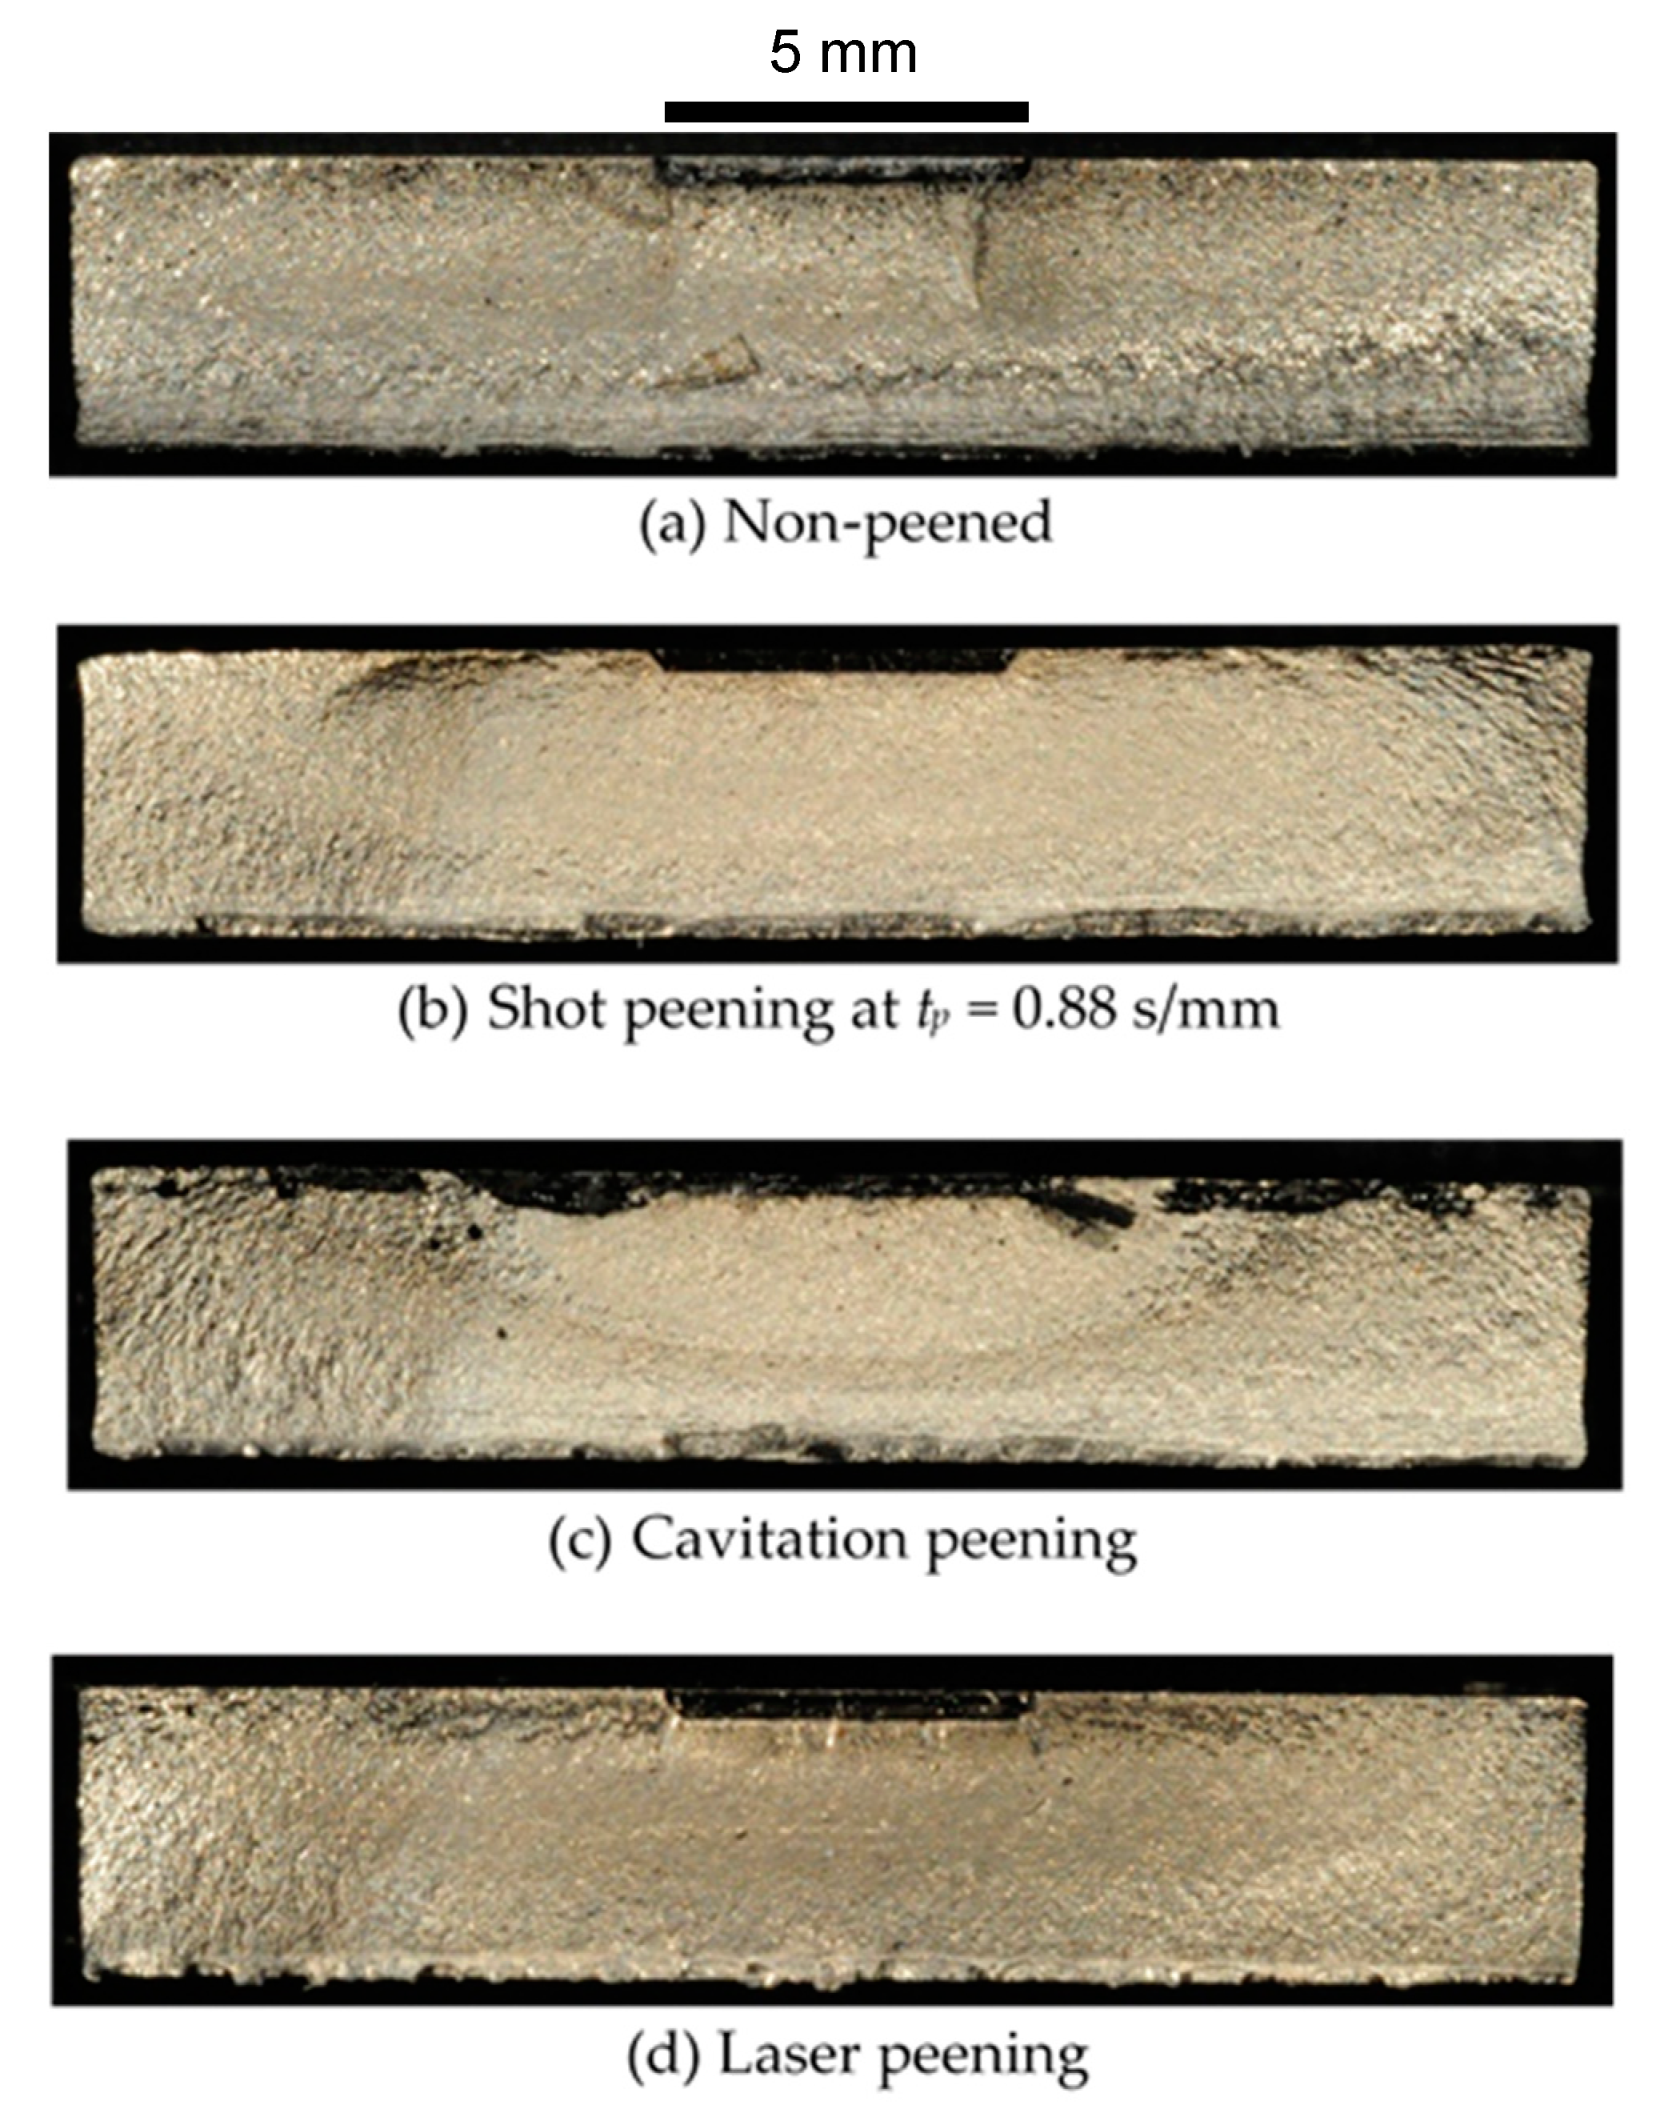
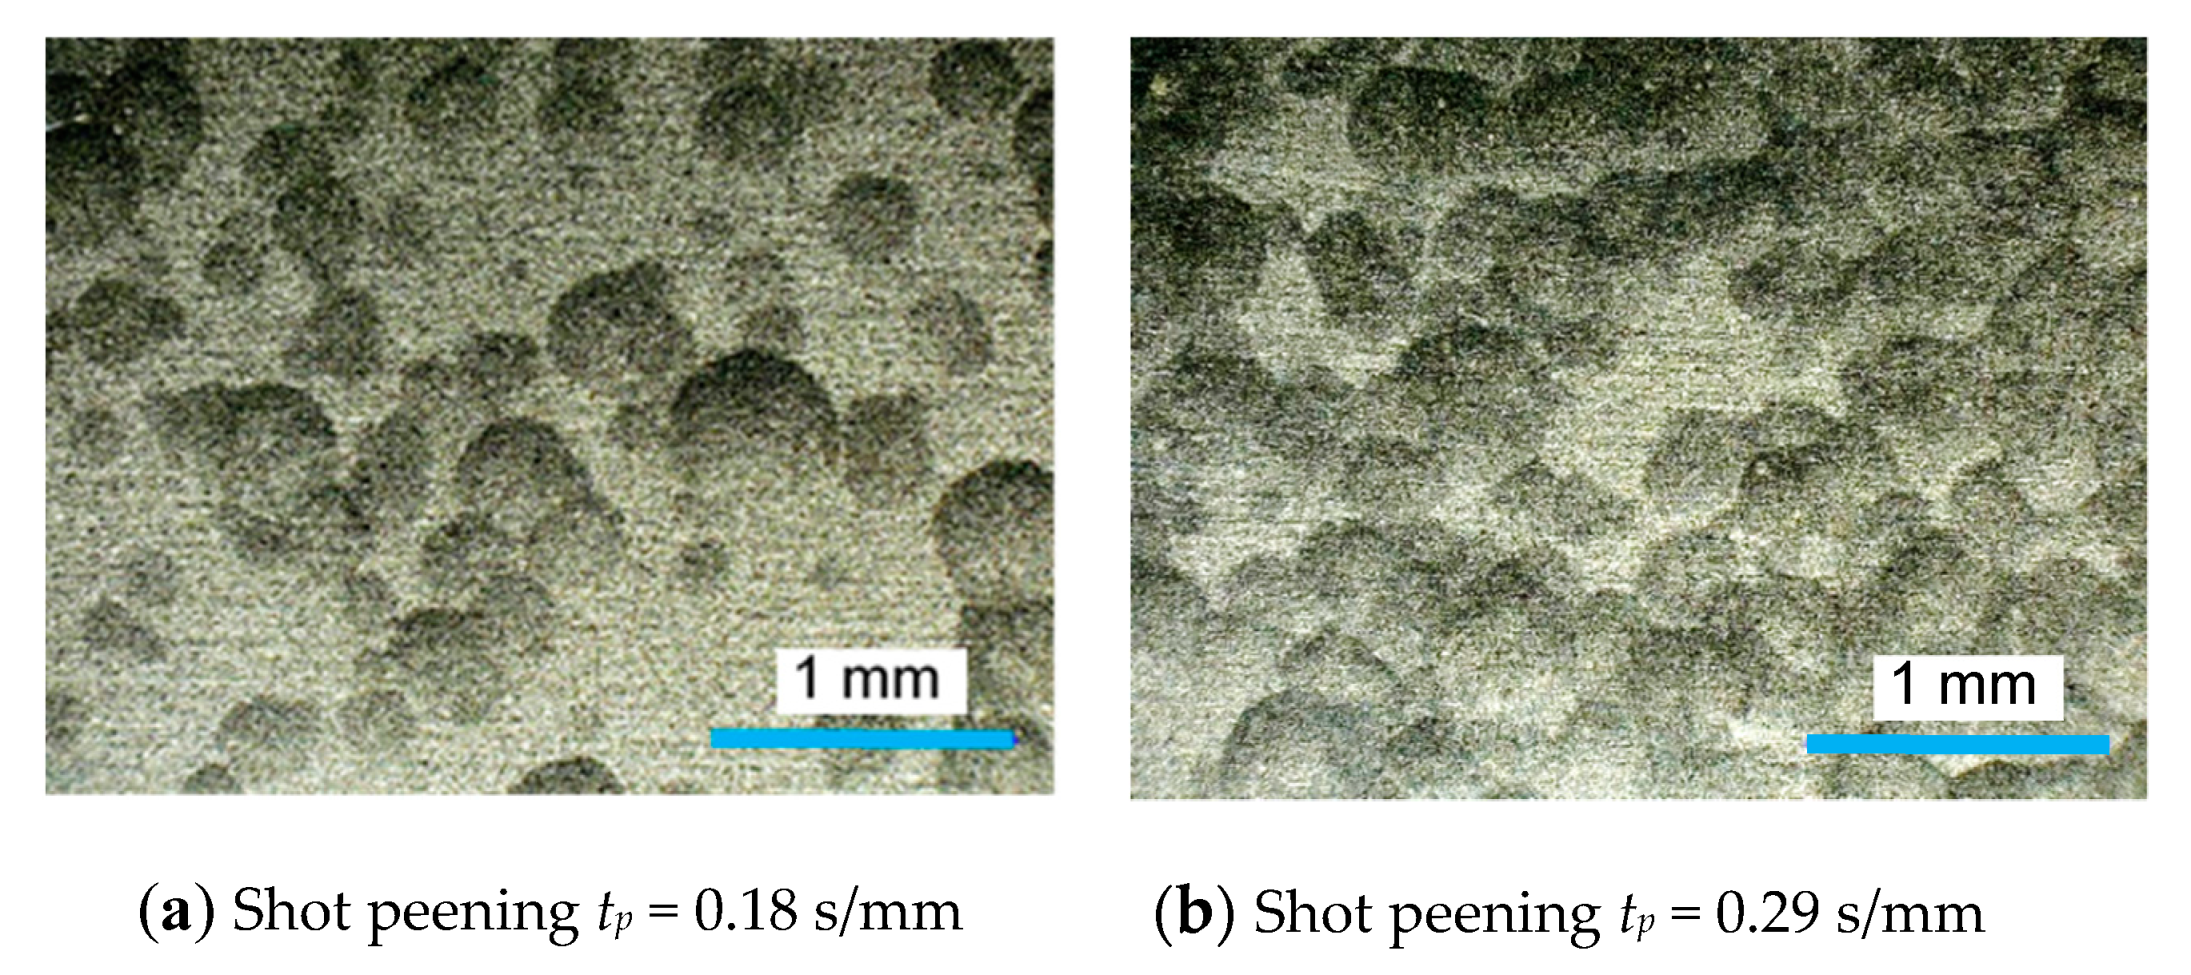
- The values of ∆Kth and values of ∆(∆K) of the specimens after treatment by the different peening methods are each roughly the same. When the mechanical properties of the peened specimens were compared, it was found that the cavitation peened specimen was smoother than the others. The compressive residual stress at the surface introduced by shot peening was larger than that introduced by the other peening methods.
Funding
Acknowledgments
Conflicts of Interest
References
- Disegi, J.A.; Eschbach, L. Stainless steel in bone surgery. Inj. Int. J. Care Inj. 2000, 31, S2–S6. [Google Scholar] [CrossRef]
- Asri, R.I.M.; Harun, W.S.W.; Samykano, M.; Lah, N.A.C.; Ghani, S.A.C.; Tarlochan, F.; Raza, M.R. Corrosion and surface modification on biocompatible metals: A review. Mater. Sci. Eng. C Mater. Biol. Appl. 2017, 77, 1261–1274. [Google Scholar] [CrossRef] [PubMed]
- Soyama, H. Key factors and applications of cavitation peening. Inter. J. Peen. Sci. Technol. 2017, 1, 3–60. [Google Scholar]
- Soyama, H. Fundamentals and applications of cavitation peening comparing with shot peening and laser peening. In Proceedings of the Advanced Surface Enhancement, INCASE 2019, Lecture Notes in Mechanical Engineering, Singapore, 10–12 September 2020; pp. 76–87. [Google Scholar]
- Delosrios, E.R.; Walley, A.; Milan, M.T.; Hammersley, G. Fatigue-crack initiation and propagation on shot-peened surfaces in A316 stainless-steel. Int. J. Fatigue 1995, 17, 493–499. [Google Scholar] [CrossRef]
- Azar, V.; Hashemi, B.; Yazdi, M.R. The effect of shot peening on fatigue and corrosion behavior of 316L stainless steel in ringer’s solution. Surf. Coat. Technol. 2010, 204, 3546–3551. [Google Scholar] [CrossRef]
- Ahmed, A.A.; Mhaede, M.; Basha, M.; Wollmann, M.; Wagner, L. The effect of shot peening parameters and hydroxyapatite coating on surface properties and corrosion behavior of medical grade AISI 316L stainless steel. Surf. Coat. Technol. 2015, 280, 347–358. [Google Scholar] [CrossRef]
- Bagherifard, S.; Slawik, S.; Fernandez-Pariente, I.; Pauly, C.; Mucklich, F.; Guagliano, M. Nanoscale surface modification of AISI 316L stainless steel by severe shot peening. Mater. Des. 2016, 102, 68–77. [Google Scholar] [CrossRef]
- Soyama, H.; Yamauchi, Y.; Adachi, Y.; Sato, K.; Shindo, T.; Oba, R. High-speed observations of the cavitation cloud around a high-speed submerged water-jet. JSME Int. J. 1995, 38, 245–251. [Google Scholar] [CrossRef]
- Kamisaka, H.; Soyama, H. Effect of injection pressure on mechanical surface treatment using a submerged water jet. J. Jet Flow Eng. 2018, 33, 4–10. [Google Scholar]
- Peyre, P.; Fabbro, R.; Merrien, P.; Lieurade, H.P. Laser shock processing of aluminium alloys. Application to high cycle fatigue behaviour. Mater. Sci. Eng. A Struct. Mater. Prop. Microstruct. Process. 1996, 210, 102–113. [Google Scholar] [CrossRef]
- Hatamleh, O.; Rivero, I.V.; Lyons, J. Evaluation of surface residual stresses in friction stir welds due to laser and shot peening. J. Mater. Eng. Perform. 2007, 16, 549–553. [Google Scholar] [CrossRef]
- Telang, A.; Gili, A.S.; Mannava, S.R.; Qian, D.; Vasudevan, V.K. Effect of temperature on microstructure and residual stresses induced by surface treatments in inconel 718 SPF. Surf. Coat. Technol. 2018, 344, 93–101. [Google Scholar] [CrossRef]
- Sano, Y.; Obata, M.; Kubo, T.; Mukai, N.; Yoda, M.; Masaki, K.; Ochi, Y. Retardation of crack initiation and growth in austenitic stainless steels by laser peening without protective coating. Mater. Sci. Eng. A 2006, 417, 334–340. [Google Scholar] [CrossRef]
- Soyama, H.; Lichtarowicz, A.; Momma, T.; Williams, E.J. A new calibration method for dynamically loaded transducers and its application to cavitation impact measurement. J. Fluids Eng. 1998, 120, 712–718. [Google Scholar] [CrossRef]
- Soyama, H.; Sekine, Y.; Saito, K. Evaluation of the enhanced cavitation impact energy using a PVDF transducer with an acrylic resin backing. Measurement 2011, 44, 1279–1283. [Google Scholar] [CrossRef]
- Soyama, H. Comparison between the improvements made to the fatigue strength of stainless steel by cavitation peening, water jet peening, shot peening and laser peening. J. Mater. Process. Technol. 2019, 269, 65–78. [Google Scholar] [CrossRef]
- Soyama, H. Surface mechanics design by cavitation peening using submerged pulse laser. In Proceedings of the Abstracts of 7th International Conference on Laser Peening and Related Phenomena, Singapore, 17–22 June 2018; p. 57. [Google Scholar]
- G32-16 Standard test method for cavitation erosion using vibratory apparatus1. ASTM Stand. 2016, 3, 1–20.
- G134-17 Standard test method for erosion of solid materials by a cavitating liquid jet. ASTM Stand. 2017, 3, 1–17.
- Kikuchi, K.; Ahmed, S.M.; Hiraiwa, T.; Ito, Y.; Oba, R. An indirect vibratory method capable of simulating several cavitating states. JSME Int. J. Ser. B Fluids Therm. Eng. 1991, 34, 1–8. [Google Scholar] [CrossRef]
- Bai, F.; Long, Y.Y.; Saalbach, K.A.; Twiefel, J. Theoretical and experimental investigations of ultrasonic sound fields in thin bubbly liquid layers for ultrasonic cavitation peening. Ultrasonics 2019, 93, 130–138. [Google Scholar] [CrossRef]
- Lesyk, D.A.; Soyama, H.; Mordyuk, B.N.; Dzhemelinskyi, V.V.; Martinez, S.; Khripta, N.I.; Lamikiz, A. Mechanical surface treatments of AISI 304 stainless steel: Effects on surface microrelief, residual stress, and microstructure. J. Mater. Eng. Perform. 2019, 28, 5307–5322. [Google Scholar] [CrossRef]
- Munoz-Cubillos, J.; Coronado, J.J.; Rodriguez, S.A. Deep rolling effect on fatigue behavior of austenitic stainless steels. Int. J. Fatigue 2017, 95, 120–131. [Google Scholar] [CrossRef]
- Zhou, J.; Retraint, D.; Sun, Z.; Kanoute, P. Comparative study of the effects of surface mechanical attrition treatment and conventional shot peening on low cycle fatigue of a 316L stainless steel. Surf. Coat. Technol. 2018, 349, 556–566. [Google Scholar] [CrossRef]
- Ben Moussa, N.; Gharbi, K.; Chaieb, I.; Ben Fredj, N. Improvement of AISI 304 austenitic stainless steel low-cycle fatigue life by initial and intermittent deep rolling. Int. J. Adv. Manuf. Technol. 2019, 101, 435–449. [Google Scholar] [CrossRef]
- Ghelichi, R.; Crispiatico, G.; Guagliano, M.; Bagherifard, S. An energetic approach to predict the effect of shot peening-based surface treatments. Metals 2018, 8, 190. [Google Scholar] [CrossRef]
- E647-13 Standard test method for measurement of fatigue crack growth rates. ASTM Stand. 2013, 3, 1–48.
- Soyama, H. Evaluation of crack initiation and propagation of stainless steel treated by cavitating peening using a load controlled plate bending fatigue tester. Met. Finish. News 2014, 15, 60–62. [Google Scholar]
- Takakuwa, O.; Sanada, K.; Soyama, H. Evaluation of fatigue crack propagation in surface modification layer by a load-controlled plate bending fatigue tester. Trans. JSME 2014, 80, 1–17. [Google Scholar] [CrossRef][Green Version]
- Masaki, K.; Ochi, Y.; Soyama, H. Fatigue property improvement of type 316L steel by cavitation shotless peening. In Proceedings of the 10th International Conference on Shot Peening, Tokyo, Japan, 15–18 September 2008; p. 53. [Google Scholar]
- Soyama, H. Improvement of threshold stress intensity factor range of stainless steel by cavitation peening. In Proceedings of the 12th International Conference on Shot Peening, Goslar, Germany, 15–18 September 2014; pp. 55–60. [Google Scholar]
- Raju, I.S.; Newman, J.C. Stress-intensity factors for a wide-range of semi-elliptical surface cracks in finite-thickness plates. Eng. Fract. Mech. 1979, 11, 817–829. [Google Scholar] [CrossRef]
- He, B.B. Two-Dimensional X-Ray Diffraction; John Wiley & Sons, Inc.: Hoboken, NJ, USA, 2009; pp. 249–328. [Google Scholar]
- Takakuwa, O.; Soyama, H. Optimizing the conditions for residual stress measurement using a two-dimensional XRD method with specimen oscillation. Adv. Mater. Phys. Chem. 2013, 3, 8–18. [Google Scholar] [CrossRef]
- Soyama, H. Enhancing the aggressive intensity of a cavitating jet by introducing a cavitator and a guide pipe. J. Fluid Sci. Technol. 2014, 9, 1–12. [Google Scholar] [CrossRef]
- Soyama, H. Enhancing the aggressive intensity of a cavitating jet by means of the nozzle outlet geometry. J. Fluids Eng. 2011, 133, 1–11. [Google Scholar] [CrossRef]
- Naito, A.; Takakuwa, O.; Soyama, H. Development of peening technique using recirculating shot accelerated by water jet. Mater. Sci. Technol. 2012, 28, 234–239. [Google Scholar] [CrossRef]


| C | Si | Mn | P | S | Ni | Cr | Mo |
|---|---|---|---|---|---|---|---|
| 0.014 | 0.63 | 0.97 | 0.030 | 0.004 | 12.03 | 17.45 | 2.05 |
| Yield Strength (0.2%) | Tensile Strength | Elongation |
|---|---|---|
| 304 MPa | 576 MPa | 52% |
| Process | ∆Kth | ∆Kth’ | ∆(∆K) | Fatigue Strength σfs MPa | σfs’ |
|---|---|---|---|---|---|
| Non-peened | 3.71 ± 0.11 | 1.00 ± 0.03 | 1.00 ± 0.05 | 278.9 ± 5.2 | 1.00 ± 0.02 |
| Shot peening | 6.52 ± 0.17 | 1.76 ± 0.07 | 2.21 ± 0.05 | 325.0 ± 8.7 | 1.17 ± 0.04 |
| Cavitation peening | 6.46 ± 0.25 | 1.74 ± 0.09 | 2.32 ± 0.05 | 348.1 ± 8.4 | 1.25 ± 0.04 |
| Laser peening | 6.33 ± 0.20 | 1.71 ± 0.07 | 2.05 ± 0.23 | 303.2 ± 8.4 | 1.09 ± 0.04 |
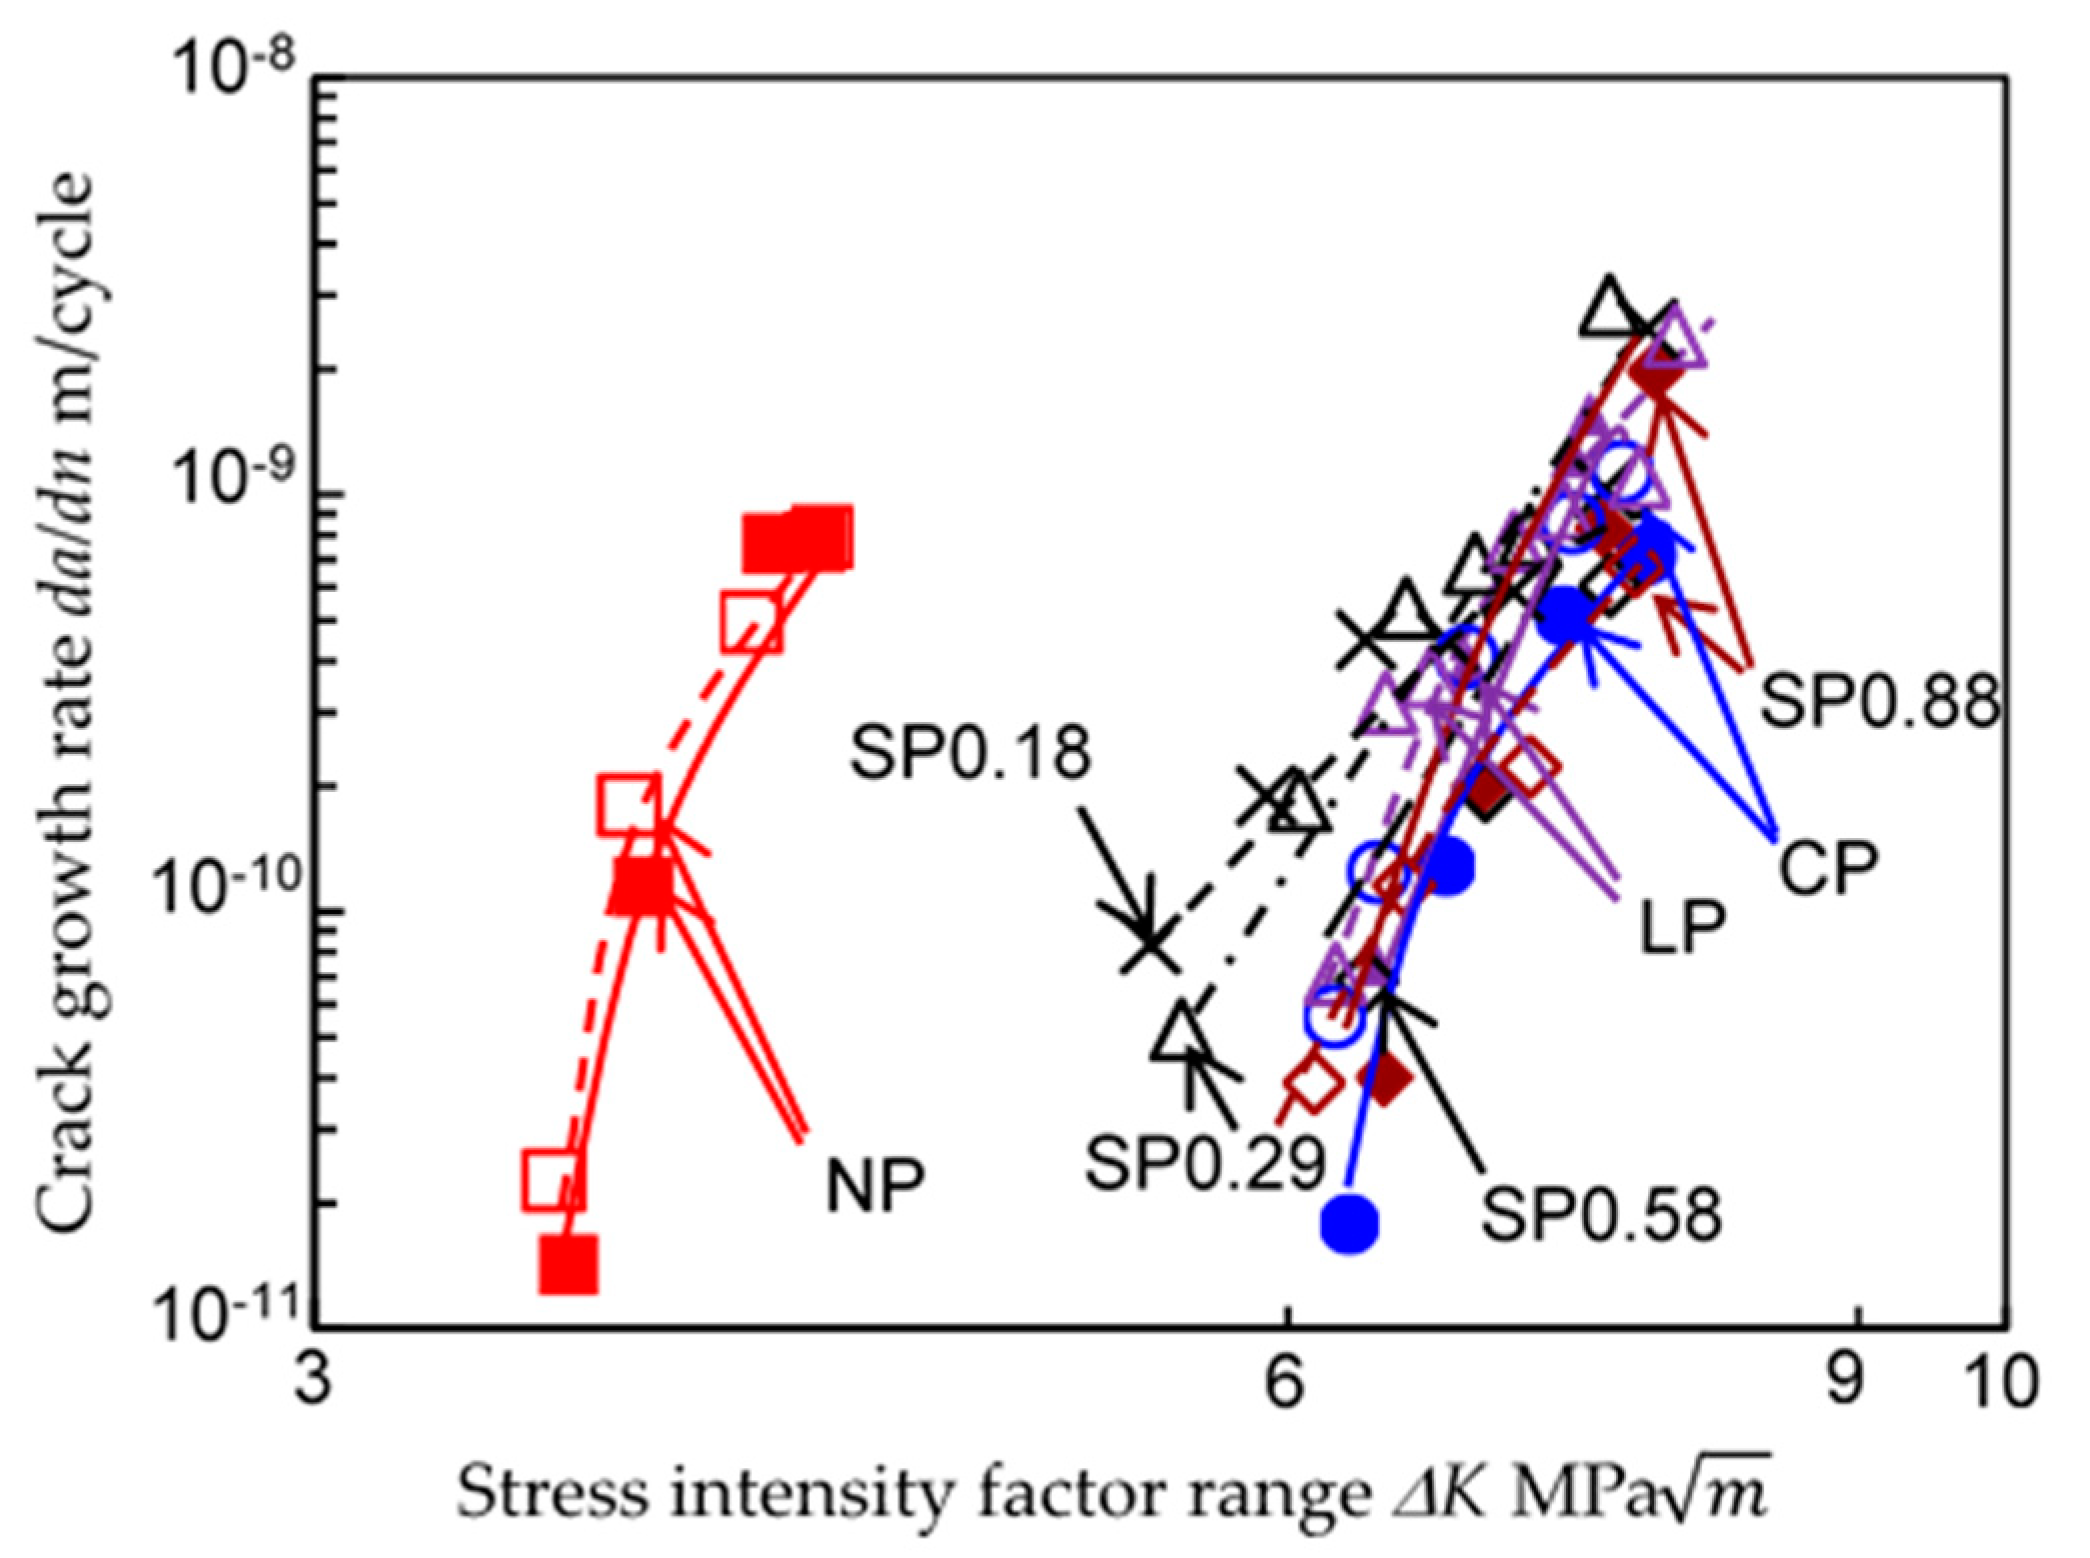
| Heading | Paris’ Law Constants | Correlation Coefficient | Number of Data Points | Probability of Non-Correlation (%) | |
|---|---|---|---|---|---|
| C m/cycle | m | ||||
| Non-peened | 3.8 × 10⁻¹⁰ | 1.4 ± 0.4 | 0.67 | 18 | 0.23 |
| Shot peening (tp = 0.18 s/mm) | 6.5 × 10⁻¹⁰ | 1.1 ± 1.5 | 0.38 | 5 | 53 |
| Shot peening (tp = 0.29 s/mm) | 5.5 × 10⁻¹¹ | 2.0 ± 0.4 | 0.80 | 19 | 0.004 |
| Shot peening (tp = 0.58 s/mm) | 1.2 × 10⁻¹⁰ | 1.4 ± 0.4 | 0.55 | 29 | 0.2 |
| Shot peening (tp = 0.88 s/mm) | 7.6 × 10⁻¹¹ | 1.6 ± 0.3 | 0.66 | 52 | 0.001 |
| Cavitation peening | 3.7 × 10⁻¹¹ | 1.8 ± 0.4 | 0.66 | 33 | 0.3 |
| Laser peening | 5.3 × 10⁻¹¹ | 1.8 ± 0.3 | 0.71 | 36 | 0.013 |
© 2019 by the author. Licensee MDPI, Basel, Switzerland. This article is an open access article distributed under the terms and conditions of the Creative Commons Attribution (CC BY) license (http://creativecommons.org/licenses/by/4.0/).
Share and Cite
Soyama, H. Comparison between Shot Peening, Cavitation Peening, and Laser Peening by Observation of Crack Initiation and Crack Growth in Stainless Steel. Metals 2020, 10, 63. https://doi.org/10.3390/met10010063
Soyama H. Comparison between Shot Peening, Cavitation Peening, and Laser Peening by Observation of Crack Initiation and Crack Growth in Stainless Steel. Metals. 2020; 10(1):63. https://doi.org/10.3390/met10010063
Chicago/Turabian StyleSoyama, Hitoshi. 2020. "Comparison between Shot Peening, Cavitation Peening, and Laser Peening by Observation of Crack Initiation and Crack Growth in Stainless Steel" Metals 10, no. 1: 63. https://doi.org/10.3390/met10010063
APA StyleSoyama, H. (2020). Comparison between Shot Peening, Cavitation Peening, and Laser Peening by Observation of Crack Initiation and Crack Growth in Stainless Steel. Metals, 10(1), 63. https://doi.org/10.3390/met10010063