Article

TEM Observation of Loops Decorating Dislocations and Resulting Source Hardening of Neutron-Irradiated Fe-Cr Alloys

by
Frank Bergner
1,*,
Mercedes Hernández-Mayoral
2,
Cornelia Heintze
1,
Milan J. Konstantinović
3,
Lorenzo Malerba
2 and
Cristelle Pareige
4
1
Helmholtz-Zentrum Dresden-Rossendorf, Bautzner Landstr. 400, 01328 Dresden, Germany
2
Division of Materials, CIEMAT, Avenida Complutense 40, 28040 Madrid, Spain
3
SCK•CEN, Nuclear Material Science Institute, Boeretang 200, B–2400 Mol, Belgium
4
Groupe de Physique des Matériaux, Université et INSA de Rouen, UMR 6634 CNRS, Avenue de l’Université, BP 12, 76801 Saint Etienne du Rouvray, France
*
Author to whom correspondence should be addressed.
Metals 2020, 10(1), 147; https://doi.org/10.3390/met10010147
Submission received: 16 December 2019 / Revised: 9 January 2020 / Accepted: 16 January 2020 / Published: 18 January 2020
(This article belongs to the Special Issue Radiation Damage in Metals and Alloys)

Abstract

:
Several open issues remain concerning the quantitative understanding of irradiation hardening in high-Cr steels. One of these issues is addressed here by correlating yield points that are observed in stress-strain curves with dislocation decoration observed by TEM for neutron-irradiated Fe-Cr alloys. It is found that both higher neutron exposure and higher Cr content promote irradiation-induced loops to arrange preferentially along dislocation lines. Consequently, the activation of dislocation sources requires unlocking from the decorating loops, thus resulting in a yield drop. This process is considered within the source hardening model as opposed to the dispersed barrier hardening model, the latter aimed to describe dislocation slip through a random array of obstacles. Microstructure-informed estimates of the unlocking stress are compared with measured values of the upper yield stress. As functions of neutron exposure, a cross-over from the dominance of dispersed-barrier hardening accompanied by smooth elastic-plastic transitions to the dominance of source hardening accompanied by yield drops is observed for Fe-9% Cr and Fe-12% Cr.

1. Introduction

Neutron irradiation gives rise to hardening, which, for bcc metals, causes embrittlement. Therefore, irradiation hardening is of vital relevance to structural applications, e.g., in future fission and fusion devices. High-Cr ferritic/martensitic steels are promising materials for such applications. However, a full quantitative understanding of the origin of irradiation hardening in these steels has still to be achieved. Neutron-irradiated Fe-Cr-based model alloys of varying Cr contents are used here to address open issues related to the influence of Cr and neutron exposure on the initiation of plastic deformation in terms of smooth elastic-plastic transitions versus pronounced yield points. The aim of the study was to link TEM observations at the nm length scale with results from tensile tests in order to uncover the role of the spatial distribution of irradiation-induced defects in terms of preferential arrangement along dislocations versus random distribution. The results will allow for the observation of yield drops in tensile stress-strain curves to be rationalized.
Two essentially different types of models have been suggested to account for irradiation hardening in bcc alloys: dispersed-barrier hardening (DBH) [1,2,3,4] and source hardening (SH) [4,5,6]. According to the DBH model, hardening is the consequence of arrays of randomly distributed irradiation-induced defects that act as obstacles for dislocation slips [2]. DBH is typically associated with a smooth elastic-plastic transition. In its simplest dimensionally correct form, the yield stress σy arising from DBH is given as [1,2,3,4]:
σy = αMGb·(Nd)1/2
Here, α, M, G, b, N, and d denote the dimensionless obstacle strength, the Taylor factor (which accounts for the averaging of the grain orientations over all grains in the sample), the shear modulus, the Burgers vector (magnitude of the lattice distortion resulting from dislocations in a crystal lattice), the number density of obstacles and the mean diameter of obstacles, respectively.
In contrast, SH is attributed to defects, such as dislocation loops, that accumulate along grown-in dislocations [5,7,8]. These dislocations have to unlock from the rows of defects (e.g., rows of loops) before being capable of multiplication and slip initiation. Ideally, unlocking gives rise to a yield point followed by a pronounced yield drop, as reported in [9] for neutron-irradiated Fe. The extreme result of this process is slip localization via the formation of dislocation channels with a subsequent drastic reduction of uniform elongation and an apparent loss of work-hardening [10,11]. The unlocking stress σun for a grown-in dislocation from a row of dislocation loops can be estimated according to [4]:
σun = 0.1MG(b/l)(d/y)2
The spacing of the loops measured along the dislocation line and the stand-off distance of the loops from the dislocation are denoted by l and y, respectively. The underlying assumptions were discussed in [4,5]. The phenomenon of SH is similar to the yield drop caused by Cottrell atmospheres of carbon atoms forming, for example, in plain carbon steels in the strain field of dislocations [12].
Previously reported engineering stress-strain curves [13] for neutron-irradiated Fe-Cr alloys have exhibited yield drops in some cases but not in others, suggesting a non-trivial contribution of SH. Nonetheless, a three-feature DBH model relating the observed irradiation-induced nanofeatures to the measured yield stress increase was applied in [14]. The present analysis was aimed at considering the SH model on the basis of dedicated TEM observations and clarifying the role of source versus dispersed-barrier hardening as functions of Cr content and neutron exposure. The resulting insight will add a significant value to prior work [13,14] focused on DBH.
The irradiation-induced nanofeatures in the neutron-irradiated, industrial-purity Fe-Cr alloys considered here have been previously characterized by TEM [13,15], atom probe tomography (APT) [16], small-angle neutron scattering (SANS) [17], and positron annihilation spectroscopy (PAS) [18,19], revealing the formation and evolution of irradiation-induced dislocation loops [13,15], NiSiPCr-rich clusters [16], α’-phase particles (for Cr ≥ 9%) [16,17], and sub-nm vacancy clusters [18,19]. These studies have indicate da complex interplay of chemical composition and microstructure (ferrite versus martensite) in defect formation under neutron irradiation. While clear contributions to hardening arising from NiSiPCr-rich clusters, small vacancy clusters, and α′-phase particles have been established [16,19], the role of loops remains elusive. As compared to previous work [13,15], a more detailed and quantitative analysis was performed in this study based on extended TEM observations of loops in alloys that were irradiated to 0.6 displacements per atom (dpa). Special emphasis is placed on the arrangement of loops with respect to grown-in dislocations. This allows for unlocking stresses to be estimated in the framework of the SH model.
It is important to note that the above-mentioned formation of dislocation channels and loss of work hardening are also crucial phenomena occurring upon the continued deformation of irradiated Fe-based alloys. The present work, however, is focused on the elastic-plastic transition. Unlocking is a prerequisite for dislocation multiplication and channel formation to occur at later stages of plastic deformation.

2. Materials and Methods

The composition of the alloys, designated as Fe-5Cr, Fe-9Cr and Fe-12Cr below, measured by means of inductively coupled plasma mass spectrometry (ICP-MS) is given in Table 1 in units of at% [16]. Fabrication, heat treatment, irradiation conditions, and measured stress-strain curves were reported in [13]. Samples of these materials were irradiated at 300 °C up to neutron exposures of 0.06 and 0.6 dpa. The displacement damage in units of dpa was calculated from dosimetry data according to the standard procedure that was suggested by Norgett, Robinson and Torrens [20]. The neutron flux was approximately 7.4 × 1013 cm−2·s−1 (E > 1 MeV) [19]. Results reported for pure Fe irradiated at 300 °C up to 0.2 dpa [21,22,23] are included in the analysis as a zero-Cr baseline.
Because of limited space in the irradiation capsules, mini-tensile samples of 12 mm gage length were tested. Tensile tests were performed at room temperature by using a cross-head speed of 0.2 mm/min. This corresponded to a strain rate of 2.8 × 10⁻⁴ s−1. Three samples were tested for each material/irradiation condition. In general, the details of the yield drop strongly depended on the parameters of the tensile tests, especially the stiffness of the testing machine. Therefore, it was not possible to draw quantitative conclusions from the height of the yield drop here. Instead, the appearance of yield phenomena was characterized in terms of qualitative criteria, in particular “yes” (there was a pronounced yield drop), “no” (there was a smooth elastic–plastic transition) or “limit case” (yield phenomenon visible but not connected with a pronounced yield drop).
Complementary TEM investigations (complementarity with respect to [13,15]) were performed with a JEOL JEM-2010 microscope (JEOL, Tokyo, Japan) operated at 200 keV and equipped with a LaB6 filament. Bright field (BF) and weak beam dark field (WBDF) conditions were applied to image the defects that were created by irradiation. In order to unambiguously identify dot-like objects as dislocation loops and to specify the Burgers vector, the diffraction vector, g , was varied, and visibility criteria were employed [24,25]. The resolution limit for dislocation loops in terms of diameter was about 1.5 nm.

3. Results

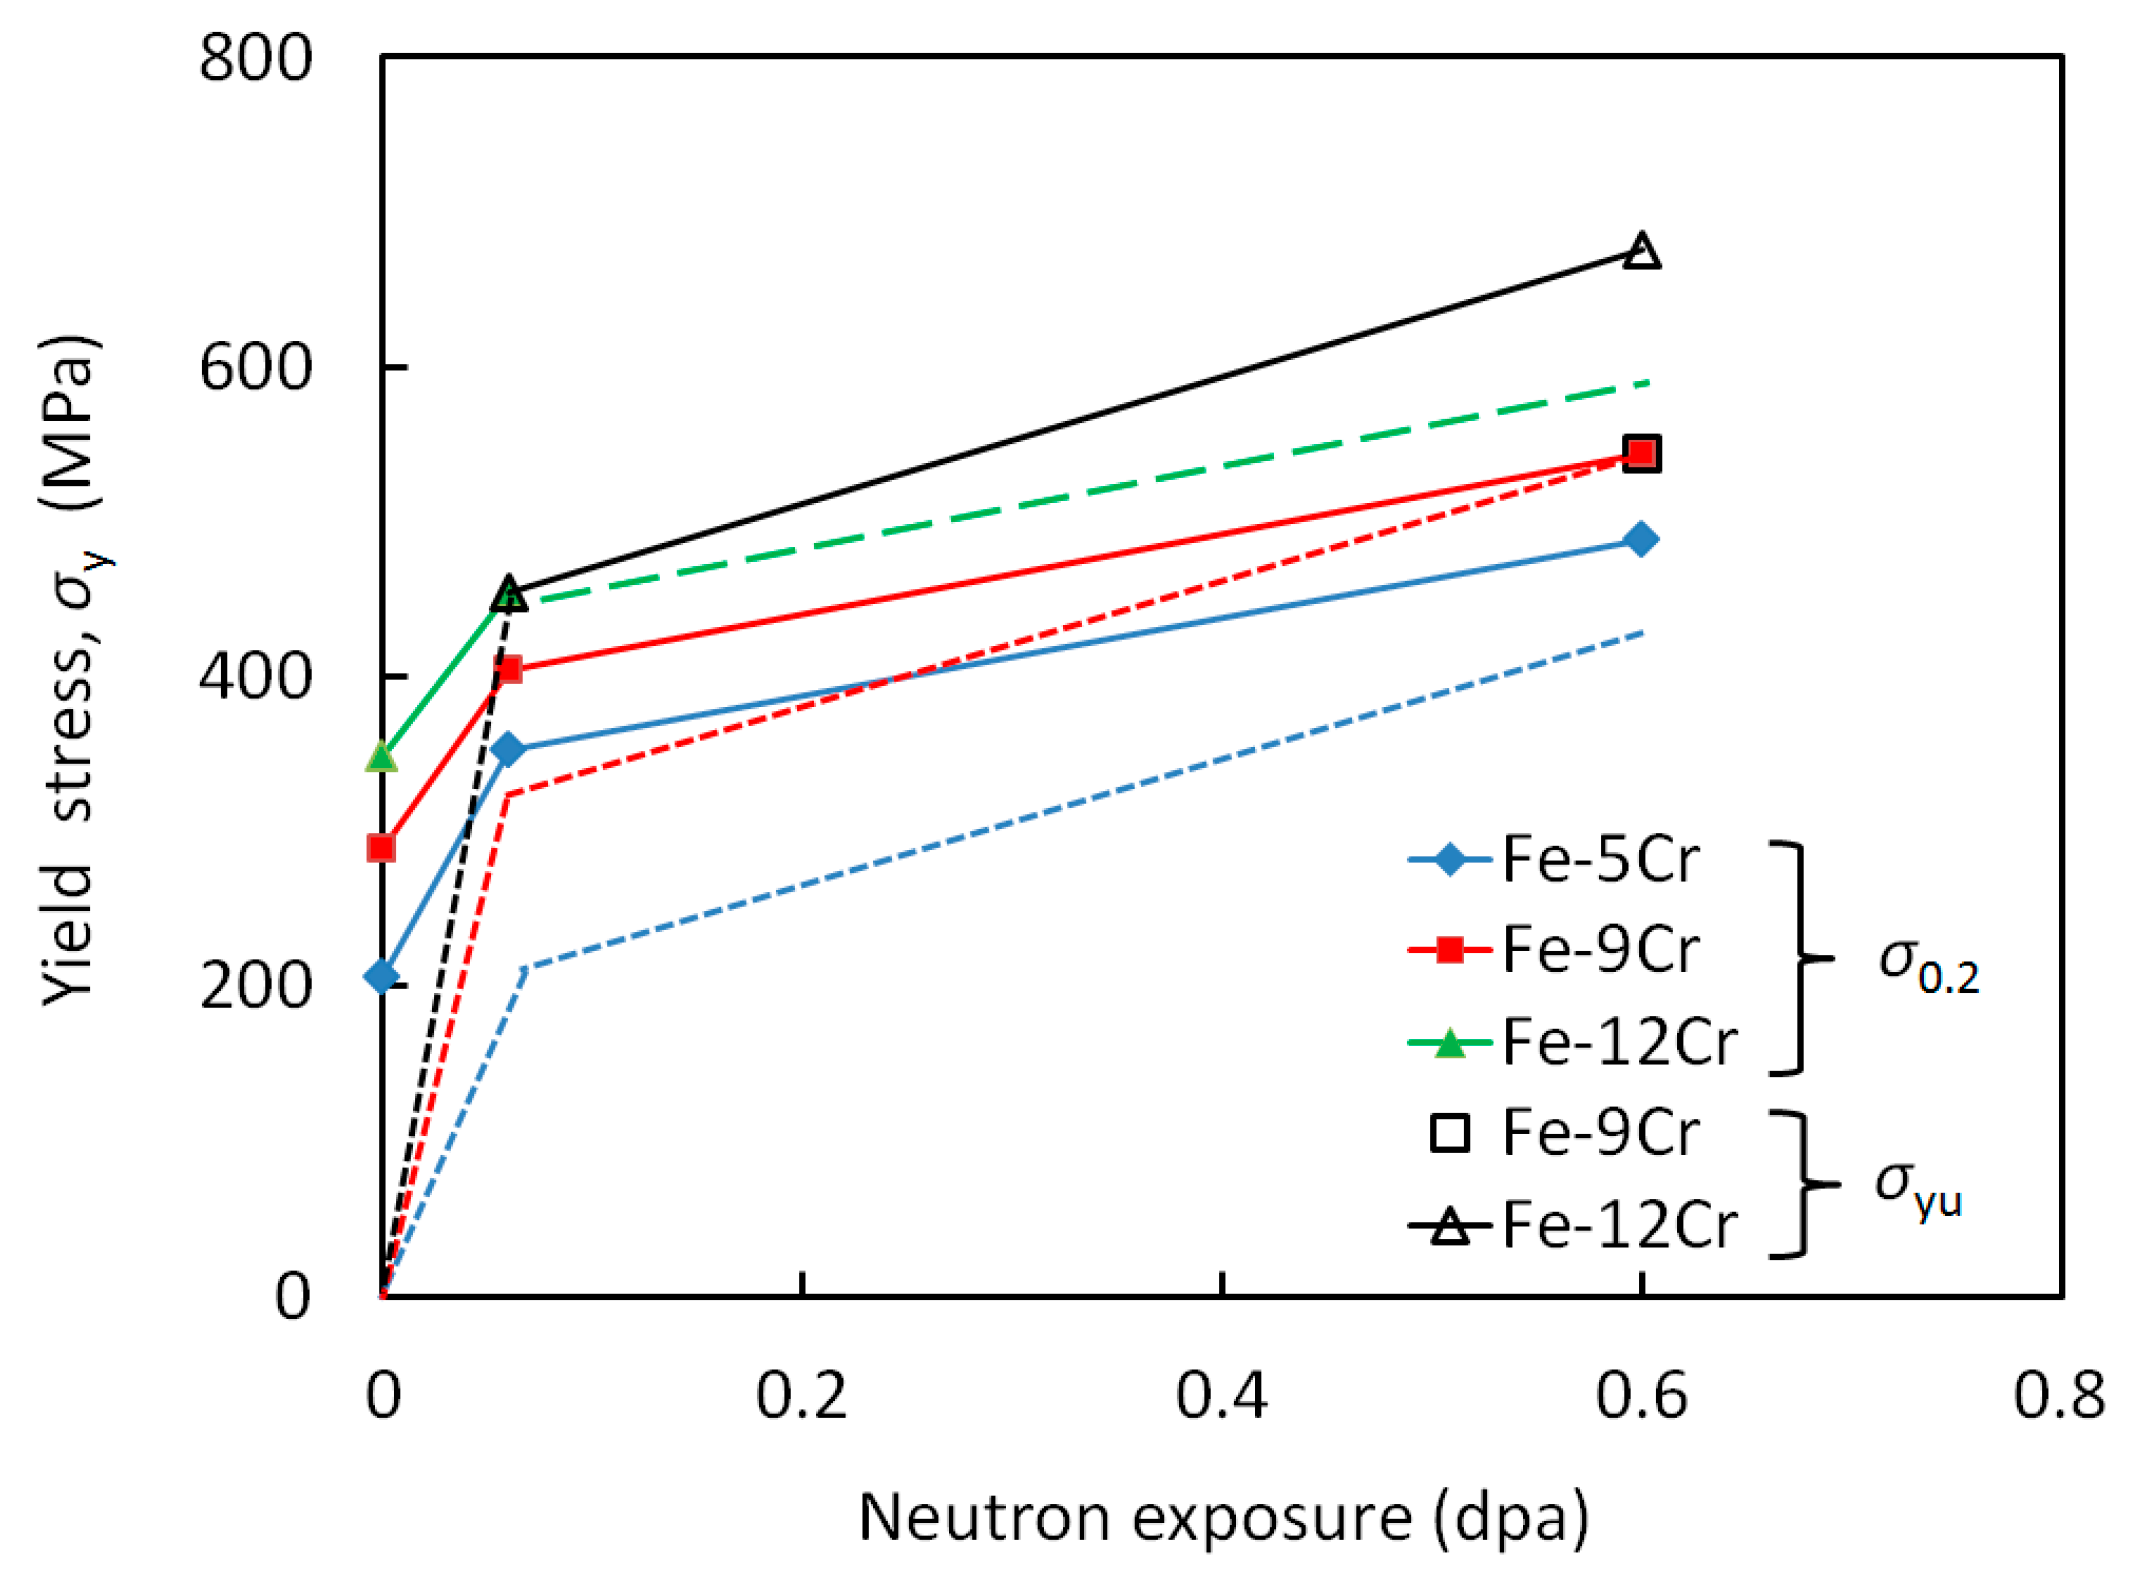
3.1. Stress-Strain Curves

The engineering stress-strain curves reported in [13] are replotted in Figure 1a for the unirradiated Fe-Cr alloys and in Figure 1b for the 0.6 dpa irradiations of the Fe-Cr alloys. Curves for pure Fe originating from the investigation reported in [21] (but not shown there) are included.
The curves for the unirradiated conditions invariably exhibited smooth elastic-plastic transitions. A pronounced yield drop was observed for the 0.6 dpa Fe-12Cr alloy. The Fe-5Cr alloy that was irradiated to 0.6 dpa did not exhibit a yield drop. Pure Fe that was irradiated to 0.2 dpa and Fe-9Cr that was irradiated to 0.6 dpa represented limit cases, i.e., there was neither a pronounced yield drop nor a smooth gradual elastic–plastic transition. The relevant set of results, including the 0.06 dpa irradiations [13], is listed in Table 2. From the complete original data set, e.g., Figures 4 and 10 in [13], it can be found that the uncertainty of the yield stress was within 10%.
The results are plotted in Figure 2 as functions of neutron exposure. A smooth elastic-plastic transition indicated that the stress required for a dislocation to overcome dispersed barriers (grain boundaries and forest dislocations were included under the heading of ‘dispersed barriers’) exceeded the stress required for a dislocation to unlock from a row of loops. Conversely, a yield drop indicated that the unlocking stress was higher. Limit cases were considered as situations for which barrier stress and unlocking stress roughly agreed. The colored full symbols in Figure 2 represent cases of smooth elastic-plastic transitions and limit cases. The respective solid lines just connect associated points for each material. These data points represent cases of DBH as opposed to SH. As the Fe-12Cr alloy that was irradiated up to 0.6 dpa exhibited a yield drop, the level of DBH remains unknown (no green triangle at 0.6 dpa in Figure 2). Based on the assumption of equal average slopes of yield stress versus exposure, the dashed green line was obtained via a parallel translation of the solid blue and red lines. The black open symbols represent cases of yield drops and limit cases. Again assuming equal slopes, the colored dotted lines were obtained via parallel translations of the solid black line for Fe-12Cr. The unlocking stress due to dislocation loops was zero for the unirradiated conditions.

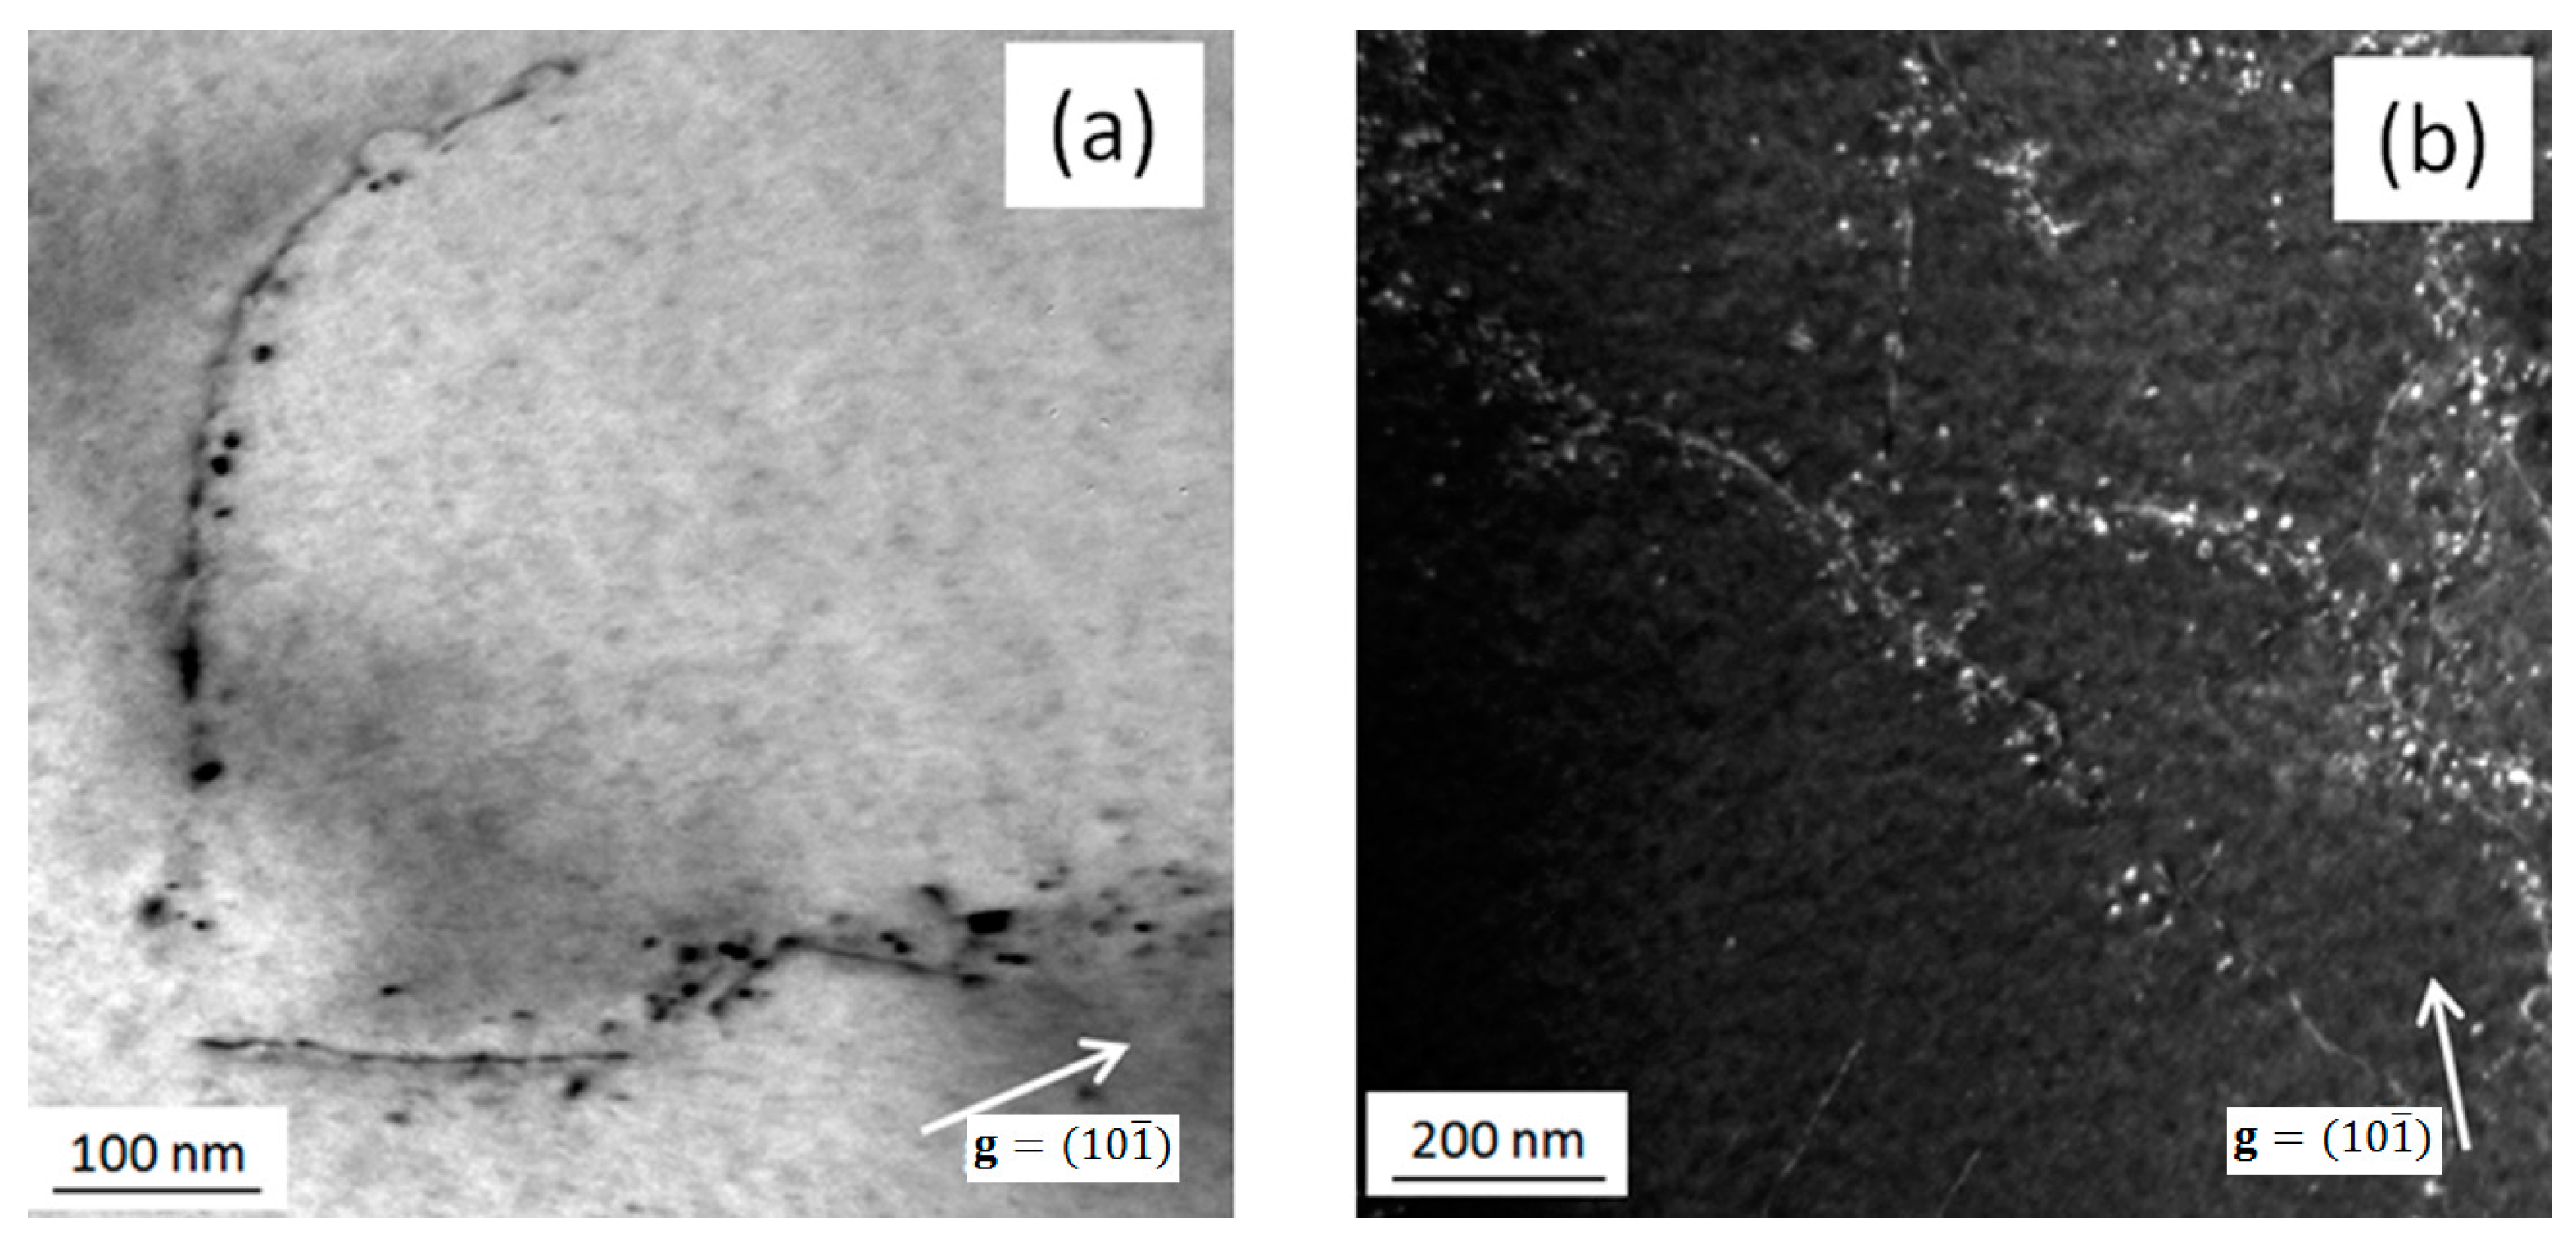
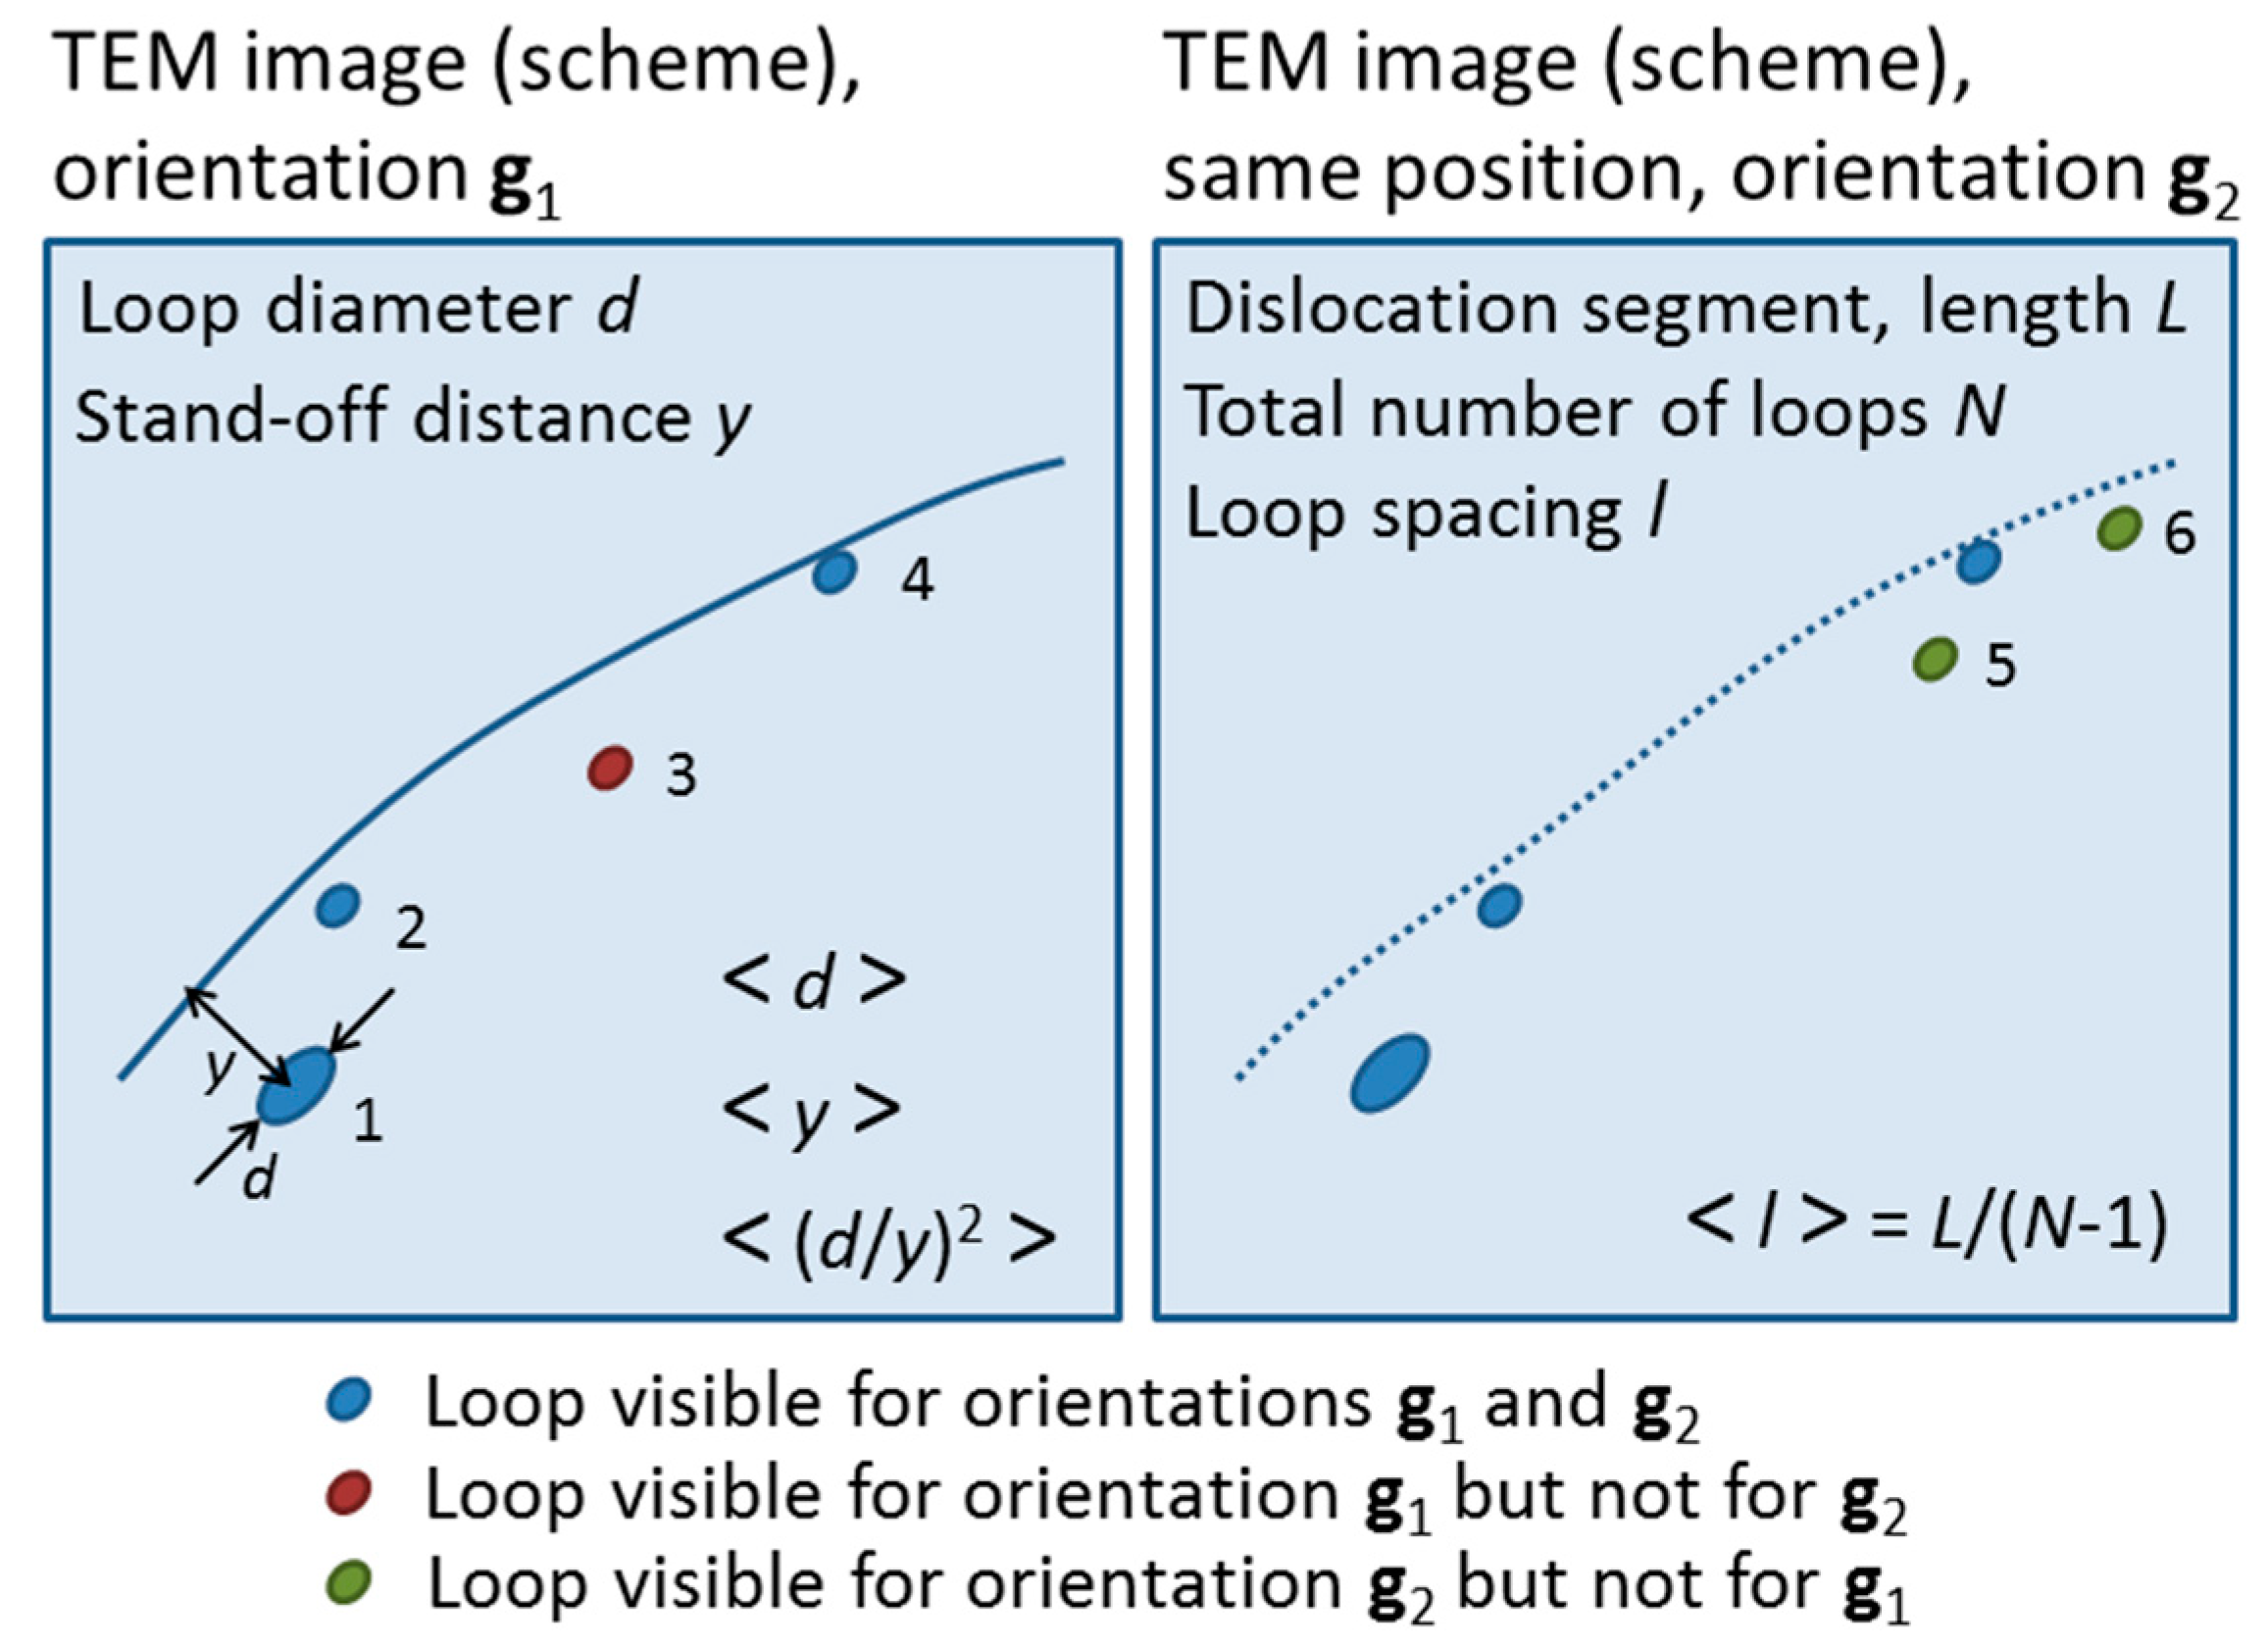
3.2. Irradiation-Induced Microstructure
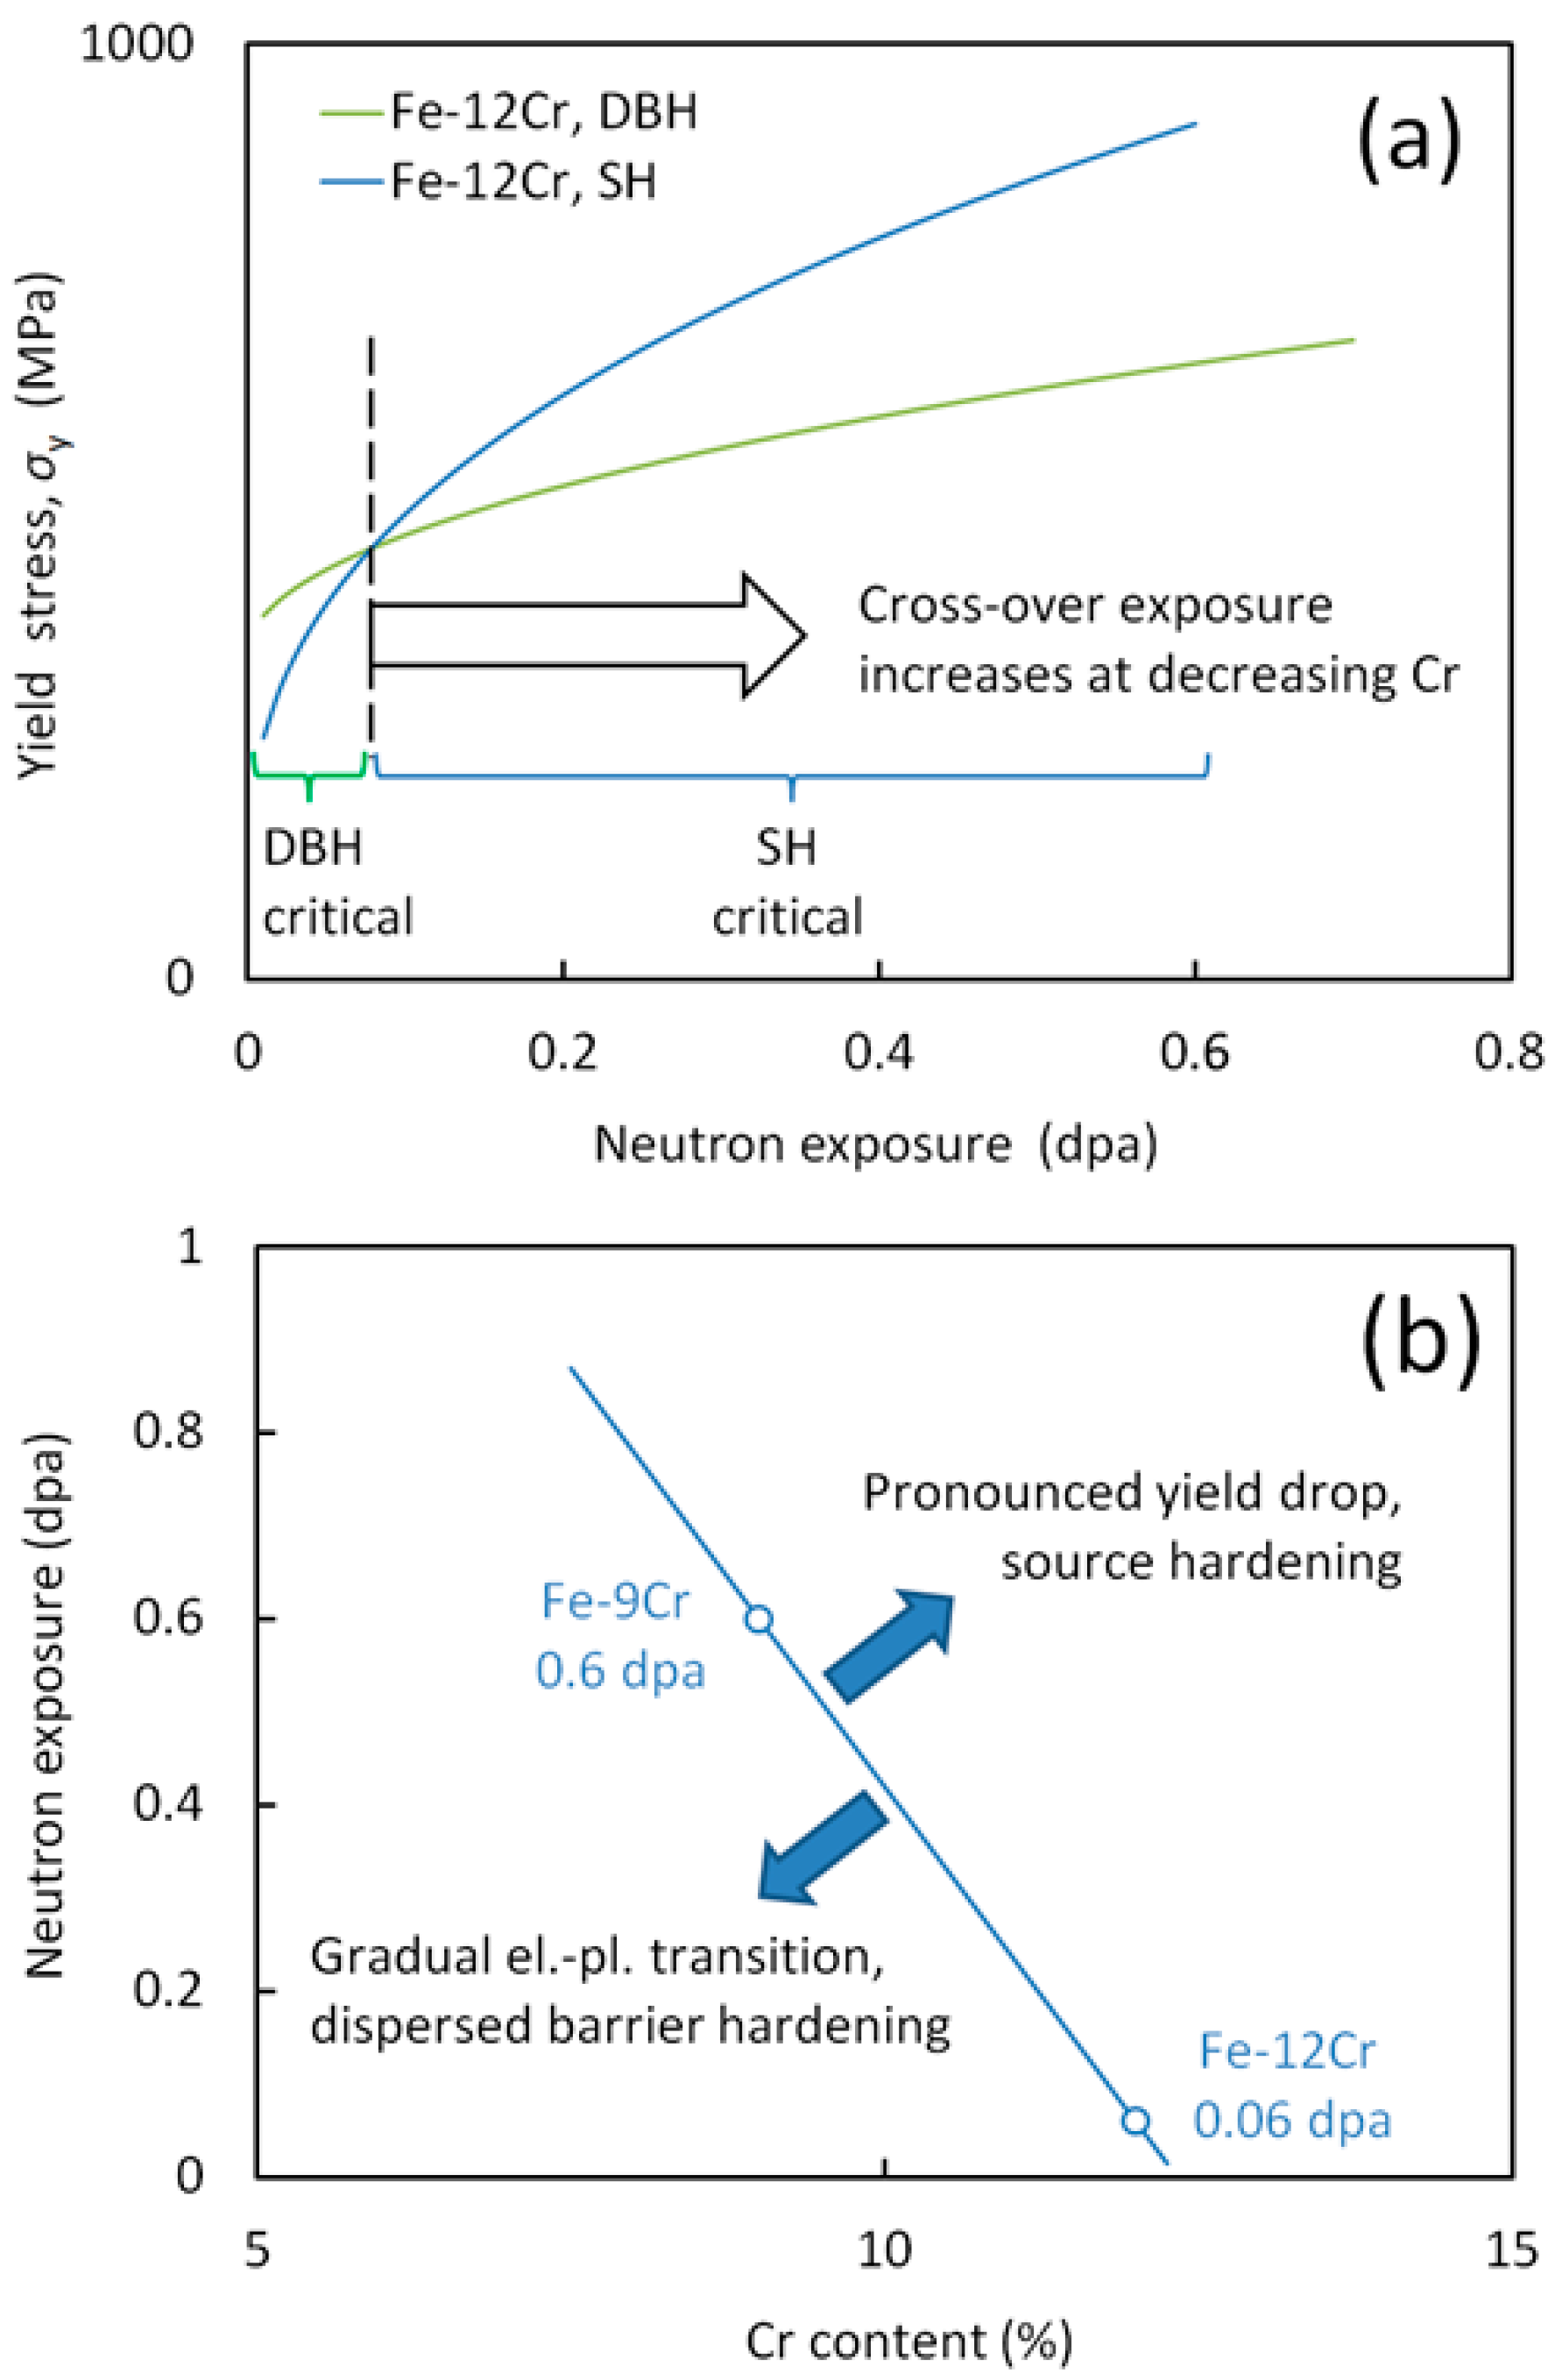
According to the TEM investigation of pure Fe irradiated up to 0.2 dpa [22], dislocation loops were distributed homogeneously in the matrix. However, the decoration of grown-in dislocations with irradiation-induced loops has also been reported [22]. A more detailed investigation of the spatial distribution was performed for the Fe-Cr alloys that were irradiated up to 0.6 dpa. Strongly non-homogeneous distributions of loops were observed, with a pronounced concentration along grain boundaries and dislocation lines, though there was a much smaller concentration of loops dispersed in the matrix. Two TEM micrographs that were obtained for one and the same area of the Fe-12Cr alloy that was irradiated to 0.6 dpa, when observed in different orientations indicated by the arrows, are exemplarily shown in Figure 3.
The micrographs of Figure 3 qualitatively represent other locations in Fe-12Cr. Figure 4 indicates that Fe-9Cr and Fe-5Cr also exhibited similar loop patterns. Differences were worked out by quantitative analyses, as shown below. The schematic representation in Figure 5, which refers to the situation in Figure 3, serves to illustrate the method of quantitative analysis of the size and spatial arrangement of loops and the definition of the quantities involved, as detailed below. It is important to note that only one decorated dislocation segment is shown in Figure 5 for the sake of clarity, whereas two decorated dislocation segments are clearly visible in Figure 3.
The loops were found to be mainly confined in a sector of the full angle around the dislocation, which was expected because of the dislocation strain field. The loop spacing l and the stand-off distance y differed from dislocation to dislocation and from segment to segment. Therefore, averaged quantities had to be used to obtain estimates of the unlocking stress. In order to derive estimates of d, l and y, we took into account the fact that some of the loops were invisible for g = ( 10 1 ¯ ) (see Figure 3a), some were invisible for g = (020) (see Figure 3b), and some were visible for both diffraction vectors, as indicated in Figure 5. In both cases, invisibility was impossible.
Estimates of the characteristics of the spatial distribution of loops were obtained for the Fe-12Cr alloy that was irradiated to 0.6 dpa, in particular for the upper right dislocation branch in Figure 3, which turned out to be (or to contain a significant component) of type <100> (b = 0.286 nm). We found that about 29% of the decorating loops were type <100>, and about 65% were type ½ <111>; however, the balance could not be decided with full certainty. It is worth mentioning that the percentages obtained here by tracking each individual loop from image to image can be considered to be more precise than the percentages obtained in [15] by way of the statistical g·b analysis. The same procedure was also applied to a dislocation (dominant component ½ <111>, b = 0.248 nm) in Fe-9Cr. The mean values of d, l, y and (d/y)2 that were derived for the 0.6 dpa irradiations of Fe-9Cr and Fe-12Cr are summarized in Table 3. The value of l was estimated as L/(N − 1) (see Figure 5). The values of d, y and (d/y)2 were individually measured for each loop and then averaged over the whole set of loops. It is important to note that <(d/y)2> differed considerably from (<d>/<y>)2.
Estimates of the unlocking stress σun that were obtained from Equation (2) by using the parameters listed in Table 3 are summarized in Table 4 along with the (possibly hidden) values of the upper yield stress σyu based on positive (“yes”) or limit cases in Table 2. For limit cases, it was assumed that the upper yield stress caused by source hardening did not differ much from the 0.2% proof stress. The estimates of σun given in Table 4 were based on values of M = 3.06 and G = 84 GPa chosen in accordance with [14]. Estimates of the unlocking stress are given for both observed types of dislocations (loops), namely with b = 0.248 nm for type ½ <111> and b = 0.286 nm for type <100>. The difference between these estimates indicates the error caused by variations of the dislocation type.
As already mentioned, dislocation decoration was occasionally observed for the 0.2 dpa Fe alloy [22], but the evidence is insufficient to perform a statistically sound estimation of the unlocking stress. Extended dislocation decoration was observed for the 0.6 dpa Fe-5Cr alloy, as seen in Figure 4b, but the stand-off distance was considerably (about three times) larger than for the Fe-9Cr and Fe-12Cr alloys. Therefore, it is doubtful to assume that all decorating loops in Fe-5Cr, including the most distant ones, simultaneously contributed to locking. Instead, dispersed-barrier hardening seemed to be dominant [14], which was consistent with the observed smooth elastic-plastic transition.

4. Discussion

The basic findings of the present study are the observations of both a yield phenomenon at the macroscale and dislocation decoration by irradiation-induced loops at the nanoscale. These findings appear to be mutually linked. It is interesting to note that smooth elastic-plastic transitions were reported for unirradiated and neutron-irradiated (0.015 and 1.2 dpa, irradiation temperature 60–100 °C) 9% Cr ferritic/martensitic steels [26]. Loop distributions were not reported. Moreover, self-ion irradiation (<0.1–13 dpa, 300 °C) was found to give rise to the formation of dislocation loops in ultra-high-purity Fe and Fe-8Cr [27,28]. Though loops were observed to align in rows, a pronounced tendency of loops to decorate grown-in dislocations was not reported. Obviously, both the yield phenomenon and dislocation decoration are not just functions of Cr and exposure—they are also functions of other factors such as alloy impurity content and irradiation conditions. Therefore, the analysis performed here is specific for the present set of materials fabricated, irradiated and tested under consistent conditions.
Based on the results compiled in Table 2, including errors within 10%, we found that the effects of both the Cr content and the neutron exposure on the yield stress are significant. In particular, the upper yield stress of the Fe-12Cr alloy that was irradiated to 0.6 dpa is significantly higher than the yield stress of the Fe-9Cr alloy that was irradiated to 0.6 dpa. The trend of σun with decreasing Cr content from 12% to 9% Cr follows the trend measured for the upper yield stress. This conformity qualitatively extends to 5% Cr. Indeed, the larger average stand-off distance observed for Fe-5Cr gives rise to a smaller unlocking stress according to Equation (2) and is consistent with both the dominance of DBH over SH, the smooth elastic–plastic transition, and the smaller value of the yield stress.
The deviations between the measured values of the upper yield stress and the estimated values of the unlocking stress are larger than the errors of the measured yield stress. It can be concluded that these errors are not the major reason of the observed deviations. In fact, the idealizations involved in both the analysis performed above and the derivation of Equation (2) [4,5] are mainly responsible for the deviations between measured values of σyu and estimated values of σun. For example, there is a pronounced effect of the uncertainty with respect to the dislocation type, as indicated in Table 4 (fourth versus fifth column). However, taking into account the approximate nature of Equation (2), the estimates based on the SH model are still reasonably consistent with the measured upper yield stress. It is interesting to note that the difference between the unlocking stresses estimated for 9% and 12% Cr is mainly due to the difference between the mean spacings of loops, while the (d/y)2-values coincidentally almost agree (see Table 3).
More advanced models of dislocation unlocking based on dislocation dynamics simulations have been applied to Cu [29] and Fe [30]. In these simulations, idealized or simulated loop distributions along grown-in dislocations were used. The present experimental results may be useful as a means of calibration or cross-check of a corresponding model for Fe-Cr. In the case of pure Fe, the unlocking stress indicated above is at least not inconsistent with the results reported in [30].
The competition between DBH and SH now remains to be considered. As no yield effect was observed for the unirradiated Fe and Fe-Cr alloys of this study, we can conclude that SH does not play a significant role before irradiation. It is well known (and partly reflected in Figure 2) that DBH, according to Equation (1), increases as a function of neutron exposure (with a possible saturation at higher exposures) [13,14]. It is also reasonable to assume (and is partly reflected in Figure 2) that SH increases as function of exposure. The present findings indicate that, for increasing neutron exposure, the contribution of SH to a measured yield stress increases at a higher rate than the contribution of DBH; see Figure 2. This gives rise to a cross-over from the dominance of DBH accompanied by a smooth elastic-plastic transition to the dominance of SH accompanied by a yield drop. The transition tends to be shifted to higher levels of neutron exposure for lower Cr contents. The situation is schematically depicted in Figure 6a, which is based on the observations shown in Figure 2. The mapping of the dominance regions of DBH and SH as functions of Cr content and neutron exposure (linear interpolation) is suggested in Figure 6b. According to this kind of map, DBH is favorable at lower Cr contents and exposures, while SH is favorable at higher Cr contents and exposures, the cross-over exposure being a descending function of Cr. The dpa that correspond to the cross-over point might bear a connection with the dose for the onset of slip localization [31].
Finally, the application of the DBH model in [14] requires reconsideration with respect to the role of SH. The yield stress increase measured for the 0.6 dpa Fe-12Cr alloy, which entered the system of equations of the type of Equation (1) [14], is expected to be an overestimation of barrier hardening because of the observed yield drop and the related contribution of source hardening that was not considered in [14]. This may indeed have altered the results of the analysis. However, the overestimation is expected to be within the contribution of loops to the total yield stress increase, which was about 15% [14]. A recalculation that was done by using an accordingly reduced yield stress increase produced values of the obstacle strength within the ranges of error of the previous estimates. For the reduced yield stress increase, the fit was marginally better. However, the present investigation shows that the consideration of SH may be crucial for higher neutron exposures and higher Cr contents.
In summary, a consistent picture of the occurrence of yield points in engineering tensile stress-strain curves, observations of dislocation decoration by means of TEM, and the application of a source hardening model has been provided for the studied set of neutron-irradiated Fe-Cr alloys. Hardening was found to undergo a transition from the dominance of dispersed-barrier hardening to the dominance of source hardening at increasing neutron exposure for Fe-9Cr and Fe-12Cr. The transition tends to be shifted to higher levels of neutron exposure for lower Cr contents. The estimated values of the unlocking stress and the measured values of the upper yield stress are reasonably consistent in the dominance region of source hardening.

Author Contributions

Conceptualization, F.B. and L.M.; methodology, F.B. and M.H.-M.; formal analysis, F.B. and M.H.-M.; investigation, F.B., M.H.-M., C.H., M.J.K., L.M. and C.P.; resources, M.H.-M., M.K. and L.M.; writing—original draft preparation, F.B.; writing—review and editing, F.B., M.H.-M., C.H., M.J.K., L.M. and C.P.; funding acquisition, F.B., M.H.-M., M.J.K., L.M. and C.P. All authors have read and agreed to the published version of the manuscript.

Funding

This research was funded by the EUROPEAN COMMISSION, grant numbers 212175 (GETMAT), 604862 (MatISSE) and 755039 (M4F).

Acknowledgments

This work contributes to the Joint Programme on Nuclear Materials (JPNM) of the European Energy Research Alliance (EERA).

Conflicts of Interest

The authors declare no conflict of interest.

References

  1. Orowan, E. Symposium on Internal Stresses in Metals and Alloys; The Institute of Metals: London, UK, 1948. [Google Scholar]
  2. Seeger, A.K. On the theory of radiation damage and radiation hardening. In Proceedings of the Second United Nations International Conference on The Peaceful Uses of Atomic Energy, Geneva, Switzerland, 1–13 September 1958; Volume 6, pp. 250–273. [Google Scholar]
  3. Bacon, D.J.; Kocks, U.F.; Scattergood, R.O. The effect of dislocation self-interaction on the Orowan stress. Philos. Mag. 1973, 28, 1241–1263. [Google Scholar] [CrossRef]
  4. Singh, B.N.; Foreman, A.J.E.; Trinkaus, H. Radiation hardening revisited: Role of intracascade clustering. J. Nucl. Mater. 1997, 249, 103–115. [Google Scholar] [CrossRef]
  5. Trinkaus, H.; Singh, B.N.; Foreman, A.J.E. Segregation of cascade induced interstitial loops at dislocations: Possible effect on initiation of plastic deformation. J. Nucl. Mater. 1997, 251, 172–187. [Google Scholar] [CrossRef]
  6. Diaz de la Rubia, T.; Zbib, H.M.; Khraishi, T.A.; Wirth, B.D.; Victoria, M.; Caturla, M.J. Multiscale modelling of plastic flow localization in irradiated materials. Nature 2000, 406, 871–874. [Google Scholar] [CrossRef]
  7. Kroupa, P. The interaction between prismatic dislocation loops and straight dislocations. part I. Philos. Mag. 1961, 7, 783–801. [Google Scholar] [CrossRef]
  8. Robertson, I.M.; Jenkins, M.L.; English, C.A. Low-dose neutron-irradiation damage in α-iron. J. Nucl. Mater. 1982, 108–109, 209–221. [Google Scholar] [CrossRef]
  9. Eldrup, M.; Singh, B.N.; Zinkle, S.J.; Byun, T.S.; Farrell, K. Dose dependence of defect accumulation in neutron irradiated copper and iron. J. Nucl. Mater. 2002, 307–311, 912–917. [Google Scholar] [CrossRef]
  10. Luft, A. Microstructural processes of plastic instabilities in strengthened metals. Prog. Mater. Sci. 1991, 35, 97–204. [Google Scholar] [CrossRef]
  11. Zinkle, S.J.; Singh, B.N. Microstructure of neutron-irradiated iron before and after tensile deformation. J. Nucl. Mater. 2006, 351, 269–284. [Google Scholar] [CrossRef]
  12. Cottrell, A.H.; Bilby, B.A. Dislocation theory of yielding and strain ageing of iron. Proc. Phys. Soc. A 1949, 62, 49–62. [Google Scholar] [CrossRef]
  13. Matijasevic, M.; Almazouzi, A. Effect of Cr on the mechanical properties and microstructure of Fe–Cr model alloys after n-irradiation. J. Nucl. Mater. 2008, 377, 147–154. [Google Scholar] [CrossRef]
  14. Bergner, F.; Pareige, C.; Hernández-Mayoral, M.; Malerba, L.; Heintze, C. Application of a three-feature dispersed-barrier hardening model to neutron-irradiated Fe–Cr model alloys. J. Nucl. Mater. 2014, 448, 96–102. [Google Scholar] [CrossRef]
  15. Hernandez-Mayoral, M.; Heintze, C.; Oñorbe, E. Transmission electron microscopy investigation of the microstructure of Fe-Cr alloys induced by neutron and ion irradiation at 300 °C. J. Nucl. Mater. 2016, 474, 88–98. [Google Scholar] [CrossRef]
  16. Kuksenko, V.; Pareige, C.; Pareige, P. Cr precipitation in neutron irradiated industrial purity Fe–Cr model alloys. J. Nucl. Mater. 2013, 432, 160–165. [Google Scholar] [CrossRef]
  17. Heintze, C.; Bergner, F.; Ulbricht, A.; Eckerlebe, H. The microstructure of neutron-irradiated Fe–Cr alloys: A small-angle neutron scattering study. J. Nucl. Mater. 2011, 409, 106–111. [Google Scholar] [CrossRef]
  18. Lambrecht, M.; Malerba, L. Positron annihilation spectroscopy on binary Fe–Cr alloys and ferritic/martensitic steels after neutron irradiation. Acta Mater. 2011, 59, 6547–6555. [Google Scholar] [CrossRef]
  19. Konstantinović, M.J.; Van Renterghem, W.; Matijašević, M.; Minov, B.; Lambrecht, M.; Toyama, T.; Chiapetto, M.; Malerba, L. Mechanical and microstructural properties of neutron irradiated Fe–Cr–C alloys. Phys. Status Solidi A 2016, 213, 2988–2994. [Google Scholar] [CrossRef]
  20. Norgett, M.J.; Robinson, M.T.; Torrens, I.M. A proposed method of calculating displacement dose rates. Nucl. Eng. Des. 1975, 33, 50–54. [Google Scholar] [CrossRef]
  21. Lambrecht, M.; Malerba, L.; Almazouzi, A. Influence of different chemical elements on irradiation-induced hardening embrittlement of RPV steels. J. Nucl. Mater. 2008, 378, 282–290. [Google Scholar] [CrossRef]
  22. Hernández-Mayoral, M.; Gómez-Briceño, D. Transmission electron microscopy study on neutron irradiated pure iron and RPV model alloys. J. Nucl. Mater. 2010, 399, 146–153. [Google Scholar] [CrossRef]
  23. Bergner, F.; Ulbricht, A.; Hernandez-Mayoral, M.; Pranzas, P.K. Small-angle neutron scattering study of neutron-irradiated iron and an iron–nickel alloy. J. Nucl. Mater. 2008, 374, 334–337. [Google Scholar] [CrossRef]
  24. Edington, J.W. Practical Electron Microscopy in Materials Science; Macmillan, Philips Technical Library: London, UK, 1975. [Google Scholar]
  25. Jenkins, M.L.; Kirk, M.A. Characterization of Radiation Damage by Transmission Electron Microscopy; Institute of Physics: Bristol, UK, 2001. [Google Scholar]
  26. Farrell, K.; Byun, T.S. Tensile properties of ferritic/martensitic steels irradiated in HFIR, and comparison with spallation irradiation data. J. Nucl. Mater. 2003, 318, 274–282. [Google Scholar] [CrossRef]
  27. Yao, Z.; Hernández-Mayoral, M.; Jenkins, M.L.; Kirk, M.A. Heavy-ion irradiations of Fe and Fe-Cr model alloys Part 1: Damage evolution in thin-foils at lower doses. Philos. Mag. 2008, 88, 2851–2880. [Google Scholar] [CrossRef] [Green Version]
  28. Hernández-Mayoral, M.; Yao, Z.; Jenkins, M.L.; Kirk, M.A. Heavy-ion irradiations of Fe and Fe-Cr model alloys Part 2: Damage evolution in thin-foils at higher doses. Philos. Mag. 2008, 88, 2881–2897. [Google Scholar] [CrossRef]
  29. Khraishi, T.A.; Zbib, H.M.; Diaz de la Rubia, T.; Victoria, M. Localized Deformation and Hardening in Irradiated Metals: Three-Dimensional Discrete Dislocation Dynamics Simulations. Metall. Mater. Trans. B 2002, 33B, 285–296. [Google Scholar] [CrossRef]
  30. Wen, M.; Takahashi, A.; Ghoniem, N.M. Kinetics of self-interstitial cluster aggregation near dislocations and their influence on hardening. J. Nucl. Mater. 2009, 392, 386–395. [Google Scholar] [CrossRef]
  31. Farrell, K.; Byun, T.S.; Hashimoto, N. Deformation mode maps for tensile deformation of neutron-irradiated structural alloys. J. Nucl. Mater. 2004, 335, 471–486. [Google Scholar] [CrossRef]
Figure 1. Measured engineering stress-strain curves. (a) Unirradiated and (b) irradiated conditions of the same alloys (0.2 displacements per atom (dpa) for Fe and 0.6 dpa for Fe-Cr alloys).
Metals 10 00147 g001
Figure 2. Yield stress versus neutron exposure for the Fe-Cr alloys. The meaning of the types of lines is explained in the main text. Errors of the yield stress were within 10%.
Metals 10 00147 g002
Figure 3. TEM weak-beam dark-field images of a dislocation decorated with loops for the Fe-12Cr alloy that was irradiated to 0.6 dpa. (a) Diffraction vector g = ( 10 1 ¯ ) ; (b) same detail, g = ( 020 ) .
Metals 10 00147 g003
Figure 4. (a) TEM bright field image of the 0.6 dpa Fe-9Cr alloy and (b) weak-beam dark-field image of the 0.6 dpa Fe-5Cr alloy.
Metals 10 00147 g004
Figure 5. Schematic view of a dislocation segment and loops in a TEM image. <·> denotes arithmetic average.
Metals 10 00147 g005
Figure 6. (a) Schematic representation of the cross-over from dispersed-barrier hardening (DBH) dominance to source hardening (SH) dominance for Fe-12Cr. (b) The mapping of the dominance regions of DBH and SH as function of Cr content and neutron exposure.
Metals 10 00147 g006
Table 1. Composition of the investigated alloys in at%.
AlloyMnSiPSCrNiOCN
Fe-5Cr0.020.080.020.014.930.060.210.090.05
Fe-9Cr0.030.180.020.018.930.070.230.090.06
Fe-12Cr0.030.220.090.01212.330.0850.220.130.09
Table 2. Appearance of yield drops (yes, no, or limit case) and measured average yield stress (0.2% proof stress σ0.2 or upper yield stress σyu, whichever was applicable) in units of MPa. The error of the yield stress was typically within 10%.
AlloyUnirradiated0.06 dpa0.2 dpa0.6 dpa
Feno/102-limit case/222-
Fe–5Crno/206no/352-no/489
Fe–9Crno/289no/404-limit case/544
Fe–12Crno/349limit case/454-yes/676
Table 3. Mean values of size d, spacing l, stand-off distance y, and (d/y)2 derived from the TEM analyses performed for the 0.6 dpa irradiations.
Alloyd (nm)l (nm)y (nm)(d/y)2 *
Fe-9Cr4.01610.50.886
Fe-12Cr5.211100.885
* Averaging was performed over individual values of (d/y)2.
Table 4. Upper yield stress, σyu, derived from positive (‘yes’) or limit cases in Table 2, and unlocking stress, σun, derived from Equation (2).
AlloyExposure (dpa)σyu (MPa)σun (MPa) b = 0.248 nmσun (MPa)
b = 0.286 nm
Fe0.2≈222**
Fe-5Cr0.6none or <489**
Fe-9Cr0.6≈544353407
Fe-12Cr0.6676513591
* Dislocation decoration was observed, but Equation (2) was not applied for reasons explained in the main text.

