Critical Strain for Dynamic Recrystallisation. The Particular Case of Steels


Abstract
1. Introduction
2. Literature Review
2.1. Metallographic Determination
2.2. Analytical Expressions for εc or εp
2.3. Methods to Calculate εc
2.4. Calculation of the Critical Strain Ratio by Applying Constitutive Models
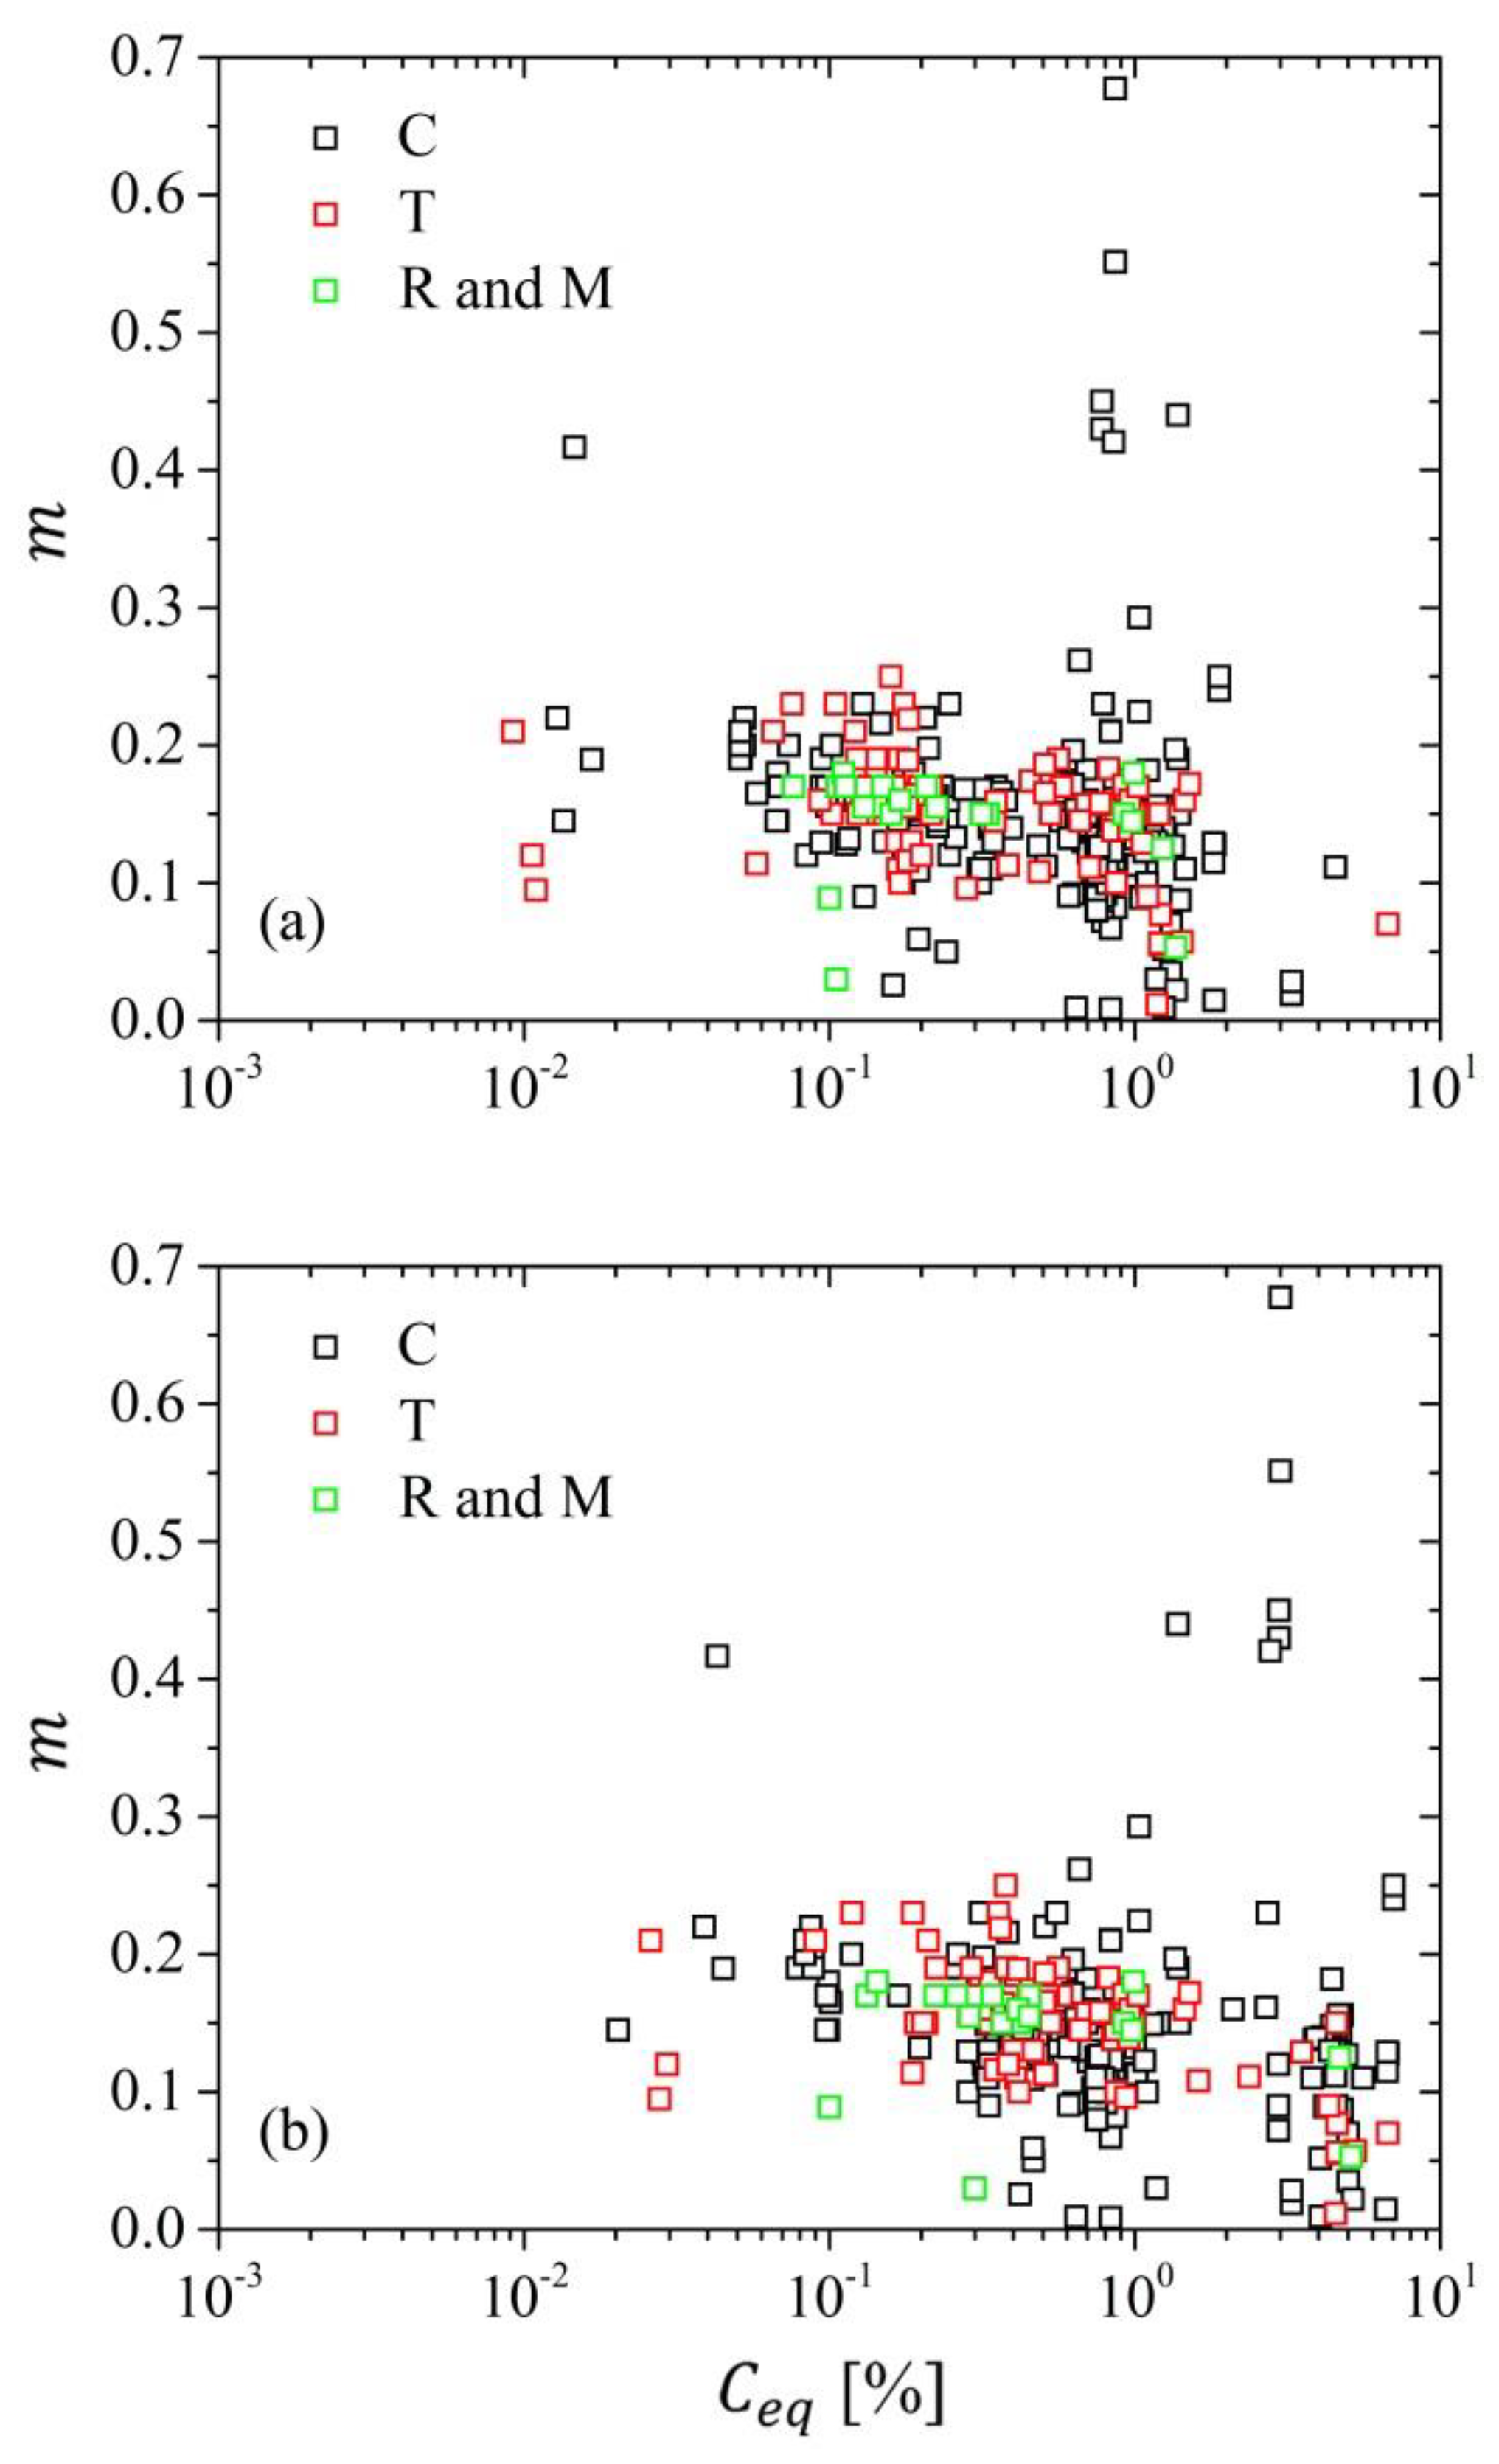
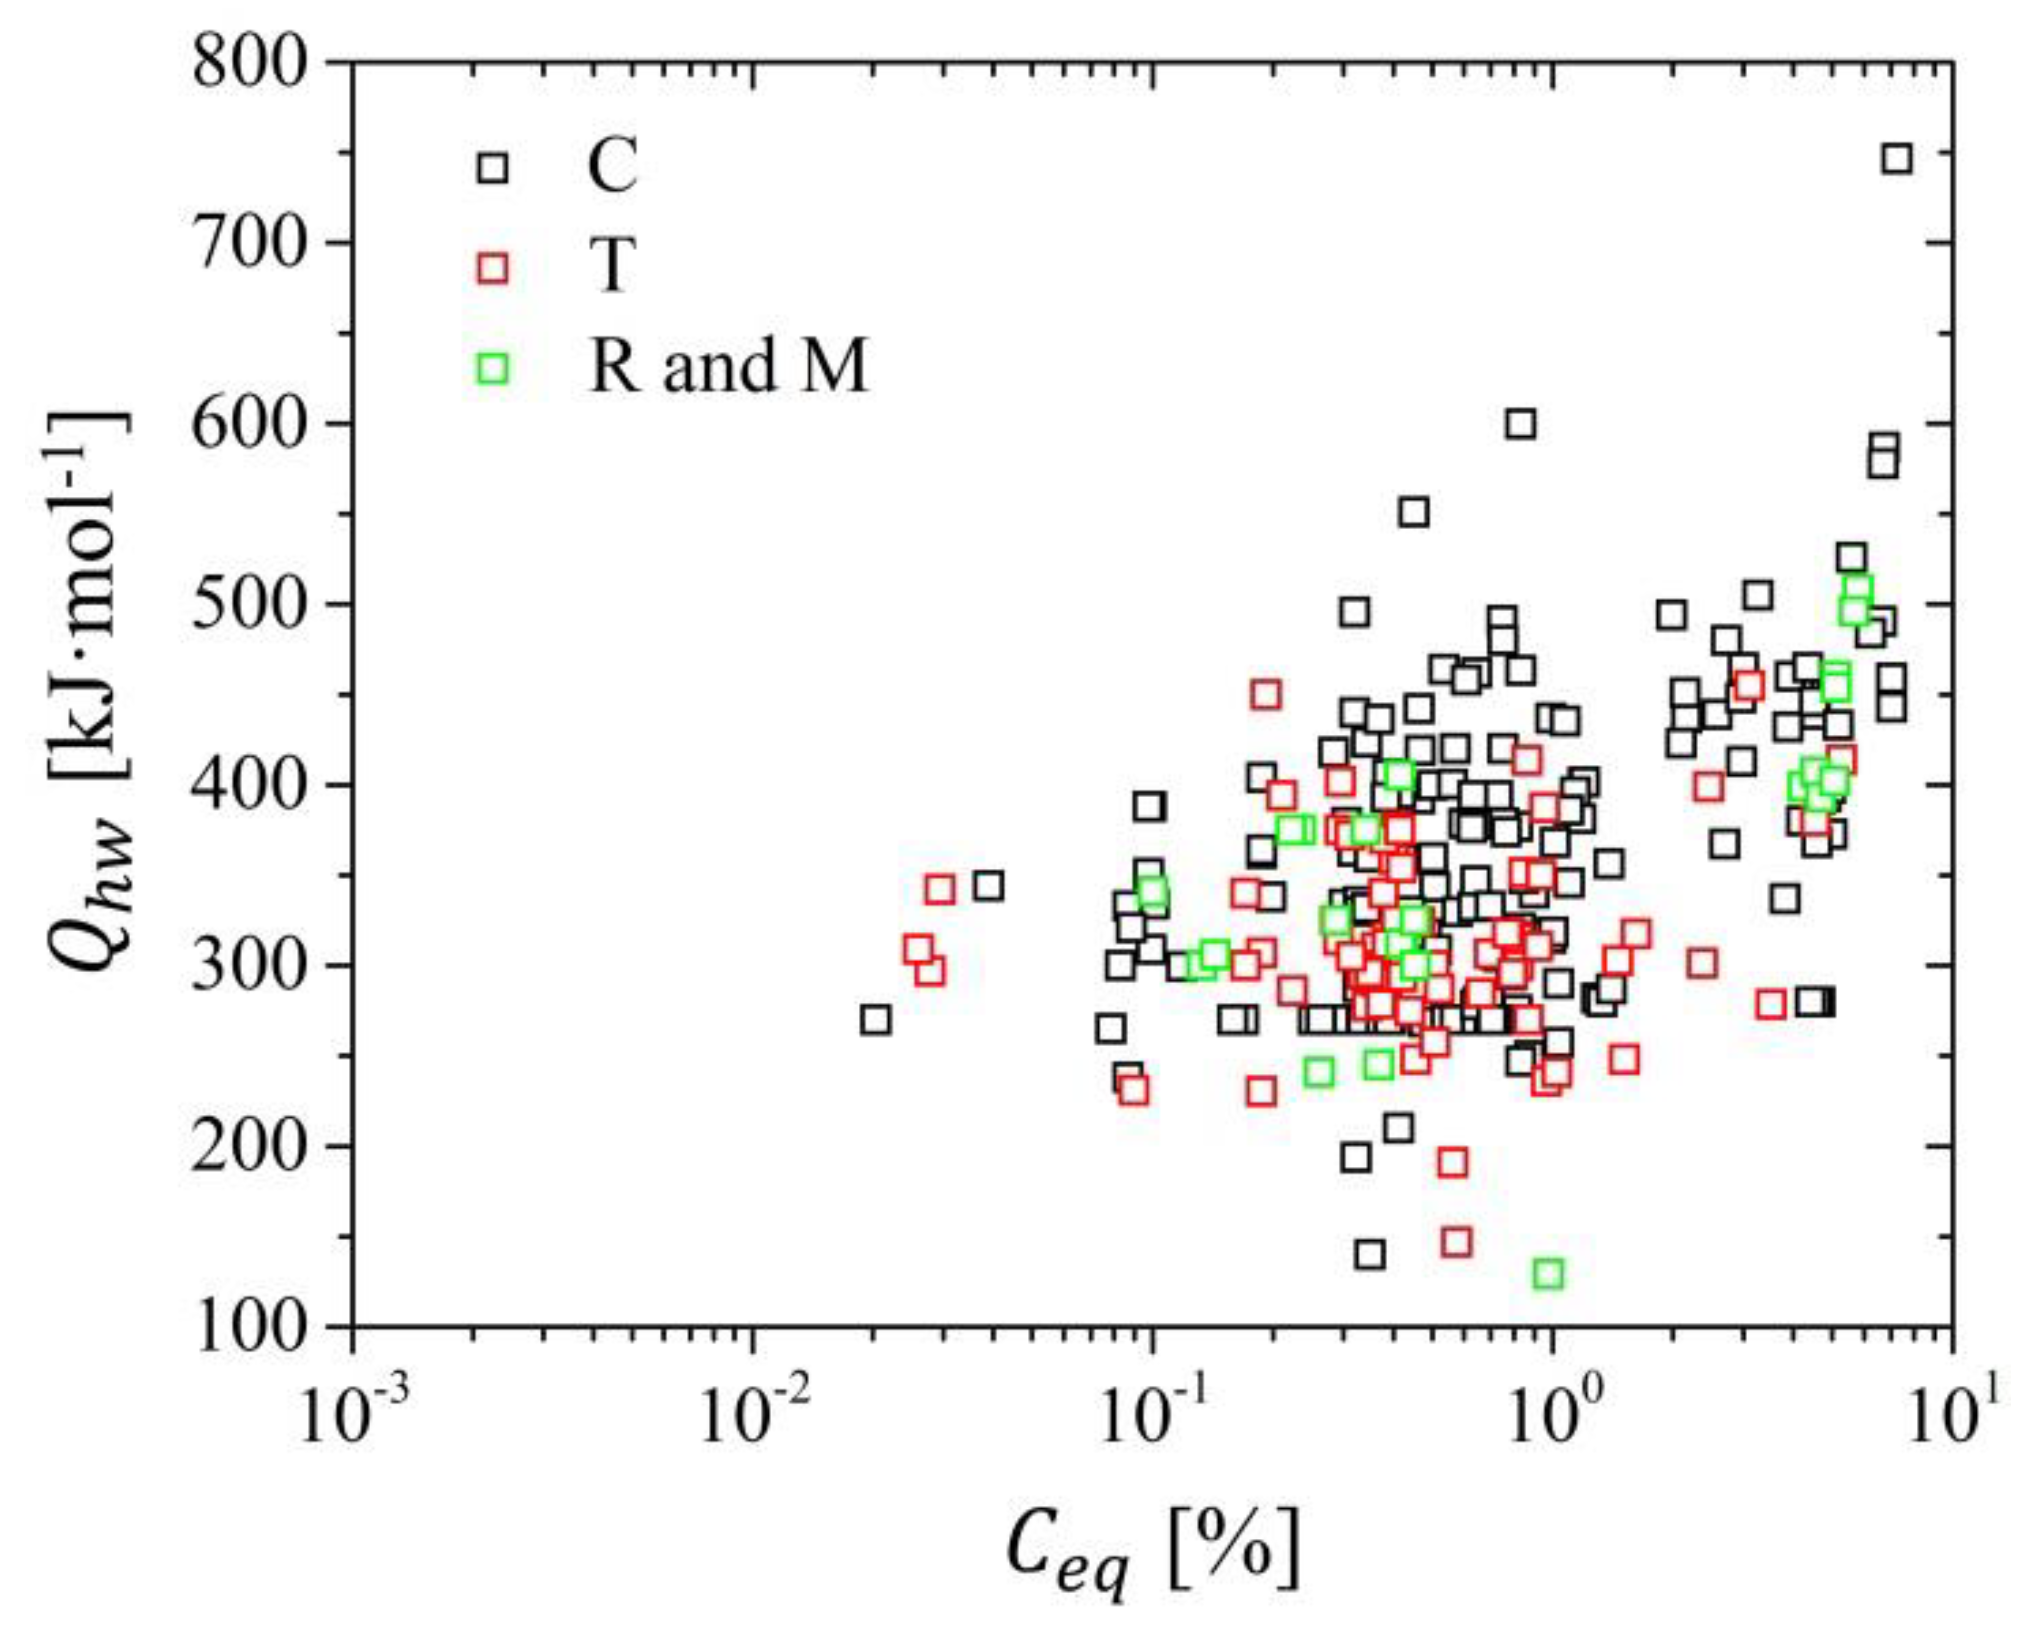
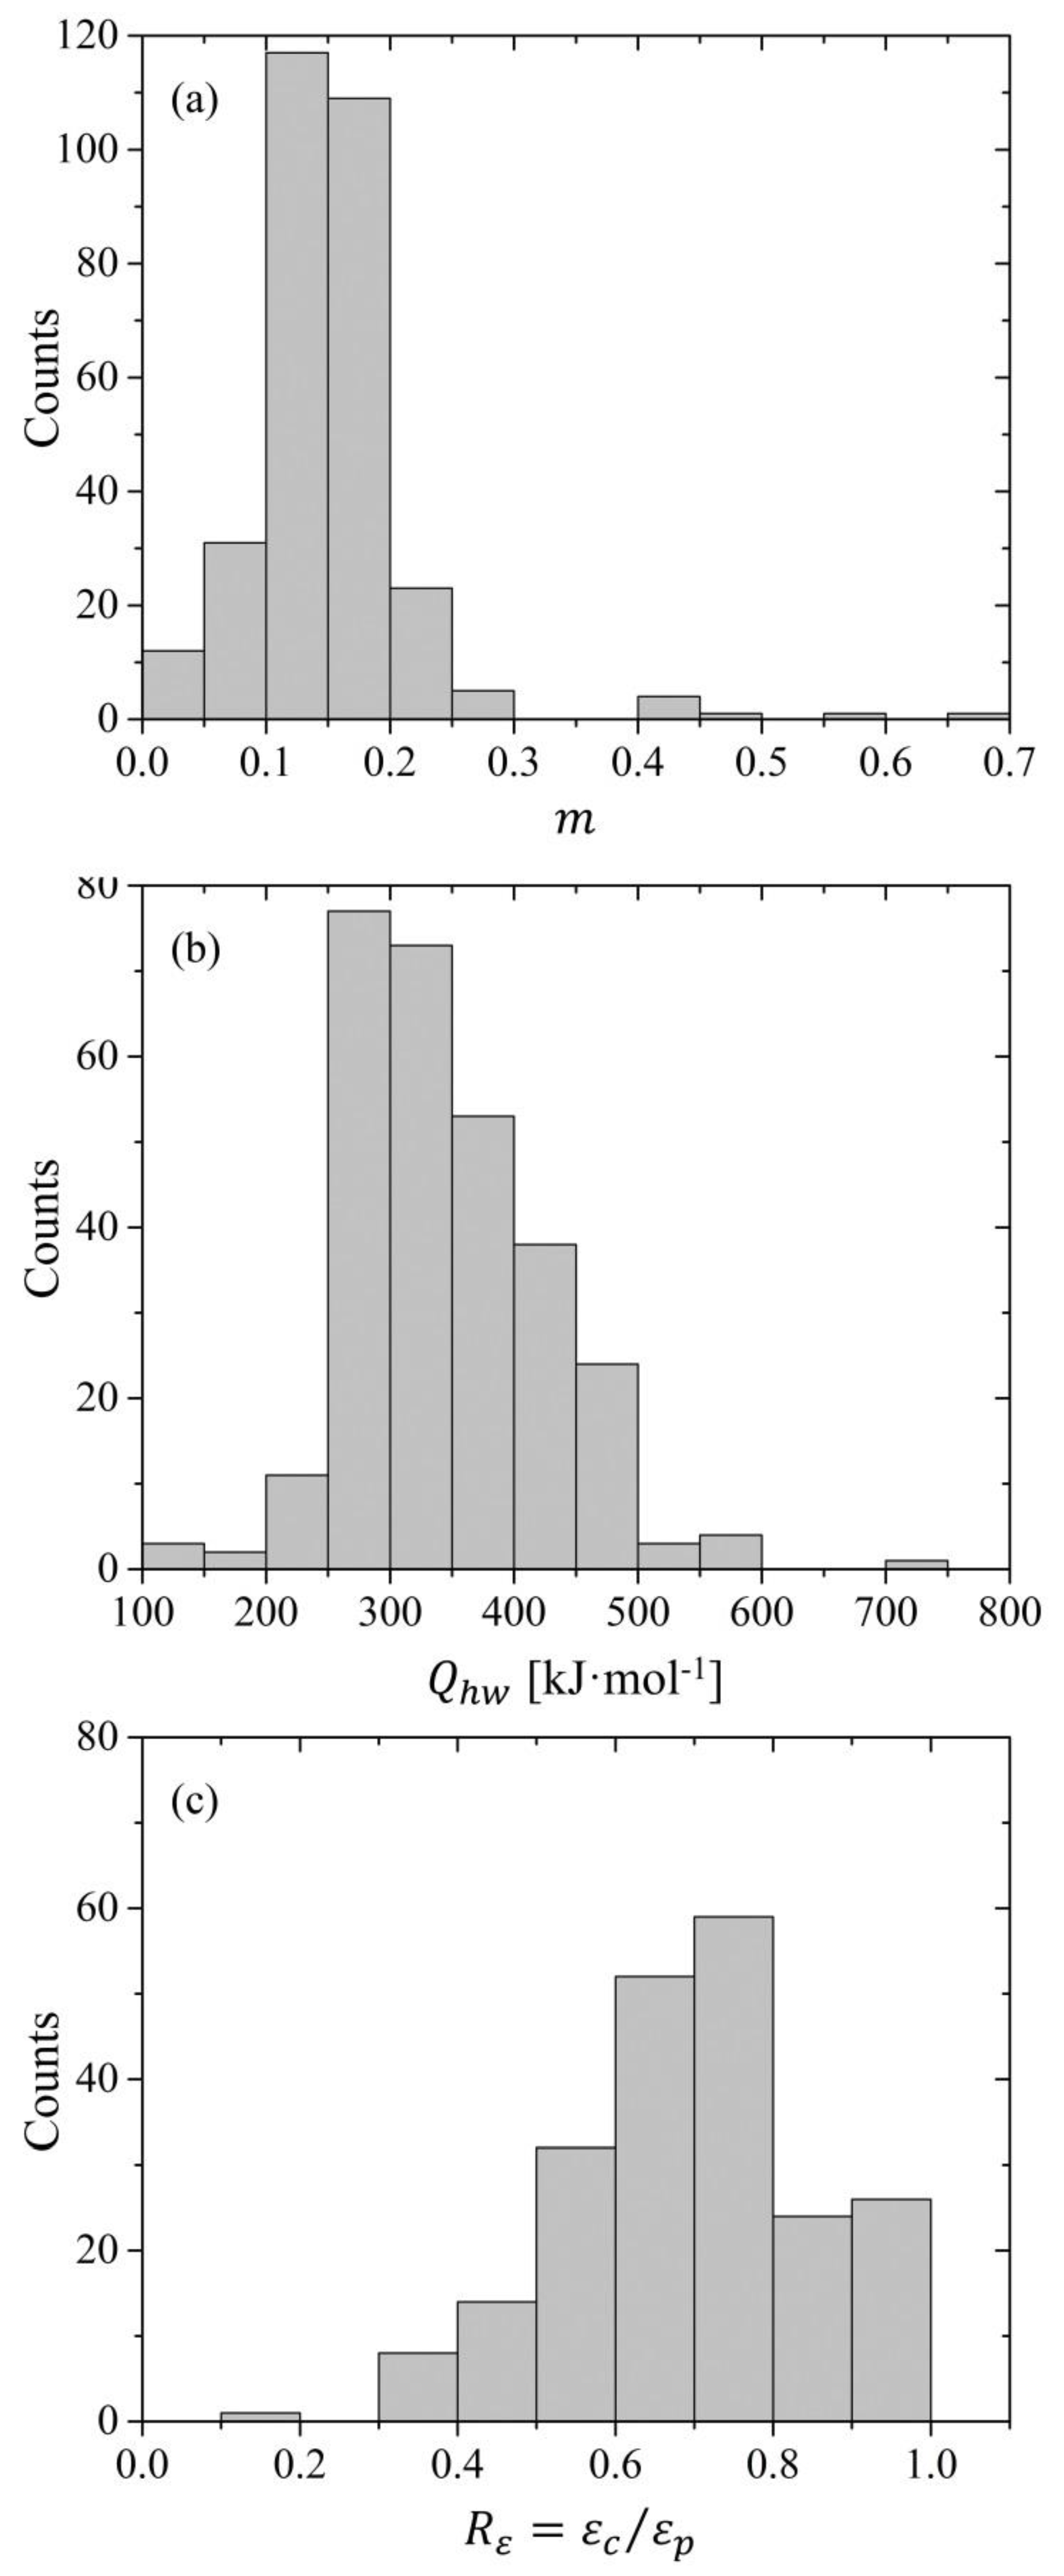
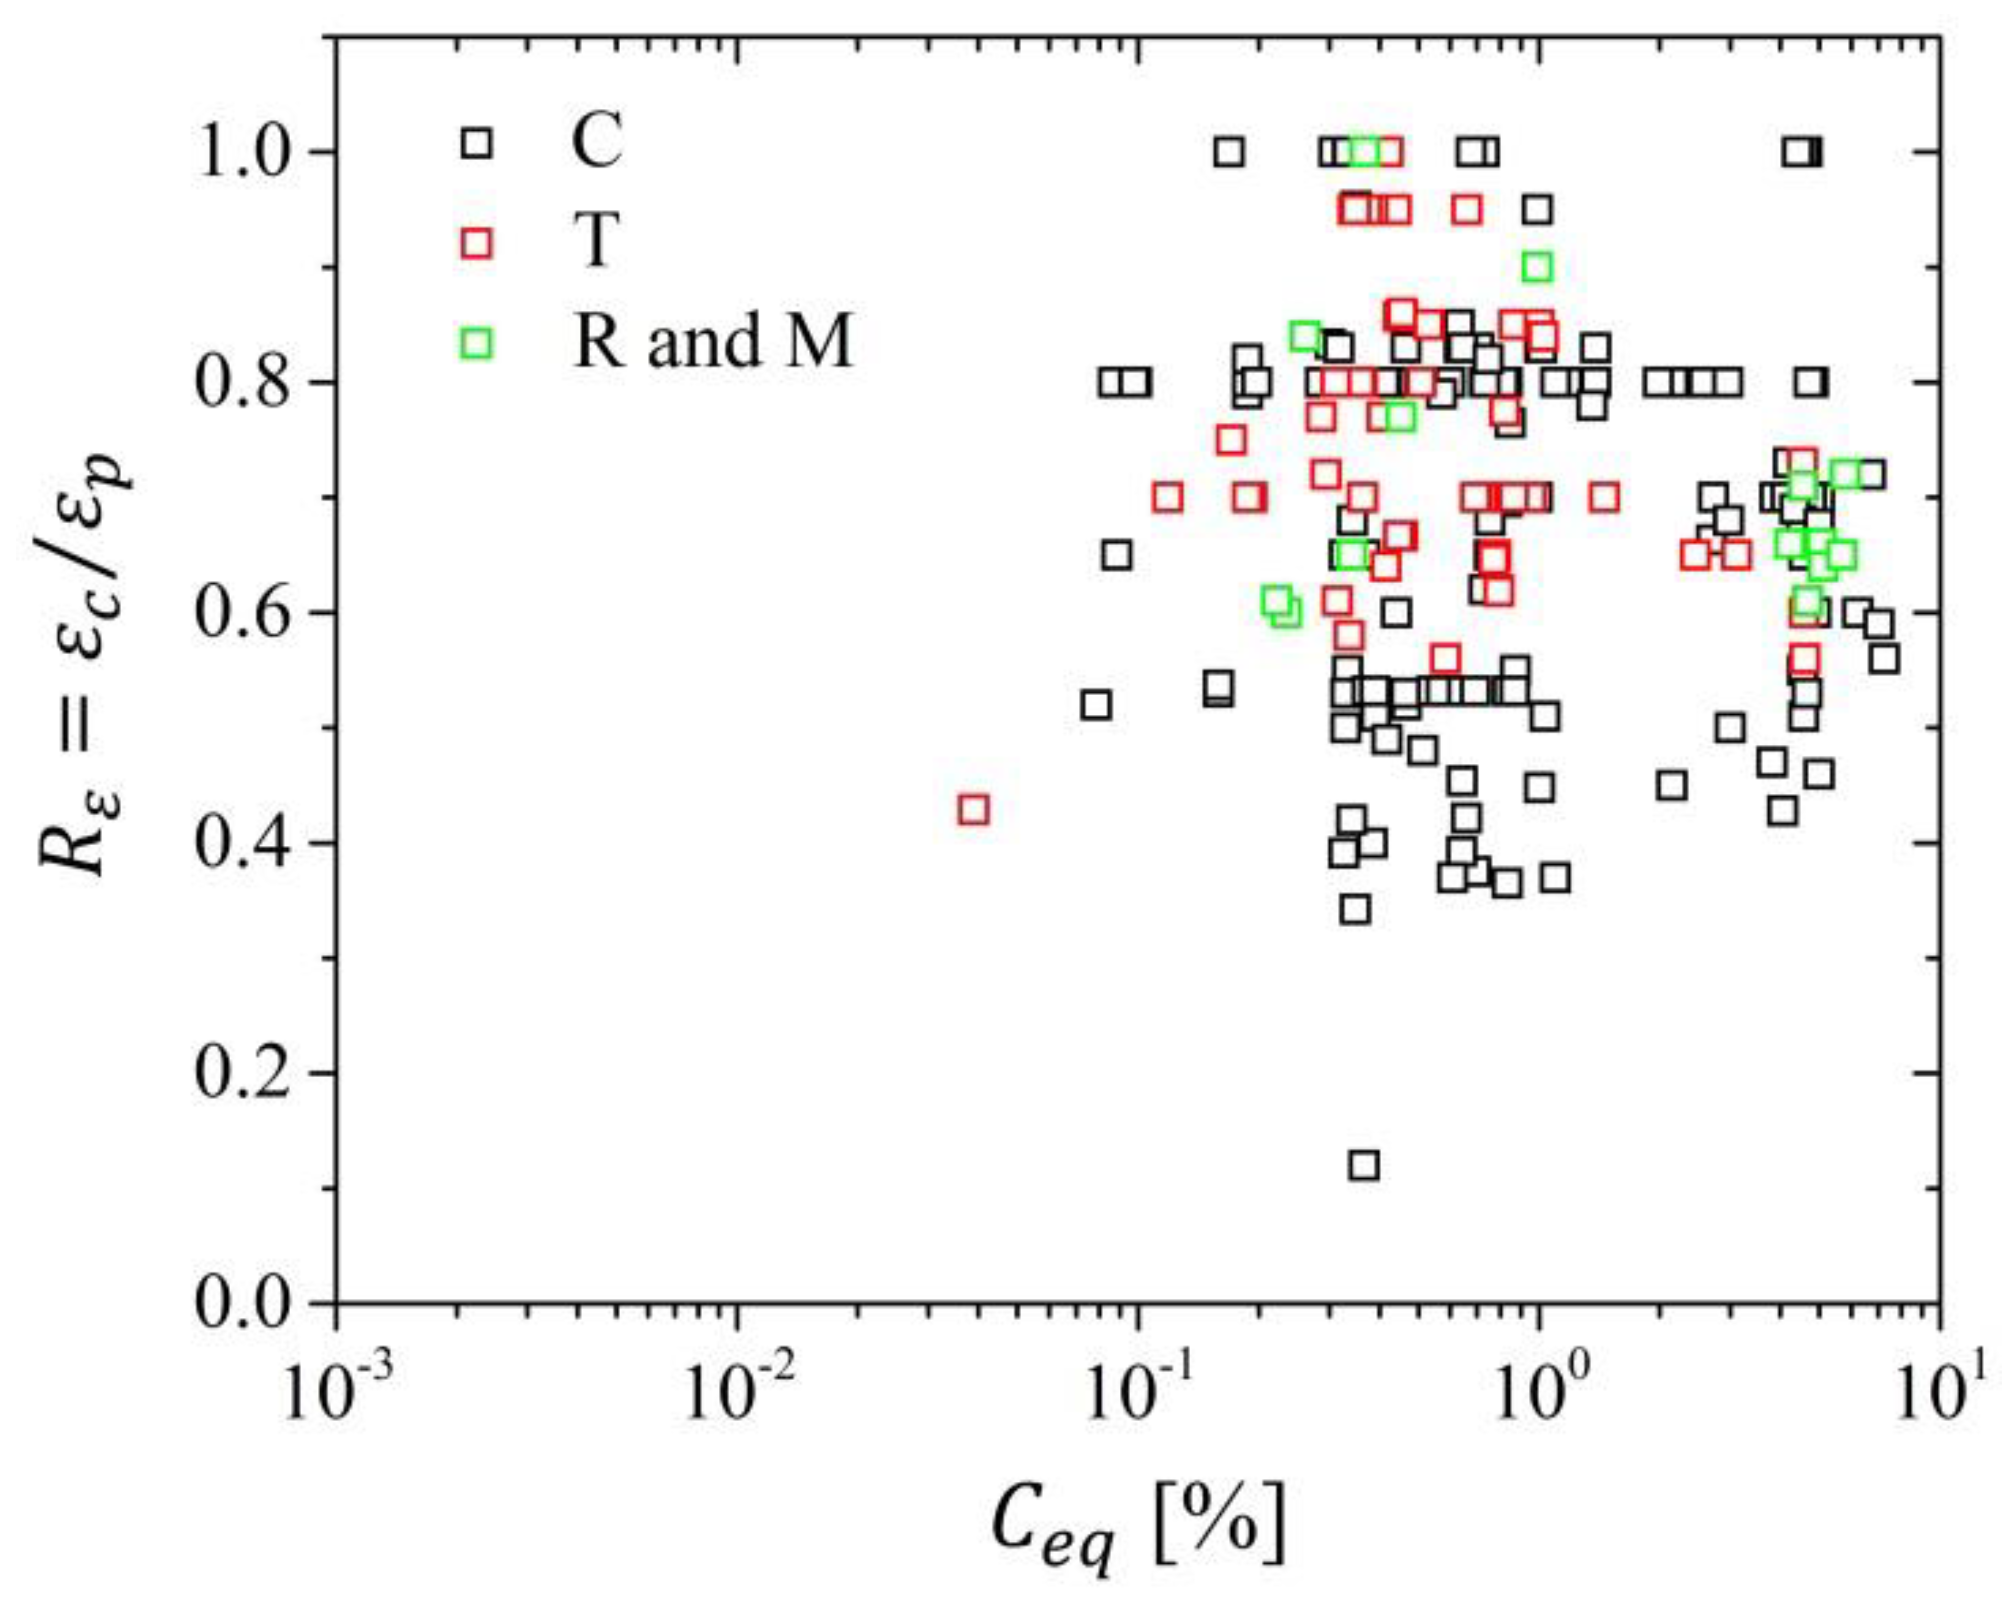
3. Influence of the Chemical Composition on the m Exponent
4. Conclusions
Author Contributions
Funding
Acknowledgments
Conflicts of Interest
Abbreviations
| , , , and | True strain, peak strain, critical strain and recrystallisation strain. |
| and | Critical ratio of strains and critical ratio of stresses [dimensionless]. |
| , , , , , and | True stress, initial stress, peak stress, critical stress, saturation stress (DRV) and steady state stress (DRX) [MPa]. |
| Strain rate [s−1]. | |
| Strain hardening rate [MPa]. | |
| , , , and | Dislocation density, critical dislocation density, steady state dislocation density and dislocation density in the mobility direction axis [m−2]. |
| Time taken after deformation for 50% of SRX or MDRX [s]. | |
| and | Zener-Hollomon parameter and modified Zener-Hollomon parameter [s−1]. |
| Activation energy for hot working [J·mol−1]. | |
| Universal gas constant [J·mol−1·K−1]. | |
| and | Absolute temperatura and absolute melting temperatura [K]. |
| Carbon equivalent [%]. | |
| , , , , , , , , , , , , , , , , , and | Numerical constants. |
| Prior austenite grain size (diameter) [μm]. | |
| , , , and | Numerical coefficients, thin plate spline (TPS) kernel function, partial derivative of TPS and root indicator of the - curve. |
| and | Corrective factor and steel type factor. |
| Effective niobium concentration [%]. | |
| , , and | Mean area of grain plane section [m2], mean grain volume [m3] and variability factor of the grain volume [%]. |
| Burgers vector [m]. | |
| Dislocation mean free path [m]. | |
| Mobility of dislocations [m2·s−1·N−1]. | |
| Mobility of a high angle grain boundary [m3·s−1·N−1]. | |
| Energy per unit length of dislocation [J·m−1]. | |
| Grain boundary energy per unit area [J·m−2]. | |
| KJMA exponent. | |
| Direction axis. | |
| Regularization parameter. | |
| -Fe | Gamma-iron (austenite). |
| R2 | Pearson’s coefficient. |
| 3IVM | Three Internal Variables Model. |
| C, T, R, TE, and M | Compression, torsion, rolling, tensión, and multiple techniques. |
| dDRX | Discontinuous dynamic recrystallisation. |
| DRV | Dynamic recovery. |
| DRX | Dynamic recrystallisation. |
| DT | Dynamic transformation. |
| EBSD | Electron backscatter diffraction. |
| ESR | Electro-slag remelting. |
| FFT | Fast Fourier transform. |
| HAB | High angle grain boundaries. |
| HSLA | High-strength low-alloy. |
| IIW | International Institute of Welding. |
| KJMA | Kolmogorov–Johnson–Mehl–Avrami. |
| MC, CA, and PF | Monte Carlo, cellular autómata, and phase field. |
| PH | Precipitation hardening stainless steel. |
| RBF | Radial basis function. |
| SDC | Second derivative criterion. |
| SFE | Stacking fault energy [J·m−2]. |
| SRX | Static recrystallisation. |
| TEM | Transmission electron microscopy. |
| TPS | Thin plate spline. |
| TRIP and TWIP steels | Transformation induced plasticity and twinning-induced plasticity steels. |
| WH or SH | Work hardening or strain hardening. |
Appendix A

| Ref. | Chemical Composition * | Steel | Test † | d0‡ | Qhw§ | κ − K | n | m − m′ | Rε | Eqn. |
|---|---|---|---|---|---|---|---|---|---|---|
| [32] | 0.17C, 1.35–1.36Mn, 0.31–0.36Si, 0.017–0.029Al, (0.005)Ti, (0.04)Nb | Nb | T | 300 | 0.86 | |||||
| [141] | 0.17C, 1.35–1.36Mn, 0.31–0.36Si, 0.017–0.029Al, (0.005)Ti, (0.04)Nb | Nb HSLA | T | <300 | 0.67 | |||||
| [33] | 0.055–0.68C, (0.44–1.64)Mn, (0.02–0.54)Si, (0.001–0.05)Al, (0.04–0.88)Cr, (0.012–0.24)Ni, (0.006–0.04)Mo, (0.005–0.03)Ti, (0.005–0.041)Nb, (0.02–0.15)V, (0.005)B | CMn | M | 50 | 312 | 4.90 × 10⁻⁴ | 0.50 | 0.150 | (1a) | |
| [22] | 0.06–0.9C, 1.32–1.56Mn, 0.22–0.75Si, 0.02–0.034Al, (18.7)Cr, (9.07)Ni, (0.13–0.22)Mo, (0.017)Ti, (0.032–0.124)Nb | SiMn | C | <360 | 406 | 0.80 | ||||
| Nb | C | 270 | 402 | 0.80 | ||||||
| Nb | C | 230 | 0.80 | |||||||
| Nb | C | 195 | 402 | 0.80 | ||||||
| Ti | C | 0.80 | ||||||||
| 18-8 | C | 393 | 0.80 | |||||||
| [142] | 0.08–0.095C, 1.04–1.5Mn, 0.026–0.047Si, 0.09–0.15Cr, 0.08–0.18Ni, 0.015–0.03Mo | Low C | T | <60 | 310 | 5.38 × 10⁻⁴ | 0.50 | 0.156 | 0.80 | (1a) |
| [71,143] | 0.0013–0.81C, 0.18–2.51Mn, 0.01–0.24Si, 0.019–0.066Al | CMnSi | C | <160 | 4.76 × 10⁻⁴ | (13b) | ||||
| [144] | 0.37C, 0.8Mn, 0.31Si, 0.03Al, 1.01Cr, 0.16Ni, 0.19Mo, 0.026Ti | Low alloy | T | <50 | 315 | 1.25 × 10⁻⁴ | 0.75 | 0.183 | 0.78 | (1a) |
| [145] | 0–0.37C, 0–0.8Mn, 0-0.31Si, 0–1.01Cr, 0–0.16Ni, 0–0.19Mo | Low C | T | 300 | 4.10 × 10⁻⁴ | 0.50 | 0.156 | 0.70 | (1a) | |
| Low alloy | T | 300 | 9.60 × 10⁻⁵ | 0.75 | 0.183 | 0.70 | (1a) | |||
| [146] | Not reported | CMn | R | 100 | 312 | 6.97 × 10⁻⁴ | 0.30 | 0.170 | 0.80 | (1a) |
| [76,78,109,122] | 0.035–0.57C, 0.4–1.73Mn, 0.398–0.54Si, 0.8–18.65Cr, 0.5–14.44Ni, 0.06–3.64Mo | AISI 304 | M | <280 | 400 | 4.50 × 10⁻² | 0.75 | 0.125 | (1a) | |
| [147,148] | AISI 316 | M | 60 | 460 | 6.03 × 10⁻¹ | 0.75 | 0.053 | (1a) | ||
| AISI 301W | M | 66 | 399 | 0.66 | ||||||
| AISI 304C | M | 64 | 407 | 0.71 | ||||||
| AISI 304W | M | <280 | 393 | 0.61 | ||||||
| AISI 316C | M | 63 | 402 | 0.66 | ||||||
| AISI 316W | M | 60 | 454 | 0.64 | ||||||
| AISI 317C | M | 72 | 508 | 0.72 | ||||||
| AISI 317W | M | 57 | 496 | 0.65 | ||||||
| FeC | T | 270 | 0.50 | 0.100 | (1a) | |||||
| [149,150] | 0.065C, 0.65Mn, 0.03Si, 0.036Al, 0.066Cr, 0.009Ni, 0.001Mo, 0.028Nb | Nb | T | 30 | 450 | 1.47 × 10⁻³ | 0.50 | 0.150 | 0.70 | (1a) |
| [43,151] | 0.03C, 1.54Mn, 0.19Si, 0.02Al, 0.02Ti | CMn | C | 312 | 6.82 × 10⁻³ | 0.128 | (1b) | |||
| [152,153] | Not reported | CMn | 312 | 3.68 × 10⁻⁴ | 0.44 | 0.190 | (1a) | |||
| [74] | 0.13C, 1.55Mn, 0.28Si, 0.07Al, 0.23Cr, 0.33Ni, 0.028Nb, 0.049V | NbV | C | 464 | 4.56 × 10⁻¹ | (14) | ||||
| [154] | 0.057–0.07C, 0.3–0.6Mn, 0.05–0.08Si, 0.011–0.017Ni, 0.005Mo | CMn | T | <35 | 5.41 × 10⁻⁴ | 0.230 | 0.70 | (1b) | ||
| Nb | T | 307 | 7.51 × 10⁻⁴ | 0.230 | 0.70 | (1b) | ||||
| [44,45] | 0.095–0.15C, 0.31–1.45Mn, 0.28–0.32Si, 0.015–0.038Al | CMn | C | <350 | 300 | 0.150 | (3) | |||
| [155] | 0.1–0.85C, 0.62–1.7Mn, 0.24–0.85Si, 0.005–0.03Al, 0.03–0.14Cr | ES17 | T | <440 | 4.83 × 10⁻³ | 0.09 | 0.150 | 0.85 | (1a) | |
| QC29B | T | 2.73 × 10⁻³ | 0.20 | 0.150 | 0.85 | (1a) | ||||
| FP69 | T | 1.84 × 10⁻³ | 0.24 | 0.150 | 0.85 | (1a) | ||||
| FF82 | T | 1.84 × 10⁻³ | 0.24 | 0.150 | 0.85 | (1a) | ||||
| [73] | 0.11–0.17C, 0.89–1.51Mn, 0.03–0.3Si, 0.029–0.045Al | C | C | <300 | 1.30 × 10⁻⁵ | (13b) | ||||
| [72] | 0.1C, 1.19Mn, 1Si, 1Cr | CSiMnCr | M | 80 | 4.76 × 10⁻⁴ | (13b) | ||||
| [156] | 0.1–0.19C, 1.26–1.7Mn, 0.24–0.36Si, 0.014–0.042Al, 0.01–0.012Ti, 0.04–0.15V | Nb | T | 9.38 × 10⁻⁴ | 0.230 | 0.80 | (1b) | |||
| V | T | 300 | 1.88 × 10⁻² | 0.113 | 0.80 | (1b) | ||||
| [157] | 0.055–0.063C, 1.2–1.3Mn, 0.2–0.24Si, 0.029–0.036Al, 0.18Mo, 0.02–0.16Ti | MoTi | T | <70 | 296 | 5.24 × 10⁻⁴ | 0.50 | 0.180 | 0.58 | (1a) |
| NbTi | T | <60 | 375 | 2.80 × 10⁻⁴ | 0.50 | 0.170 | 0.72 | (1a) | ||
| Ti | T | <90 | 372 | 2.40 × 10⁻⁴ | 0.50 | 0.180 | 0.80 | (1a) | ||
| MoTi | T | 2.17 × 10⁻³ | 0.180 | (1b) | ||||||
| NbTi | T | 1.43 × 10⁻³ | 0.160 | (1b) | ||||||
| Ti | T | 1.50 × 10⁻³ | 0.170 | (1b) | ||||||
| [58,59] | 0.163–1.06C, 0.35–1.55Mn, 0.13–0.31Si | 1041 | T | 125 | 306 | 7.97 × 10⁻⁴ | 0.50 | 0.157 | 0.70 | (8) |
| 9260 | T | 88 | 311 | 4.17 × 10⁻⁴ | 0.50 | 0.171 | 0.70 | (8) | ||
| 52100 | T | 150 | 303 | 7.45 × 10⁻⁴ | 0.50 | 0.160 | 0.70 | (8) | ||
| 10L60 | T | 90 | 351 | 6.51 × 10⁻⁴ | 0.50 | 0.138 | 0.70 | (8) | ||
| 32NiCrMoV12 | T | 180 | 387 | 7.06 × 10⁻⁴ | 0.50 | 0.139 | 0.70 | (8) | ||
| 15NiCrMo16 | T | 44 | 414 | 4.87 × 10⁻⁴ | 0.50 | 0.145 | 0.70 | (8) | ||
| [158] | 0.04C, 0.4Mn, 0.3Si, 19.58Cr, 18.22Ni, 6.48Mo | High Mo | C | 491 | 0.015 | (7b) | ||||
| [159] | 0.192–1.42C, 0.142–1.29Mn, 0.287–0.362Si | CMn | T | <200 | 248 | 4.30 × 10⁻³ | 0.20 | 0.174 | 0.86 | (1a) |
| V | T | <140 | 248 | 5.90 × 10⁻³ | 0.20 | 0.172 | (1a) | |||
| [160] | 0.157C, 1.4Mn, 0.45Si | 16Mn | C | 392 | 0.050 | 0.83 | (7b) | |||
| [161] | Not reported | CMn-HSLA | T | 300 | 6.50 × 10⁻⁴ | 0.30 | 0.170 | 0.72 | (1a) | |
| [162] | 0.063C, 1.2Mn, 0.22Si, 0.029Al, 0.18Mo, 0.02Ti | MoTi | T | 50 | 295 | 7.07 × 10⁻⁴ | 0.50 | 0.150 | (1a) | |
| [163] | 0.078C, 1.39Mn, 0.35Si, 0.016Al | Mn | M | 140 | 245 | 4.90 × 10⁻⁴ | 0.50 | 0.150 | 1.00 | (1a) |
| [164] | 0.046–0.09C, 1.2-1.57Mn, (0.2–0.3)Si, 0.031–0.05Al, 0.03–0.7Ni, (0.1)Mo, 0.001–0.142Ti, 0.011–0.046Nb, (0.005–0.082)V | Nb | M | 40 | 375 | 2.84 × 10⁻⁴ | 0.50 | 0.170 | 0.65 | (1a) |
| [165] | 0.72C, 1.2Mn | S49 | R | <500 | 0.150 | (1a) | ||||
| [166] | 0.72C, 1.2Mn | 900A | C | 220 | 315 | 4.05 × 10⁻⁴ | 0.31 | 0.175 | 0.85 | (1a) |
| [167] | 0.34C, 1.52Mn, 0.72Si, 0.0145Al, 0.0181Ti, 0.083V | 38MnSiVS5 | C | <120 | 270 | 7.00 × 10⁻³ | 0.15 | 0.137 | 1.00 | (1a) |
| [46,47,48,49] | 0.11–0.53C, 0.47–1.55Mn, 0.2–1.65Si, 0.18–0.38Mo, 0.021–0.075Ti, 0.041–0.093Nb, 0.043–0.093V | CMn | T | <212 | 275 | 9.52 × 10⁻³ | 0.20 | 0.159 | 0.95 | (4a) |
| CSi | T | <143 | 298 | 9.20 × 10⁻² | 0.20 | 0.161 | 0.95 | (4a) | ||
| CMo | T | <205 | 285 | 1.18 × 10⁻¹ | 0.20 | 0.145 | 0.95 | (4a) | ||
| Ti | T | <95 | 292 | 1.02 × 10⁻¹ | 0.20 | 0.170 | 0.95 | (4a) | ||
| V | T | <172 | 278 | 9.88 × 10⁻² | 0.20 | 0.166 | 0.95 | (4a) | ||
| Nb | T | <122 | 291 | 9.60 × 10⁻² | 0.20 | 0.219 | 0.95 | (4a) | ||
| [168] | Not reported | Plain C | R | 300 | 300 | 5.60 × 10⁻⁴ | 0.03 | 0.170 | (1a) | |
| [52] | 0.03–0.1C, 0.24–1.08Mn, 0.002–0.06Si, 0.02–0.047Al | CMn | M | 100 | 300 | 5.60 × 10⁻⁴ | 0.30 | 0.170 | (1a) | |
| [52] | Not reported | Nb | M | 375 | 2.80 × 10⁻⁴ | 0.50 | 0.170 | 0.60 | (6) | |
| [169] | 0.03–0.3C, 0.2–1.7Mn, 0–0.6Si | Low C | C | <250 | 305 | 6.97 × 10⁻⁴ | 0.90 | 0.170 | 0.70 | (1a) |
| [170] | 0.71–0.75C, 1.12–1.2Mn, 0.2–0.4Si, (0.01)Al, 0.07–0.1Cr | 900A | C | 210 | 315 | 4.50 × 10⁻⁴ | 0.33 | 0.180 | 0.95 | (1a) |
| [171] | 0.156–0.176C, 0.56–1.28Mn, 0.015–0.056Si, 0.021Al | Low C | <180 | 1.43 × 10⁻⁵ | 0.220 | (13) | ||||
| [62] | 0.04–0.17C, 0.3–0.74Mn, 0.009–0.012Si, 0.04Al, 0.019–0.033Cr, 0.01–0.025Ni | Plain C | C | <244 | 334 | 1.32 × 10⁻² | 0.17 | 0.165 | 0.83 | (11b) |
| C | 334 | 1.32 × 10⁻² | 0.17 | 0.165 | (11b) | |||||
| [136,172] | 0.34C, 1.52Mn, 0.72Si, 0.0145Al, 0.018Ti, 0.083V | 38MnSiVS5 | C | <120 | 270 | 7.00 × 10⁻³ | 0.15 | 0.140 | 0.80 | (1a) |
| [108] | 0.28–0.47C, 0.52–0.76Mn, (0.83–1.38)Cr, (0.46)Ni, (0.15–0.97)Mo, (0.016)Nb, (0.12–0.27)V | Base | T | 147 | 0.50 | 0.170 | (1a) | |||
| CrMo | T | 191 | 0.50 | 0.190 | (1a) | |||||
| CrMoV | T | 236 | 0.50 | 0.160 | (1a) | |||||
| CrMoVNb | T | 241 | 4.00 × 10⁻³ | 0.50 | 0.170 | 0.84 | (1a) | |||
| [132,173] | 0.0037–0.79C, 0.32–1.69Mn, 0.003–0.005Cr, 0.003–0.008Ni, 0.002–0.003Mo, 0.003V | C | T | 100 | 294 | 1.00 | ||||
| [28,174] | 0.05–0.14C, 0.002–0.325Mn, 0.35–1.33Si, 0.019–0.057Al, (0.016–0.024)Ti, 0.008–0.08Nb | Nb | M | 100 | 375 | 2.80 × 10⁻⁴ | 0.50 | 0.170 | 0.61 | (6) |
| [175] | Not reported | TMS-80R | C | <250 | 280 | 1.20 × 10⁻³ | 0.27 | 0.180 | 0.83 | (1a) |
| [176] | 0.1C, 0.45Mn, 0.35Si, 0.5Cr, 0.4Ni, 0.3Mo, 0.085Ti, 0.04Nb, 0.06V | V | M | <100 | 300 | 0.50 | 0.170 | (1a) | ||
| [51] | 0.003–0.005C, 0.22Mn, 0.02Si, 0.005–0.013Al, 0.009–0.08Ti | ULow C | C | 1.70 × 10⁻⁴ | 0.417 | (5) | ||||
| ULow C | C | 1.09 × 10⁻⁴ | 0.190 | (5) | ||||||
| CMn | C | 1.17 × 10⁻⁴ | 0.401 | (5) | ||||||
| [177] | 0.07–0.1C, 0.15–1.52Mn, 0.11–0.43Si, (0.054)Al, (0.03)Nb, (0.1)V | HSLA | M | 306 | 1.30 × 10⁻³ | 0.180 | (1b) | |||
| HSLA | M | 405 | 9.00 × 10⁻⁴ | 0.160 | (1b) | |||||
| [178,179] | 0.03C, 0.8Mn, 0.8Si, 20Cr, 18.775Ni, 5.75Mo | High Mo | C | 587 | 1.84 × 10⁻⁴ | 0.128 | (1b) | |||
| [50,180] | 0.054C, 1.04Mn, 0.59Si, 18.25Cr, 8.16Ni, 0.15Mo | AISI 304 | T | 100 | 380 | 3.70 × 10⁻¹ | 0.012 | 0.73 | (4b) | |
| [181] | 0.085C, 0.95Mn, 0.29Si, 0.025Al, 0.045Nb | Nb | T | 314 | 0.190 | (1a) | ||||
| [182] | 0.067–0.074C, 1.47–1.51Mn, 0.202–0.207Si, (0.304–0.606)Cr, (0.2–0.496)Ni, 0.151–0.283Mo, 0.014–0.015Ti, 0.032–0.062Nb | Nb | T | 340 | 6.90 × 10⁻⁴ | 0.50 | 0.250 | (1a) | ||
| Nb | T | 377 | 1.80 × 10⁻³ | 0.50 | 0.110 | (1a) | ||||
| Nb | T | 359 | 1.30 × 10⁻³ | 0.50 | 0.130 | (1a) | ||||
| Nb | T | 354 | 1.20 × 10⁻³ | 0.50 | 0.100 | (1a) | ||||
| Nb | T | 324 | 1.10 × 10⁻³ | 0.50 | 0.130 | (1a) | ||||
| Nb | T | 287 | 8.30 × 10⁻⁴ | 0.50 | 0.170 | (1a) | ||||
| Nb | T | 316 | 5.80 × 10⁻⁴ | 0.50 | 0.160 | (1a) | ||||
| [183] | 0.84–1C, 0.25–0.7Mn, 0.3Si, 4–5Cr, 1.15–5Mo, 0.3–1.9V | A2 | T | 143 | 399 | 0.65 | ||||
| M2 | T | 90 | 455 | 0.65 | ||||||
| [61] | Not reported | Low C | R | 312 | 8.03 × 10⁻⁴ | 0.17 | 0.177 | (10) | ||
| [184,185,186] | 18.25Cr, 8.16Ni | AISI 304 | C | <45 | 380 | 3.00 × 10⁻³ | 0.50 | 0.090 | 0.73 | (1a) |
| 2.20 × 10⁻³ | 0.50 | 0.089 | (1a) | |||||||
| [187] | 0.01C, 0.057Mn | ARMCO | C | 270 | 4.80 × 10⁻³ | 0.145 | (1b) | |||
| [188,189] | 0.02–0.087C, 1.48–1.58Mn, 0.42Si, 0.0048–0.0069Al, 18.42–18.82Cr, 8.19–8.97Ni, 0.25–0.36Mo, 0.01–0.03Nb, 0.08–0.09V | AISI 304L | C | 29 | 1.50 × 10⁻² | 0.156 | 0.80 | (1b) | ||
| AISI 304H | C | 42 | 1.90 × 10⁻² | 0.144 | 0.80 | (1b) | ||||
| [190] | 0.026–0.032C, 1.03–1.05Mn, 0.21–0.22Si, (0.02)Al, 0.088–0.106Ti, 0.098–0.099V | HSLA RH free | C | 270 | 3.70 × 10⁻³ | 0.190 | (1b) | |||
| HSLA RH | C | 270 | 4.00 × 10⁻³ | 0.200 | (1b) | |||||
| [191] | 0.0028C, 0.15Mn, 0.01Si, 0.058Al, 0.083Ti | IF | T | 342 | 1.22 × 10⁻² | 0.120 | (1b) | |||
| [192,193,194,195] | 0.01–0.7C, 0.55–0.7Mn, 0.05–1.1Si, 0.05–0.08Cr, (0.0005–0.0015)B | Low C | C | 160 | 338 | 6.50 × 10⁻⁴ | 0.43 | 0.132 | 0.80 | (1a) |
| High C | C | 90 | 316 | 2.50 × 10⁻³ | 0.40 | 0.090 | 0.80 | (1a) | ||
| High Si | C | <240 | 440 | 4.20 × 10⁻⁴ | 0.40 | 0.120 | 0.80 | (1a) | ||
| [196,197,198] | 0.4C, 0.7Mn, 0.2Si, 1Cr, 0.15Mo | AISI 4140 | T | 140 | 318 | 3.88 × 10⁻¹ | 0.158 | 0.65 | (4b) | |
| [199] | 0.085–0.087C, 0.52–1.5Mn, 0.27–0.3Si, 0.025–0.029Al, 0.045–0.05Nb | Nb | T | 370 | 8.90 × 10⁻⁵ | 0.50 | 0.190 | (1a) | ||
| Nb | T | 314 | 3.00 × 10⁻⁵ | 0.50 | 0.190 | (1a) | ||||
| Nb | T | 286 | 4.60 × 10⁻⁵ | 0.50 | 0.190 | (1a) | ||||
| [200] | 0.08–0.14C, 1.2–1.6Mn, 0.28–0.4Si, 0.015–0.022Al, 0.56–0.67Mo, (0.0105)Ti, (0.053)Nb, (0.053)V | Mo | C | 161 | 400 | 3.98 × 10⁻² | 0.20 | 0.120 | (4a) | |
| MoNb | C | 179 | 343 | 2.81 × 10⁻² | 0.20 | 0.220 | (4a) | |||
| MoV | C | 172 | 330 | 5.52 × 10⁻² | 0.20 | 0.145 | (4a) | |||
| MoTi | C | 129 | 400 | 3.93 × 10⁻² | 0.20 | 0.133 | (4a) | |||
| [29,111,201,202] | 0.04–0.08C, 0.22–1.95Mn, 0.012–1.09Si, (0.05–0.06)Al, (18.56)Cr, (9.1)Ni, (0.03)Nb | AK | C | 265 | 2.51 × 10⁻³ | 0.190 | 0.52 | (1b) | ||
| Nb | C | 319 | 0.090 | 0.55 | (1a) | |||||
| AISI 321 | C | 0.60 | ||||||||
| [53,203] | 0.07–0.1C, 0.62–1.42Mn, 0.01–0.31Si, 0.039–0.053Al, (0.02)Cr, (0.02)Ni, 0.005–0.067Ti, 0.034–0.035Nb | Nb–NbTi | T | <805 | 325 | 3.70 × 10⁻³ | 0.15 | 0.155 | 0.77 | (6) |
| [204] | (0.0005–0.07)C, (1.51–1.58)Mn, (18–18.5)Cr, (8.2–12.2)Ni | AISI 304L | C | 18 | 280 | 1.50 × 10⁻² | 0.156 | 1.00 | (1b) | |
| AISI 304H | C | 21 | 280 | 1.90 × 10⁻² | 0.144 | 1.00 | (1b) | |||
| HP | C | 10 | 280 | 3.23 × 10⁻³ | 0.48 | 0.143 | 1.00 | (1a) | ||
| HP | C | 24 | 280 | 3.23 × 10⁻³ | 0.48 | 0.139 | 1.00 | (1a) | ||
| HP | C | 92 | 280 | 3.23 × 10⁻³ | 0.48 | 0.148 | 1.00 | (1a) | ||
| UHP | C | 20 | 280 | 3.61 × 10⁻³ | 0.53 | 0.131 | 1.00 | (1a) | ||
| UHP | C | 135 | 280 | 3.61 × 10⁻³ | 0.53 | 0.182 | 1.00 | (1a) | ||
| [205] | 0.18C, 0.6Mn, 0.22Si | Q235 | C | <400 | 363 | 4.37 × 10⁻⁴ | 0.21 | 0.168 | 0.83 | (1a) |
| [54,164] | 0.71–1.1C, 0.63–0.77Mn, 0.22–0.99Si, 0.04–0.066Cr, 0.038–0.07Ni, (0.078–0.26)V | V | C | 94 | 282 | 9.36 × 10⁻⁴ | 0.50 | 0.150 | (6) | |
| V | C | 92 | 280 | 7.96 × 10⁻⁴ | 0.50 | 0.150 | ||||
| V | C | 97 | 287 | 9.70 × 10⁻⁴ | 0.50 | 0.150 | ||||
| CMn | C | 105 | 250 | 7.90 × 10⁻⁴ | 0.50 | 0.160 | ||||
| [206] | 0.45C, 1.2Mn, 0.6Si, 0.12Cr, 0.017Ti, 0.1V | Med. CV | T | 120 | 296 | 3.80 × 10⁻¹ | 0.157 | 0.62 | (4b) | |
| [207] | Not reported | CMn | T | 300 | 300 | 6.97 × 10⁻⁴ | 0.30 | 0.170 | 0.81 | (1a) |
| [208] | 0.004C, 0.132Mn, 0.011Si, 0.011Al, 0.065Ti | ULow C | T | 297 | 0.095 | (7b) | ||||
| [209] | Not reported | AISI 316 | T | 90 | 414 | 2.40 × 10⁻¹ | 0.057 | (4b) | ||
| [133] | 0.06–0.5C, 0.42–0.68Mn, 0.12–0.2Si, (0.003)Al, 0.01–0.04Cr, 0.07Ni, (0.015)Mo, 0.002V | Low C | C | 53 | 270 | 4.80 × 10⁻³ | 0.170 | 1.00 | (1b) | |
| High C | C | 78 | 270 | 1.10 × 10⁻² | 0.130 | 1.00 | (1b) | |||
| [210] | 0.155C, 0.45Mn | AISI 1015 | C | 1.76 × 10⁻⁴ | (13b) | |||||
| [211] | 0.18C, 0.87Mn, 0.25Si | BS430 | C | 280 | 8.76 × 10⁻³ | 0.166 | 0.12 | (1b) | ||
| [212] | 0.38C, 0.5Mn, 0.2Si, 0.86Cr, 0.2Mo | 35CrMo | C | <150 | 378 | 3.52 × 10⁻³ | 0.138 | 0.83 | (1b) | |
| [213] | 0.038C, 0.25Mn, 0.02Si, 0.045Al, 0.008Cr, 0.001Ni, 0.001Mo, 0.001Ti, 0.002Nb, 0.007V | SAE 1006 | C | 26 | 333 | 1.30 × 10⁻⁴ | 0.30 | 0.200 | 0.80 | (1a) |
| C | 277 | 238 | 6.20 × 10⁻⁴ | 0.30 | 0.220 | 0.80 | (1a) | |||
| [26,214] | 0.072C, 1.08Mn, 0.57Si, 18.41Cr, 8.21Ni | AISI 304 | C | <100 | 405 | 0.51 | ||||
| [215,216] | 0.004–0.4C, 0.84–1Mn, (0.24)Si, 0.021–0.035Al, (0.02)Cr, (0.01)Ni, (0.02)Ti, (0.04)Nb, (0.001)B | Med. C | T | 88 | 0.56 | |||||
| IF | T | 55 | 300 | 0.75 | ||||||
| IF | T | 200 | 340 | 0.75 | ||||||
| [217] | 0.71–0.91C, 0.49–0.68Mn, 0.21–0.22Si, 0.04–0.05Cr | Hypo. | C | 98 | 317 | 0.55 | ||||
| Hyper. | C | 112 | 290 | 0.51 | ||||||
| [218] | 0.038–0.051C, 0.224–0.25Mn, 0.014–0.02Si, 0.045–0.05Al, 0.008–0.027Cr, 0.001–0.011Ni, 0.001Mo, 0.001–0.002Ti, 0.001–0.002Nb, 0.002–0.007V, (0.0004)B | VDB cast | C | 124 | 309 | 3.27 × 10⁻⁴ | 0.30 | 0.180 | 0.80 | (1a) |
| SS cast | C | 277 | 238 | 6.20 × 10⁻⁴ | 0.30 | 0.220 | 0.80 | (1a) | ||
| VDB roll. | C | 50 | 388 | 3.90 × 10⁻⁴ | 0.30 | 0.145 | 0.80 | (1a) | ||
| SS roll. | C | 26 | 333 | 1.30 × 10⁻⁴ | 0.30 | 0.200 | 0.80 | (1a) | ||
| [219] | 0.18–0.24C, 0.65–0.82Mn, 0.01–0.51Si, 0.005–0.009Al | CSiMn | C | 80 | 270 | 7.58 × 10⁻³ | 0.140 | (1b) | ||
| CSiMn | C | 109 | 270 | 8.83 × 10⁻³ | 0.140 | (1b) | ||||
| CSiMn | C | 101 | 270 | 1.01 × 10⁻² | 0.140 | (1b) | ||||
| [220,221] | 0.23C, 0.74Mn, 0.22Si, 0.031Al, 0.9Cr, 0.05Ni, 0.08Mo | MnCr | C | <150 | 379 | 5.24 × 10⁻⁵ | 0.50 | 0.188 | 0.80 | (1a) |
| [222] | 0.004C, 1.1Mn, 0.02Ti, 0.04Nb, (0.0005–0.001)B | IF | C | 362 | 0.79 | |||||
| 364 | 0.80 | |||||||||
| 404 | 0.82 | |||||||||
| [223] | 0.55C, 0.78Mn, 0.31Si, 0.76Cr, 0.07Ni, 0.02Mo | DIN55Cr3 | C | 34 | 340 | 3.36 × 10⁻⁴ | 0.50 | 0.150 | (1a) | |
| [224] | Not reported | Eutectoid | R | <50 | 4.50 × 10⁻⁴ | 0.33 | 0.180 | 0.90 | (1a) | |
| [225] | 0.08C, 1.2Mn, 0.6Si, 18.3Cr, 8.4Ni | AISI 304 | T | 401 | 3.78 × 10⁻² | 0.077 | 0.56 | (1b) | ||
| [226] | 0.002–0.083C, 0.144–0.765Mn, 0.034–0.04Al, 0.003–0.083Ti, 0.001–0.024Nb | CMn | T | 70 | 231 | 2.50 × 10⁻² | 0.20 | 0.210 | (1a) | |
| HSLA | T | 45 | 394 | 1.04 × 10⁻³ | 0.20 | 0.210 | (1a) | |||
| IF | T | 55 | 309 | 9.70 × 10⁻³ | 0.20 | 0.210 | (1a) | |||
| [227] | 0.1–0.13C, 1.09–1.25Mn, 0.25–0.34Si, 0.032–0.047Al, (0.018–0.047)Ti | CSiMn | T | 290 | 279 | 1.02 × 10⁻¹ | 0.22 | 0.164 | 0.95 | (4a) |
| CMnSi | T | 46 | 296 | 1.02 × 10⁻¹ | 0.22 | 0.116 | 0.95 | (4a) | ||
| [63] | 0.19C, 0.4Mn, 0.2Si, 0.11Cr | CSiMn | C | 194 | 3.85 × 10⁻² | 0.115 | (1b) | |||
| [228] | 0.0024C, 1.7Mn, 0.17Si, 0.021Al, 0.014Ti, 0.11Nb | TiNb IF | T | 305 | 1.03 ×10⁻² | 0.160 | 0.61 | (1b) | ||
| [229] | 0.12C, 0.85Mn, 0.08Si, 0.05Cr, 0.0015B | Low C | C | <170 | 5.50 × 10⁻⁴ | 0.50 | 0.100 | 0.80 | (1a) | |
| [198] | 0.25–0.45C, 0.67–1.5Mn, 0.05–0.6Si, (0.12–0.97)Cr, (0.15)Mo, (0.015–0.017)Ti, (0.1)V | VTi | T | 296 | 3.80 × 10⁻¹ | 0.157 | 0.62 | (4b) | ||
| Ti | T | 258 | 3.51 × 10⁻¹ | 0.186 | (4b) | |||||
| CMn | T | 318 | 3.90 × 10⁻¹ | 0.158 | 0.65 | (4b) | ||||
| VTi | T | 2.35 × 10⁻¹ | 0.157 | (4b) | ||||||
| Ti | T | 2.94 × 10⁻¹ | 0.166 | (4b) | ||||||
| CMn | T | 2.52 × 10⁻¹ | 0.158 | (4b) | ||||||
| [230] | 0.2–0.3C, 1.9–2Mn, 0.6–1.2Si, 0.0061–0.0279Al, 0.1–0.2Ni, 0.2–0.3Mo, 0.002–0.003Ti, 0.01V | B | C | 46 | 270 | 5.37 × 10⁻² | 0.082 | (1b) | ||
| B | C | 63 | 270 | 2.24 × 10⁻² | 0.122 | (1b) | ||||
| B | C | 56 | 270 | 3.63 × 10⁻² | 0.092 | (1b) | ||||
| [121,231] | 0.002C, 0.13Mn, 0.02Si, 0.03Al, 0.037Cr, 0.025Ni, 0.008Mo, 0.062Ti, 0.002Nb, 0.002V | Ti IF | C | <230 | 344 | 4.00 × 10⁻⁵ | 0.44 | 0.220 | 0.43 | (1a) |
| [134] | 0.0015–0.0028C, 1.1–21.1Mn, 0.005–0.018Si | FeMn | T | 230 | 2.89 × 10⁻² | 0.114 | (1b) | |||
| FeMn | T | 350 | 1.69 × 10⁻² | 0.096 | (1b) | |||||
| FeMn | T | 317 | 1.70 × 10⁻² | 0.108 | (1b) | |||||
| FeMn | T | 301 | 1.97 × 10⁻² | 0.111 | (1b) | |||||
| FeMn | T | 279 | 1.62 × 10⁻² | 0.129 | (1b) | |||||
| [232] | 0.048–0.051C, 0.224–0.228Mn, 0.014–0.024Si, 0.05–0.071Al, 0.02–0.021Cr, 0.011–0.014Ni, 0.001–0.005Mo, 0.002Ti, 0.001–0.002Nb, 0.001–0.002V, 0.0004–0.0011B | B | C | 50 | 388 | 4.10 × 10⁻⁴ | 0.30 | 0.145 | 0.80 | (1a) |
| B | C | 99 | 351 | 3.40 × 10⁻⁴ | 0.30 | 0.170 | 0.80 | (1a) | ||
| [233] | 0.051C, 1.18Mn, 0.082Si, 0.042Al, 0.041Nb | X52 | R | 241 | 1.90 × 10⁻³ | 0.50 | 0.170 | 0.84 | (1a) | |
| [201] | 0.131–0.151C, 0.996–1.51Mn, 0.286–0.46Si, (0.241–0.258)Cr, (0.143–0.156)Mo, 0.009–0.011Ti, 0.001–0.016Nb, 0.017–0.046V | NbTiV | R | 200 | 325 | 3.70 × 10⁻³ | 0.15 | 0.155 | 0.77 | (6) |
| [60] | 0.03–0.5C, (17)Mn, 17–18.5Cr, (8.9)Ni | CrNi | T | 1.70 × 10⁻² | 0.090 | (1b) | ||||
| CrMn | T | 1.20 × 10⁻² | 0.070 | (1b) | ||||||
| [234] | 0.02C, 0.28Al, 10.21Cr, 10.11Ni, 5.06Mo, 1.05Ti | PH | C | 432 | 3.52 × 10⁻⁴ | 0.138 | 0.70 | (1b) | ||
| [235] | 0.02C, 0.3Si, 10.21Cr, 10.11Ni, 5.06Mo, 1.05Ti, 1.03V | V PH | C | 460 | 4.30 × 10⁻⁴ | 0.140 | 0.70 | (1b) | ||
| [236] | 0.02C, 0.3Si, 10.21Cr, 10.11Ni, 5.06Mo, 1.05Ti | PH | C | 460 | 4.30 × 10⁻⁴ | 0.139 | (1b) | |||
| [55] | 0.05–0.12C, 1.42–1.58Mn, 0.04–0.33Si, 0.023-0.039Al, (0.15–0.31)Mo, 0.001–0.007Ti, 0.028–0.035Nb | NbMo | T | <805 | 325 | 3.70 × 10⁻³ | 0.15 | 0.155 | 0.77 | (6) |
| [237] | 0.157–0.233C, 1.47–1.54Mn, 0.45–1.365Si | SiMn | C | 306 | 9.40 × 10⁻² | 0.20 | 0.160 | (4a) | ||
| CMn | C | 269 | 9.40 × 10⁻² | 0.20 | 0.160 | (4a) | ||||
| [238] | 0.094–0.1C, 0.5Mn, 0.15Si, 0.029–0.03Al, (0.034)Nb | CMn | T | 0.15 | 0.150 | (1a) | ||||
| CMnNb | T | 0.15 | 0.150 | (1a) | ||||||
| [239] | 0.092C, 1.67Mn, 0.19Si, 30.3Ni, 1.51Mo | Fe30Ni | C | 120 | 480 | 9.20 × 10⁻⁶ | 0.230 | 0.70 | (1b) | |
| [240] | 0.166C, 1.17Mn, 0.3Si | CMn | C | R | 300 | 5.60 × 10⁻⁴ | 0.30 | 0.170 | (1a) | |
| [120] | Not reported | - | T | 0.48 | ||||||
| [241,242] | 0.043C, 1.635Mn, 0.285Si, 16.679Cr, 10.225Ni, 2.7Mo | AISI 316 | C | 46 | 398 | 4.90 × 10⁻¹ | 0.127 | (4b) | ||
| [243] | Not reported | CMn | R | <150 | 4.88 × 10⁻⁴ | 0.90 | 0.170 | 1.00 | (1a) | |
| [39,40] | 0.02C, 1.6Mn, 18.5Cr, 8.2Ni | AISI 304 | T | 35 | 400 | 0.150 | 0.60 | (1b) | ||
| [244] | 0.45C, 0.63Mn, 0.28Si, 0.96Cr, 0.19Mo | 42CrMo | C | 463 | 2.92 × 10⁻³ | 0.102 | 0.80 | (1b) | ||
| [102] | 0.02C, 1.6Mn, 18.5Cr, 8.2Ni, 0.1Mo | AISI 304 | T | <60 | 400 | 2.65 × 10⁻¹ | 0.055 | (1b) | ||
| 2.13 × 10⁻¹ | 0.056 | (1b) | ||||||||
| [64,245] | 0.45C, 0.63Mn, 0.28Si, 0.96Cr, 0.19Mo | 42CrMo | C | 3.80 × 10⁻⁴ | 0.43 | 0.211 | 0.70 | (11a) | ||
| [246] | 0.45C, 0.63Mn, 0.28Si, 0.96Cr, 0.19Mo | 42CrMo | C | 321 | 1.76 × 10⁻¹ | 0.008 | (1b) | |||
| [247] | 0.2C, 1.2Mn, 0.4Si, 0.02Al, (0.03)Nb | 20MnSi | C | 135 | 359 | 0.52 | ||||
| 20MnSiNb | C | 135 | 419 | 0.52 | ||||||
| [248] | 0.13C, 0.17Mn, 0.01Si, 10.45Cr, 0.7Ni, 1.18Mo, 0.02Nb, 0.23V, 0.004B | 12Cr | C | 439 | 0.80 | |||||
| [249] | 0.1C, 1.25Mn, 0.2Si, 0.002Al, 0.011Ti, 0.03V | Ti | T | <70 | 312 | 5.77 × 10⁻³ | 0.30 | 0.120 | (1a) | |
| [250] | 0.11–0.13C, 1.15–1.25Mn, 0.15–0.18Si, (0.015–0.031)Ti, (0.038–0.039)Nb | Low C | C | 335 | 2.50 × 10⁻⁴ | 0.50 | 0.149 | 0.65 | (1a) | |
| Low C | C | 423 | 3.50 × 10⁻⁴ | 0.50 | 0.152 | 0.65 | (1a) | |||
| Low C | C | 361 | 2.60 × 10⁻⁴ | 0.50 | 0.150 | 0.65 | (1a) | |||
| Low C | C | 436 | 2.90 × 10⁻⁴ | 0.50 | 0.149 | 0.65 | (1a) | |||
| [251] | 0.0135C, 1.48Mn, 0.33Si, 17.1Cr, 11.5Ni, 2.525Mo | AISI 316L | C | 270 | 460 | 4.73 × 10⁻¹ | 0.03 | 0.035 | 0.70 | (1a) |
| [252] | 0.38C, 1.4Mn, 0.65Si, 0.16Cr, 0.04Ni, 0.02Ti, 0.1V | V | C | 110 | 306 | 1.12 × 10⁻² | 0.125 | 0.80 | (1b) | |
| [253] | 0.08–0.7C, 0.55–1.55Mn, 0.05–0.28Si, (0.07)Al, 0.07–0.23Cr, (0.33)Ni, (0.028)Nb, (0.049)V, (0.0005–0.0015)B | Low C | C | 338 | 0.80 | |||||
| High C | C | 316 | 0.80 | |||||||
| NbV | 0.80 | |||||||||
| [254] | 0.0038–0.042C, 1.464–1.469Mn, 0.297–0.354Si, 0.0021–0.0029Al, 0.0037–0.004V, 0.0029–0.0105B | B | C | 86 | 270 | 7.97 × 10⁻³ | 0.160 | 1.00 | (1b) | |
| B | C | 270 | 9.35 × 10⁻³ | 0.150 | 1.00 | (1b) | ||||
| B | C | 270 | 1.41 × 10⁻³ | 0.130 | 1.00 | (1b) | ||||
| B | C | 80 | 270 | 1.61 × 10⁻³ | 0.120 | 1.00 | (1b) | |||
| [255] | 0.18C, 1.11Mn, 0.71Si | 20SiMn | C | <40 | 318 | 5.00 × 10⁻³ | 0.12 | 0.127 | 0.80 | (1a) |
| [57] | 0.026C, 1.49Mn, 0.15Si, 0.097Nb | HTP | R | <1200 | 0.15 | 0.030 | (7a) | |||
| [65] | 0.99C, 0.31Mn, 0.24Si, 1.44Cr, 0.05Ni, 0.02Mo | GCr15 | C | 3.55 × 10⁻³ | 0.22 | 0.190 | 0.83 | (11b) | ||
| [256] | 0.42C, 0.75Mn, 0.2Si, 1.05Cr | 41Cr4 | C | 295 | 9.80 × 10⁻³ | 0.127 | (1b) | |||
| [257] | 0.06C, 1.1Mn, 0.15Mo, 0.035Nb | Nb | R | 325 | 2.80 × 10⁻³ | 0.15 | 0.155 | (6) | ||
| [258] | 0.1C | Low C | R | 341 | 4.40 ×10⁻⁴ | 0.50 | 0.089 | (1a) | ||
| [259] | 0.72-0.83C, 0.45-0.75Mn, 0.25Si, (0.04)Al, 0.1-0.3Cr | Eutectoid | M | <124 | 129 | 1.73 × 10⁻² | 0.18 | 0.145 | (1a) | |
| [260] | 0.05C, 0.54Mn, 0.28Si | Low C | TE | 120 | 307 | 9.10 × 10⁻⁴ | 0.48 | 0.130 | 0.65 | (1a) |
| [261] | 0.18C, 1.87Mn, 0.48Si, 1.18Al, 0.03Nb | TRIP | C | <106 | 420 | 1.05 × 10⁻³ | 0.11 | 0.145 | 0.79 | (1a) |
| [262] | 0.032–0.035C, 0.367–0.372Mn, 0.239–0.26Si, 1.13–1.144Cr, 1.91–1.93Ni, 0.007Mo, 0.193–0.195V, 0.0003–0.0117B | AHSS | C | 31 | 270 | 6.48 × 10⁻³ | 0.180 | (1b) | ||
| AHSS | C | 40 | 1.71 × 10⁻³ | 0.230 | (1b) | |||||
| [263] | 0.06C, 1Mn, 0.8Si, 13Cr | AISI 410 | C | 448 | 1.85 × 10⁻² | 0.072 | (1b) | |||
| [123,264,265,266,267] | 0.03C, 0.6Mn, 0.54Si, 15.14Cr, 4.53Ni, 0.19Mo, 0.25Nb, 0.005V | 17-4PH | C | 337 | 1.80 × 10⁻² | 0.110 | 0.47 | (1b) | ||
| [66] | 0.45C, 0.63Mn, 0.28Si, 0.96Cr, 0.19Mo | 42CrMo | C | 463 | 7.28 × 10⁻⁴ | 0.31 | 0.211 | (11a) | ||
| [268,269,270] | 0.06C, 1Mn, 0.8Si, 13Cr | AISI 410 | C | 448 | 3.00 × 10⁻³ | 0.120 | 0.80 | (1b) | ||
| 7.00 × 10⁻³ | 0.090 | (1b) | ||||||||
| [271,272] | 0.09C, 1.55Mn, 0.4Si, 0.028Al, 0.013Ti, 0.031Nb | NbTi | T | 375 | 8.59 × 10⁻⁴ | 0.189 | 0.64 | (1b) | ||
| [273] | 0.19C, 0.75Mn, 0.21Si | Low C | C | 124 | 140 | 0.95 | ||||
| [68] | Not reported | AISI 304 | C | 373 | 6.00 × 10⁻² | 0.070 | 0.46 | (1b) | ||
| [274] | 0.055C, 0.363Mn, 0.016Si, 0.033Al | SPHC | C | 299 | 9.30 × 10⁻⁴ | 0.200 | (1b) | |||
| [140] | 0.024–0.072C, 1.18–1.6Mn, 0.16–0.23Si, 0.027–0.058Al, 0.02–0.1Nb | Nb HSLA | C | <65 | 373 | 0.230 | (1a) | |||
| [56] | 0.11C, 1Mn, 0.11Si, 0.03Al, 0.034Nb | Nb | T | 365 | 402 | 0.50 | 0.170 | (6) | ||
| [275] | 0.14C, 14.94Mn, 0.48Si, 22.58Cr, 0.42Ni | High N | C | 747 | 0.56 | |||||
| [276] | 0.05–0.06C, 1.75–1.85Mn, 0.18–0.2Si, 0.08–0.095Mo, 0.015Ti | X80 | C | 365 | 0.51 | |||||
| X100 | C | 395 | 0.49 | |||||||
| [277] | 0.34C, 1.52Mn, 0.72Si, 0.0145Al, 0.018Ti, 0.083V | Med. CV | C | 394 | 7.90 × 10⁻³ | 0.103 | 0.62 | (1b) | ||
| [278] | 0.04C, 0.72Si, 16.1Cr, 25.5Ni, 5.8Mo | 16Cr25Ni | C | 484 | 0.60 | |||||
| [279] | 0.45C, 0.63Mn, 0.28Si, 0.96Cr, 0.19Mo | 42CrMo | C | >85 | 600 | 1.67 × 10⁻¹ | 0.067 | 0.37 | (4b) | |
| [280] | 0.04C, 0.78Mn, 0.25Si, 0.62Cr, 3.55Ni, 0.64Mo, 0.009Ti, 0.033Nb, 0.015V | HSLA100 | C | 377 | 1.40 × 10⁻² | 0.110 | (1b) | |||
| [281] | 0.16C, 0.46Mn, 0.28Si, 11.98Cr, 0.12Ni, 0.029Mo, 0.22Nb, 0.0128V | 403Nb | C | 367 | 1.90 × 10⁻³ | 0.161 | 0.66 | (1b) | ||
| [282] | 0.03C, 25.45Mn, 3.06Si, 2.88Al | TWIP | C | 150 | 406 | 8.65 × 10⁻³ | 0.087 | 0.70 | (1b) | |
| [283] | 0.084C, 1.049Mn, 0.199Si, 0.038Al, 0.019Cr, 0.017Ni, 0.007Mo, 0.003Ti, 0.026Nb, 0.003V | Nb | C | 60 | 379 | 1.02 × 10⁻⁴ | 0.50 | 0.184 | (1a) | |
| [284] | 0.57C, 23.2Mn, 0.17Si, 0.01Al, 0.31Cr, 0.19Ni, 0.04Mo | Fe26Mn06C | C | 90 | 439 | 4.79 × 10⁻³ | 0.112 | 0.55 | (1b) | |
| [285] | 0.0038–0.042C, 1.464–1.469Mn, 0.297–0.354Si, 0.0021–0.0029Al, 0.0037–0.004V, 0.0029–0.0105B | B | C | 83 | 0.53 | |||||
| [286] | 0.33C, 0.67Mn, 0.32Si, 1Cr, 0.21Mo | AISI 4130 | C | 491 | 9.80 × 10⁻³ | 0.080 | 0.80 | (1b) | ||
| [287] | 0.18C, 1.42Mn, 0.18Si, 0.13Cr, 0.89Ni, 0.5Mo | SA508-3 | C | 20 | 333 | 3.63 × 10⁻³ | 0.46 | 0.092 | 0.85 | (1a) |
| [288] | 0.12C, 1.55Mn, 0.25Si, 0.033V | MnCuV | C | 551 | 2.19 × 10⁻⁴ | 0.141 | (1b) | |||
| 1.35 × 10⁻⁴ | 0.145 | (1b) | ||||||||
| [289] | 0.097C, 0.5Mn, 0.34Si, 8.87Cr, 0.27Ni, 0.48Mo, 0.076Nb, 0.2V, 0.0032B | P92 | C | 437 | 0.80 | |||||
| [290] | 0.16C, 1.53Mn, 0.52Si, 0.027Nb | Nb | C | 360 | 0.80 | |||||
| [291] | 0.45C, 0.63Mn, 0.28Si, 0.96Cr, 0.19Mo | 42CrMo | C | <155 | 247 | 7.28 × 10⁻⁴ | 0.31 | 0.210 | 0.70 | (1a) |
| [292] | 0.05C, 1.56Mn, 0.23Si, 0.033Al, 0.02Ni, 0.17Mo, 0.015Ti, 0.046Nb | X70 | C | 393 | 2.60 × 10⁻⁴ | 0.216 | 0.40 | (1b) | ||
| [293] | 0.27C, 0.3Mn, 0.2Si, 1.5Cr, 3.7Ni, 0.35Mo, 0.1V | 26NiCrMoV14-5 | C | 437 | 1.10 × 10⁻³ | 0.159 | 0.70 | (1b) | ||
| [294] | 0.17C, 0.68Mn, 0.22Si | Q235A | C | <450 | 495 | 2.28 × 10⁻⁵ | 0.198 | (1b) | ||
| [295] | 0.05C, 1Mn, 0.8Si, 13.09Cr | 13Cr | C | 176 | 413 | 6.00 ×10⁻⁴ | 0.430 | 0.68 | (1b) | |
| 2.80 × 10⁻⁴ | 0.450 | (1b) | ||||||||
| [231,296] | 0.002C, 0.13Mn, 0.02Si, 0.03Al, 0.037Cr, 0.025Ni, 0.008Mo, 0.062Ti, 0.002Nb, 0.002V | Ti IF | T | 0.43 | ||||||
| [297,298] | 0.42C, 1.33Mn, 0.76Si, 0.13Cr, 0.017Ni, 0.02Ti, 0.1V | 38MnVS | C | 275 | 4.27 × 10⁻² | 0.130 | 0.80 | (1b) | ||
| 4.67 × 10⁻³ | 0.110 | (1b) | ||||||||
| [299] | 0.45C, 1.22Mn, 0.25Si, 0.032Al, 0.15Cr, 0.12V | AlVN air cool. | C | 130 | 420 | 6.90 × 10⁻³ | 0.100 | 0.65 | (1b) | |
| AlVN water cool. | C | 130 | 480 | 5.60 × 10⁻³ | 0.090 | (1b) | ||||
| AlVN water cool. | C | 3.90 × 10⁻³ | 0.080 | (1b) | ||||||
| [300] | 0.56C, 15.83Mn | CuFe16Mn06C | C | 505 | 9.08 × 10⁻² | 0.019 | (1b) | |||
| 3.32 × 10⁻² | 0.028 | (1b) | ||||||||
| [301] | 0.105C, 0.7Mn, 0.5Si, 11.25Cr, 0.5Ni, 0.425Mo, 0.07Nb, 0.225V, 0.005B | T122 | C | 440 | 1.63 × 10⁻⁶ | 0.421 | (5) | |||
| [75] | 0.1C, 1Mn, 0.17Si, 0.02Al, 12Cr, 1Ni, 1Mo, 0.2V, 0.001B | CNS-II F/M | C | 465 | 6.58 × 10¹² | 0.551 | 0.50 | (1b) | ||
| 3.29 × 10¹⁵ | 0.678 | (1b) | ||||||||
| [302] | 0.009C, 1.5Mn, 0.42Si, 20.1Cr, 25.59Ni, 4.49Mo | AISI 904L | C | >200 | 459 | 5.24 × 10⁻⁶ | 0.250 | (1b) | ||
| [303,304] | 0.23–0.26C, 1.5–1.56Mn, 0.1–1.72Si, 0.1–1.79Al, 1–1.07Cr, 1–1.03Ni, 0.25–0.26Mo, 0.025Ti, 0.06Nb, 0.0051–0.006B | High Si | C | 396 | 1.97 × 10⁻³ | 0.149 | (1b) | |||
| High Al | C | 310 | 3.13 × 10⁻² | 0.100 | (1b) | |||||
| [305] | 0.39C, 0.69Mn, 1.61Si, 0.91Cr, 1.82Ni, 0.42Mo, 0.07V | 300M | C | <150 | 381 | 2.20 × 10⁻¹ | -0.25 | 0.030 | 0.80 | (1a) |
| [306] | 0.02C, 1.76Mn, 18.38Cr, 8.37Ni, 0.4Mo | AISI 304L | C | <140 | 392 | 0.53 | ||||
| [307] | 0.55C, 0.75Mn, 1.3Si, 0.49Mo | 55SiMnMo | C | 4.36 × 10⁻⁴ | 0.30 | 0.113 | 0.83 | (11a) | ||
| [308] | 0.36C, 1.42Mn, 0.27Si, 0.001Al, 0.089V | Med. CV | C | 273 | 5.64 × 10⁻³ | 0.175 | 0.42 | (1b) | ||
| 2.81 × 10⁻⁴ | 0.262 | (1b) | ||||||||
| [309] | 0.02C, 0.82Mn, 0.87Si, 21.23Cr, 6.55Ni, 3.03Mo | 1.4462 DSS | C | 526 | 4.05 × 10⁻³ | 0.110 | (1b) | |||
| [310] | 0.32C, 1.26Mn, 0.29Si, 1.9Cr, 0.97Ni, 0.39Mo | 3Cr2NiMnMo | C | 97 | 346 | 0.80 | ||||
| [311] | 0.07–0.09C, 1.2–1.51Mn, 0.04Al, 0.02–0.1Cr, 0.02–0.12Ni, 0–0.27Mo, 0.016–0.035Ti, 0.045–0.067Nb, 0.003V, 0.0003B | Low CMoNbTi | C | 0.42 | ||||||
| [312] | 0.072C, 1.45Mn, 0.201Si, 0.023Al, 0.174Cr, 0.009Ni, 0.24Mo, 0.015Ti, 0.047Nb, 0.05V | X65 | C | 330 | 4.48 × 10⁻³ | 0.153 | 0.60 | (1b) | ||
| [313] | 0.052–0.059C, 0.78–0.79Mn, 0.17Si, 0.22–0.24Cr, 4.99–5.19Ni, 0.19–0.2Mo, 0.005–0.04Nb | A340 | C | 394 | 0.83 | |||||
| B270 | C | 462 | 0.83 | |||||||
| [314] | 0.03C, 0.5Mn, 0.3Si, 29Ni | Fe29Ni17Co | C | 423 | 1.70 × 10⁻³ | 0.160 | (1b) | |||
| [315] | 0.076C, 0.45Mn, 0.18Si, 0.025Al, 8.83Cr, 0.043Ni, 0.005Ti, 0.042Nb, 0.19V, 0.013B | G115 | C | 494 | 0.80 | |||||
| [316] | 0.55C, 0.75Mn, 1.3Si, 0.49Mo | 55SiMnMo | C | 319 | 2.67 × 10⁻³ | 0.132 | 0.45 | (1b) | ||
| [317] | 0.082C, 1.47Mn, 0.36Si, 0.053Al, 0.03Ni, 0.051Nb, 0.08V | Nb | C | 208 | 3.70 × 10⁻³ | 0.15 | 0.155 | (6) | ||
| [318] | 0.018C, 1.2Mn, 0.27Si, 0.04Al, 0.1Mo, 0.021Ti, 0.06Nb, 0.003V | X70 | C | 19 | 418 | 2.80 × 10⁻³ | 0.129 | (1b) | ||
| [319] | 0.08C, 1.06Mn, 0.2Si, 0.5Cr, 0.28Ni, 0.18Mo, 0.01Ti, 0.04Nb | Low C | C | <75 | 442 | 4.68 × 10⁻³ | 0.109 | 0.53 | (1b) | |
| 1.52 × 10⁻² | 0.059 | (1b) | ||||||||
| [320] | 0.99C, 0.31Mn, 0.23Si, 0.022Al, 1.47Cr, 0.04Ni, 0.02Mo | GCr15 | C | 356 | 1.00 × 10⁻² | 0.440 | 0.80 | (11) | ||
| [135] | 0.15–0.47C, 0.63–1.73Mn, 0.24–0.47Si, 0.007–0.012Al, 0.075-0.22Cr, 0.01–0.034Mo | CMnSi | C | 104 | 270 | 6.90 × 10⁻³ | 0.163 | 0.53 | (1b) | |
| CMnSi | C | 70 | 270 | 6.44 × 10⁻³ | 0.168 | 0.53 | (1b) | |||
| CMnSi | C | 90 | 270 | 7.82 × 10⁻³ | 0.160 | 0.53 | (1b) | |||
| CMnSi | C | 65 | 270 | 6.75 × 10⁻³ | 0.166 | 0.53 | (1b) | |||
| CMnSi | C | 101 | 270 | 7.99 × 10⁻³ | 0.146 | 0.53 | (1b) | |||
| CMnSi | C | 82 | 270 | 7.63 × 10⁻³ | 0.152 | 0.53 | (1b) | |||
| CMnSi | C | 100 | 270 | 8.30 × 10⁻³ | 0.148 | 0.53 | (1b) | |||
| CMnSi | C | 103 | 270 | 8.38 × 10⁻³ | 0.149 | 0.53 | (1b) | |||
| [321] | 0.43C, 1.451Mn, 0.623Si, 0.017Al, 0.198Cr, 0.017Ti, 0.113V | 38MnVS6 | C | 348 | 5.80 × 10⁻³ | 0.123 | 0.77 | (1b) | ||
| [322] | 0.021C, 1.25Mn, 0.09Si, 9.37Cr, 0.06Nb, 0.15V | NS | C | 451 | 0.45 | |||||
| [67] | 0.96C, 0.36Mn, 0.19Si, 1.46Cr, 0.08Ni, 0.02Mo | GCr15 | C | <203 | 3.38 × 10⁻² | 0.03 | 0.197 | 0.78 | (11a) | |
| [323] | 0.19C, 1.5Mn, 0.37Si, 0.019Ti, 0.06V | Low CVN | C | 309 | 1.05 × 10⁻² | 0.112 | 0.48 | (1b) | ||
| 9.18 × 10⁻³ | 0.095 | (1b) | ||||||||
| [324] | 0.024–0.027C, 1.08–1.43Mn, 0.38–0.59Si, 0.003–0.012Al, 17.13–18.21Cr, 8.11–9.11Ni, 0.001–0.346Ti, 0.0003–0.0031B | AISI 304 | C | 446 | 1.80 × 10⁻³ | 0.130 | 0.68 | (1b) | ||
| AISI 321 | C | 465 | 1.90 × 10⁻³ | 0.130 | 0.69 | (1b) | ||||
| [325] | 0.0055–0.37C, 1.45–1.46Mn, 0.38Si, 0.001Al, 0.08–0.089V | V | C | 288 | 7.75 × 10⁻³ | 0.156 | 0.39 | (1b) | ||
| V | C | 280 | 1.92 × 10⁻³ | 0.174 | 0.38 | (1b) | ||||
| V | C | 5.65 × 10⁻³ | 0.170 | (1b) | ||||||
| V | C | 1.57 × 10⁻³ | 0.182 | (1b) | ||||||
| [124] | Not reported | AISI 304 | C | 0.68 | ||||||
| [326] | (0.055–0.36)C, (1.41–1.42)Mn, (0.27–0.35)Si, (0.001)Al, (0.036–0.044)Nb | CMn | C | 278 | 1.16 × 10⁻² | 0.140 | 0.39 | (1b) | ||
| Nb | C | 347 | 2.63 × 10⁻² | 0.009 | 0.45 | (1b) | ||||
| Nb | C | 360 | 1.57 × 10⁻³ | 0.183 | 0.34 | (1b) | ||||
| CMn | C | 3.27 × 10⁻³ | 0.153 | (1b) | ||||||
| Nb | C | 2.86 × 10⁻³ | 0.141 | (1b) | ||||||
| Nb | C | 1.17 × 10⁻³ | 0.157 | (1b) | ||||||
| [327] | 0.025C, 1.74Mn, 0.2Si, 17.57Cr, 12.15Ni, 2.53Mo | AISI 316L | C | 433 | 2.36 × 10⁻¹ | 0.022 | (1b) | |||
| [328] | 0.1C, 1.35Mn, 0.03Si, 0.01Al | Low CS | C | 330 | 1.00 × 10⁻² | 0.110 | 0.50 | (1b) | ||
| [329] | 0.04C, 1.61Mn, 0.17Si, 0.014Ti, 0.06Nb, 0.03V | NbTiV | C | 804 | 332 | 2.27 × 10⁻³ | 0.15 | 0.160 | 0.68 | (1a) |
| [330] | 0.06C, 1.5Mn, 0.6Si, 0.03Al, 0.03Ti, 0.03Nb, 0.01V | CMnVNb | C | <135 | 210 | 1.60 × 10⁻¹ | 0.42 | 0.160 | 0.80 | (1a) |
| [331] | 0.11C, 21Mn, 2.7Si, 1.6Al | TWIP | C | 4.74 × 10⁻² | 0.052 | 0.43 | (1b) | |||
| 0.009 | (7b) | |||||||||
| [332] | 0.241C, 1.538Mn, 0.287Si, 0.026Al, 0.197Cr, 0.002Ti, 0.049Nb, 0.12V | Med. CNbV | C | 458 | 1.72 × 10⁻³ | 0.132 | 0.37 | (1b) | ||
| 3.04 × 10⁻³ | 0.090 | (1b) | ||||||||
| [333] | 0.45C, 1.2Mn, 0.15Si, 0.02Al, 0.1Cr, 0.2Ni, 0.05Mo, 0.08V | S45CVMn | C | 140 | 379 | 8.15 × 10⁻³ | 0.107 | 0.68 | (1b) | |
| 5.46 × 10⁻³ | 0.112 | (1b) | ||||||||
| [334] | 0.36C, 0.65Mn, 0.22Si, 0.95Cr, 0.2Mo | 35CrMo | C | 100 | 305 | 6.98 × 10⁻⁴ | 0.30 | 0.168 | 0.80 | (1a) |
| [335] | 0.28C, 0.22Mn, 0.006Si, 0.007Al, 1.85Cr, 3.35Ni, 0.42Mo, 0.089V | 30Cr2Ni4MoV | C | 368 | 8.18 × 10⁻³ | 0.113 | 0.83 | (1b) | ||
| [336] | 0.009C, 1.5Mn, 0.42Si, 20.1Cr, 25.59Ni, 4.49Mo | 904L SASS | C | 443 | 1.35 × 10⁻⁵ | 0.240 | 0.59 | (1b) | ||
| 4.16 × 10⁻⁶ | 0.250 | (1b) | ||||||||
| [337] | 0.09–0.15C, 0.4–0.41Mn, 0.29–0.43Si, 0.0026–0.0048Al, 1.3–1.33Cr, 2.26–2.44Ni, 0.22–0.24V, (0.0014–0.0214)B | B | C | 270 | 1.90 × 10⁻² | 0.110 | (1b) | |||
| B | C | 270 | 2.30 × 10⁻² | 0.100 | (1b) | |||||
| B | C | 270 | 2.00 × 10⁻² | 0.110 | (1b) | |||||
| B | C | 270 | 1.00 × 10⁻² | 0.140 | (1b) | |||||
| B | C | 270 | 1.20 × 10⁻² | 0.130 | (1b) | |||||
| B | C | 270 | 6.30 × 10⁻³ | 0.160 | (1b) | |||||
| [338] | 0.04C, 1.26Mn, 0.31Si, 16.05Cr, 10Ni, 2.01Mo | 316 | C | 55 | 368 | 1.90 × 10⁻² | 0.090 | 0.65 | (1b) | |
| [339] | 0.4C, 0.7Mn, 0.3Si, 0.015Al, 0.9Cr | 40Cr | C | 2.40 × 10⁻² | 0.125 | 0.82 | (11) | |||
| [340] | 0.034C, 0.91Mn, 0.38Si, 13.18Cr, 5.11Ni, 0.86Mo | F6NM | C | 458 | 0.66 | |||||
| [341] | 1.02C, 1.07Mn, 0.55Si, 1.49Cr | GCr15SiMn | C | 304 | 3.46 × 10⁻¹ | 0.057 | (4b) | |||
| [342] | 0.18C, 1.42Mn, 0.18Si, 0.13Cr, 0.89Ni, 0.5Mo | SA508-III | C | <1200 | 373 | 1.50 × 10⁻³ | 0.171 | (1b) | ||
| [343] | 0.052C, 1.63Mn, 0.2Si, 0.2Cr, 0.19Ni, 0.002V | X70HD | C | 358 | 0.026 | (7b) | ||||
| [344] | 0.29–0.3C, 0.55–0.6Mn, 0.38–0.4Si, 1.2–1.97Cr, (2.2)Ni, 0.3–0.34Mo, (0.06)Ti | 4135 | C | 374 | 4.81 × 10⁻³ | 0.126 | (1b) | |||
| VCN200 | C | 435 | 3.45 × 10⁻³ | 0.123 | (1b) | |||||
| [345] | 0.3C, 2.2Mn, 0.2Si, 1.4Cr, 0.275Mo, 0.035Nb | MnCrNb SPD1 | C | 257 | 1.05 × 10⁻³ | 0.224 | (1b) | |||
| 4.87 × 10⁻⁵ | 0.293 | (11) | ||||||||
| [346] | 0.015C, 0.7Mn, 0.5Si, 20Cr, 18Ni, 6.2Mo | 254SMO | C | 200 | 578 | 8.00 × 10⁻² | 0.115 | 0.72 | (4b) | |
| 578 | 5.00 × 10⁻² | 0.129 | (4b) | |||||||
| [139] | 0.035–0.52C, 0.14–1.58Mn, 0.001–0.3Si, 0.01–0.122Al | CMn | C | 91 | 321 | 0.200 | 0.65 | (1a) | ||
| CMn | C | 290 | 321 | 0.190 | (1a) | |||||
| CMn | C | 98 | 300 | 0.200 | (1a) | |||||
| CMn | C | 300 | 300 | 0.210 | (1a) | |||||
| CMn | C | 50 | 333 | 0.150 | (1a) | |||||
| CMn | C | 218 | 333 | 0.160 | (1a) | |||||
| [347] | 0.18C, 1.4Mn, 0.17Si, 0.022Al, 0.14Cr, 0.79Ni, 0.51Mo, 0.005V | SA508-III | C | 376 | 1.38 × 10⁻³ | 0.172 | (1b) | |||
| 376 | 4.00 × 10⁻⁴ | 0.196 | (1b) | |||||||
| [348] | 0.52C, 0.33Mn, 0.2Si, 1.92Cr, 0.72Ni, 0.25Mo, 0.036Nb | CrNimoNb | C | 386 | 1.07 × 10⁻² | 0.100 | 0.37 | (1b) | ||
| 386 | 3.96 × 10⁻³ | 0.100 | (1b) | |||||||
| [349] | 0.06–0.5C, 0.42–0.68Mn, 0.12–0.2Si | Low C | C | 53 | 270 | 6.20 × 10⁻³ | 0.53 | (1b) | ||
| Med. C | C | 78 | 270 | 1.23 × 10⁻² | 0.54 | |||||
| [350] | 0.053C, 1.567Mn, 0.31Si, 0.236Ni, 0.246Mo, 0.014Ti, 0.0012B | MnMoB | C | 9.72 × 10⁻⁴ | 0.146 | (1b) | ||||
| 8.65 × 10⁻⁴ | 0.146 | (1b) |
References
- Jonas, J.J.; Sellars, C.M.; Tegart, W.J.M. Strength and structure under hot-working conditions. Metall. Rev. 1969, 14, 1–24. [Google Scholar]
- Anand, L. Constitutive equations for hot-working of metals. Int. J. Plast. 1985, 1, 213–231. [Google Scholar] [CrossRef]
- Brown, S.B.; Kim, K.H.; Anand, L. An internal variable constitutive model for hot working of metals. Int. J. Plast. 1989, 5, 95–130. [Google Scholar] [CrossRef]
- Jonas, J.J. Dynamic recrystallization-scientific curiosity or industrial tool? Mater. Sci. Eng. A 1994, 184, 155–165. [Google Scholar] [CrossRef]
- Luton, M.J.; Sellars, C.M. Dynamic recrystallization in nickel and nickel-iron alloys during high temperature deformation. Acta Metall. 1969, 17, 1033–1043. [Google Scholar] [CrossRef]
- Sellars, C.M. Dynamic recrystallization. Met. Forum 1981, 4, 75–80. [Google Scholar]
- Sakai, T.; Jonas, J.J. Overview no. 35 Dynamic recrystallization: Mechanical and microstructural considerations. Acta Metall. 1984, 32, 189–209. [Google Scholar] [CrossRef]
- Humphreys, F.J.; Hatherly, M. Recrystallisation and Related Annealing Phenomena, 1st ed.; Pergamon: Oxford, UK, 1996. [Google Scholar]
- Sah, J.P.; Richardson, G.J.; Sellars, C.M. Quantitative correlation between high temperature strength & the kinetics of dynamic recrystallization. Indian J. Technol. 1973, 11, 445–452. [Google Scholar]
- Sakai, T.; Belyakov, A.; Kaibyshev, R.; Miura, H.; Jonas, J.J. Dynamic and post-dynamic recrystallization under hot, cold and severe plastic deformation conditions. Prog. Mater. Sci. 2014, 60, 130–207. [Google Scholar] [CrossRef]
- Gottstein, G.; Brünger, E.; Frommert, M.; Goerdeler, M.; Zeng, M. Prediction of the critical conditions for dynamic recrystallization in metals. Z. Für Met. 2003, 94, 628–635. [Google Scholar] [CrossRef]
- Busso, E.P. A continuum theory for dynamic recrystallization with microstructure-related length scales. Int. J. Plast. 1998, 14, 319–353. [Google Scholar] [CrossRef]
- Wray, P.J. Onset of recrystallization during the tensile deformation of austenitic iron at intermediate strain rates. Metall. Trans. A 1975, 6, 1197–1203. [Google Scholar] [CrossRef]
- Poliak, E.I.; Jonas, J.J. A one-parameter approach to determining the critical conditions for the initiation of dynamic recrystallization. Acta Mater. 1996, 44, 127–136. [Google Scholar] [CrossRef]
- Sakai, T. Dynamic recrystallization microstructures under hot working conditions. J. Mater. Process. Technol. 1995, 53, 349–361. [Google Scholar] [CrossRef]
- Belyakov, A.; Miura, H.; Sakai, T. Dynamic recrystallization under warm deformation of a 304 type austenitic stainless steel. Mater. Sci. Eng. A 1998, 255, 139–147. [Google Scholar] [CrossRef]
- Rios, P.R.; Siciliano, F.; Zschommler Sandim, H.R.; Plaut, R.L.; Padilha, A.F. Nucleation and growth during recrystallization. Mater. Res. 2005, 8, 225–238. [Google Scholar] [CrossRef]
- Doherty, R.D.; Hughes, D.A.; Humphreys, F.J.; Jonas, J.J.; Juul Jensen, D.; Kassner, M.E.; King, W.E.; McNelley, T.R.; McQueen, H.J.; Rollett, A.D. Current issues in recrystallization: A review. Mater. Sci. Eng. A 1997, 238, 219–274. [Google Scholar] [CrossRef]
- Ponge, D.; Gottstein, G. Necklace formation during dynamic recrystallization: Mechanisms and impact on flow behavior. Acta Mater. 1998, 46, 69–80. [Google Scholar] [CrossRef]
- Sah, J.P.; Richardson, G.J.; Sellars, C.M. Grain-size effects during dynamic recrystallization of nickel. Met. Sci. 1974, 8, 325–331. [Google Scholar] [CrossRef]
- Roberts, W.; Boden, H.; Ahlblom, B. Dynamic recrystallization kinetics. Met. Sci. 1979, 13, 195–205. [Google Scholar] [CrossRef]
- Ouchi, C.; Okita, T. Dynamic recrystallization behavior of austenite in Nb-bearing high strength low alloy steels and stainless steel. Trans. Iron Steel Inst. Japan 1982, 22, 543–551. [Google Scholar] [CrossRef][Green Version]
- Lenard, J.G.; Pietrzyk, M.; Cser, L. Mathematical and Physical Simulation of the Properties of Hot Rolled Products, 1st ed.; Elsevier Science Ltd.: Oxford, UK, 1999. [Google Scholar]
- Derby, B. The dependence of grain size on stress during dynamic recrystallisation. Acta Metall. Mater. 1991, 39, 955–962. [Google Scholar] [CrossRef]
- Weiss, I.; Jonas, J.J. Interaction between recrystallization and precipitation during the high temperature deformation of HSLA steels. Metall. Trans. A 1979, 10, 831–840. [Google Scholar] [CrossRef]
- Stewart, G.R.; Jonas, J.J.; Montheillet, F. Kinetics and critical conditions for the initiation of dynamic recrystallization in 304 stainless steel. ISIJ Int. 2004, 44, 1581–1589. [Google Scholar] [CrossRef]
- Weiss, I.; Sakai, T.; Jonas, J.J. Effect of test method on transition from multiple to single peak dynamic recrystallization. Met. Sci. J. 1984, 18, 77–84. [Google Scholar] [CrossRef]
- Siciliano, F., Jr.; Jonas, J.J. Mathematical modeling of the hot strip rolling of microalloyed Nb, multiply-alloyed Cr-Mo, and plain C-Mn steels. Metall. Mater. Trans. A 2000, 31, 511–530. [Google Scholar] [CrossRef]
- Poliak, E.I.; Jonas, J.J. Initiation of dynamic recrystallization in constant strain rate hot deformation. ISIJ Int. 2003, 43, 684–691. [Google Scholar] [CrossRef]
- Zener, C.; Hollomon, J.H. Effect of strain rate upon plastic flow of steel. J. Appl. Phys. 1944, 15, 22–32. [Google Scholar] [CrossRef]
- Varela-Castro, G.; Cabrera, J.M.; Prado, J.M. On the onset of dynamic recrystallization in steels. Adv. Mater. Res. 2012, 409, 431–436. [Google Scholar] [CrossRef]
- le Bon, A.; Rofes-Vernis, J.; Rossard, C. Recrystallisation et précipitation provoquées par la déformation à chaud: Cas d’un acier de construction soudable au niobium. Mémoires Sci. La Rev. Métallurgie 1973, 70, 577–588. [Google Scholar]
- Sellars, C.M. Physical metallurgy of hot working. In Hot Working and Forming Processes; Met Soc: Sheffield, UK, 1980; pp. 3–15. [Google Scholar]
- Rossard, C.; Blain, P. Evolution de la structure de l’acier sous l’effet de la déformation plastique à chaud. Mémoires Sci. La Rev. Métallurgie 1959, 56, 285–300. [Google Scholar]
- Glover, G.; Sellars, C.M. Recovery and recrystallization during high temperature deformation of α-iron. Metall. Trans. 1973, 4, 765–775. [Google Scholar] [CrossRef]
- Maki, T.; Akasaka, K.; Okuno, K.; Tamura, I. Dynamic recrystallization of austenite in 18-8 stainless steel and 18 Ni maraging steel and its related phenomena. Tetsu-to-Hagané 1980, 66, 1659–1668. [Google Scholar] [CrossRef][Green Version]
- Maki, T.; Akasaka, K.; Okuno, K.; Tamura, I. Dynamic recrystallization of austenite in 18-8 stainless steel and 18 Ni maraging steel. Trans. Iron Steel Inst. Japan 1982, 22, 253–261. [Google Scholar] [CrossRef]
- Ueki, M.; Horie, S.; Nakamura, T. Factors affecting dynamic recrystallization of metals and alloys. Mater. Sci. Technol. 1987, 3, 329–337. [Google Scholar] [CrossRef]
- Dehghan-Manshadi, A.; Barnett, M.R.; Hodgson, P.D. Recrystallization in AISI 304 austenitic stainless steel during and after hot deformation. Mater. Sci. Eng. A 2008, 485, 664–672. [Google Scholar] [CrossRef]
- Dehghan-Manshadi, A.; Barnett, M.R.; Hodgson, P.D. Hot deformation and recrystallization of austenitic stainless steel: Part I. Dynamic recrystallization. Metall. Mater. Trans. A 2008, 39, 1359–1370. [Google Scholar] [CrossRef]
- Stewart, G.R.; Elwazri, A.M.; Yue, S.; Jonas, J.J. Modelling of dynamic recrystallisation kinetics in austenitic stainless and hypereutectoid steels. Mater. Sci. Technol. 2006, 22, 519–524. [Google Scholar] [CrossRef]
- Beladi, H.; Cizek, P.; Hodgson, P.D. Dynamic recrystallization of austenite in Ni-30 pct Fe model alloy: Microstructure and texture evolution. Metall. Mater. Trans. A 2009, 40, 1175–1189. [Google Scholar] [CrossRef]
- Laasraoui, A.; Jonas, J.J. Prediction of steel flow stresses at high temperatures and strain rates. Metall. Trans. A 1991, 22, 1545–1558. [Google Scholar] [CrossRef]
- Mintz, B.; Jonas, J.J.; Abushosha, R. Effect of grain refinement and grain coarsening on shapes of dynamic recrystallisation flow curves for C-Mn-Al steels. Mater. Sci. Technol. 1991, 7, 904–913. [Google Scholar] [CrossRef]
- Mintz, B.; Abushosha, R.; Jonas, J.J. Influence of dynamic recrystallisation on the tensile ductility of steels in the temperature range 700 to 1150 °C. ISIJ Int. 1992, 32, 241–249. [Google Scholar] [CrossRef]
- Medina, S.F.; Hernandez, C.A. General expression of the Zener-Hollomon parameter as a function of the chemical composition of low alloy and microalloyed steels. Acta Mater. 1996, 44, 137–148. [Google Scholar] [CrossRef]
- Medina, S.F.; Hernandez, C.A. The influence of chemical composition on peak strain of deformed austenite in low alloy and microalloyed steels. Acta Mater. 1996, 44, 149–154. [Google Scholar] [CrossRef]
- Hernandez, C.A.; Medina, S.F.; Ruiz, J. Modelling austenite flow curves in low alloy and microalloyed steels. Acta Mater. 1996, 44, 155–163. [Google Scholar] [CrossRef]
- Medina, S.F.; Hernandez, C.A. Modelling of the dynamic recrystallization of austenite in low alloy and microalloyed steels. Acta Mater. 1996, 44, 165–171. [Google Scholar] [CrossRef]
- Kim, S.-I.; Yoo, Y.-C. Dynamic recrystallization behavior of AISI 304 stainless steel. Mater. Sci. Eng. A 2001, 311, 108–113. [Google Scholar] [CrossRef]
- Kowalski, B.; Sellars, C.M.; Pietrzyk, M. Development of a computer code for the interpretation of results of hot plane strain compression tests. ISIJ Int. 2000, 40, 1230–1236. [Google Scholar] [CrossRef]
- Minami, K.; Siciliano, F., Jr.; Maccagno, T.M.; Jonas, J.J. Mathematical modeling of mean flow stress during the hot strip rolling of Nb steels. ISIJ Int. 1996, 36, 1507–1515. [Google Scholar] [CrossRef]
- Fernández, A.I.; Uranga, P.; López, B.; Rodriguez-Ibabe, J.M. Dynamic recrystallization behavior covering a wide austenite grain size range in Nb and Nb-Ti microalloyed steels. Mater. Sci. Eng. A 2003, 361, 367–376. [Google Scholar] [CrossRef]
- Elwazri, A.M.; Wanjara, P.; Yue, S. Dynamic recrystallization of austenite in microalloyed high carbon steels. Mater. Sci. Eng. A 2003, 339, 209–215. [Google Scholar] [CrossRef]
- Pereda, B.; Fernández, A.I.; López, B.; Rodriguez-Ibabe, J.M. Effect of Mo on dynamic recrystallization behavior of Nb-Mo microalloyed steels. ISIJ Int. 2007, 47, 860–868. [Google Scholar] [CrossRef]
- Solhjoo, S.; Ebrahimi, R. Prediction of no-recrystallization temperature by simulation of multi-pass flow stress curves from single-pass curves. J. Mater. Sci. 2010, 45, 5960–5966. [Google Scholar] [CrossRef]
- Zhu, G.-H.; Subramanian, S.V. Recrystallization behavior design for controlling grain size in strip rolling process. J. Iron Steel Res. Int. 2008, 15, 39–44. [Google Scholar] [CrossRef]
- San Martín, G.E.; Núñez Pettinari, S.I.; Ruzzante, J.E.; Merlone, G.F. Prediction of the onset of dynamic recrystallization in different types of steels. Scr. Metall. Mater. 1992, 26, 405–410. [Google Scholar] [CrossRef]
- San Martín, G.E.; Ruzzante, J.E. Characterization of true stress-true strain curves obtained by hot deformation of different types of steels. Scr. Metall. Mater. 1993, 29, 919–924. [Google Scholar] [CrossRef]
- Kuc, D.; Niewielski, G.; Cwajna, J. Influence of deformation parameters and initial grain size on the microstructure of austenitic steels after hot-working processes. Mater. Charact. 2006, 56, 318–324. [Google Scholar] [CrossRef]
- Panigrahi, B.K. Processing of low carbon steel plate and hot strip—An overview. Bull. Mater. Sci. 2001, 24, 361–371. [Google Scholar] [CrossRef]
- Sun, W.P.; Hawbolt, E.B. Comparison between static and metadynamic recrystallization—An application to the hot rolling of steels. ISIJ Int. 1997, 37, 1000–1009. [Google Scholar] [CrossRef]
- Yanagida, A.; Yanagimoto, J. Regression method of determining generalized description of flow curve of steel under dynamic recrystallization. ISIJ Int. 2005, 45, 858–866. [Google Scholar] [CrossRef]
- Lin, Y.C.; Chen, M.-S.; Zhong, J. Effects of deformation temperatures on stress/strain distribution and microstructural evolution of deformed 42CrMo steel. J. Mater. Des. 2009, 30, 908–913. [Google Scholar] [CrossRef]
- Yue, C.-X.; Zhang, L.-W.; Liao, S.-L.; Pei, J.-B.; Gao, H.-J.; Jia, Y.-W.; Lian, X.-J. Research on the dynamic recrystallization behavior of GCr15 steel. Mater. Sci. Eng. A 2009, 499, 177–181. [Google Scholar] [CrossRef]
- Lin, Y.C.; Liu, G. A new mathematical model for predicting flow stress of typical high-strength alloy steel at elevated high temperature. Comput. Mater. Sci. 2010, 48, 54–58. [Google Scholar] [CrossRef]
- Yin, F.; Hua, L.; Mao, H.; Han, X.; Qian, D.; Zhang, R. Microstructural modeling and simulation for GCr15 steel during elevated temperature deformation. Mater. Des. 2014, 55, 560–573. [Google Scholar] [CrossRef]
- Solhjoo, S. Determination of critical strain for initiation of dynamic recrystallization. Mater. Des. 2010, 31, 1360–1364. [Google Scholar] [CrossRef]
- Lin, Y.C.; Chen, M.-S.; Zhong, J. Constitutive modeling for elevated temperature flow behavior of 42CrMo steel. Comput. Mater. Sci. 2008, 42, 470–477. [Google Scholar] [CrossRef]
- Mandal, S.; Rakesh, V.; Sivaprasad, P.V.; Venugopal, S.; Kasiviswanathan, K.V. Constitutive equations to predict high temperature flow stress in a Ti-modified austenitic stainless steel. Mater. Sci. Eng. A 2009, 500, 114–121. [Google Scholar] [CrossRef]
- Senuma, T.; Yada, H.; Matsumura, Y.; Futamura, T. Structure of austenite of carbon steels in high speed hot working processes. Tetsu-to-Hagané 1984, 70, 2112–2219. [Google Scholar] [CrossRef]
- Anan, G.; Nakajima, S.; Miyahara, M.; Nanba, S.; Umemoto, M.; Hiramatsu, A.; Moriya, A.; Watanabe, T. A model for recovery and recrystallization of hot deformed austenite considering structural heterogeneity. ISIJ Int. 1992, 32, 261–266. [Google Scholar] [CrossRef]
- Nanba, S.; Kitamura, M.; Shimada, M.; Katsumata, M.; Inoue, T.; Imamura, H.; Maeda, Y.; Hattori, S. Prediction of microstructure the through-thickness during and after hot rolling. ISIJ Int. 1992, 32, 377–386. [Google Scholar] [CrossRef]
- Wang, F.; Lenard, J.G. The constitutive behaviour of a Nb-V HSLA steel in the temperature range of 900 to 975 °C. Steel Res. 1991, 62, 66–71. [Google Scholar] [CrossRef]
- Yang, Y.; Yan, Q.-Z.; Ge, C.-C. Hot deformation behavior of modified CNS-II F/M steel. J. Iron Steel Res. Int. 2012, 19, 60–65. [Google Scholar] [CrossRef]
- Cingara, A.; McQueen, H.J. New formula for calculating flow curves from high temperature constitutive data for 300 austenitic steels. J. Mater. Process. Technol. 1992, 36, 31–42. [Google Scholar] [CrossRef]
- McQueen, H.J.; Yue, S.; Ryan, N.D.; Fry, E. Hot working characteristics of steels in austenitic state. J. Mater. Process. Technol. 1995, 53, 293–310. [Google Scholar] [CrossRef]
- McQueen, H.J.; Ryan, N.D. Constitutive analysis in hot working. Mater. Sci. Eng. A 2002, 322, 43–63. [Google Scholar] [CrossRef]
- Evangelista, E.; Masini, M.; El Mehtedi, M.; Spigarelli, S. Hot working and multipass deformation of a 41Cr4 steel. J. Alloys Compd. 2004, 378, 151–154. [Google Scholar] [CrossRef]
- Sandström, R.; Lagneborg, R. A model for hot working occurring by recrystallization. Acta Metall. 1975, 23, 387–398. [Google Scholar] [CrossRef]
- Roberts, W.; Ahlblom, B. A nucleation criterion for dynamic recrystallization during hot working. Acta Metall. 1978, 26, 801–813. [Google Scholar] [CrossRef]
- Brechet, Y.; Estrin, Y.; Reusch, F. A dynamic recrystallisation criterion: DRX map. Scr. Mater. 1998, 39, 1191–1197. [Google Scholar] [CrossRef]
- Barnett, M.R.; Kelly, G.L.; Hodgson, P.D. Predicting the critical strain for dynamic recrystallization using the kinetics of static recrystallization. Scr. Mater. 2000, 43, 365–369. [Google Scholar] [CrossRef]
- Barnett, M.R.; Kelly, G.L.; Hodgson, P.D. Inferring dynamic recrystallization in ferrite using the kinetics of static recrystallization. Metall. Mater. Trans. A 2002, 33, 1893–1900. [Google Scholar] [CrossRef]
- Kolmogorov, A.N. On the statistical theory of metal crystallization. Izv. Akad. Nauk SSSR Ser. Mat. 1937, 3, 355–360. [Google Scholar]
- Johnson, W.A.; Mehl, R.F. Reaction kinetics in processes of nucleation and growth. Trans. AIME 1939, 135, 416–442. [Google Scholar]
- Avrami, M. Kinetics of phase change. I. General theory. J. Chem. Phys. 1939, 7, 1103–1112. [Google Scholar] [CrossRef]
- Avrami, M. Kinetics of phase change. II Transformation-time relations for random distribution of nuclei. J. Chem. Phys. 1940, 8, 212–224. [Google Scholar] [CrossRef]
- Cahn, J.W. The kinetics of grain boundary nucleated reactions. Acta Metall. 1956, 4, 449–459. [Google Scholar] [CrossRef]
- Bergström, Y. A dislocation model for the stress-strain behaviour of polycrystalline a-Fe with special emphasis on the variation of the densities of mobile and immobile dislocations. Mater. Sci. Eng. 1970, 5, 193–200. [Google Scholar] [CrossRef]
- Mecking, H.; Kocks, U.F. Kinetics of flow and strain-hardening. Acta Metall. 1981, 29, 1865–1875. [Google Scholar] [CrossRef]
- Kocks, U.F.; Mecking, H. Physics and phenomenology of strain hardening: The FCC case. Prog. Mater. Sci. 2003, 48, 171–273. [Google Scholar] [CrossRef]
- Estrin, Y.; Mecking, H. A unified phenomenological description of work hardening and creep based on one-parameter models. Acta Metall. 1984, 32, 57–70. [Google Scholar] [CrossRef]
- Sommitsch, C.; Mitter, W. On modelling of dynamic recrystallisation of fcc materials with low stacking fault energy. Acta Mater. 2006, 54, 357–375. [Google Scholar] [CrossRef]
- Srolovitz, D.J.; Grest, G.S.; Anderson, M.P. Computer simulation of recrystallization-I. Homogeneous nucleation and growth. Acta Metall. 1986, 34, 1833–1845. [Google Scholar] [CrossRef]
- Srolovitz, D.J.; Grest, G.S.; Anderson, M.P.; Rollett, A.D. Computer simulation of recrystallization-II. Heterogeneous nucleation and growth. Acta Metall. 1988, 36, 2115–2128. [Google Scholar] [CrossRef]
- Rollett, A.D.; Luton, M.J.; Srolovitz, D.J. Microstructural simulation of dynamic recrystallization. Acta Metall. Mater. 1992, 40, 43–55. [Google Scholar] [CrossRef]
- Peczak, P. A Monte Carlo study of influence of deformation temperature on dynamic recrystallization. Acta Metall. Mater. 1995, 43, 1279–1291. [Google Scholar] [CrossRef]
- Goetz, R.L.; Seetharaman, V. Modeling dynamic recrystallization using cellular automata. Scr. Mater. 1998, 38, 405–413. [Google Scholar] [CrossRef]
- Ding, R.; Guo, Z.X. Coupled quantitative simulation of microstructural evolution and plastic flow during dynamic recrystallization. Acta Mater. 2001, 49, 3163–3175. [Google Scholar] [CrossRef]
- Kugler, G.; Turk, R. Modeling the dynamic recrystallization under multi-stage hot deformation. Acta Mater. 2004, 52, 4659–4668. [Google Scholar] [CrossRef]
- Yazdipour, N.; Davies, C.H.J.; Hodgson, P.D. Microstructural modeling of dynamic recrystallization using irregular cellular automata. Comput. Mater. Sci. 2008, 44, 566–576. [Google Scholar] [CrossRef]
- Takaki, T.; Hisakuni, Y.; Hirouchi, T.; Yamanaka, A.; Tomita, Y. Multi-phase-field simulations for dynamic recrystallization. Comput. Mater. Sci. 2009, 45, 881–888. [Google Scholar] [CrossRef]
- Frost, H.J.; Thompson, C.V.; Howe, C.L.; Whang, J. A two-dimensional computer simulation of capillarity-driven grain growth: Preliminary results. Scr. Metall. 1988, 22, 65–70. [Google Scholar] [CrossRef]
- Weygand, D.; Bréchet, Y.; Lépinoux, J. A vertex dynamics simulation of grain growth in two dimensions. J. Philos. Mag. Part B 1998, 78, 329–352. [Google Scholar] [CrossRef]
- Logé, R.; Bernacki, M.; Resk, H.; Delannay, L.; Digonnet, H.; Chastel, Y.; Coupez, T. Linking plastic deformation to recrystallization in metals using digital microstructures. Philos. Mag. 2008, 88, 3691–3712. [Google Scholar] [CrossRef]
- Perdrix, C. Caractéristiques d’écoulement plastique du métal dans les conditions du T.A.B. à chaud. Comm. Des. Ommunautés Eur. IRSID Saint-Germain-Em-Laye Fr. 1987, EUR8697FR, 58–74. [Google Scholar]
- Kirihata, A.; Siciliano, F., Jr.; Maccagno, T.M.; Jonas, J.J. Mathematical modelling of mean flow stress during the hot strip rolling of multiply-alloyed medium carbon steels. ISIJ Int. 1998, 38, 187–195. [Google Scholar] [CrossRef][Green Version]
- Ryan, N.D.; McQueen, H.J. Dynamic softening mechanisms in 304 austenitic stainless steel. Can. Metall. Q. 1990, 29, 147–162. [Google Scholar] [CrossRef]
- Hart, E.W. A phenomenological theory for plastic deformation of polycrystalline metals. Acta Metall. 1970, 18, 599–610. [Google Scholar] [CrossRef]
- Poliak, E.I.; Jonas, J.J. Critical Strain for Dynamic Recrystallization in Variable Strain Rate Hot Deformation. ISIJ Int. 2003, 43, 692–700. [Google Scholar] [CrossRef]
- Kocks, U.F. Laws for work-hardening and low-temperature creep. J. Eng. Mater. Technol. Trans. ASME 1976, 98, 76–85. [Google Scholar] [CrossRef]
- Najafizadeh, A.; Jonas, J.J. Predicting the critical stress for initiation of dynamic recrystallization. ISIJ Int. 2006, 46, 1679–1684. [Google Scholar] [CrossRef]
- Gottstein, G.; Frommert, M.; Goerdeler, M.; Schäfer, N. Prediction of the critical conditions for dynamic recrystallization in the austenitic steel 800H. Mater. Sci. Eng. A 2004, 387–389, 604–608. [Google Scholar] [CrossRef]
- Estrin, Y.; Tóth, L.S.; Molinari, A.; Bréchet, Y. A dislocation-based model for all hardening stages in large strain deformation. Acta Mater. 1998, 46, 5509–5522. [Google Scholar] [CrossRef]
- Mughrabi, H. Dislocation wall and cell structures and long-range internal stresses in deformed metal crystals. Acta Metall. 1983, 31, 1367–1379. [Google Scholar] [CrossRef]
- Mughrabi, H. A two-parameter description of heterogeneous dislocation distributions in deformed metal crystals. Mater. Sci. Eng. 1987, 85, 15–31. [Google Scholar] [CrossRef]
- Müller, M.; Zehetbauer, M.; Borbély, A.; Ungár, T. Stage IV work hardening in cell forming materials, part I: Features of the dislocation structure determined by X-ray line broadening. Scr. Mater. 1996, 35, 1461–1466. [Google Scholar] [CrossRef]
- Bambach, M. Implications from the Poliak-Jonas criterion for the construction of flow stress models incorporating dynamic recrystallization. Acta Mater. 2013, 61, 6222–6233. [Google Scholar] [CrossRef]
- Ebrahimi, R.; Solhjoo, S. Characteristic points of stress-strain curve at high temperature. Int. J. ISSI 2007, 4, 24–27. [Google Scholar]
- Ebrahimi, R.; Zahiri, S.H.; Najafizadeh, A. Mathematical modelling of the stress-strain curves of Ti-IF steel at high temperature. J. Mater. Process. Technol. 2006, 171, 301–305. [Google Scholar] [CrossRef]
- Cingara, A.; McQueen, H.J. New method for determining sinh constitutive constants for high temperature deformation of 300 austenitic steels. J. Mater. Process. Technol. 1992, 36, 17–30. [Google Scholar] [CrossRef]
- Mirzadeh, H.; Najafizadeh, A. Prediction of the critical conditions for initiation of dynamic recrystallization. Mater. Des. 2010, 31, 1174–1179. [Google Scholar] [CrossRef]
- Solhjoo, S. Determination of flow stress and the critical strain for the onset of dynamic recrystallization using a hyperbolic tangent function. Mater. Des. 2014, 54, 390–393. [Google Scholar] [CrossRef]
- Chen, F.; Feng, G.; Cui, Z. Mathematical modeling of critical condition for dynamic recrystallization. Procedia Eng. 2014, 81, 486–491. [Google Scholar] [CrossRef][Green Version]
- Jonas, J.J.; Ghosh, C.; Quelennec, X.; Basabe, V.V. The critical strain for dynamic transformation in hot deformed austenite. ISIJ Int. 2013, 53, 145–151. [Google Scholar] [CrossRef]
- Quelennec, X.; Jonas, J.J. Simulation of austenite flow curves under industrial rolling conditions using a physical dynamic recrystallization model. ISIJ Int. 2012, 52, 1145–1152. [Google Scholar] [CrossRef]
- Lohmar, J.; Bambach, M. Influence of different interpolation techniques on the determination of the critical conditions for the onset of dynamic recrystallisation. Mater. Sci. Forum 2013, 762, 331–336. [Google Scholar] [CrossRef]
- Duchon, J. Interpolation des fonctions de deux variables suivant le principe de la flexion des plaques minces. RAIRO Anal. Numérique 1976, 10, 5–12. [Google Scholar] [CrossRef]
- Jonas, J.J.; Quelennec, X.; Jiang, L.; Martin, E. The Avrami kinetics of dynamic recrystallization. Acta Mater. 2009, 57, 2748–2756. [Google Scholar] [CrossRef]
- Bhadeshia, H.K.D.H.; Honeycombe, R. Steels: Microstructure and Properties, 3rd ed.; Butterworth-Heinemann: Oxford, UK, 2006. [Google Scholar]
- Kong, L.X.; Hodgson, P.D.; Collinson, D.C. Modelling the effect of carbon content on hot strength of steels using a modified artificial neural network. ISIJ Int. 1998, 38, 1121–1129. [Google Scholar] [CrossRef]
- Escobar, F.; Cabrera, J.M.; Prado, J.M. Effect of carbon content on plastic flow behaviour of plain carbon steels at elevated temperature. Mater. Sci. Technol. 2003, 19, 1137–1147. [Google Scholar] [CrossRef]
- Cabañas, N.; Akdut, N.; Penning, J.; De Cooman, B.C. High-temperature deformation properties of austenitic Fe-Mn alloys. Metall. Mater. Trans. A 2006, 37, 3305–3315. [Google Scholar] [CrossRef]
- Varela-Castro, G. Efecto de los Contenidos de C, Si y Mn en el Comportamiento a Fluencia en Caliente de Aceros de Construcción al Carbono. Aplicación a la Obtención de Grano Ultra-Fino en Productos Largos Laminados. Ph.D. Thesis, Universitat Politècnica de Catalunya, Barcelona, Spain, 2013. [Google Scholar]
- Cabrera, J.M.; Al Omar, A.; Jonas, J.J.; Prado, J.M. Modelling the flow behaviour of a medium carbon microalloyed steel under hot working conditions. Metall. Mater. Trans. A 1997, 28, 2233–2243. [Google Scholar] [CrossRef]
- Frost, H.J.; Ashby, M. Deformation-Mechanism Maps. The Plasticity and Creep of Metals and Ceramics, 1st ed.; Pergamon Press: Oxford, UK, 1982. [Google Scholar]
- Bakker, H.; Bonzel, H.P.; Bruff, C.M.; Dayananda, M.A.; Gust, W.; Horváth, J.; Kaur, I.; Kidson, G.V.; Le Claire, A.D.; Mehrer, H.; et al. Diffusion in Solid Metals and Alloys. In Landolt-Börnstein: Numerical Data and Functional Relationships in Science and Technology, 26, 1st ed.; Springer: Berlin, Germany, 1990. [Google Scholar]
- Siyasiya, C.W.; Stumpf, W.E. Constitutive constants for hot working of steels: The critical strain for dynamic recrystallisation in C-Mn steels. J. Mater. Eng. Perform. 2015, 24, 468–476. [Google Scholar] [CrossRef]
- Xu, Y.B.; Yu, Y.M.; Xiao, B.L.; Liu, Z.Y.; Wang, G.D. Modelling of microstructure evolution during hot rolling of a high-Nb HSLA steel. J. Mater. Sci. 2010, 45, 2580–2590. [Google Scholar] [CrossRef]
- le Bon, A.; Rofes-Vernis, J.; Rossard, C. Recrystallization and Precipitation during Hot Working of a Nb-Bearing HSLA Steel. Met. Sci. J. 1975, 9, 36–40. [Google Scholar] [CrossRef]
- Nazábal, J.L.; Urcola, J.J.; Fuentes, M. High-temperature deformation characteristics of free-machining steels. Met. Technol. 1982, 9, 323–326. [Google Scholar] [CrossRef]
- Senuma, T.; Takemoto, Y. Model for Predicting the Microstructural Evolution of Extralow Carbon Steels. ISIJ Int. 2008, 48, 1635–1639. [Google Scholar] [CrossRef][Green Version]
- Ruibal, E.; Urcola, J.J.; Fuentes, M. Transition from regular oscillations inflow stress to single peak during high-temperature torsional deformation of a low-alloy steel. Met. Technol. 1984, 11, 189–195. [Google Scholar] [CrossRef]
- Nazábal, J.L.; Urcola, J.J.; Fuentes, M. The transition from multiple- to single-peak recrystallization during the hot working of austenite. Mater. Sci. Eng. 1987, 86, 93–103. [Google Scholar] [CrossRef]
- Sellars, C.M. Modelling microstructural development during hot rolling. Mater. Sci. Technol. 1990, 6, 1072–1081. [Google Scholar] [CrossRef]
- Ryan, N.D.; McQueen, H.J. Comparison of dynamic softening in 301, 304, 316 and 317 stainless steels. High Temp. Technol. 1990, 8, 185–200. [Google Scholar] [CrossRef]
- Ryan, N.D.; McQueen, H.J. Work hardening, strength and ductility in the hot working of 304 austenitic stainless steel. High Temp. Technol. 1990, 8, 27–44. [Google Scholar] [CrossRef]
- Samuel, F.H.; Yue, S.; Jonas, J.J.; Barnes, K.R. Effect of dynamic recrystallization on microstructural evolution during strip rolling. ISIJ Int. 1990, 30, 216–225. [Google Scholar] [CrossRef]
- Barbosa, R.A.N.M.; Braga, H.C. Analysis of the occurrence of dynamic recrystallization in hot rolling by modeling of the stress-strain curve. ISIJ Int. 1992, 32, 257–259. [Google Scholar] [CrossRef][Green Version]
- Laasraoui, A.; Jonas, J.J. Prediction of temperature distribution, flow stress and microstructure during the multipass hot rolling of steel plate and strip. ISIJ Int. 1991, 31, 95–105. [Google Scholar] [CrossRef]
- Devadas, C.; Samarasekera, I.V.; Hawbolt, E.B. The thermal and metallurgical state of steel strip during hot rolling: Part I. Characterization of heat transfer. Metall. Trans. A 1991, 22, 307–319. [Google Scholar] [CrossRef]
- Samarasekera, I.V.; Hawbolt, E.B. Overview of modelling the microstructural state of steel strip during hot rolling. J. S. Afr. Inst. Min. Metall. 1995, 95, 157–165. [Google Scholar]
- Bowden, J.W.; Samuel, F.H.; Jonas, J.J. Effect of interpass time on austenite grain refinement by means of dynamic recrystallization of austenite. Metall. Trans. A 1991, 22, 2947–2957. [Google Scholar] [CrossRef]
- Anelli, E. Application of mathematical modelling to hot rolling and controlled cooling of wire rods and bars. ISIJ Int. 1992, 32, 440–449. [Google Scholar] [CrossRef]
- Pussegoda, L.N.; Hodgson, P.D.; Jonas, J.J. Design of dynamic recrystallisation controlled rolling schedules for seamless tube rolling. Mater. Sci. Technol. 1992, 8, 63–71. [Google Scholar] [CrossRef]
- Roucoules, C. Dynamic and Metadynamic Recrystallization in HSLA Steels. Ph.D. Thesis, McGill University, Montreal, QC, Canada, 1992. [Google Scholar]
- Xu, Y.; Gu, Q.; Wang, D.; Gu, J.; Qu, T. Dynamic mechanical behaviours of high Mo austenitic stainless stee during hot deformation. Acta Metall. Sin. (Engl. Lett. Ser. B) 1992, 5, 60–64. [Google Scholar]
- Medina, S.F.; Lopez, V. Static recrystallization in austenite and its influence on microstructural changes in C-Mn steel and vanaidum microalloyed steel at the hot strip mill. ISIJ Int. 1993, 33, 605–614. [Google Scholar] [CrossRef][Green Version]
- Xu, Y.; Hou, D.; Wang, D.; Xu, W.-P.; Huang, T. Advances in Hot Deformation Textures and Microstructures; Jonas, J.J., Bieler, T.R., Bowman, K.J., Eds.; Minerals, Metals & Materials Society: Warrendale, PA, USA, 1994; pp. 183–194. [Google Scholar]
- Elwazri, A.M. Processing and Properties of High Carbon Microallyed Steels. Ph.D. Thesis, McGill University, Montreal, QC, Canada, 2004. [Google Scholar]
- Roucoules, C.; Hodgson, P.D.; Yue, S.; Jonas, J.J. Softening and microstructural change following the dynamic recrystallization of austenite. Metall. Mater. Trans. A 1994, 25, 389–400. [Google Scholar] [CrossRef]
- Pandi, R.; Yue, S. Dynamic transformation of austenite to ferrite in low carbon steel. ISIJ Int. 1994, 34, 270–279. [Google Scholar] [CrossRef][Green Version]
- Karjalainen, L.P.; Maccagno, T.M.; Jonas, J.J. Softening and flow stress behaviour of Nb microalloyed steels during hot rolling simulation. ISIJ Int. 1995, 35, 1523–1531. [Google Scholar] [CrossRef]
- Glowacki, M.; Kuziak, R.; Malinowski, Z.; Pietrzyk, M. Modelling of heat transfer, plastic flow and microstructural evolution during shape rolling. J. Mater. Process. Technol. 1995, 53, 159–166. [Google Scholar] [CrossRef]
- Pietrzyk, M.; Kuziak, R. Application of the internal variable approach to the simulation of microstructural phenomena in hot forming of eutecloid steel. In Proceedings of the 4th European Conference on Advanced Materials and Processes EUROMAT95, Padova, Italy, 25–28 September 1995; pp. 239–244. [Google Scholar]
- Cabrera, J.M. Caracterización Mecánico-Metalúrgica de la Conformación en Caliente Del Acero Microaleado de Medio Carbono 38MnSiVS5. Ph.D. Thesis, Universitat Politècnica de Catalunya, Barcelona, Spain, 1995. [Google Scholar]
- Maccagno, T.M.; Jonas, J.J.; Hodgson, P.D. Spreadsheet modelling of grain size evolution during rod rolling. ISIJ Int. 1996, 36, 720–728. [Google Scholar] [CrossRef]
- Colás, R. A model for the hot deformation of low-carbon steel. J. Mater. Process. Technol. 1996, 62, 180–184. [Google Scholar] [CrossRef]
- Kuziak, R.; Glowacki, M.; Pietrzyk, M. Modelling of plastic flow, heat transfer and microstructural evolution during rolling of eutectoid steel rods. J. Mater. Process. Technol. 1996, 60, 589–596. [Google Scholar] [CrossRef]
- Wakita, J.-I.; Takahashi, M.; Haji, J.; Kawano, O.; Esaka, K. Prediction of structure change of austenite of low carbon steels. Tetsu-to-Hagané 1996, 82, 617–622. [Google Scholar] [CrossRef][Green Version]
- Cabrera, J.M.; Al Omar, A.; Prado, J.M. Simulación de la fluencia en caliente de un acero microaleado de medio carbono. (Parte III. Ecuaciones constitutivas). Rev. Met. 1997, 33, 215–228. [Google Scholar] [CrossRef]
- Kong, L.X.; Hodgson, P.D. The application of constitutive and artificial neural network models to predict the hot strength of steels. ISIJ Int. 1999, 39, 991–998. [Google Scholar] [CrossRef]
- Siciliano, F., Jr. Mathematical Modelling of the Hot Strip Rolling of Nb Microalloyed Steels. Ph.D. Thesis, McGill University, Montreal, QC, Canada, 1999. [Google Scholar]
- Pauskar, P.; Shivpuri, R. Microstructure and mechanics interaction in the modeling of hot rolling of rods. CIRP Ann. Manuf. Technol. 1999, 48, 191–194. [Google Scholar] [CrossRef]
- Jonas, J.J. The hot strip mill as an experimental tool. ISIJ Int. 2000, 40, 731–738. [Google Scholar] [CrossRef]
- Schindler, I.; Hadasik, E. A new model describing the hot stress–strain curves of HSLA steel at high deformation. J. Mater. Process. Technol. 2000, 106, 131–135. [Google Scholar] [CrossRef]
- Xu, Y.-R.; Chen, L.-S.; Wang, D.-Y.; Jin, L. High temperature softening behaviors and flow stress model for a high molybdenum austenitic stainless steel. J. Shanghai Univ. (Engl. Ed.) 2000, 4, 254–259. [Google Scholar] [CrossRef]
- Xu, Y.; Chen, L.; Wang, D.; Jin, L. Flow behavior and evolution of microstructure during hot deformation for a high Mo stainless steel. J. Mater. Sci. Technol. 2000, 16, 341–344. [Google Scholar]
- Kim, S.-I.; Ko, B.-C.; Lee, C.-M.; Hwang, S.-K.; Yoo, Y.-C. Evolution of dynamic recrystallisation in AISI 304 stainless steel. Mater. Sci. Technol. 2003, 19, 1648–1652. [Google Scholar] [CrossRef]
- Cho, S.-H.; Kang, K.-B.; Jonas, J.J. The dynamic, static and metadynamic recrystallization of a Nb-microalloyed steel. ISIJ Int. 2001, 41, 63–69. [Google Scholar] [CrossRef]
- Cho, S.-H.; Kang, K.-B.; Jonas, J.J. Mathematical modeling of the recrystallization kinetics of Nb microalloyed steels. ISIJ Int. 2001, 41, 766–773. [Google Scholar] [CrossRef][Green Version]
- Imbert, C.A.C.; McQueen, H.J. Peak strength, strain hardening and dynamic restoration of A2 and M2 tool steels in hot deformation. Mater. Sci. Eng. A 2001, 313, 88–103. [Google Scholar] [CrossRef]
- Cho, S.-H.; Kim, S.-I.; Yoo, Y.-C. The effects of deformation variables on hot workability of austenitic stainless steel. Met. Mater. Int. 1998, 4, 732–736. [Google Scholar] [CrossRef]
- Cho, S.-H.; Yoo, Y.-C. Hot rolling simulations of austenitic stainless steel. J. Mater. Sci. 2001, 36, 4267–4272. [Google Scholar] [CrossRef]
- Cho, S.-H.; Yoo, Y.-C. Metadynamic recrystallization of austenitic stainless steel. J. Mater. Sci. 2001, 36, 4279–4284. [Google Scholar] [CrossRef]
- Tafzi, K.; Cabrera, J.M.; Prado, J.M. La recristalización dinámica durante la deformación en caliente de un acero calidad ARMCO. Rev. Metal. 2001, 37, 184–189. [Google Scholar] [CrossRef]
- Cabrera, J.M.; Prado, J.M. Modelling and simulations in hot deformation of steels. Adv. Tech. Mat. Mat. Proc. J. ATM 2002, 4, 45–57. [Google Scholar]
- Cabrera, J.M.; Ponce, J.; Prado, J.M. Modeling thermomechanical processing of austenite. J. Mater. Process. Technol. 2003, 143–144, 403–409. [Google Scholar] [CrossRef]
- Cabrera, J.M.; Mejía, I.; Prado, J.M. Effect of rare-earth metals on the hot strength of HSLA steels. Z. Für Met. 2002, 93, 1132–1139. [Google Scholar] [CrossRef]
- Vilela, J.J.; Barbosa, R. Prediction of stress–strain curves of hot deformed austenite. ISIJ Int. 2002, 42, 319–321. [Google Scholar] [CrossRef]
- Serajzadeh, S.; Taheri, A.K. An investigation on the effect of carbon and silicon on flow behavior of steel. Mater. Des. 2002, 23, 271–276. [Google Scholar] [CrossRef]
- Serajzadeh, S.; Mirbagheri, H.; Karimi Taheri, A. Modelling the temperature distribution and microstructural changes during hot rod rolling of a low carbon steel. J. Mater. Process. Technol. 2002, 125, 89–96. [Google Scholar] [CrossRef]
- Serajzadeh, S.; Taheri, A.K. Prediction of flow stress at hot working condition. Mech. Res. Commun. 2003, 30, 87–93. [Google Scholar] [CrossRef]
- Serajzadeh, S. Development of constitutive equations for a high carbon steel using additivity rule. ISIJ Int. 2003, 43, 1050–1055. [Google Scholar] [CrossRef]
- Kim, S.-I.; Yoo, Y.-C. Prediction of dynamic recrystallisation behaviour of AISI type 4140 medium carbon steel. Mater. Sci. Technol. 2002, 18, 160–164. [Google Scholar] [CrossRef]
- Kim, S.-I.; Lee, Y.; Byon, S.M. Study on constitutive relation of AISI 4140 steel subject to large strain at elevated temperatures. J. Mater. Process. Technol. 2003, 140, 84–89. [Google Scholar] [CrossRef]
- Yoo, Y.-C.; Kim, S.-I.; Byon, S.-M.; Lee, Y. Prediction of flow stress and microstructural evolution during hot forging of three microalloyed medium carbon steels. Mater. Sci. Forum 2005, 475, 169–174. [Google Scholar] [CrossRef]
- Cho, S.-H.; Kang, K.-B.; Jonas, J.J. Effect of manganese on recrystallisation kinetics of niobium microalloyed steel. Mater. Sci. Technol. 2002, 18, 389–395. [Google Scholar] [CrossRef]
- Sun, W.; Lu, C.; Kiet Tieu, A.; Jiang, Z.; Liu, X.; Wang, G. Influence of Nb, V and Ti on peak strain of deformed austenite in Mo-based micro-alloyed steels. J. Mater. Process. Technol. 2002, 125, 72–76. [Google Scholar] [CrossRef]
- Jonas, J.J.; Poliak, E.I. The critical strain for dynamic recrystallization in rolling mills. Mater. Sci. Forum 2003, 426–432, 57–66. [Google Scholar] [CrossRef]
- Poliak, E.I.; Jonas, J.J. Prediction of interpass softening from the strain hardening rate prior to unloading. ISIJ Int. 2004, 44, 1874–1881. [Google Scholar] [CrossRef]
- Uranga, P.; Fernández, A.I.; López, B.; Rodriguez-Ibabe, J.M. Modeling of austenite grain size distribution in Nb microalloyed steels processed by thin slab casting and direct rolling (TSDR) route. ISIJ Int. 2004, 44, 1416–1425. [Google Scholar] [CrossRef]
- El Wahabi, M. Caracterización Termomecánica de Aceros Inoxidables Austeníticos AISI—304. Ph.D. Thesis, Universitat Politècnica de Catalunya, Barcelona, Spain, 2003. [Google Scholar]
- Yang, Z.; Wang, R. Formation of ultra-fine grain structure of plain low carbon steel through deformation induced ferrite transformation. ISIJ Int. 2003, 43, 761–766. [Google Scholar] [CrossRef]
- Kim, S.-I.; Lee, Y.; Lee, D.-L.; Yoo, Y.-C. Modeling of AGS and recrystallized fraction of microalloyed medium carbon steel during hot deformation. Mater. Sci. Eng. A 2003, 355, 384–393. [Google Scholar] [CrossRef]
- Manohar, P.A.; Lim, K.; Rollett, A.D.; Lee, Y. Computational exploration of microstructural evolution in a medium C-Mn steel and applications to rod mill. ISIJ Int. 2003, 43, 1421–1430. [Google Scholar] [CrossRef][Green Version]
- Jorge, A.M., Jr.; Regone, W.; Balancin, O. Effect of competing hardening and softening mechanisms on the flow stress curve modeling of ultra-low carbon steel at high temperatures. J. Mater. Process. Technol. 2003, 142, 415–421. [Google Scholar] [CrossRef]
- Kim, S.-I.; Lee, Y.; Jang, B.-L. Modeling of recrystallization and austenite grain size for AISI 316 stainless steel and its application to hot bar rolling. Mater. Sci. Eng. A 2003, 357, 235–239. [Google Scholar] [CrossRef]
- Bang, W.; Lee, C.S.; Chang, Y.W. Finite element analysis of hot forging with flow softening by dynamic recrystallization. J. Mater. Process. Technol. 2003, 134, 153–158. [Google Scholar] [CrossRef]
- Puchi-Cabrera, E.S. Simple constitutive relationship for C–Mn steels deformed at elevated temperatures. Mater. Sci. Technol. 2003, 19, 715–722. [Google Scholar] [CrossRef]
- Zhang, B.; Zhang, H.-B.; Ruan, X.-Y. Dynamic recrystallization behavior of 35CrMo structural steel. J. Cent. South Univ. Technol. 2003, 10, 13–19. [Google Scholar] [CrossRef]
- Stumpf, W. Grain size modelling of a low carbon strip steel during hot rolling in a Compact Strip Production (CSP) plant using the Hot Charge Route. J. S. Afr. Inst. Min. Metall. 2003, 103, 617–632. [Google Scholar]
- Stewart, G.R. Static and Dynamic Aging and Softening in 304 Stainless Steel. Ph.D. Thesis, McGill University, Montreal, QC, Canada, 2004. [Google Scholar]
- Zahiri, S.H.; Byon, S.M.; Kim, S.-I.; Lee, Y.; Hodgson, P.D. Static and metadynamic recrystallization of interstitial free steels during hot deformation. ISIJ Int. 2004, 44, 1918–1923. [Google Scholar] [CrossRef][Green Version]
- Zahiri, S.H.; Hodgson, P.D. The static, dynamic and metadynamic recrystallisation of a medium carbon steel. Mater. Sci. Technol. 2004, 20, 458–464. [Google Scholar] [CrossRef]
- Elwazri, A.M.; Wanjara, P.; Yue, S. Critical condition for dynamic recrystallisation of high carbon steels. Mater. Sci. Technol. 2004, 20, 1469–1473. [Google Scholar] [CrossRef]
- Stumpf, W. Hot work modelling of two equivalent low carbon strip steels produced, respectively, by the cold charge route and by the hot charge route. J. S. Afr. Inst. Min. Metall. 2004, 104, 643–652. [Google Scholar]
- Fernández Sánchez, V. Efecto del contenido de silicio en el comportamiento a fluencia de un acero al carbono. In Final Degree Project; Universitat Politècnica de Catalunya: Barcelona, Spain, 2004. [Google Scholar]
- Wang, B.X.; Liu, X.H.; Wang, G.D. Dynamic recrystallization behavior and microstructural evolution in a Mn–Cr gear steel. Mater. Sci. Eng. A 2005, 393, 102–108. [Google Scholar] [CrossRef]
- Wang, B.-X.; Xu, X.-D.; Liu, X.-H.; Wang, G.-D. Dynamic Recrystallization Behavior in Mn-Cr Gear Steel. J. Iron Steel Res. Int. 2006, 13, 49–53. [Google Scholar] [CrossRef]
- Kim, S.I.; Choi, S.H.; Lee, Y. Influence of phosphorous and boron on dynamic recrystallization and microstructures of hot-rolled interstitial free steel. Mater. Sci. Eng. A 2005, 406, 125–133. [Google Scholar] [CrossRef]
- Bianchi, J.H.; Karjalainen, L.P. Modelling of dynamic and metadynamic recrystallisation during bar rolling of a medium carbon spring steel. J. Mater. Process. Technol. 2005, 160, 267–277. [Google Scholar] [CrossRef]
- Glowacki, M. The mathematical modelling of thermo-mechanical processing of steel during multi-pass shape rolling. J. Mater. Process. Technol. 2005, 168, 336–343. [Google Scholar] [CrossRef]
- Jorge, A.M., Jr.; Balancin, O. Prediction of steel flow stresses under hot working conditions. Mater. Res. 2005, 8, 309–315. [Google Scholar] [CrossRef]
- Cartmill, M.R.; Barnett, M.R.; Zahiri, S.H.; Hodgson, P.D. An analysis of the transition between strain dependent and independent softening in austenite. ISIJ Int. 2005, 45, 1903–1908. [Google Scholar] [CrossRef][Green Version]
- Medina, S.F.; Vega, M.I.; Gómez, M.; Gómez, P.P. Influence of the size and volume fraction of TiN particles on hot strength and dynamic recrystallisation in structural steels. ISIJ Int. 2005, 45, 1307–1315. [Google Scholar] [CrossRef]
- Lino, R.E.; Barbosa, R. Modeling stress–strain curves of hot deformed Ti–Nb interstitial free austenite. ISIJ Int. 2005, 45, 1758–1760. [Google Scholar] [CrossRef][Green Version]
- Serajzadeh, S. Thermomechanical modelling of hot slab rolling. Mater. Sci. Technol. 2005, 21, 93–102. [Google Scholar] [CrossRef]
- Sans Gil, T. Efecto del boro en la deformación en caliente de un acero al carbono. In Final Degree Project; Universitat Politècnica de Catalunya: Barcelona, Spain, 2005. [Google Scholar]
- Shafiei, E.; Ebrahimi, R. A modified model to estimate single peak flow stress curves of Ti-IF steel. ISIJ Int. 2012, 52, 569–573. [Google Scholar] [CrossRef]
- Stumpf, W.; Banks, K. The hot working characteristics of a boron bearing and a conventional low carbon steel. Mater. Sci. Eng. A 2006, 418, 86–94. [Google Scholar] [CrossRef]
- Zaky, A.I. Determinations of the non-recrystallization temperature for X52 steel produced by compact slab process combined with direct hot rolling. J. Mater. Eng. Perform. 2006, 15, 651–655. [Google Scholar] [CrossRef]
- Abbasi, S.M.; Shokuhfar, A. Prediction of hot deformation behaviour of 10Cr–10Ni–5Mo–2Cu steel. Mater. Lett. 2007, 61, 2523–2526. [Google Scholar] [CrossRef]
- Momeni, A.; Shokuhfar, A.; Abbasi, S.M. Dynamic recrystallization of a Cr-Ni-Mo-Cu-Ti-V precipitation hardenable stainless steel. J. Mater. Sci. Technol. 2007, 23, 775–778. [Google Scholar]
- Momeni, A.; Abbasi, S.M.; Shokuhfar, A. Hot compression behavior of as-cast precipitation-hardening stainless steel. J. Iron Steel Res. Int. 2007, 14, 66–70. [Google Scholar] [CrossRef]
- Zhu, L.-J.; Wu, D.; Zhao, X.-M. Recrystallization Modelling of Hot Deformed Si-Mn TRIP Steel. J. Iron Steel Res. Int. 2007, 14, 61–65. [Google Scholar] [CrossRef]
- Ferreira, J.L.; De Melo, T.M.F.; De Bott, I.S.; Santos, D.B.; Rios, P.R. Influence of thermomechanical parameters on the competition between dynamic recrystallization and dynamic strain induced transformation in C–Mn and C–Mn–Nb steels deformed by hot torsion. ISIJ Int. 2007, 47, 1638–1646. [Google Scholar] [CrossRef][Green Version]
- Abbod, M.F.; Sellars, C.M.; Linkens, D.A.; Mahfouf, M.; Cizek, P. Modeling the flow behavior, recrystallization, and crystallographic texture in hot-deformed Fe-30 wt Pct Ni austenite. Metall. Mater. Trans. A 2007, 38, 2400–2409. [Google Scholar] [CrossRef]
- Tang, G.-B.; Liu, Z.-D.; Dong, H.; Gan, Y.; Kang, Y.-L.; Li, L.-J.; Mao, X.-P. Numerical simulation of austenite recrystallization in CSP hot rolled C-Mn steel strip. J. Iron Steel Res. Int. 2007, 14, 49–55. [Google Scholar] [CrossRef]
- Jafari, M.; Najafizadeh, A.; Rasti, J. Dynamic recrystallization by necklace mechanism durinh hot deformation of 316 stainless steel. Int. J. ISSI 2007, 4, 6–23. [Google Scholar]
- Jafari, M.; Najafizadeh, A. Correlation between Zener–Hollomon parameter and necklace DRX during hot deformation of 316 stainless steel. Mater. Sci. Eng. A 2009, 501, 16–25. [Google Scholar] [CrossRef]
- Koczurkiewicz, B. The model of prediction of the microstructure austenite C-Mn steel. Arch. Mater. Sci. Eng. 2007, 28, 421–424. [Google Scholar]
- Lin, Y.C.; Chen, M.-S.; Zhong, J. Prediction of 42CrMo steel flow stress at high temperature and strain rate. Mech. Res. Commun. 2008, 35, 142–150. [Google Scholar] [CrossRef]
- Lin, Y.C.; Chen, M.-S.; Zhong, J. Numerical simulation for stress/strain distribution and microstructural evolution in 42CrMo steel during hot upsetting process. Comput. Mater. Sci. 2008, 43, 1117–1122. [Google Scholar] [CrossRef]
- He, X.; Yu, Z.; Lai, X. A method to predict flow stress considering dynamic recrystallization during hot deformation. Comput. Mater. Sci. 2008, 44, 760–764. [Google Scholar] [CrossRef]
- Zhang, Z.-H.; Liu, Y.-N.; Liang, X.-K.; She, Y. The effect of Nb on recrystallization behavior of a Nb micro-alloyed steel. Mater. Sci. Eng. A 2008, 474, 254–260. [Google Scholar] [CrossRef]
- Wang, B.; Fu, W.; Lv, Z.; Jiang, P.; Zhang, W.; Tian, Y. Study on hot deformation behavior of 12%Cr ultra-super-critical rotor steel. Mater. Sci. Eng. A 2008, 487, 108–113. [Google Scholar] [CrossRef]
- Arribas, M.; López, B.; Rodriguez-Ibabe, J.M. Additional grain refinement in recrystallization controlled rolling of Ti-microalloyed steels processed by near-net-shape casting technology. Mater. Sci. Eng. A 2008, 485, 383–394. [Google Scholar] [CrossRef]
- Ma, L.-Q.; Liu, Z.-Y.; Jiao, S.-H.; Yuan, X.-Q.; Wu, D. Effect of niobium and titanium on dynamic recrystallization behavior of low carbon steels. J. Iron Steel Res. Int. 2008, 15, 31–36. [Google Scholar] [CrossRef]
- Abbod, M.F.; Sellars, C.M.; Tanaka, A.; Linkens, D.A.; Mahfouf, M. Effect of changing strain rate on flow stress during hot deformation of Type 316L stainless steel. Mater. Sci. Eng. A 2008, 491, 290–296. [Google Scholar] [CrossRef]
- Wang, J.; Chen, J.; Zhao, Z.; Ruan, X.-Y. Dynamic recrystallization behavior of microalloyed forged steel. J. Iron Steel Res. Int. 2008, 15, 78–81. [Google Scholar] [CrossRef]
- Kim, N.; Choi, H. The prediction of deformation behavior and interfacial friction under hot working conditions using inverse analysis. J. Mater. Process. Technol. 2008, 208, 211–221. [Google Scholar] [CrossRef]
- Mejía, I.; López-Chipres, E.; Maldonado, C.; Bedolla-Jacuinde, A.; Cabrera, J.M. Modeling of the hot deformation behavior of boron microalloyed steels under uniaxial hot-compression conditions. Int. J. Mater. Res. 2008, 99, 1336–1345. [Google Scholar] [CrossRef]
- Dong, L.; Zhong, Y.; Ma, Q.; Yuan, C.; Ma, L. Dynamic recrystallization and grain growth behavior of 20SiMn low carbon alloy steel. Tsinghua Sci. Technol. 2008, 13, 609–613. [Google Scholar] [CrossRef]
- Solhjoo, S. Analysis of flow stress up to the peak at hot deformation. Mater. Des. 2009, 30, 3036–3040. [Google Scholar] [CrossRef]
- Uranga, P.; Lopez, B.; Rodriguez-Ibabe, J.M. Microalloying and austenite evolution during hot working in near net shape processed steels. Mater. Sci. Technol. 2009, 25, 1147–1153. [Google Scholar] [CrossRef]
- Fabík, R.; Kubina, T.; Aksenov, S.; Drozd, K.; Schindler, I.; Kliber, J. Verification of new model for calculation of critical strain for the initialization of dynamic recrystallization using laboratory rolling. Metalurgija 2009, 48, 273–276. [Google Scholar]
- Zhang, Y.; Zhang, H.; Wang, G.; Hu, S. Application of mathematical model for microstructure and mechanical property of hot rolled wire rods. Appl. Math. Model. 2009, 33, 1259–1269. [Google Scholar] [CrossRef]
- Gao, H.; Xie, Z.; Yu, Y.; Fang, Y.; Wang, J.; Sun, B. Dynamic recrystallization behavior of twin roll cast low carbon steel strip. ISIJ Int. 2009, 49, 546–552. [Google Scholar] [CrossRef][Green Version]
- Zubialde, R.; Uranga, P.; López, B.; Rodriguez-Ibabe, J.M. Dynamic recrystallization of a Nb bearing Al-Si TRIP steel. In Proceedings of the Materials Science & Technology Conference and Exhibition 2009 MS&T’09, Pittsburg, PA, USA, 25–29 October 2009; pp. 1369–1380. [Google Scholar]
- González, S. Estudio del comportamiento a fluencia en caliente de un acero avanzado de alta resistencia de bajo contenido en carbono NiCrVCu microaleado con boro. In Final Degree Project; Universitat Politècnica de Catalunya: Barcelona, Spain, 2009. [Google Scholar]
- Momeni, A.; Dehghani, K. Characterization of hot deformation behavior of 410 martensitic stainless steel using constitutive equations and processing maps. Mater. Sci. Eng. A 2010, 527, 5467–5473. [Google Scholar] [CrossRef]
- Mirzadeh, H.; Najafizadeh, A. Extrapolation of flow curves at hot working conditions. Mater. Sci. Eng. A 2010, 527, 1856–1860. [Google Scholar] [CrossRef]
- Mirzadeh, H.; Najafizadeh, A.; Moazeny, M. Hot deformation behaviour of precipitation hardening stainless steel. Mater. Sci. Technol. 2010, 26, 501–504. [Google Scholar] [CrossRef]
- Mirzadeh, H.; Najafizadeh, A. Flow stress prediction at hot working conditions. Mater. Sci. Eng. A 2010, 527, 1160–1164. [Google Scholar] [CrossRef]
- Mirzadeh, H.; Najafizadeh, A. Hot deformation and dynamic recrystallization of 17-4 PH stainless steel. ISIJ Int. 2013, 53, 680–689. [Google Scholar] [CrossRef]
- Momeni, A.; Dehghani, K.; Ebrahimi, G.R.; Keshmiri, H. Modeling the flow curve characteristics of 410 martensitic stainless steel under hot working condition. Metall. Mater. Trans. A 2010, 41, 2898–2904. [Google Scholar] [CrossRef]
- Momeni, A.; Dehghani, K.; Ebrahimi, G.R. Modeling the initiation of dynamic recrystallization using a dynamic recovery model. J. Alloys Compd. 2011, 509, 9387–9393. [Google Scholar] [CrossRef]
- Momeni, A.; Dehghani, K.; Heidari, M.; Vaseghi, M. Modeling the flow curve of AISI 410 martensitic stainless steel. J. Mater. Eng. Perform. 2012, 21, 2238–2243. [Google Scholar] [CrossRef]
- Shaban, M.; Eghbali, B. Determination of critical conditions for dynamic recrystallization of a microalloyed steel. Mater. Sci. Eng. A 2010, 527, 4320–4325. [Google Scholar] [CrossRef]
- Shaban, M.; Eghbali, B.J. Characterization of austenite dynamic recrystallization under different Z parameters in a microalloyed steel. J. Mater. Sci. Technol. 2011, 27, 359–363. [Google Scholar] [CrossRef]
- Jin, Z.; Cui, Z. Investigation on strain dependence of dynamic recrystallization behavior using an inverse analysis method. Mater. Sci. Eng. A 2010, 527, 3111–3119. [Google Scholar] [CrossRef]
- Wu, L.-Z.; Li, X.-S.; Chen, J.; Zhang, H.-B.; Cui, Z.-S. Predicting critical conditions and stress-strain curves for dynamic recrystallization in SPHC steel. J. Iron Steel Res. Int. 2010, 17, 51–57. [Google Scholar] [CrossRef]
- Lang, Y.-P.; Zhou, Y.; Rong, F.; Chen, H.-T.; Weng, Y.-Q.; Su, J. Hot working of high nitrogen austenitic stainless steel. J. Iron Steel Res. Int. 2010, 17, 45–49. [Google Scholar] [CrossRef]
- Niu, T.; Kang, Y.-L.; Gu, H.-W.; Yin, Y.-Q.; Qiao, M.-L.; Jiang, J.-X. Effect of Nb on the dynamic recrystallization behavior of high-grade pipeline steels. Int. J. Miner. Metall. Mater. 2010, 17, 742–747. [Google Scholar] [CrossRef]
- Mirzadeh, H.; Cabrera, J.M.; Prado, J.M.; Najafizadeh, A. Hot deformation behavior of a medium carbon microalloyed steel. Mater. Sci. Eng. A 2011, 528, 3876–3882. [Google Scholar] [CrossRef]
- Ebrahimi, G.R.; Keshmiri, H.; Momeni, A.; Mazinani, M. Dynamic recrystallization behavior of a superaustenitic stainless steel containing 16%Cr and 25%Ni. Mater. Sci. Eng. A 2011, 528, 7488–7493. [Google Scholar] [CrossRef]
- Quan, G.-Z.; Li, G.-S.; Chen, T.; Wang, Y.-X.; Zhang, Y.-W.; Zhou, J. Dynamic recrystallization kinetics of 42CrMo steel during compression at different temperatures and strain rates. Mater. Sci. Eng. A 2011, 528, 4643–4651. [Google Scholar] [CrossRef]
- Momeni, A.; Arabi, H.; Rezaei, A.; Badri, H.; Abbasi, S.M. Hot deformation behavior of austenite in HSLA-100 microalloyed steel. Mater. Sci. Eng. A 2011, 528, 2158–2163. [Google Scholar] [CrossRef]
- Zeng, Z.; Chen, L.; Zhu, F.; Liu, X. Dynamic recrystallization behavior of a heat-resistant martensitic stainless steel 403Nb during hot deformation. J. Mater. Sci. Technol. 2011, 27, 913–919. [Google Scholar] [CrossRef]
- Li, D.; Feng, Y.; Yin, Z.; Shangguan, F.; Wang, K.; Liu, Q.; Hu, F. Prediction of hot deformation behaviour of Fe–25Mn–3Si–3Al TWIP steel. Mater. Sci. Eng. A 2011, 528, 8084–8089. [Google Scholar] [CrossRef]
- Bao, S.; Zhao, G.; Yu, C.; Chang, Q.; Ye, C.; Mao, X. Recrystallization behavior of a Nb-microalloyed steel during hot compression. Appl. Math. Model. 2011, 35, 3268–3275. [Google Scholar] [CrossRef]
- Xiong, W.; Wietbrock, B.; Saeed-Akbari, A.; Bambach, M.; Hirt, G. Modeling the flow behavior of a high-manganese steel Fe-Mn23-C0.6 in consideration of dynamic recrystallization. Steel Res. Int. 2011, 82, 127–136. [Google Scholar] [CrossRef]
- Mejía, I.; Bedolla-Jacuinde, A.; Maldonado, C.; Cabrera, J.M. Determination of the critical conditions for the initiation of dynamic recrystallization in boron microalloyed steels. Mater. Sci. Eng. A 2011, 528, 4133–4140. [Google Scholar] [CrossRef]
- Sajadifar, S.V.; Ketabchi, M.; Nourani, M. Modeling of mechanical characteristics in hot deformation of 4130 steel. Steel Res. Int. 2011, 82, 934–939. [Google Scholar] [CrossRef]
- Sun, M.; Hao, L.; Li, S.; Li, D.; Li, Y. Modeling flow stress constitutive behavior of SA508-3 steel for nuclear reactor pressure vessels. J. Nucl. Mater. 2011, 418, 269–280. [Google Scholar] [CrossRef]
- Wu, H.; Du, L.; Liu, X. Dynamic recrystallization and precipitation behavior of Mn-Cu-V weathering steel. J. Mater. Sci. Technol. 2011, 27, 1131–1138. [Google Scholar] [CrossRef]
- Shi, R.-X.; Liu, Z.-D. Hot deformation behavior of P92 steel used for ultra-super-critical power plants. J. Iron Steel Res. Int. 2011, 18, 53–58. [Google Scholar] [CrossRef]
- Jia, B.; Peng, Y. Constitutive relationships of Nb microalloyed steel during high temperature deformation. Acta Metall. Sin. 2011, 4, 507–512. [Google Scholar]
- Chen, M.-S.; Lin, Y.C.; Ma, X.-S. The kinetics of dynamic recrystallization of 42CrMo steel. Mater. Sci. Eng. A 2012, 556, 260–266. [Google Scholar] [CrossRef]
- Xu, Y.; Tang, D.; Song, Y.; Pan, X. Dynamic recrystallization kinetics model of X70 pipeline steel. Mater. Des. 2012, 39, 168–174. [Google Scholar] [CrossRef]
- Mirzaee, M.; Keshmiri, H.; Ebrahimi, G.R.; Momeni, A. Dynamic recrystallization and precipitation in low carbon low alloy steel 26NiCrMoV 14-5. Mater. Sci. Eng. A 2012, 551, 25–31. [Google Scholar] [CrossRef]
- Wang, J.; Xiao, H.; Xie, H.; Xu, X.; Gao, Y. Study on hot deformation behavior of carbon structural steel with flow stress. Mater. Sci. Eng. A 2012, 539, 294–300. [Google Scholar] [CrossRef]
- Ebrahimi, G.R.; Keshmiri, H.; Maldar, A.R.; Momeni, A. Dynamic recrystallization behavior of 13%Cr martensitic stainless steel under hot working condition. J. Mater. Sci. Technol. 2012, 28, 467–473. [Google Scholar] [CrossRef]
- Shafiei, E.; Ebrahimi, R. A new constitutive equation to predict single peak flow stress curves. J. Eng. Mater. Technol. Trans. ASME 2013, 135, 011006. [Google Scholar] [CrossRef]
- Liu, P.; Liu, R.; Wei, Y.; Yang, H.; Yong, Q.; Bao, Y. Austenite dynamic recrystallization of the microalloyed forging steels 38MnVS during forging process. Procedia Eng. 2012, 27, 63–71. [Google Scholar] [CrossRef][Green Version]
- Zhang, T.-B.; Shen, Y.; Liu, P.; Yong, Q.-L.; Bao, Y.-Z. New type austenite dynamic recrystallization of microalloyed forging steels 38MnVS during forging process. J. Iron Steel Res. Int. 2013, 20, 57–60. [Google Scholar] [CrossRef]
- Badjena, S.K.; Park, J.K. Effect of particles on the dynamic recrystallization behavior of Al–V–N micro-alloyed medium carbon steel. Mater. Sci. Eng. A 2012, 548, 126–133. [Google Scholar] [CrossRef]
- Liang, G.; Lin, C.; Fang, Y. Flow stress and critical dynamic recrystallization behavior of Cu–Fe16Mn0.6C high manganese TWIP steel. Steel Res. Int. 2012, 83, 328–333. [Google Scholar]
- Cao, J.-R.; Liu, Z.-D.; Cheng, S.-C.; Yang, G.; Xie, J.-X. Constitutive equation models of hot-compressed T122 heat resistant steel. J. Iron Steel Res. Int. 2012, 19, 53–58. [Google Scholar] [CrossRef]
- Han, Y.; Liu, G.; Zou, D.; Liu, R.; Qiao, G. Deformation behavior and microstructural evolution of as-cast 904L austenitic stainless steel during hot compression. Mater. Sci. Eng. A 2013, 565, 342–350. [Google Scholar] [CrossRef]
- Wei, H.-L.; Liu, G.-Q.; Zhao, H.-T.; Kang, R.-M. Hot deformation behavior of two C–Mn–Si based and C–Mn–Al based microalloyed high-strength steels: A comparative study. Mater. Des. 2013, 50, 484–490. [Google Scholar] [CrossRef]
- Wei, H.-L.; Liu, G.-Q.; Xiao, X.; Zhao, H.-T.; Ding, H.; Kang, R.-M. Characterization of hot deformation behavior of a new microalloyed C–Mn–Al high-strength steel. Mater. Sci. Eng. A 2013, 564, 140–146. [Google Scholar] [CrossRef]
- Liu, Y.G.; Li, M.Q.; Luo, J. The modelling of dynamic recrystallization in the isothermal compression of 300M steel. Mater. Sci. Eng. A 2013, 574, 1–8. [Google Scholar] [CrossRef]
- Mirzadeh, H.; Parsa, M.H.; Ohadi, D. Hot deformation behavior of austenitic stainless steel for a wide range of initial grain size. Mater. Sci. Eng. A 2013, 569, 54–60. [Google Scholar] [CrossRef]
- Yan, T.; Yu, E.; Zhao, Y. Constitutive modeling for flow stress of 55SiMnMo bainite steel at hot working conditions. Mater. Des. 2013, 50, 574–580. [Google Scholar] [CrossRef]
- Wei, H.-L.; Liu, G.-Q.; Xiao, X.; Zhang, M.-H. Dynamic recrystallization behavior of a medium carbon vanadium microalloyed steel. Mater. Sci. Eng. A 2013, 573, 215–221. [Google Scholar] [CrossRef]
- Momeni, A.; Dehghani, K.; Poletti, M.C. Law of mixture used to model the flow behavior of a duplex stainless steel at high temperatures. Mater. Chem. Phys. 2013, 139, 747–755. [Google Scholar] [CrossRef]
- Li, X.; Wu, X.-C.; Zhang, X.-X.; Li, M.-Y. Dynamic recrystallization of hot deformed 3Cr2NiMnMo steel: Modeling and numerical simulation. J. Iron Steel Res. Int. 2013, 20, 98–104. [Google Scholar] [CrossRef]
- Schambron, T.; Chen, L.; Gooch, T.; Dehghan-Manshadi, A.; Pereloma, E.V. Effect of Mo concentration on dynamic recrystallization behavior of low carbon microalloyed steels. Steel Res. Int. 2013, 84, 1191–1195. [Google Scholar] [CrossRef]
- Rakhshkhorshid, M.; Hashemi, S.H. Experimental study of hot deformation behavior in API X65 steel. Mater. Sci. Eng. A 2013, 573, 37–44. [Google Scholar] [CrossRef]
- Lei, X.-R.; Ding, Q.-F.; Chen, Y.-Y.; Rui, X.-L.; Li, S.-R.; Wang, Q.-F. Effect of niobium on dynamic recrystallization behavior of 5%Ni steel. J. Iron Steel Res. Int. 2013, 20, 38–44. [Google Scholar] [CrossRef]
- Yazdani, M.; Abbasi, S.M.; Taheri, A.K.; Momeni, A. Hot deformation behavior of Fe-29Ni-17Co alloy. Trans. Nonferrous Met. Soc. China 2013, 23, 3271–3279. [Google Scholar] [CrossRef]
- Yan, P.; Liu, Z.-D.; Liu, W.; Bao, H.-S.; Weng, Y.-Q. Hot deformation behavior of a new 9% Cr heat resistant steel G115. J. Iron Steel Res. Int. 2013, 20, 73–79. [Google Scholar] [CrossRef]
- Yan, T.; Yu, E.-L.; Zhao, Y.-Q. Modeling of hot deformation behavior of 55SiMnMo medium-carbon steel. J. Iron Steel Res. Int. 2013, 20, 125–130. [Google Scholar] [CrossRef]
- Uranga, P.; Gutiérrez, I.; López, B. Determination of recrystallization kinetics from plane strain compression tests. Mater. Sci. Eng. A 2013, 578, 174–180. [Google Scholar] [CrossRef]
- Al Shahrani, A.; Yazdipour, N.; Dehghan-Manshadi, A.; Gazder, A.A.; Cayron, C.; Pereloma, E.V. The effect of processing parameters on the dynamic recrystallisation behaviour of API-X70 pipeline steel. Mater. Sci. Eng. A 2013, 570, 70–81. [Google Scholar] [CrossRef]
- Gao, X.; Zhu, M.; Sun, C.; Fu, G. Dynamic recrystallization behavior and microstructure evolution of bridge weathering steel in austenite region. Steel Res. Int. 2013, 84, 377–386. [Google Scholar] [CrossRef]
- Peng, N.-Q.; Tang, G.-B.; Yao, J.; Liu, Z.-D. Hot deformation behavior of GCr15 steel. J. Iron Steel Res. Int. 2013, 20, 50–56. [Google Scholar] [CrossRef]
- Gu, S.-D.; Zhang, L.-W.; Ruan, J.-H.; Zhou, P.-Z.; Zhen, Y. Constitutive modeling of dynamic recrystallization behavior and processing map of 38MnVS6 non-quenched steel. J. Mater. Eng. Perform. 2013, 23, 1062–1068. [Google Scholar] [CrossRef]
- Zhang, W.-F.; Li, X.-L.; Sha, W.; Yan, W.; Wang, W.; Shan, Y.-Y.; Yang, K. Hot deformation characteristics of a nitride strengthened martensitic heat resistant steel. Mater. Sci. Eng. A 2014, 590, 199–208. [Google Scholar] [CrossRef][Green Version]
- Zhao, B.; Zhao, T.; Li, G.; Lu, Q. The kinetics of dynamic recrystallization of a low carbon vanadium-nitride microalloyed steel. Mater. Sci. Eng. A 2014, 604, 117–121. [Google Scholar] [CrossRef]
- Nkhoma, R.K.C.; Siyasiya, C.W.; Stumpf, W.E. Hot workability of AISI 321 and AISI 304 austenitic stainless steels. J. Alloys Compd. 2014, 595, 103–112. [Google Scholar] [CrossRef]
- Wei, H.-L.; Liu, G.-Q.; Zhao, H.-T.; Zhang, M.-H. Effect of carbon content on hot deformation behaviors of vanadium microalloyed steels. Mater. Sci. Eng. A 2014, 596, 112–120. [Google Scholar] [CrossRef]
- Wei, H.-L.; Liu, G.-Q. Effect of Nb and C on the hot flow behavior of Nb microalloyed steels. Mater. Des. 2014, 56, 437–444. [Google Scholar] [CrossRef]
- Samantaray, D.; Mandal, S.; Jayalakshmi, M.; Athreya, C.N.; Bhaduri, A.K.; Subramanya Sarma, V. New insights into the relationship between dynamic softening phenomena and efficiency of hot working domains of a nitrogen enhanced 316L(N) stainless steel. Mater. Sci. Eng. A 2014, 598, 368–375. [Google Scholar] [CrossRef]
- Naghdy, S.; Akbarzadeh, A. Characterization of dynamic recrystallization parameters for a low carbon resulfurized free-cutting steel. Mater. Des. 2014, 53, 910–914. [Google Scholar] [CrossRef]
- Sha, Q.-Y.; Li, D.-H.; Li, G.-Y. Dynamic and static recrystalization behaviour of coarse-grained austenite in a Nb-V-Ti microaloyed steel. J. Iron Steel Res. Int. 2014, 21, 233–239. [Google Scholar] [CrossRef]
- Timoshenkov, A.; Warczok, P.; Albu, M.; Klarner, J.; Kozeschnik, E.; Bureau, R.; Sommitsch, C. Modelling the dynamic recrystallization in C–Mn micro-alloyed steel during thermo-mechanical treatment using cellular automata. Comput. Mater. Sci. 2014, 94, 85–94. [Google Scholar] [CrossRef]
- Marandi, A.; Zarei-Hanzaki, R.; Zarei-Hanzaki, A.; Abedi, H.R. Dynamic recrystallization behavior of new transformation–twinning induced plasticity steel. Mater. Sci. Eng. A 2014, 607, 397–408. [Google Scholar] [CrossRef]
- Ferdowsi, M.R.G.; Nakhaie, D.; Benhangi, P.H.; Ebrahimi, G.R. Modeling the high temperature flow behavior and dynamic recrystallization kinetics of a medium carbon microalloyed steel. J. Mater. Eng. Perform. 2013, 23, 1077–1087. [Google Scholar] [CrossRef]
- Badjena, S.K. Dynamic recrystallization behavior of vanadium micro-alloyed forging medium carbon steel. ISIJ Int. 2014, 54, 650–656. [Google Scholar] [CrossRef]
- Fu, Y.; Yu, H. Application of mathematical modeling in two-stage rolling of hot rolled wire rods. J. Mater. Process. Technol. 2014, 214, 1962–1970. [Google Scholar] [CrossRef]
- Chen, F.; Ren, F.-C.; Cui, Z.-S.; Lai, X.-M. Constitutive modeling for elevated temperature flow behavior of 30Cr2Ni4MoV ultra-super-crical rotor steel. J. Iron Steel Res. Int. 2014, 21, 521–526. [Google Scholar] [CrossRef]
- Zou, D.N.; Liu, R.; Han, Y.; Zhang, W.; Wu, K.; Liu, X.H. On dynamic recrystallisation under hot working of superaustenitic stainless steel. Mater. Sci. Technol. 2014, 30, 411–417. [Google Scholar] [CrossRef]
- Mejía, I.; Altamirano, G.; Bedolla-Jacuinde, A.; Cabrera, J.M. Modeling of the hot flow behavior of advanced ultra-high strength steels (A-UHSS) microalloyed with boron. Mater. Sci. Eng. A 2014, 610, 116–125. [Google Scholar] [CrossRef]
- Dupin, E.; Yanagida, A.; Yanagimoto, J. Modeling static and dynamic kinetics of microstructure evolution in type 316 stainless steel. Steel Res. Int. 2014, 85, 1099–1108. [Google Scholar] [CrossRef]
- Zhao, X.; Zhang, J.; Lei, S.; Wang, Y. Dynamic recrystallization (DRX) analysis of heavy reduction process with extra-thickness slabs. Steel Res. Int. 2014, 85, 811–823. [Google Scholar] [CrossRef]
- Ma, L.-T.; Wang, L.-M.; Liu, Z.-D.; Yang, G.; Lu, L.; Peng, M.-D. Hot deformation behavior of F6NM stainless steel. J. Iron Steel Res. Int. 2014, 21, 1035–1041. [Google Scholar] [CrossRef]
- Zhang, D.; Liu, Y.-Z.; Zhou, L.-Y.; Han, Q.; Jiang, B.; Li, Z.-Z. Dynamic recrystallization behavior of GCr15SiMn bearing steel during hot deformation. J. Iron Steel Res. Int. 2014, 21, 1042–1048. [Google Scholar] [CrossRef]
- Sui, D.-S.; Chen, F.; Zhang, P.-P.; Cui, Z.-S. Numerical simulation of microstructure evolution for SA508-3 steel during inhomogeneous hot deformation process. J. Iron Steel Res. Int. 2014, 21, 1022–1029. [Google Scholar] [CrossRef]
- Wang, J.; Yang, H.T.; Wang, X.G.; Xiao, H. A new mathematical model for predicting flow stress up to the critical strain during hot deformation. Mater. Des. 2015, 65, 637–643. [Google Scholar] [CrossRef]
- Momeni, A.; Abbasi, S.M. On the opposition of dynamic recrystallization and solute dragging in steels. J. Alloys Compd. 2015, 622, 318–326. [Google Scholar] [CrossRef]
- Li, X.; Duan, L.; Li, J.; Wu, X. Experimental study and numerical simulation of dynamic recrystallization behavior of a micro-alloyed plastic mold steel. Mater. Des. 2015, 66, 309–320. [Google Scholar] [CrossRef]
- Han, Y.; Wu, H.; Zhang, W.; Zou, D.; Liu, G.; Qiao, G. Constitutive equation and dynamic recrystallization behavior of as-cast 254SMO super-austenitic stainless steel. Mater. Des. 2015, 69, 230–240. [Google Scholar] [CrossRef]
- Dong, D.; Chen, F.; Cui, Z. A physically-based constitutive model for SA508-III steel: Modeling and experimental verification. Mater. Sci. Eng. A 2015, 634, 103–115. [Google Scholar] [CrossRef]
- Zhu, S.-L.; Cao, H.-Z.; Ye, J.-S.; Hu, W.-H.; Zheng, G.-Q. Dynamic recrystallization behavior of medium carbon Cr-Ni-Mo-Nb steel during hot deformation. J. Iron Steel Res. Int. 2015, 22, 264–271. [Google Scholar] [CrossRef]
- Saadatkia, S.; Mirzadeh, H.; Cabrera, J.M. Hot deformation behavior, dynamic recrystallization, and physically-based constitutive modeling of plain carbon steels. Mater. Sci. Eng. A 2015, 636, 196–202. [Google Scholar] [CrossRef]
- Li, L.; Ye, B.; Liu, S.; Hu, S.; Li, B. Inverse analysis of the stress–strain curve to determine the materials models of work hardening and dynamic recovery. Mater. Sci. Eng. A 2015, 636, 243–248. [Google Scholar] [CrossRef]


| Parameter | |||
|---|---|---|---|
| Statistic Indicator | m | Qhw | Rε |
| Number of data | 318 | 303 | 216 |
| Mean | 0.152 | 347 | 0.71 |
| Standard deviation | 0.07 | 81.15 | 0.16 |
| Geometric mean | 0.136 | 338 | 0.69 |
| Mode | 0.150 | 270 | 0.80 |
| Median | 0.150 | 332 | 0.72 |
| Minimum | 0.008 | 129 | 0.12 |
| Maximum | 0.678 | 747 | 1.00 |
| Qhw: [kJ·mol−1] | |||
| Parameter | Numerical Constant | |||
|---|---|---|---|---|
| a | b | c | d | |
| K × 10−3 | 3.665 | 2.375 | −0.590 | 6.330 |
| m | −0.053 | −0.008 | 0.006 | 0.168 |
© 2020 by the authors. Licensee MDPI, Basel, Switzerland. This article is an open access article distributed under the terms and conditions of the Creative Commons Attribution (CC BY) license (http://creativecommons.org/licenses/by/4.0/).
Share and Cite
Varela-Castro, G.; Cabrera, J.-M.; Prado, J.-M. Critical Strain for Dynamic Recrystallisation. The Particular Case of Steels. Metals 2020, 10, 135. https://doi.org/10.3390/met10010135
Varela-Castro G, Cabrera J-M, Prado J-M. Critical Strain for Dynamic Recrystallisation. The Particular Case of Steels. Metals. 2020; 10(1):135. https://doi.org/10.3390/met10010135
Chicago/Turabian StyleVarela-Castro, Gonzalo, José-María Cabrera, and José-Manuel Prado. 2020. "Critical Strain for Dynamic Recrystallisation. The Particular Case of Steels" Metals 10, no. 1: 135. https://doi.org/10.3390/met10010135
APA StyleVarela-Castro, G., Cabrera, J.-M., & Prado, J.-M. (2020). Critical Strain for Dynamic Recrystallisation. The Particular Case of Steels. Metals, 10(1), 135. https://doi.org/10.3390/met10010135