Abstract
Rare earth-bearing gypsum tailings from the fertilizer industry are a potential source for an economically viable and sustainable production of rare earth elements. Large quantities are generated inter alia in Catalão, Brazil, as a by-product in a fertilizer production plant. Hitherto, the gypsum has been used as soil conditioner in agriculture or was dumped. The cooperative project, “Catalão Monazite: Economical exploitation of rare earth elements from monazite-bearing secondary raw materials,” intends to extract rare earth elements from these gypsum tailings. In this paper, a chemical process route to obtain a mixed rare earth carbonate from a monazite concentrate, was investigated. The results of the digestion, leaching, and precipitation experiments are presented and discussed herein. This includes reagent choice, process parameter optimization through experimental design, mineralogical characterization of the feed material and residues, purification of the leach solution, and precipitation of the rare earth as carbonates. The results showed that a rare earth extraction of about 90% without the mobilization of key impurities is possible during a sulfuric acid digestion with two heating stages and subsequent leaching with water. In the following purification step, the remaining impurities were precipitated with ammonium solution and the rare earth elements were successfully recovered as carbonates with a mixture of ammonium solution and ammonium bicarbonate.
1. Introduction
The rare earth elements (REEs) are a group of elements with similar properties. They include scandium (atomic number 21), yttrium (atomic number 39), and the lanthanides (atomic numbers 57–71) [1]. Due to their special physical and chemical properties, REEs have a wide application span. They are mostly used in metallurgical applications, as catalysts, in glass and ceramics, in permanent magnets, and in luminescent materials [2]. Currently, high growth rates are observed for the elements neodymium and dysprosium due to their application in neodymium-iron-boron-magnets, which are used inter alia in electromobility and wind turbines [3].
Despite their name, REEs are relatively abundant in the Earth’s crust, but economically minable concentrations are less common than for most other ores. Resources are primarily found in four geological environments: carbonatites, alkaline igneous systems, ion-adsorption clay deposits, and monazite-xenotime-bearing placer deposits. Carbonatites and placer deposits are the leading sources of production of light REEs, which are scandium and the elements from lanthanum (atomic number 57) to europium (atomic number 63). Ion-adsorption clays are the leading source of production of heavy REEs, which are yttrium and the elements from gadolinium (atomic number 64) to lutetium (atomic number 71) [2,4]. According to [2], there are more than one hundred million tons of rare earth oxide (REO) reserves. The reserves are comparatively evenly spread over the world. The biggest reserves are located in China, followed by Brazil and Vietnam. Nevertheless, it must be taken into consideration that most of the world’s supply currently originates from China. In 2018, approximately 70% of the world’s production was mined in China. In comparison, only 2% of the world’s mine production originated from Brazil [2]. Therefore, diversification of REE supply is of great interest. However, due to low prices in the last few years, most exploration projects, which were initiated during the last price peak around 2011, were suspended for economic reasons [5].
One of the few potentially competitive concepts under current market conditions is the exploitation of REE-containing phosphogypsum, a by-product of the fertilizer industry. In the phosphoric acid production, five tons of phosphogypsum per ton of phosphoric acid are generated. The annual production of phosphogypsum is variously estimated to be 100–280 Mt [6]. Depending on the type and source of the gypsum, the REO content ranges between 0.05 and 2 [7,8]. At present, the gypsum is often used as soil conditioner in agriculture, in the cement industry, or is dumped [9].
In the last few decades, significant effort has been directed towards the REE extraction from phosphogypsum, which has various advantages over traditional REE mining. The main advantage is the absence of costs for mining and its affiliated infrastructure. Exploration, mining, ore handling, and comminution make up a large portion of the costs of traditional mines. However, so far no production process has proven to be economically viable [10,11]. The main reason for this situation is the low REO content, leading to an inefficient chemical extraction when treating the phosphogypsum without pre-concentration of the REO content by physical means.
In contrast to previous approaches, a relatively new exploration project operated by Ceritech AG, located in Leipzig, Germany, follows the concept of pre-concentration of the REO by physical separation methods before chemical treatment. Ceritech AG evaluated several gypsum tailings around the world and currently focuses on the production of a mixed-REE carbonate from monazite-bearing phosphogypsum of the ultramafic alkaline-carbonatite complex Catalão/Goiás, Brazil. The mine and fertilizer production plant is currently operated by Copebrás Indústria Ltda, a subsidiary of CMOC International based in São Paulo, Brazil. Ceritech successfully developed a physical separation method to extract REE-bearing monazite from the phosphogypsum, which can be returned to the agricultural sector or tailings. The REO content of the concentrate (>30 wt%) is comparable to other operations in the REE industry [12].
For further development of the process, Ceritech AG successfully applied, together with the working group Petrology and Economic Geology at Martin-Luther-University Halle-Wittenberg and the Department of Mineral and Waste Processing at Clausthal University of Technology, for funding within the “CLIENT II—International Partnerships for Sustainable Innovations” call of the German Federal Ministry of Education and Research. The cooperative project is called, “Catalão Monazite: Economical exploitation of rare earth elements from monazite-bearing secondary raw materials.” Additionally, the project is supported by the Brazilian Modelling and Mineral Processing Research Laboratory at the Federal University of Goiás.
The contribution of the Department of Mineral and Waste Processing of Clausthal University of Technology to this project is the development of a hydrometallurgical process for the production of a mixed-REE carbonate from the monazite concentrate, under special consideration of a safe thorium handling. Although the processing of monazite concentrates has been industrial practice for decades, the processing of monazite concentrate from phosphogypsum has not been realized so far. Due to the unique chemical and mineralogical composition of these concentrates, adaptions to the known process routes are necessary.
2. Background
For a better understanding of this article, in this section, the production of phosphate fertilizer, important properties of monazite, and the production of REEs from monazite concentrates are briefly described.
2.1. Production of Phosphate Fertilizer
Generally, either igneous or sedimentary phosphate rock is used as raw material in fertilizer plants. The fertilizer plant in Catalão uses the less common apatite-containing igneous phosphate rock [9]. Phosphoric acid is produced by the reaction of phosphate rock with sulfuric acid. A precipitate of calcium sulfate, phosphogypsum, is formed as by-product according to Equation (1) [6].
Ca5F(PO4)3 + 5 H2SO4 + 10 H2O → 3 H3PO4 + 5 CaSO4 ∙ 2 H2O + HF.
The final chemical fertilizer product is formed by the reaction of phosphoric acid with ammonium solution. The amount of phosphogypsum produced in Brazil is about 4.5 × 10⁶ tons per year. Generally, about 38% is used as soil amendment, 16% in the cement industry, and the remaining is dumped [9]. Depending on the type and source of the gypsum, the REO content ranges between 0.05 and 2 wt%. The REEs are mainly present as monazite [7,8].
2.2. Monazite
Monazite is a phosphate mineral with the general formula (REE, Th)PO4, which mainly contains cerium, lanthanum, neodymium, and praseodymium. The total REO content ranges from 49.6 to 74.13 wt%, and the average value is 64.31 wt%. In most common varieties REEs are partly replaced by thorium. The thorium content is typically between 4 and 12 mol% ThO2, though thorium-free monazite is extant. Minor amounts of other REEs, uranium, aluminum, and ferric iron may also occur [13,14].
Monazite occurs as a rather rare accessory in granitic rocks and in syenitic and granitic pegmatites; a metasomatic origin in dolomitic marble is also known of. It is moderately resistant to weathering and is frequently concentrated as detrital mineral in stream and beach sands [13,15].
Besides bastnaesite Ce(CO3)F, xenotime YPO4, and REE-bearing ion-adsorption clays, monazite is one of the most common commercially exploited REE sources [12,16].
2.3. Processing of Monazite
After mining, the ores are processed to increase their REE content. Concentration involves, if necessary, comminution and separation of the monazite from gangue minerals and by-products by physical and physico-chemical processes, such as density, electrostatic, and magnetic separation methods, and flotation. Depending on the deposit type, the final concentrates contain up to 60 wt% REO [12].
There are two industrial routes for the further chemical treatment of monazite: sulfuric acid digestion and digestion with caustic soda [12].
In the sulfuric acid route, the monazite concentrate is mixed with concentrated sulfuric acid and is then digested in rotary kilns at 250–600 °C for 2–5 h to convert the REEs to water soluble sulfates according to Equation (2) [12,17]. Depending on the process parameters, thorium is also mobilized according to Equation (3) or converted to insoluble thorium pyrophosphates, which remain in the residue after leaching [17,18]. To complete the REE and thorium sulfate formations, 250 °C is sufficient. The formation of thorium pyrophosphates is favored by high temperatures but is accompanied by decreasing REE yields. Therefore, to maximize REE yield and thorium immobilization, [18] suggests to hold the temperature at 250 °C before increasing the temperature to 400–500 °C.
2 REEPO4 + 3 H2SO4 → REE2(SO4)3 + 2 H3PO4
Th3(PO4)4 + 6 H2SO4 → 3 Th(SO4)2 + 4 H3PO4.
In the subsequent leaching step, the sulfates are dissolved in water. The further treatment of the leach solution depends on the impurity profile and the desired REE product.
In most cases, magnesium oxide or ammonium solution is added to the solution to precipitate elements such as iron and aluminum as hydroxides. Afterwards, the REEs are precipitated as a group, e.g., by carbonate or oxalate precipitation. Today, ammonium carbonate/bicarbonate salts are preferred as precipitation agents. They simultaneously adjust the pH (≥8), while the aqueous carbonate/bicarbonate concentration is increased beyond saturation. The precipitation takes place at ambient conditions. Depending on the time of the reaction, either hydrated REE carbonates (Equation (4)) or REE hydroxycarbonates are formed [19,20].
2 REE3+ + 3 SO42− + 6 NH4− + 3 CO32− → REE2(CO3)3 + 6 NH4+ + 3 SO42−.
The mixed-REE carbonates are a marketable intermediate, which is further processed in purification and separation plants to produce individual REE products. Another possibility is the precipitation of REEs with oxalic acid. The oxalates have a good crystallinity and high purity. However, due to the high price of oxalic acid, the resulting organic wastewater pollution, and the necessary thermal decomposition of the oxalates to oxides before further separation, the oxalate route is of minor industrial importance [21].
In the alkaline treatment, the monazite concentrate is digested with concentrated caustic soda solution (50–70 wt%) at 140–170 °C for 2–3 h [12]. Alternatively, the use of fused caustic soda at 400 °C is possible. The decomposition of the phosphates from monazite with caustic soda can be summarized with the following Equations (5) and (6) [22,23]:
REEPO4 + 3 NaOH → REE(OH)3 + Na3PO4
Th3(PO4)4 + 12 NaOH → 3 Th(OH)4 + 4 Na3PO4.
The digestion product is firstly leached with water to remove trisodium phosphate. The trisodium phosphate can be crystallized and sold as a by-product. Afterwards, the remaining hydroxides are dissolved in hydrochloric acid. Depending on the pH, thorium is either dissolved with the REEs (pH < 4.1) or remains as hydroxide in the residue [12,24]. From the chloride solution, the REEs can be precipitated similar to the sulfate route or directly fed into a solvent extraction plant for further purification and separation [12].
3. Materials and Methods
3.1. Materials
3.1.1. Monazite Concentrate
For the investigations, a monazite concentrate provided by the project partner Ceritech AG was used. The monazite concentrate was produced from phosphogypsum provided by Copebrás Indústria Ltda. Due to the ongoing optimization and scale-up of the physical separation process, the current concentrate does not represent the final quality.
3.1.2. Chemicals
With exception of magnesium oxide (98–100%), ammonium bicarbonate (98–100%), and sodium hydroxide (98–100%), all chemicals used were of analytical quality.
3.2. Analytical Methods
3.2.1. Particle Size Distribution
The particle size distribution of the material was measured with laser diffraction in suspension using a Sympatec Helos/KR with a Quixel disperser (Sympatec GmbH, Clausthal-Zellerfeld, Germany).
3.2.2. Chemical Analysis
The chemical compositions of the concentrate and intermediates were analyzed with inductively coupled plasma optical emission spectroscopy (ICP-OES), type Agilent Technology 5100 (Agilent Technologies Inc., Santa Clara, CA, USA) (Al, Ba, Ca, Fe, K, Mg, Mn, P, Si, Sr, and Ti) and with inductively coupled plasma optical mass spectroscopy (ICP-MS), type Thermo Fischer Scientific iCAP Q (Thermo Fischer Scientific Inc., Waltham, MA, USA) (La, Ce, Pr, Nd, Sm, Gd, Y, Nb, Th, U, and Zr). The sample solutions of the concentrates and precipitates were prepared via fluxing digestion with lithium borate and subsequent leaching of the fused tablet with hydrochloric acid.
3.2.3. Phase Analysis
Polished thin sections were prepared from the starting material and the leaching residue for electron probe micro-analysis (EPMA). A Cameca SX5 field emission microprobe (Cameca SAS, Gennevilliers Cedex, France) was used to carry out semi-quantitative energy dispersive X-ray analysis (EDX) and for collecting backscattered electron images with Z-contrast (BSE(Z)).
3.3. Experimental Methods
3.3.1. Digestion
In digestion experiments, 10 g of monazite concentrate was added to a concentrated sulfuric acid or caustic soda solution (50 wt%) in a glassy carbon crucible, and briefly stirred. Afterwards, the mixture was baked in a preheated muffle furnace for a set time.
3.3.2. Leaching and Precipitation
All leaching and precipitation experiments were conducted in beakers on combined hot-plate magnetic-stirrer devices. The temperature was controlled using digital contact thermometers. The pH of the solution was measured using a standard glass electrode. Solid–liquid separation was performed using vacuum filtration. The residues were washed with deionized water and dried in a drying oven at 105 °C until the samples reached a constant weight.
3.3.3. Design of Experiment (DoE)
To optimize the sulfuric acid digestion, a statistical test plan was created using the State-Ease Design-Expert® software, version 10.0.8.
4. Results and Discussion
In the following section, the results of the experimental work are presented and discussed. The aim of the present research was to investigate the extraction and recovery of REEs from the monazite concentrate with a special focus on the save handling of thorium.
At first, the monazite concentrate was characterized physically, chemically, and mineralogically (Section 4.1). For the digestion and leaching experiments, preliminary tests were conducted to decide upon the preferred digestion process (Section 4.2.1). On this basis, design of experiment (DoE) was used to investigate the optimum conditions of digestion for a high REE extraction and immobilization of impurities in a single-stage (Section 4.2.2) and a two-stage approach (Section 4.2.3). In Section 4.2.4, the residue of the leaching was mineralogically analyzed. Finally, purification of the leachate (Section 4.3) and recovery of the dissolved REEs as carbonates were investigated (Section 4.4).
4.1. Characterization of Monazite Concentrate
4.1.1. Particle Size Distribution
The particle size distribution of the monazite concentrate is given in Figure 1. Due to the fine nature of the sample (x90 = 120.47 µm), it was decided to use the concentrate without further comminution.
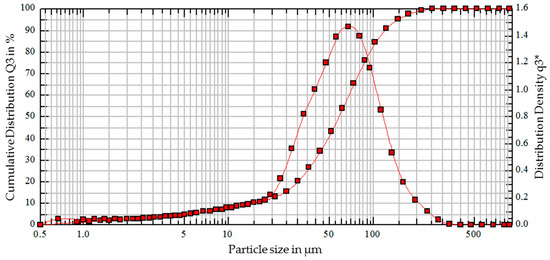
Figure 1.
Particle size distribution of the monazite concentrate used in the experiments (x10 = 14.80 µm, x50 = 57.55 µm, and x90 = 120.47 µm).
4.1.2. Chemical Analysis
Figure 2 gives an overview of the general chemical composition of the concentrate. A more detailed composition is provided in Table 1. With the exception of uranium, all elements with a weight percentage less than 0.1 wt% are not mentioned. The group “other elements” in Figure 2 is mainly represented by sulfur.
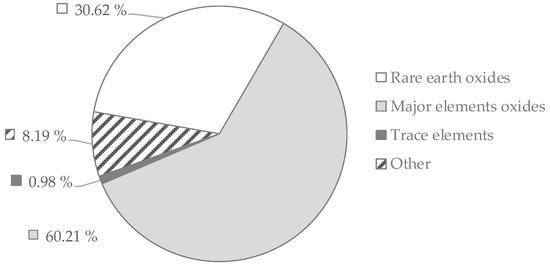
Figure 2.
Overview of the chemical composition of the monazite concentrate (MEO = oxides of major elements).

Table 1.
Chemical composition of the monazite concentrate. All elements with a weight percentage ≥0.1 wt%, and uranium, are given.
The REO content makes up about 30 wt% and shows a typical monazite composition rich in Ce, La, Nd, and Pr. Other REEs only occur in traces. The group of major elements is represented mainly by Ca, Fe, P, and Ti. These elements are the major impurities. Therefore, their behavior during digestion and leaching has a strong impact on the process economics. The content of the radioactive elements thorium and uranium is 0.23 wt%, which is very low in comparison to most monazite concentrates [4].
4.1.3. Phase Analysis
The EPMA showed that the concentrate contains a wide range of mineral inclusions. The most abundant phase is monazite as REE mineral. Figure 3 and Figure 4 show two grains that were detectable in back scattered electron (BSE) images. Figure 3 shows the typical needle shaped crystallites of monazite. Furthermore, in Figure 4, the monazite grains seem to be damaged by the sulfuric acid treatment during the phosphoric acid production (see Section 2.1).
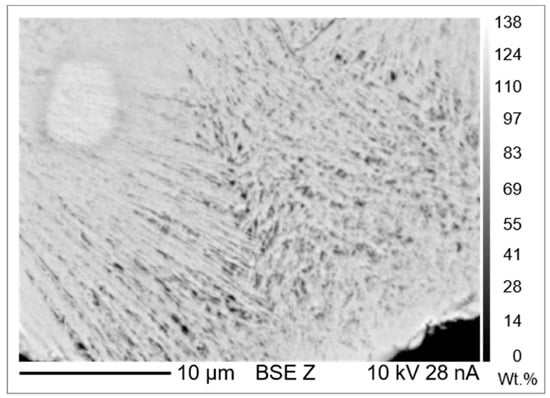
Figure 3.
Backscattered electron micrograph (BSE(Z)) image of a particle of the monazite concentrate showing the typical needle shaped crystallites of the monazite.
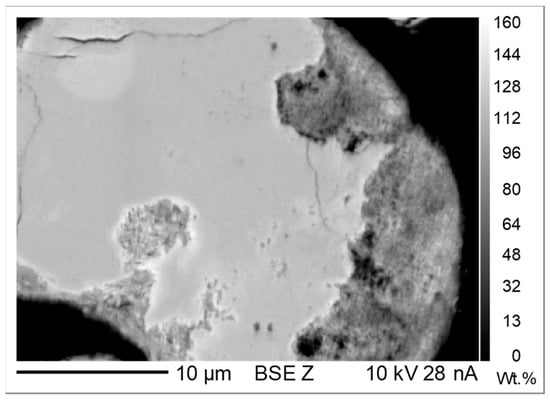
Figure 4.
Backscattered electron micrograph (BSE(Z)) of a monazite grain. The edges seem to be damaged by the sulfuric acid treatment.
Based on the measured monazite grains, it was possible to calculate the average composition. In Table 2, the measurements of the EPMA are compared to a monazite reference sample [25]. The monazite analyzed is dominated by cerium (20.87 wt%) and lanthanum (15.71 wt%). The neodymium content is comparatively low. In contrast to the reference, the measured monazite contains very low quantities of thorium, which is typical for monazite occurring in carbonatite type deposits [14].
Table 2.
Average composition of the monazite in the concentrate measured by electron microprobe analysis compared to the typical composition of a monazite standard reference [25].
Besides an abundance of monazite, a variety of other minerals—gypsum (CaSO4), apatite (Ca5(PO4)3F), ilmenite (Fe2+TiO3), titanite (CaTiSiO5), and other rarer mineral phases, such as calzirtite (CaZr3TiO9), zirkelite (Ca,Th,Ce)Zr(Ti,Nb)2O7, and baddeleyite (ZrO2)—were found in the sample. Thorium occurs mainly in a non-stoichiometric phosphorous compound, most probably a precipitate formed during processing of the apatite concentrate. A BSE(Z) micrograph of one grain of this compound is shown in Figure 5. The composition cannot be assigned to a specific mineral; it seems to be of anthropogenic origin. The following chemical formula is suggested: X3(PO4)2F. According to this analysis, the thorium seems to be associated with cerium, lanthanum, neodymium, fluoride, and phosphorus in this mineral compound.
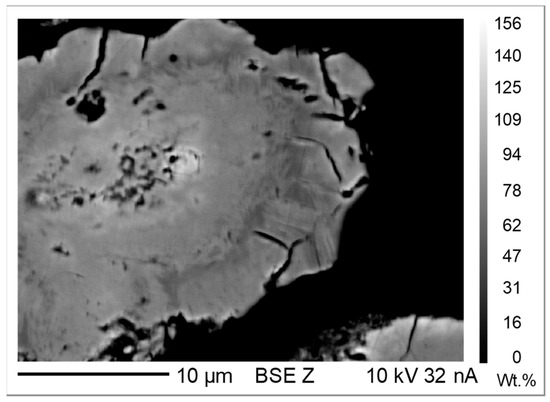
Figure 5.
Backscattered electron micrograph (BSE(Z)) of the mineral phase containing up to 10.4 wt% thorium.
4.2. Digestion and Leaching
4.2.1. Preliminary Tests
In preliminary tests, the sulfuric acid and the caustic soda digestion were compared to select a preferable method before optimizing the processing conditions.
According to literature, the baking temperature has a strong influence on the sulfuric acid digestion with regard to the REE yield and impurity control. Temperatures between 250 and 600 °C are described [12,18]. To study the effect of temperature, 250 °C and 600 °C were chosen for the preliminary tests. The temperature was held for 4 h. In a third experiment, the temperature was held at 250 °C for 2 h before increasing the temperature to 600 °C for another 2 h. The ratio of concentrated sulfuric acid to REO was 5 (g/g). After digestion, the cake was leached with water at a solid:liquid (S:L) ratio of 10 for 1 h at room temperature. The yield of each experiment is graphically shown in Figure 6.
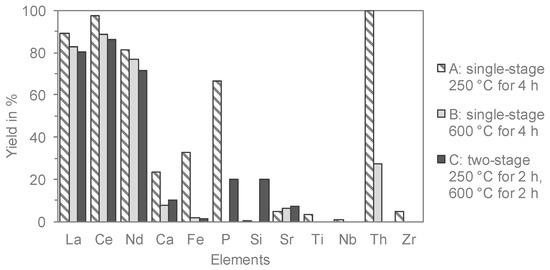
Figure 6.
Yields of elements after digestion with concentrated sulfuric acid at different temperatures and times. In all experiments, the ratio of concentrated sulfuric acid to rare earth oxide (REO) was 5. After digestion, the cake was leached with water at a solid:liquid (S:L) ratio of 10 for 1 h at room temperature.
In all experiments, a high extraction of REEs was achieved. As expected, a decrease was observed at 600 °C due to partial incorporation of the REEs into pyrophosphate residue (see Section 2.3). Depending on the conditions, phosphorus and thorium were either leached (250 °C) or mostly immobilized in the residue (600 °C). The mobilization of other impurities, especially calcium and iron, was also lower at higher baking temperatures. Heating the mixture in two temperature stages resulted in the lowest REE extraction, but nearly complete immobilization of phosphorus and thorium.
For the alkaline treatment, a relatively small temperature range is given in literature. For the preliminary test, a temperature of 150 °C and a baking time of 4 h were chosen according to [26]. The ratio of caustic soda to REO was 5 (g/g). After digestion, the residue was leached with deionized water to extract trisodium phosphate at a S:L ratio of 20 at 80 °C for 30 min. Then, the residue was leached in 6 M hydrochloric acid at a S:L ratio of 25 for 1 h at room temperature. The relatively high ratios were chosen to ensure complete reactions at all process stages.
Figure 7 shows the yield of the selected elements in the final leachate. Again, a high REE yield was achieved. However, in this case a much higher mobilization of impurities was observed, especially for calcium, iron, and strontium. This indicates that gypsum, ilmenite, and other calcium and strontium-containing minerals were strongly attacked by the caustic soda digestion in comparison to the sulfuric acid route.
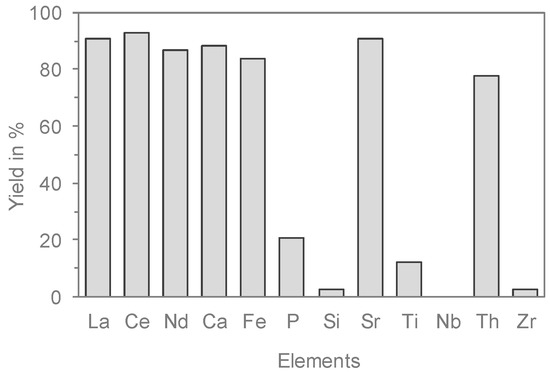
Figure 7.
Yields of elements after digestion with caustic soda. The concentrate was mixed with a ratio of caustic soda to REO of 5 and baked for 4 h at 150 °C. After baking, the residue was leached with deionized water at a S:L ratio of 20 for 30 min at 80 °C. Then, the residue was leached in 6 M hydrochloric acid at a S:L ratio of 25 for 1 h at room temperature.
Based on the results, the sulfuric acid digestion route was chosen for further optimization, due to the much lower impurity mobilization at comparable REE yields.
4.2.2. Optimization of Single-Stage Digestion and Leaching with Design of Experiment
The aim of the further investigation was to maximize the REE yield and to minimize the thorium extraction, as thorium immobilization in the form of pyrophosphates is the preferred method of thorium control in this project. Due to the expected complex interactions of the process parameters, DoE was employed. The State-Ease Design-Expert® software was used to build a response surface design based on statistical test planning. A customized response surface design was applied with the aim of optimizing the process parameters. The yields of the following elements were chosen as responses: La, Ce, Nd, Ca, Fe, P, Sr, Ti, Th, and Zr.
The main process factors, baking temperature, baking time, and ratio of concentrated sulfuric acid to REO, were studied. Table 3 shows the factors and chosen levels based on the results of the preliminary tests and literature review. At this point, only baking at a constant temperature was studied, as a second heating stage is difficult to integrate into the statistical plan and can lead to non-conclusive results.
Table 3.
Factors and chosen levels of the digestion for the design of experiment.
Design-Expert® provided a design layout with 20 runs, including five lack-of-fit points and five replicate points. The settings of the preliminary tests and their response data were also added to the design. Once all response data were entered, sequential F-test, lack-of-fit-tests, and other adequacy measures were used to choose a suitable model. Analysis of variance (ANOVA) and other statistical tests were used to test the model and individual terms in the model with the aim to verify that the correct model was chosen. Thereafter, model graphs were generated to interpret the results. In the following, the results for selected elements are presented and discussed.
Behavior of Cerium
Due to their similar chemical behavior, the REE responses showed comparable results. In the following, only the analysis of the response “Yield Ce (%)” is shown as an example.
A modified quadratic model was chosen for the data. The following Equation (7) represents the coded model.
Yield Ce = 82.53 + 19.23A − 19.19B + 2.82C − 17.92A2 − 13.87B2 − 5.55C2.
For the response “Yield Ce”, A, B, A², and B² are significant model terms. The normal plot of residuals, Figure 8, indicates that the residuals follow a normal distribution. Some moderate scatter can be expected with any data.
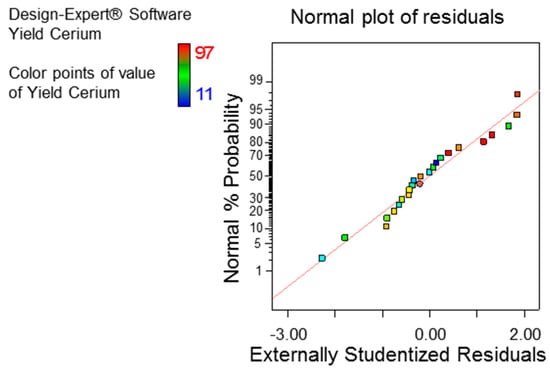
Figure 8.
Normal plot of residuals for the response “Yield Ce.”
Furthermore, the model was used to provide various graphical diagrams for the analysis and interpretation of the data. The perturbation plot, shown in Figure 9, helps to compare the effects of all the factors at a particular point in the design space. The response was plotted by changing only one factor over its range, while all other factors were held constant. The steep curvatures of Factors A and B shows that the responses are sensitive to that factor. The relatively flat line of Factor C shows that the response is comparatively insensitive to change.
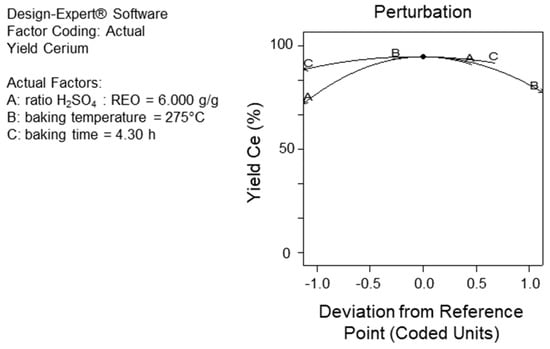
Figure 9.
Perturbation plot for the response “Yield Ce.”
The contour diagram is a two-dimensional representation of the response plotted against two combinations of the three factors and shows the relationship between the responses and factors. The diagram can be used to determine optimal process settings graphically. In case of cerium, the aim is to achieve a high yield. As an example, in Figure 10, Factor A was plotted against factor B in the contour diagram of the response “Yield Ce.” The third factor, Factor C, was set to 4.3 h. The model is able to predict the response level for any chosen combination. The predicted levels are color coded, and additionally, outlined by a contour.
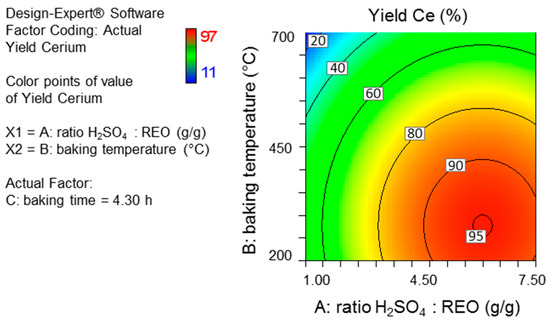
Figure 10.
Contour diagram for the response “Yield Ce” for the combined effects ratio of H2SO4 to REO and baking temperature. The baking time was set to 4.3 h.
From the plot, the maximum cerium yield can be observed within the chosen experimental limits. Both Factors A and B are very sensitive factors. Therefore, small changes affect the response level significantly. The model predicts the highest cerium yield (≥95%) at around 6.0 g/g and 275 °C. Factor C is less sensitive to change. However, an increase in time results in a slightly higher yield. The optimum is at around 4.3 h, as Figure 11 shows.
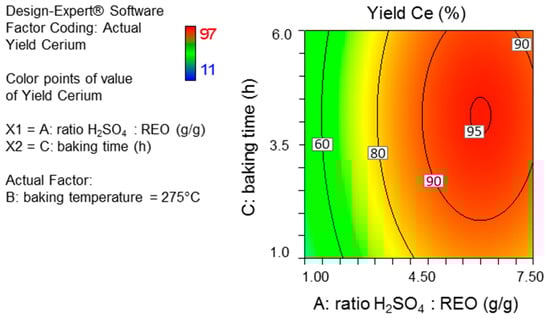
Figure 11.
Contour diagram for the response “Yield Ce” for the combined effects of ratio of H2SO4 to REO and baking time. The baking temperature is set to 275 °C.
Behavior of Phosphorus and Thorium
Besides the optimization of the REE extraction, the immobilization of thorium as pyrophosphates is a major goal of the process development. Therefore, the results for phosphorus and thorium are presented and discussed in the following. Equations (8) and (9) represent the coded models for the responses “Yield P” and “Yield Th.”
Yield P = 2.21 + 6.87A − 20.45B − 4.49C − 13.79AB + 4.80AC − 10.21A2 + 25.27B2 + 3.90C2
Yield Th = 7.18 + 7.5A − 20.88B − 5.47C − 12.86AB − 9.93A² + 24.18B².
The perturbation plots for phosphorus and thorium show very similar results; see Figure 12 and Figure 13. Again, the yield is highly dependent on Factors A and B, and the sensitivity of factor C is low.
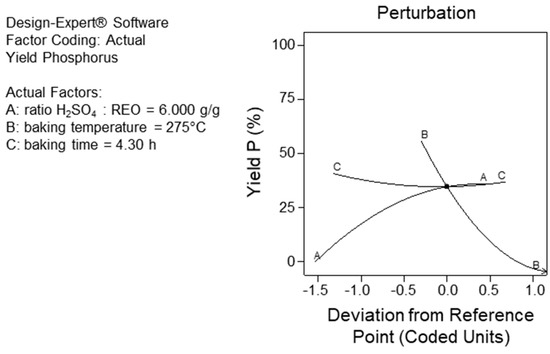
Figure 12.
Perturbation plot for the response “Yield P.”
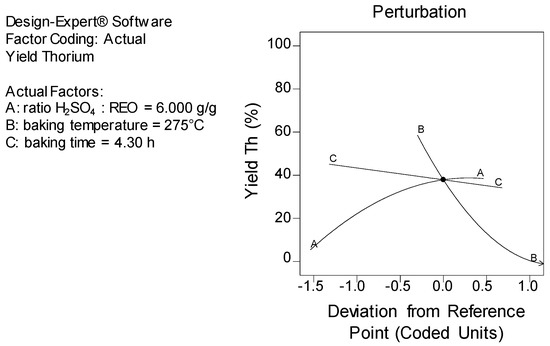
Figure 13.
Perturbation plot for the response “Yield Th.”
Figure 14 and Figure 15 show the contour diagrams for both responses. They follow similar regularities to the response “Yield Ce.” The highest yield can be observed at high ratios, low temperatures, and low baking times. For thorium and phosphorus, very low yields were expected above 300–400 °C, depending on the ratio of sulfuric acid to REO.
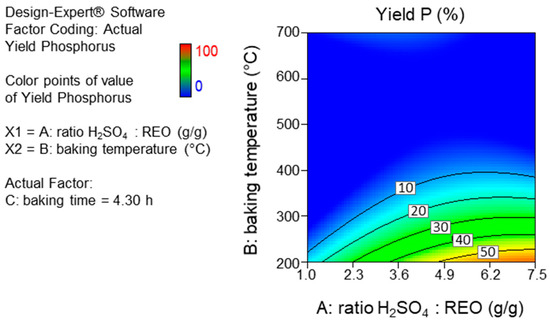
Figure 14.
Contour diagram for the response “Yield P” for the combined effects of ratio of H2SO4 to REO and baking temperature. The baking time was set to 4.3 h.
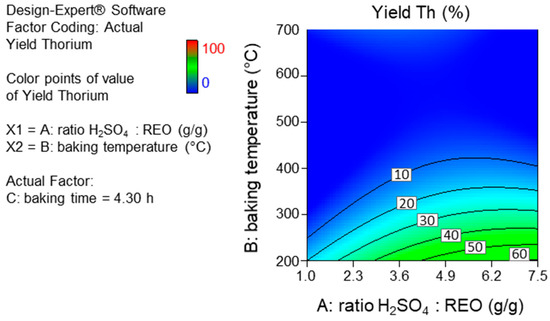
Figure 15.
Contour diagram for the response “Yield Th” for the combined effects of ratio of H2SO4 to REO and baking temperature. The baking time was set to 4.3 h.
In comparison to phosphorus and thorium, other impurities showed a lower variance in the preliminary test (see Figure 6). This was confirmed by the results. Generally, the mobilization decreases with increasing temperature. Selected results are presented later in Figure 16.
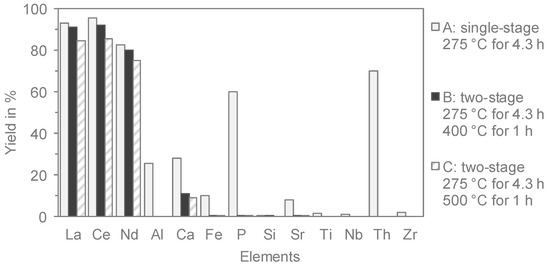
Figure 16.
Yield of elements after digestion with concentrated sulfuric acid. In all experiments, the concentrated ratio of sulfuric acid to REO was 6. In Experiment A, a single-stage digestion was executed. In Experiments B and C, a second temperature stage was added. After digestion, the cake was leached with water at a S:L ratio of 10 for 1 h at room temperature.
Statistical Post Analysis
Finally, to verify the accuracy of the data predicted by the model, a post analysis was executed. A confirmation experiment was performed and compared to the prediction interval (PI); see Table 4. The experimental settings for a maximum REE yield were used.
Table 4.
Confirmation report for confirmation experiment with the following settings: 6.0 g/g ratio of H2SO4 to REO, 275 °C baking temperature, and 4.3 h baking time.
The results of the REEs lay within the prediction interval, close to the predicted mean. Responses of the impurities seem to be much more sensitive. Even though the results lay within the prediction interval, the actual responses were partly lower or higher than predicted. This is not necessarily an indication of an ill-fitting model. Points at the minimum or maximum of a numerical model usually rest on less statistical data. Furthermore, the small sample size of 10 g of concentrate per experiment and minor inhomogeneities in the material contribute to fluctuating results. To achieve a more robust model, more experimental data and a re-evaluation of the models are required.
Conclusions
The results of this section showed that a high REE yield up to 95% could be achieved at low temperatures. This is always accompanied by significant impurity mobilization. The immobilization of thorium is possible at higher temperatures but leads to REE losses of around 10%. Therefore, whether a two-stage digestion could lead to a better compromise between REE extraction and impurity control was investigated.
4.2.3. Optimization of Two-Stage Digestion and Leaching
The results in the section above showed the highest REE extraction when baking at 275 °C for 4.3 h at a ratio of concentrated sulfuric acid to REO of 6.0. Therefore, these parameters were chosen for the first baking stage. According to the statistical model, phosphorus and thorium are immobilized in the residue at temperatures above 400 °C, which is in line with other investigations [18]. Therefore, a series of tests was conducted to test different settings for the second baking stage. The temperature (400–600 °C) and the baking time (1–2 h) were individually varied. The results proved that phosphorus and thorium were immobilized at temperatures above 400 °C. However, with rising temperature, the yield of REEs decreased steadily. At 400 °C, the loss of REE content was the lowest. The effect of baking time was again low and led to very similar results. Without further experiments, it was not possible to detect a trend within the parameter baking time due to random scatter. Therefore, the following preliminary optimum, shown in Table 5, for a selective extraction of REEs from the monazite concentrate, was chosen.
Table 5.
Optimum process parameters for a selective extraction elements from the monazite concentrate based on DoE and additional experiments.
Figure 16 shows the yield of the elements with and without a second heating stage. In Experiments B and C, the temperature of the second heating stage was varied. The yields of the REEs deteriorated around 5–10% compared to the single-stage process. However, at this point the positive effects of the immobilization of phosphorus and thorium on the subsequent processing steps outweighed the losses.
4.2.4. Phase Analysis of the Leaching Residues
The EPMA of the leaching residues provides further information on the chemical changes of the material caused by the sulfuric acid digestion. Two samples were prepared to compare the differences between single and two-stage heating during digestion.
The first sample was prepared from a single-stage digestion experiment at optimized process parameters for high REE yield. As seen in Figure 16, main elements like the REEs, phosphorus, and thorium formed soluble sulfates and were leached. The EPMA had to be carried out carefully, as the flakes and crystals seemed to be very damaged and fragile. The analysis showed that mostly insoluble sulfates, such as calcium, barium, and strontium ones, remained in the residue as insoluble reaction products, which probably recrystallized during digestion and leaching. The residue also contained flakes of ilmenite, titanite, and zirconolite, explaining the low yield of the contained elements. In Figure 17, a BSE image of a recrystallized (Sr,Ba,Ca)SO4 is shown together with the corresponding spectrum, pictured in Figure 18.
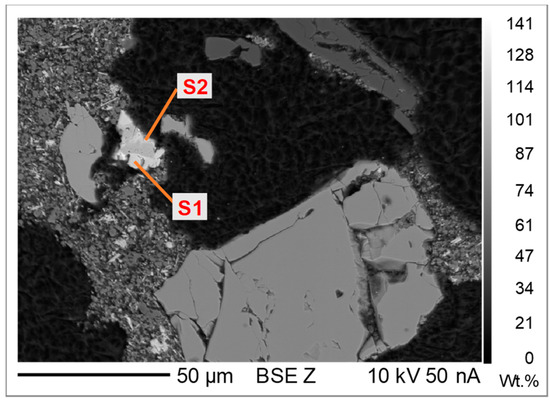
Figure 17.
Backscattered electrons image of insoluble (Sr,Ba,Ca)SO4 crystals marked with S1 and S2.
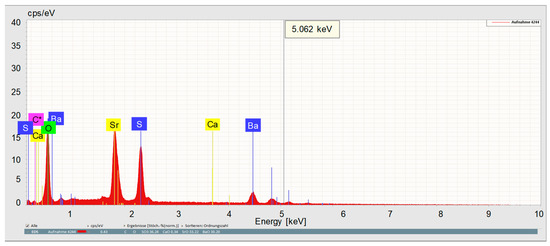
Figure 18.
Spectrum of the sulfate crystal S1 shown in Figure 17.
The second sample was prepared from a two-stage heating experiment, as shown in Figure 16 with Experiment B and C. Compared to the previous sample, the EPMA mainly showed fine flakes containing sulfur and phosphorus compounds. It seems that sulfur and phosphorus recrystallized at these higher temperatures, forming an insoluble matrix with the thorium. Figure 19 and Figure 20 show a BSE(Z) image of the flakes and the corresponding spectrum, clearly picturing phosphorus and sulfur peaks. Additionally, the iron and titanium oxide grains seemed to be more severely attacked by the chemical reaction. However, this did not lead to an increased mobilization of the contained elements; see Figure 16.
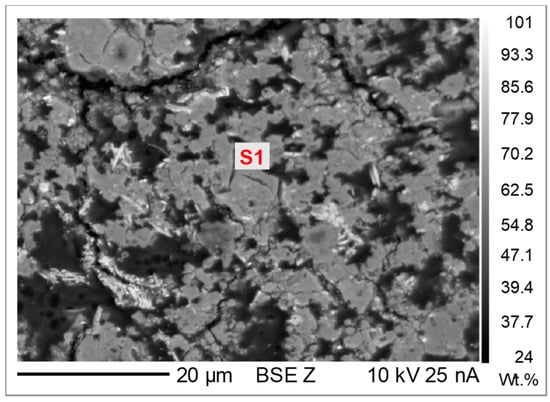
Figure 19.
Backscattered electron image of the delicate flakes found in the residue.
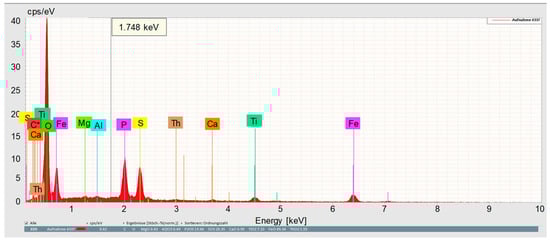
Figure 20.
Spectrum of the flake shown in Figure 19, showing phosphorus and sulfur peaks.
4.3. Purification of the Leach Solution
After digestion and leaching of the monazite, the sulfate solution needs to be purified before the REE carbonate precipitation. This can be accomplished by adjusting the pH of the solution to a desired value that is suitable for impurity precipitation with minimum co-precipitation of REEs. After removing the impurities as metal hydroxide precipitates, the REE carbonate precipitation can be realized. Typically, ammonium solution or magnesium oxide is used to increase the pH. The use of sodium hydroxide is not possible due to the formation of insoluble sodium REE double sulfates. To define the precipitation conditions, different experiments were carried out, as described below.
The main impurities in the leachate of a single-stage digestion (see Experiment A in Figure 16) are aluminum, calcium, iron, phosphorus, and thorium. The ion concentration of a typical leach solution is shown in Table 6.
Table 6.
Metal ion concentration of a typical leach solution with high impurity content.
Aluminum, ferric iron, and thorium can be precipitated by adjusting the pH. The pH is increased steadily to determine a suitable pH range to precipitate the impurities selectively, while keeping the REEs in solution.
For Figure 21, ammonium solution (10 wt%) was used as precipitation agent, and in Figure 22, a magnesium oxide suspension (100 g/L) was used. It can be seen that in both diagrams the impurities were co-precipitated with the REEs. It appears that the undesired precipitation is linked to the phosphorus precipitation. It is clear that due to the high impurity content, no selective precipitation of impurities from the leachate was achievable. This supported the above-mentioned decision to introduce a second heating stage to the digestion process.
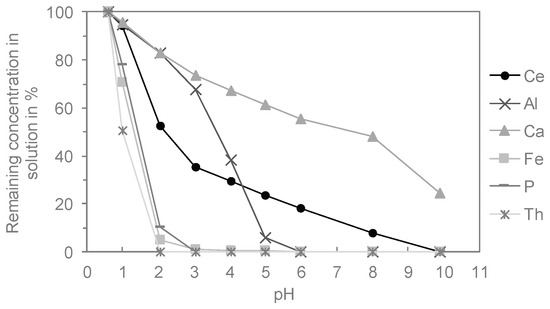
Figure 21.
Purification of the leachate solution with high impurity content. Ammonium solution (10 wt%) was used as precipitation agent.
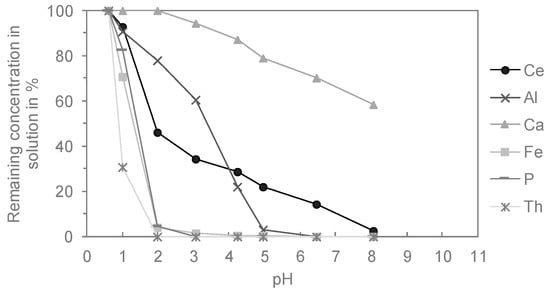
Figure 22.
Purification of the leachate solution with high impurity content. Magnesium oxide suspension (100 g/L) was used as precipitation agent.
The leachate from the two-stage digestion contained a much lower impurity content than the one-stage digestion leachate. A typical ion concentration is given in Table 7.
Table 7.
Metal ion concentration of a typical leach solution with low impurity content.
Ammonium solution was used as a precipitation agent, because there is no restriction of NH4+ in the liquid effluents of the process. That way, only NH4+ was used as the cation during the purification and precipitation process. In Figure 23, the concentrations of the elements are plotted against the increasing pH of the solution. Due to the low concentrations of impurities, a more dilute ammonium solution (3 wt%) was used to increase the pH. It can be seen that the precipitation of REE ions was low up to pH 5, while all of the aluminum, iron, and phosphate ions were completely precipitated.
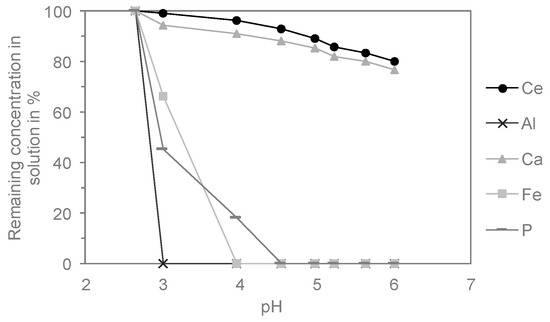
Figure 23.
Purification of the leachate solution with low impurity content. An ammonium solution (3 wt%) was used as the precipitation agent.
4.4. Rare Earth Carbonate Precipitation
After removing impurities, the solution contained REEs and a small amount of calcium. REE and some of the calcium can be precipitated as carbonates, provided that a sufficient amount of carbonates is available. The REEs were precipitated with a mixture of 3 wt% ammonium solution together with ammonium bicarbonate by raising the pH of the purified leachate above 8. At this pH, a sufficient amount of carbonate was present in the leachate to precipitate the REEs and some calcium. Therefore, the pH of the solution can be used as a marker to determine the condition of the REE precipitation.
Furthermore, it was found that even though the REEs could be precipitated solely with ammonium bicarbonate, the addition of ammonium solution produces a product that is easier to filtrate. Further experiments to enhance the filterability by a controlled flow rate of the carbonate solution will be conducted in the future.
Table 8 shows the composition of the precipitate for select elements. It was possible to recover 100% of the REEs from the solution. Overall, a REE recovery of over 80% can be achieved, and it is highly dependent on the performance of the digestion and leaching experiments. During the purification of the leachate, a loss of 3–5% was observed. The main impurities were, as expected, calcium and strontium.
Table 8.
Composition of the mixed-RE carbonate.
5. Summary and Outlook
The exploitation of REE-bearing phosphogypsum, a by-product of the fertilizer industry, is a promising concept for an economical production of REEs. In the presented project, the REE content was concentrated by physical methods prior to chemical processing to extract the REEs, a prerequisite for a competitive process. This paper focused on the development of a hydrometallurgical process for the production of a mixed-REE carbonate from the REO concentrate under the special consideration of safe thorium handling.
In preliminary tests, the sulfuric acid and the caustic soda digestion were tested. The digestion with sulfuric acid showed superior results with regard to impurity immobilization at similar REE yields. Therefore, this route was investigated in detail, supported by DoE. The obtained data were used to optimize the digestion parameters towards maximum REE yields and minimum thorium mobilization. The highest REE extraction (≥90%) was achieved at 275 °C for 4.3 h with a ratio of concentrated sulfuric acid to REO of 6.0 g/g, accompanied by high thorium mobilization (≥70%). The DoE also revealed that low thorium yields can be achieved at temperatures above 400 °C, depending on the ratio of sulfuric acid to REO. However, at this temperature range, REE yields are expected to decrease by about 10%. For the current concentrate quality, the ratio of sulfuric acid to REO is comparatively high. However, it is expected that the quality of the concentrate will increase in the future and the required ratio decrease.
Based on these results, it was investigated, whether a two-stage digestion could lead to a better compromise between REE extraction and impurity control with the first stage at low temperature (275 °C for 4.3 h) and a second stage at high temperature (400–500 °C for 1–2 h). The experiments revealed that the two-stage approach enables a complete immobilization of thorium and phosphorus in the leach residues. The REE yields seemed to be slightly higher in comparison to a single-stage high temperature digestion. Nevertheless, the yields deteriorated around 5–10% compared to the single-stage digestion at low temperature. Regarding baking time, the experiments showed that although a total time of about 5 h is necessary, the immobilization of thorium and phosphorus requires only a comparatively short period of 1 h at high temperature. The overall baking time is in line with industrial processes.
The leach solution of the two-stage digestion showed a very low impurity profile. Traces of aluminum, iron, and phosphorus can be precipitated with an ammonium solution at pH 5. Only alkaline earth metals remain in the solution with the REEs. In comparison, the leach solution of a single-stage low temperature digestion showed a much higher impurity content. The precipitation experiments showed significant co-precipitation of the REEs with phosphorus. These losses outweigh the higher yields during digestion and leaching by far.
After purification, the REEs can be precipitated as carbonates. As expected, the main impurities were calcium (1.16%) and strontium (0.26%); other impurities were only present in trace quantities (<200 ppm). Overall REE recoveries of 80–85% are achievable.
It should be noted that in all experiments, the highest extraction was achieved for cerium, followed by lanthanum and neodymium. Even though the REE extraction appears to follow similar regularities, the yield of neodymium was consistently 11% lower than the yield of cerium. More in-depth mineralogical analyses are required to determine the reason for this behavior.
In conclusion, the current state of this process’s development is very promising. Although further optimization, adaption to changing feed qualities, and scale-up of the process is necessary, an industrial implementation of the process seems to be feasible.
Author Contributions
L.B. and T.E. conceived the paper. L.B. conducted the literature review. The DoE was designed by L.B. All experiments were performed by L.B. The chemical analysis was executed by the analysis laboratory of the institute. The phase analysis, described in Section 4.1.3 and Section 4.2.4, was run and interpreted by T.S. All other sections were written by L.B. and T.E. The project was acquiesced and supervised by T.E. All authors have read and agreed to the published version of the manuscript.
Funding
This research was funded by Federal Ministry of Education and Research, grant number 033R187B.
Acknowledgments
We thank our project partners for the great cooperation, especially Ceritech AG who provided great expertise and the feed material used for the experiments. We would also like to show our gratitude to the analysis laboratory of the institute for the collaboration. We acknowledge support by Open Access Publishing Fund of Clausthal University of Technology.
Conflicts of Interest
The authors declare no conflict of interest. The funders had no role in the design of the study, in the collection, analyses, or interpretation of data, in the writing of the manuscript, or in the decision to publish the results.
References
- Holleman, A.; Wiberg, N. Lehrbuch der Anorganischen Chemie, Band 1+2; De Gruyter: Boston, MA, USA, 2007; ISBN 978-3-11-020684-5. [Google Scholar]
- U.S. Geological Survey. Mineral Commoditiy Summaries 2019: U.S. Geological Survey. 2019. Available online: https://www.usgs.gov/centers/nmic/mineral-commodity-summaries (accessed on 14 March 2019).
- Market Deeper. Global Neodymium Iron Boron Market Research Report 2018 Opportunities, Size, Cost Structure, Service Provider, Segmentation, Shares, Forecast to 2023. Available online: https://www.marketdeeper.com/global-neodymium-iron-boron-market-research-report-2018-15577.html (accessed on 14 March 2019).
- British Geological Survey. Rare Earth Elements. 2011. Available online: https://www.bgs.ac.uk/downloads/start.cfm?id=1638 (accessed on 14 March 2019).
- Elsner, H. Seltene Erden—Stand Heute. In Proceedings of the GDMB Special Metals Expert Committee; Öko-Institut e.V.: Schwäbisch Gmünd, Germany, 2015. [Google Scholar]
- Tayibi, H.; Choura, M.; López, F.A.; Alguacil, F.J.; López-Delgado, A. Environmental impact and management of phosphogypsum. J. Environ. Manag. 2009, 90, 2377–2386. [Google Scholar] [CrossRef] [PubMed]
- Binnemans, K.; Jones, P.T.; Blanpain, B.; van Gerven, T.; Pontikes, Y. Towards zero-waste valorisation of rare-earth-containing industrial process residues: A critical review. J. Clean. Prod. 2015, 99, 17–38. [Google Scholar] [CrossRef]
- Walawalkar, M.; Nichol, C.K.; Azimi, G. Process investigation of the acid leaching of rare earth elements from phosphogypsum using HCl, HNO3, and H2SO4. Hydrometallurgy 2016, 166, 195–204. [Google Scholar] [CrossRef]
- Saueia, C.H.R.; Mazzilli, B.P. Distribution of natural radionuclides in the production and use of phosphate fertilizers in Brazil. J. Environ. Radioact. 2006, 89, 229–239. [Google Scholar] [CrossRef] [PubMed]
- Rychkov, V.N.; Kirillov, E.V.; Kirillov, S.V.; Semenishchev, V.S.; Bunkov, G.M.; Botalov, M.S.; Smyshlyaev, D.V.; Malyshev, A.S. Recovery of rare earth elements from phosphogypsum. J. Clean. Prod. 2018, 196, 674–681. [Google Scholar] [CrossRef]
- Valkov, A.V.; Andreev, V.A.; Anufrieva, A.V.; Makaseev, Y.N.; Bezrukova, S.A.; Demyanenko, N.V. Phosphogypsum technology with the extraction of valuable components. Procedia Chem. 2014, 11, 176–181. [Google Scholar] [CrossRef]
- Gupta, C.K.; Krishnamurthy, N. Extractive Metallurgy of Rare Earths; CRC Press: Boca Raton, FL, USA, 2004; ISBN 978-0-415-33340-5. [Google Scholar]
- Deer, W.A.; Howie, R.A.; Zussman, J. An Introduction to the Rock-Forming Minerals, 2nd ed.; Pearson/Prentice Hall: Harlow, UK, 2009; ISBN 0582300940. [Google Scholar]
- Chen, W.; Honghui, H.; Bai, T.; Jiang, S. Geochemistry of Monazite within Carbonatite Related REE Deposits. Resources 2017, 6, 51. [Google Scholar] [CrossRef]
- Bünzli, J.-C.; Mcgill, I. Rare Earth Elements. In Ullmann’ s Encyclopedia of Industrial Chemistry; Wiley: Chichester, UK, 2010; ISBN 3527306730. [Google Scholar]
- Kanazawa, Y.; Kamitani, M. Rare earth minerals and resources in the world. J. Alloys Compd. 2006, 408–412, 1339–1343. [Google Scholar] [CrossRef]
- Qi, D. Extraction of rare earths from RE concentrates. In Hydrometallurgy of Rare Earths; Elsevier: Amsterdam, The Netherlands, 2018; pp. 1–185. ISBN 9780128139202. [Google Scholar]
- Demol, J.; Ho, E.; Senanayake, G. Sulfuric acid baking and leaching of rare earth elements, thorium and phosphate from a monazite concentrate: Effect of bake temperature from 200 to 800 °C. Hydrometallurgy 2018, 179, 254–267. [Google Scholar] [CrossRef]
- Chi, R.; Zhou, Z.; Xu, Z.; Hu, Y.; Zhu, G.; Xu, S. Solution-chemistry analysis of ammonium bicarbonate consumption in rare-earth-element precipitation. Metall. Mater. Trans B 2003, 34, 611–617. [Google Scholar] [CrossRef]
- Kim, P.; Anderko, A.; Navrotsky, A.; Riman, R. Trends in structure and thermodynamic properties of normal rare earth carbonates and rare earth hydroxycarbonates. Minerals 2018, 8, 106. [Google Scholar] [CrossRef]
- Zhang, Z.; Jia, Q.; Liao, W. Progress in the separation processes for rare earth resources. In Handbook on the Physics and Chemistry of the Rare Earths 2015: Including Actinides; Bünzli, J.-C., Pecharsky, V.K., Eds.; Elsevier: Amsterdam, The Netherlands, 2015; pp. 287–376. ISBN 9780444634832. [Google Scholar]
- Sadri, F.; Rashchi, F.; Amini, A. Hydrometallurgical digestion and leaching of Iranian monazite concentrate containing rare earth elements Th, Ce, La and Nd. Int. J. Miner. Process. 2017, 159, 7–15. [Google Scholar] [CrossRef]
- Zhang, J.; Zhao, B.; Schreiner, B. Separation Hydrometallurgy of Rare Earth Elements, 1st ed.; Springer International Publishing: Cham, Switzerland, 2016; ISBN 9783319282336. [Google Scholar]
- Voncken, J.H.L. The Rare Earth Elements: An Introduction, 1st ed.; Springer International Publishing: Cham, Switzerland, 2016; ISBN 978-3-319-26809-5. [Google Scholar]
- Astimex Standard Ltd.: Toronto, ON, Canada. Available online: https://www.astimex.com/ (accessed on 15 January 2020).
- Royen, H.; Fortkamp, U. Rare Earth Elements. Purification, Separation and Recycling. 2016. Available online: http://www.ivl.se/download/18.76c6e08e1573302315f3b85/1480415049402/C211.pdf (accessed on 22 March 2018).
© 2020 by the authors. Licensee MDPI, Basel, Switzerland. This article is an open access article distributed under the terms and conditions of the Creative Commons Attribution (CC BY) license (http://creativecommons.org/licenses/by/4.0/).