Article

Nanoindentation Properties of 18CrNiMo7-6 Steel after Carburizing and Quenching Determined by Continuous Stiffness Measurement Method

1
State Key Laboratory of Mechanical Transmissions, Chongqing University, Chongqing 400044, China
2
Technology Center, Chongqing Gearbox Co., Ltd., Chongqing 402263, China
3
College of Mechanical Engineering, University of South China, Hengyang 421001, China
*
Authors to whom correspondence should be addressed.
Metals 2020, 10(1), 125; https://doi.org/10.3390/met10010125
Submission received: 12 December 2019 / Revised: 11 January 2020 / Accepted: 13 January 2020 / Published: 15 January 2020

Abstract

:
In this work, the nanomechanical properties involving the indentation size effect (ISE) and yield strength of a surface-modified layer of 18CrNiMo7-6 steel after case hardening were investigated via nanoindentation experiments. The experimental results showed that the hardness increased with an increase in strain rate; the contact stiffness versus indentation depth curves take the form of upper convexity due to residual compressive stress relaxation. On the basis of the Ruiz-Moreno model, a modified model considering the cutoff parameter as a function of indentation depth was proposed. This model was able to better describe the ISE of the surface-modified layer. With the Hough transform error angle of 0.1° as the critical value (h0.1° is the corresponding depth), when h > h0.1°, the yield strength calculated by the Ma model started to disperse at the depth of h0.1°. These results provide useful insight into the local mechanical properties of 18CrNiMo7-6 steel after carburizing and quenching treatment.

1. Introduction

Gearboxes in wind turbines and cement mills require high performance to work in extremely harsh conditions for a long period of time. To alleviate the defects on tooth surfaces and to obtain a surface-modified layer with high residual compressive stress and high hardness on the gear tooth surface, case hardening techniques have been adopted, such as carburizing. The surface-modified layer plays an important role in improving resistance against the wear and fatigue of gears. However, in actual operation, damage is still frequent, such as tooth breakage and spalling [1,2,3]. Both the wind turbines and cement mills suffer severe and variable dynamic loads, so it is very important to investigate the damage behaviors and mechanisms of tooth surfaces under a dynamic load. Given that the mechanical properties, such as the yield strength and the hardening exponent, play an essential role in gear design, the measurement of the local mechanical properties is of great significance. On the other hand, improving the mechanical properties can effectively reduce the damages. However, it is difficult to obtain the local mechanical properties of materials around the tooth’s surface by means of a macroscopic method; the nanomechanical characterization method is of great significance and would help to enrich our understanding of the nanomechanical properties of the surface-modified layer of 18CrNiMo7-6 steel with case hardening, especially its hardness, hardening exponent and yield strength.
A commonly used method for characterizing local mechanical properties, such as the elastic modulus and hardness at the nanoscale, from the load-depth curves of nanoindentation was proposed by Oliver and Pharr [4,5]. With the development of the nanoindentation technique, a continuous stiffness measurement (CSM) that adds sinusoidal oscillation to the normal load during the process of nanoindentation was developed to obtain the contact stiffness, elastic modulus, and hardness at each point in the loading curve [6]. However, CSM inevitably involves the size effect of indentation, so it is necessary to describe the size effect.
Several studies show that there is an obvious indentation size effect (ISE) of hardness in the process of nanoindentation. Rodríguez et al. [7] studied the ISE of different metals by performing nanoindentation tests at different penetration depths. Their results showed that the ISE is more obvious when the martensite has higher carbon content. Zhang et al. [8] researched the properties of biomaterials and teeth at different strain rates via the CSM method. One of the most widely used ISE models is the Nix–Gao model proposed in 1998 [9], which introduces Geometrically Necessary Dislocations (GNDs) during the nanoindentation process. The reliability of the Nix–Gao model has been confirmed by large numbers of experiments, but small defects still remain, although some improvement have been presented for studying the material’s microstructure [10]. Ruiz-Moreno et al. [11] proposed a generalized Nix−Gao model to analyze the break-down of the ISE scaling regime for a small indentation depth. These models can accurately describe the nanomechanical properties of most single crystals or polycrystals.
In addition, the local hardness values, yield strength, and hardening exponent of surface-modified layer can be obtained through nanoindentation tests using these models. Campbell et al. [12] proposed an iterative finite element method (FEM) simulation to infer the stress strain curves from indentation data. Ma et al. [13] developed a method based on FEM and dimensional analysis to extract the elastic–plastic properties of metallic materials by using the indentation method. These models provide an effective way for us to study the ISE of hardening exponent and yield strength.
In this paper, the local nanomechanical properties of the surface-modified layer of 18CrNiMo7-6 steel after carburizing and quenching treatment were investigated based on the CSM technique. An improved size effect model was proposed to describe the variations in hardness with penetration depth. This work will help enrich our understanding of the local nanomechanical properties of the near-surface of gear carburized carbon steel.

2. Materials and Methods

The samples used in this study were fabricated from case hardening steel 18CrNiMo7-6 (EN 10084) which is widely used in many industrial components. The chemical composition of the material before the carburizing and quenching treatment is reported in Table 1 which measured by a spectrometer (OBLF GS1000, Witten, Germany).
The small differences in the case hardening process may cause large differences in heavy-duty industry performance [3,14], so the same case hardening process used for a real sun gear in a wind turbine gearbox has been adopted. The schematic diagram showing the methodology of this work was drawn in Figure 1. The samples were cut from a hot rolled bar normalized at 1050 °C. The heat treatment process consists of three stages: (i) The gas carburized at 920 °C for 10 h, and then cooled in air; (ii) reheated to 820 °C for 5 h, nitrate quenched to room temperature and finally low tempered at 200 °C for 17 h. The thickness of the hardening layer is 4.87 mm, and the hardness of the surface is HRC 60 (The ‘HRC’ is represents for Rockwell C scale, it can be regarded as the unit for hardness, which is conventionality in the relevant field), according to the Inspecting Report of Heat Treatment (No. WL20190100153) of Chongqing Gearbox Co., Ltd.
Nanoindentation tests were carried out via an XP nanoindenter (G200, Agilent, Santa Clara, CA, USA) on these samples using the CSM technique. In this paper, nanoindentation experiments under three different strain rates of 0.03, 0.1, and 0.3 s−1 were performed, and these experiments were repeated four times. The strain rate ε ˙ is defined as ε ˙ = h ˙ / h [15], where h ˙ is the indentation rate, and h is the indentation depth. During the indentation process of a specific test, the strain rate was held constant by the instrument. Before indentation, metallographic preparation was performed by grinding the specimen with silicon carbide paper and polishing it with diamond paste (W0.5). A portable X-ray residual stress analyzer (μ-x360s, Pulstec, Nakagawa, Japan) was used to determine the residual stress produced by the carburizing and quenching process. A Confocal Laser Scanning Microscope (CLSM, Olympus, OLS 5000, Tokyo, Japan) was used to observe the indentation morphologies and measure the surface roughness of the sample.

3. Results

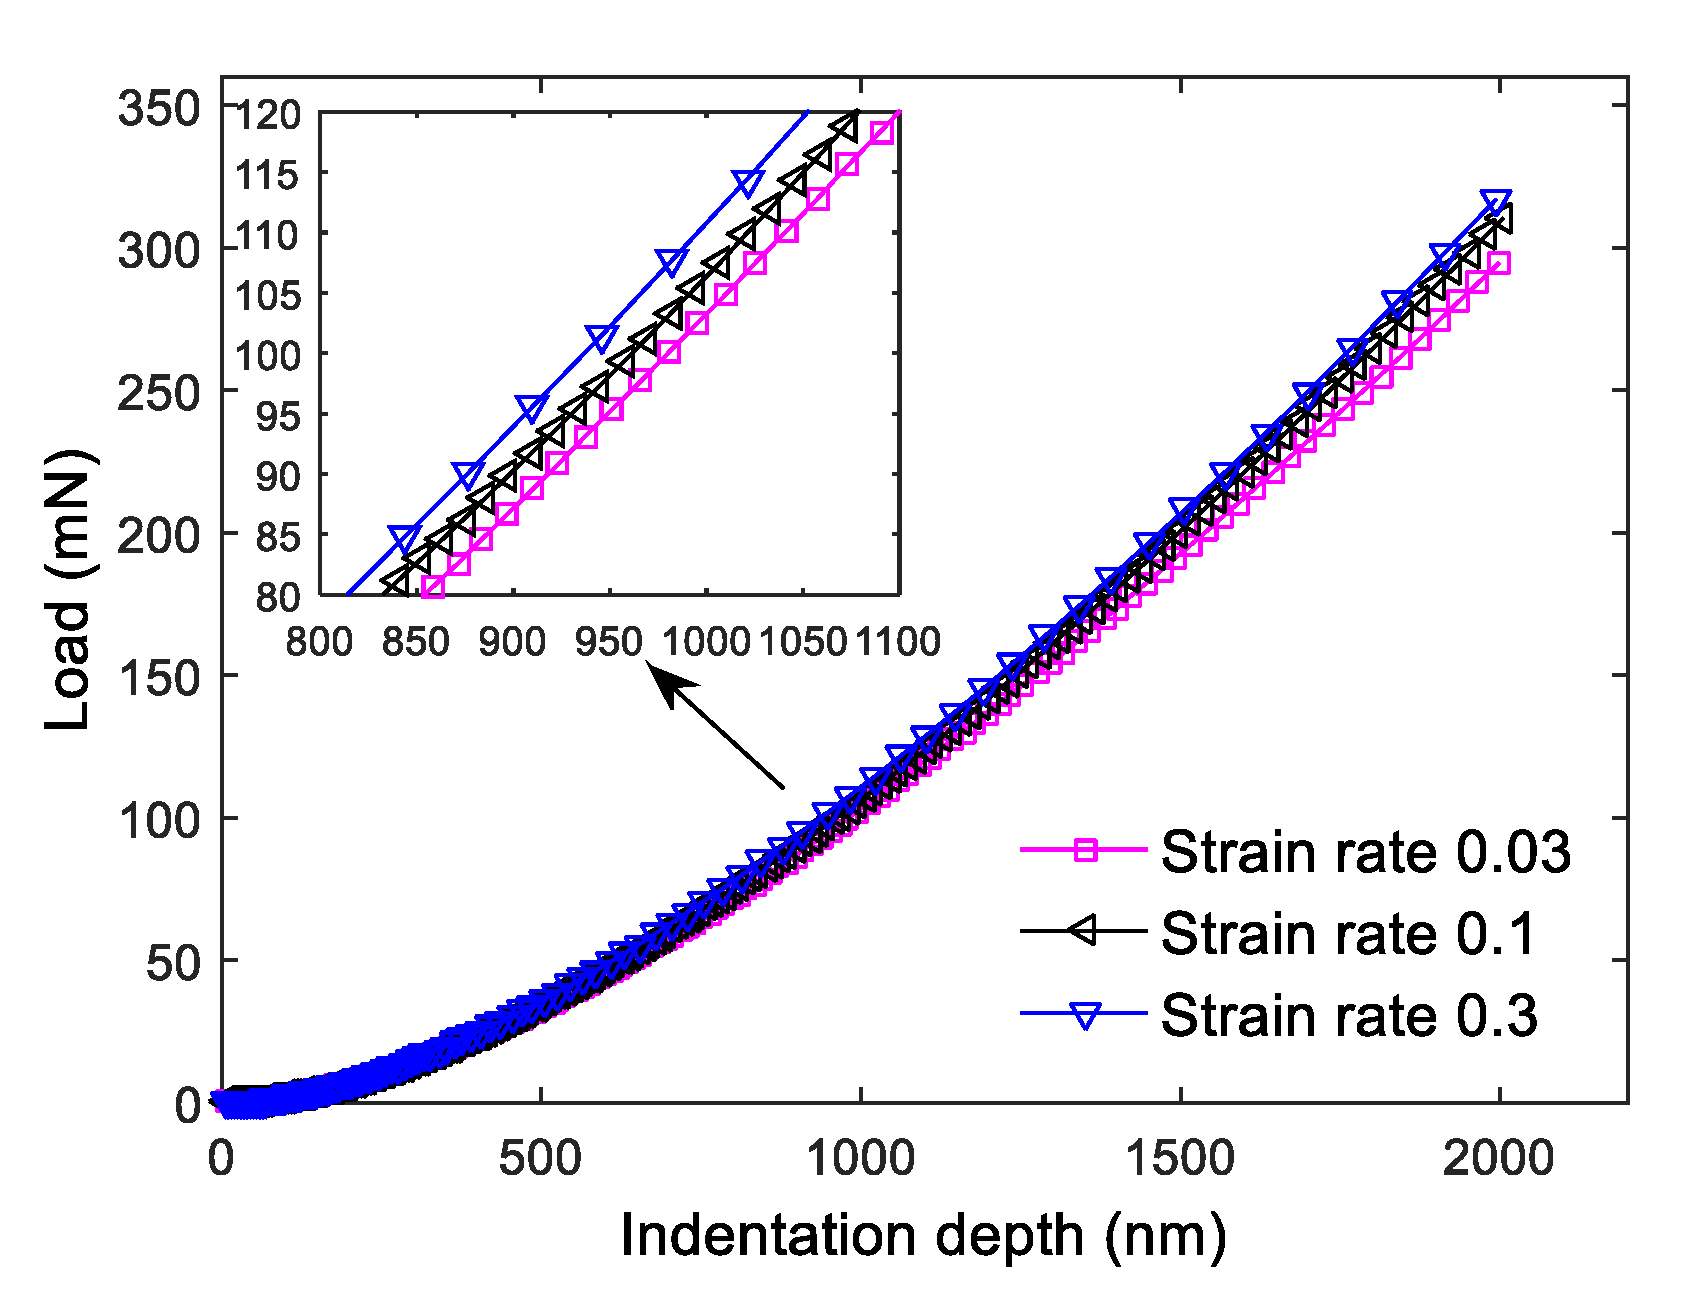
3.1. The Load–Depth Curves

Figure 2 shows the load–depth curves under the three different strain rates of 0.03, 0.1, and 0.3 s−1. It indicated that the indentation load increased slightly with the strain rate under the same indentation depth. As the nanoindentation tests were performed in a depth-controlled manner, the load increment required for penetrating the same depth in the early stage is smaller than that in the later stage, so the load–depth curve is obviously dense in the early stage.

3.2. The Hardness and Elastic Modulus

Figure 3 shows the mean values of the indentation hardness versus the indentation depth for three strain rates of 0.03, 0.1, and 0.3 s−1. As can be seen in Figure 3, the hardness of the material shows a similar variation trend with an increase in the indentation depth under three strain rates. The variation process can be divided into three stages: (i) (indentation depth h < 26 nm) Firstly, the hardness increased dramatically; (ii) secondly, the hardness became stable transitorily when the hardness reached its the maximum value; (iii) finally, the hardness gradually decreased with the increase in the indentation depth, showing an obvious ISE. Specifically, when the indentation depth h < 26 nm, these three curves are tightly intertwined, and there is a transient oscillation section near the indentation depth of 26 nm. When the indentation depth h > 26 nm, these three curves are distinguishable, and the maximum hardness value increases with the strain rate. Jia et al. [16] presented a similar result concerning the hardness of duplex stainless steel by using the CSM technique.
Figure 4 shows the mean values of the elastic modulus versus indentation depth under three strain rates of 0.03, 0.1 and 0.3 s−1. Similar to the hardness, the elastic modulus can also be divided into three stages with an advance of the indentation depth. First, it dramatically increases, reaching a maximum value with a short plateau, and then gradually decreases with an obvious ISE. In addition, no transient oscillation can be observed when the indentation depth is near 26 nm. The surface roughness Ra is measured as ~6 nm, and the Berkovich indenter with a curvature radius of ~20 nm. Therefore, the curves that dramatically increase when the indentation depth is less than 26 nm may also be due to the asperities contact effect (in addition to the explanation of Jia et al. [16]). Given that the reliability of the measured elastic modulus value is poor in the case of a small indentation depth, the asperities contact effect was not taken into account in the subsequent analyses.

3.3. The Indentation Morphologies

The indentation morphologies were observed with CLSM and the indentation profiles at the height-horizontal section were measured along the red dotted line. Figure 5a–c shows the representative indentation morphologies under the three strain rates of 0.03, 0.1, and 0.3 s−1, respectively. It can be seen that there was an obvious pile-up phenomenon in the indentation region. The statistical diagram of the maximum pile-up height and the residual depth are plotted in Figure 5d, indicating that the final residual depth decreased with the strain rate, while the variation of the maximum pile-up height with the strain rate was inconspicuous. It is known that the pile-up height is not only related to the material properties and loading rate, but also to the friction coefficient, while the final depth has little to do with [17], so the variation of pile-up heights is independent from the strain rate.
By using the X-ray method, the residual compressive stress of the surface-modified layer produced by the carburizing and quenching process was measured as −412.6 ± 59.2 MPa.

4. Discussion

Figure 6 shows the variation of contact stiffness versus indentation depth under the three strain rates of 0.03, 0.1, and 0.3 s−1. The contact stiffness in the continuous stiffness measurement (CSM) was calculated by Equation (1), based on the work in [4,18]:
S = [ 1 F 0 z 0 cos ϕ ( K s m ω 2 ) 1 K f ] 1
where K f , K s , and m are the parameters of the instrument itself, ω is the angular frequency,   ω = 2 π f , and f = 45   Hz , F 0 ,     z 0 , and ϕ are the parameters tested during the indentation process. This indicates that the contact stiffness shows an upper convex function law with an increase of depth, and there is a short straight-line segment when the depth is small. A new area with residual stress relaxation will thus be introduced, as the Berkovich indenter penetrates into the carburized layer in a new sine cycle, and the formerly affected area continues to be relaxed. This indicates that the effect of residual stress relaxation on contact stiffness becomes progressively more obvious as the indentation process proceeds, until the former area relaxes completely. However, in the area close to the surface, the residual stress was relaxed completely or partially before the indentation, which made the residual stress have little effect on the contact stiffness in this area, which explains why straight-line segments can be found in Figure 6a–c at the beginning of the curves.
The straight-line segments of these contact stiffness versus depth curves near the origin point can be extracted by a Hough transform with error angles of 0.01° and 0.1°, as shown in Figure 6a−c. The maximum depth of the straight-line segments under different error angles are shown in Figure 6d. This result indicates that there is no significant difference in the maximum depth of the straight-line segment under the three strain rates, so the indentation depth influenced by the residual compressive stress is independent of the strain rate. According to the previous analysis, we propose that the residual compressive stress has no influence on the elastic modulus and hardness at a depth of ~250 nm and only a slight influence at a depth of ~650 nm, as shown in Figure 6d.
In the Nix–Gao model [9], the ISE can be written as
H H 0 = 1 + h * h
where H0 is the macro hardness (i.e., when h , H H 0 ), and h* is the characteristic length. Hence, H0 and h* could be considered as parameters for a specific indentation. Ana Ruiz-Moreno et al. [11] proposed a generalized Nix−Gao model, as below,
H ( z ) = 1 2 H 0 [ ( 2 + z ) 1 + z z 2 2 ln 2 1 + z + 2 + z z ( 1 + 2 r + r 2 + 2 r ) z 2 r + r 2 ]
where z = 2 h * 3 h denotes the dimensionless inverse indentation depth, and r = ρ SSD ρ GND , max is the cut-off parameter defined as the ratio between the statistically stored dislocations density ρSSD and the cut-off of the GND density ρGND,max, which is kept constant during the nanoindentation process.
However, as the martensite obtained by the carburizing and quenching treatment is a twin crystal structure with a small grain size and complex orientation [19], the plastic deformation in the indentation boundary region is complex [20]. In addition, the contact boundary of indentation always exhibits a pile-up state, and the volume of this pile-up varies with indentation depth, which makes the contact radius and the singular area difficult to determine. That is, the cut-off parameter r may not be a constant but a complex function related to depth (i.e., r(h)). So the remaining distance aremain that causes the singular behavior of ρ GND ( r a ; h ) could be assumed as a fixed parameter, then with the increase of contact radius a (as the h increases), the ratio of the remaining distance to the contact radius aremain/a becomes smaller, and the cut-off GND density ρGND,max becomes larger. Thus, ρGND,max can be considered an increasing function of h. One can assume that ρGND,max(h) is a power function. Thus, Equation (3) yields the following result:
H ( z ) = 1 2 H 0 [ ( 2 + z ) 1 + z z 2 2 ln 2 1 + z + 2 + z z ( 1 + 2 r ( h ) + r ( h ) 2 + 2 r ( h ) ) z 2 r ( h ) + r ( h ) 2 ]
where r ( h ) = ρ SSD h ψ ρ GND , max , 0 . The ρ GND , max , 0 and the ψ are the material parameters kept constant during the indentation process. This is a modified Ruiz-Moreno model, which contains the case of r = c o n s t a n t ( ψ = 0 ). Thus, Equation (4) is a generalization of the Ruiz-Moreno model and could have a wider range of applications
There is a fluctuating plateau in the process of hardness measurement, which can be considered an important feature of ISE. In the Ruiz-Moreno model, this plateau is taken into account and is regarded as the largest hardness value in the measurement process. It is well known that H0 can be accurately obtained by Nix–Gao model for data of the square of the hardness against the reciprocal of the depth to be straight line. If H0 and h* are obtained from the Nix–Gao model, there is only one variable parameter ρGND,max for the Ruiz-Moreno model and two variable parameters ρGND,max,0 and ψ for the modified Ruiz-Moreno model. Thus, for the determined experimental data, the parameters of both models can be obtained by data fitting. An improved fitting procedure that considers the Nix–Gao model, Ruiz-Moreno model and modified Ruiz-Moreno model is proposed as follows:
(1)
By changing the hardness that varies with depth into the form of H 2 with h−1 and extracting the straight line at the front section of the curve (h−1 is small), the fitting parameters k and b in H 2 = k × h 1 + b can be obtained by fitting the data linearly. Thus, the following relation is obtained:
(2)
H 2 b = k b × h 1 + 1 , compared with the Nix–Gao model (Equation (2)), we get, H 0 = b , h * = k b . As H0 is the hardness value when h , that means the depth is close to infinity, the ISE should no longer exist; and h is equivalent to h 1 0 , so almost all ISE models satisfy H ( h 1 ) | h 1 0 H 0 = 1 , so the straight line always appears in region of smaller h-1. Therefore, the H0 and h* obtained by using the Nix–Gao model for straight-line segment are reliable.
(3)
The variation of the H2 with h−1 is transformed into the form of ( H H 0 ) 2 with h−1, and then the cut-off parameter r can be obtained by fitting with the Ruiz-Moreno model, Equation (3).
(4)
The two parameters, ρGND,max,0 and ψ of r(h) can be obtained via fitting with the modified Ruiz-Moreno model (Equation (4)).
The ISE of hardness can be analyzed by using the improved fitting procedure, a typical measurement result under strain rate of 0.03 s−1 has been adopted, and a cut-off value of h−1 has been introduced to improve the fitting effect. A comparison of Nix–Gao model (h−1 ≤ 0.0018, which means that the cut-off value equal to 0.0018, the same as below), Ruiz-Moreno model (h−1 ≤ 0.01) and modified Ruiz-Moreno model (h−1 ≤ 0.01) is shown in Figure 7a. Figure 7b shows the fitting results of the true hardness H0 under three strain rates using the Nix–Gao model (h−1 ≤ 0.0018). In order to understand the performance of Ruiz-Moreno model and modified Ruiz-Moreno model, the fitting process has been investigated under different cut-off values of h−1. Figure 7c,d are fitting evaluations of the Ruiz-Moreno model and the modified Ruiz-Moreno model under different cut-off values. The fitting evaluations include a residual sum of squares, RSS, and plateau value, which are defined as the first extreme point.
Figure 7a indicates that the fitting of the Nix–Gao and Ruiz-Moreno models performs well at larger depth (i.e., smaller h−1), but deteriorates obviously when the depth becomes smaller. In fact, this is determined by the function itself, as the Nix–Gao model is only a straight line that has no ability to evaluate the convexity and plateau value at smaller depth. The Ruiz-Moreno model presents a similar case, like the Nix–Gao model, it has a relatively fixed slope at a larger depth (smaller h−1) and only one parameter to be fitted. However, the modified Ruiz-Moremo model has two parameters to be fitted, which has the ability to take into account the overall trend of the data, especially for the description of the convexity and the plateau at smaller depth. Figure 7b indicates that the true hardness obtained by the Nix–Gao model increases with the strain rate, which expresses the strain rate sensitive. Figure 7c,d indicates that the RSS and plateau value vary with the cut-off values. The RSS of the modified Ruiz-Moreno model is much smaller than that of the Ruiz-Moreno model, which indicates that the fitting of the modified Ruiz-Moreno model is better than that of the Ruiz-Moreno model in this study. For the prediction of the plateau value, the sensitivity of the modified Ruiz-Moreno model to the cut-off value of h−1 is around the true plateau value, while that of the Ruiz-Moreno model is distant from the true plateau value.
The improvement of the fitting effect is mainly depended on the considering of the cutoff parameter as a function of indentation depth in modified Ruiz-Moreno model. Indeed, the integrable singularity problem can be effectively solved, just through setting the cutoff parameter as a variable limited value, rather than a fixed value. This improvement can not only better describe the objective physical law, but can also increase the adaptability of the fitting function.
Many models can obtain the yield strength and hardening exponent of material from the indentation test. The Ma model [13] is one such model and is shown in Equations (5) and (6).
Π α ( n , σ y E ) = P E h 2 = ( 2.77 2.11 n ) ( σ y E ) [ 0.064 ln ( σ y E ) 0.42 n ]
Π β ( n , σ y E ) = h c h = 0.70 + 0.55 exp ( 2.16 n ) exp [ 40.32 ( σ y E ) ]
where the load P, depth h, stiffness S and elastic modulus E are obtained from the results of the continuous stiffness measurement. In this study, the hc can be calculated by the O-P method, therefore the Πα and Πβ can be obtained, and then the yield strength σy and hardening exponent n at each depth can be calculated by the Ma model.
The yield strength that varies with depth has been calculated by the indentation data under the three strain rates, as shown in Figure 8. This figure indicates that the yield strength decreases with an increase in depth before the red dotted lines, and the yield strength under the same strain rate coincides well, which also demonstrates that the measurement results and Ma model are reliable. The critical depth h0.1° (the depth corresponds to an error angle of 0.1°) in Figure 6 was also plotted in Figure 8, which indicates that the critical depth h0.1° coincides with the dispersion starting point of the yield strength.
The elastic modulus is an important parameter in the model proposed by Ma et al., however, due to the action of residual compressive stress, the elastic modulus is too small when h > h0.1°, which makes the yield strength value calculated by the Ma model dispersed. However, in the region of h < h0.1°, the yield strength is credible. Specifically, the yield strength also features ISE as the hardness, which may be related to the positive correlation between hardness and yield strength, which has been presented in many previous studies [21,22].
The mean values of the yield strength at h = h0.1° for the three strain rates is marked in Figure 8a–c, which indicates that the mean value of the yield strength increases with the strain rate, although there is a small difference between 0.1 and 0.3 s−1. This trend is similar to that of hardness. When the depth is small, the hardening exponent increases rapidly with an increase of depth and then gradually increases with fluctuations up to a certain value (Figure 8d). Materials express greater elastic properties with a larger hardening exponent, so this result indicates that the elastic properties become progressively more obvious with an increase of depth. According to the local assumptions and analyses before, the hardening exponent also features the ISE, when h < h0.1°. As in reference [13], the stress–strain curve in the Ma model is based on the Hollomon equation, which is determined by the yield strength and hardening exponent. However, both the test material itself and the residual stress state do not fully meet the assumptions of the Hollomon equation, especially for the 18CrNiMo7-6 material after carburizing treatment. Because the effect of carburization can significantly change the shape of the stiffness-depth curve, this effect is more pronounced for the calculation of the yield strength and the hardening exponent. This is the main reason why the critical depth h0.1° coincides with the dispersion starting point of the yield strength.
Although the ISE of 18CrNiMo7-6 after carburizing and quenching has been well described by the modified model, but the study of the physical mechanism is still lacking, such as ISE of surface-modified layer of 18CrNiMo7-6 steel at extremely small depth and the and the rate of increase in real hardness with the strain rate. We intend to carry out in-depth research on these contents in the future.

5. Conclusions

In this paper, the ISE of 18CrNiMo7-6 after carburizing and quenching was investigated via the CSM technique of nanoindentation. The measured values of the hardness and elastic modulus can be divided into three stages. First, the values are increased with the indentation depth due to the asperities contact effect; then they reach their maximum value and kept stable temporarily. Finally, an obvious ISE can be observed. The stiffness-depth curves present an upper convex function due to the residual compressive stress, and the straight line segments of the three stiffness-depth curves near the origin point can be extracted by a Hough transform with error angles of 0.01° and 0.1°. Both the stiffness-depth curves and the hardness are not affected by residual compressive stress when h < h0.01° and slightly influence when h < h0.1°. However, when h > h0.1°, the stiffness-depth curves are affected. The ISE of the hardness cannot be properly described by the Nix–Gao model and the Ruiz-Moreno model. By taking the constant cut-off parameter of Ruiz-Moreno model into a function of depth, the ISE of the hardness can be more accurately described. The variations of the yield strength and hardening exponent with depth have been calculated by the Ma model, and the yield strength also presents an ISE. In addition, the critical depth h0.1° coincides with the dispersion starting point of the yield strength. These results provide useful insight into the local mechanical properties of 18CrNiMo7-6 steel after carburizing and quenching treatment when subjected to some external loads. Furthermore, it may help to evaluate the damage behavior of the tooth surface under dynamic load.

Author Contributions

Q.T. and J.Z. designed the research project; G.Z. and Z.H. performed the experiments; G.Z. analyzed the data; and G.Z. and J.G. wrote the manuscript. All authors have read and agreed to the published version of the manuscript.

Funding

This research was supported by the National Key Research and Development Program of China (No. 2018YFB1701203), the National Natural Science Foundation of China (No. 51975073), the China Shipbuilding Industry Corporation (No. 2017K17), and the Natural Science Foundation of Hunan Province (No. 2019JJ50518).

Acknowledgments

Sincere thanks are expressed to the Chongqing Yongchang Science & Technology Co., Ltd. for laser confocal microscope testing of the indentation morphologies.

Conflicts of Interest

The authors declare no conflict of interest.

Nomenclature

H hardness measured by the CSM method
H 0 true hardness calculated by the ISE models
S stiffness of the sample
K f frame stiffness of the nanoindenter
ω angular frequency
ϕ phase angle of displacement lag load
m mass of moving parts in a nanoindenter
F 0 amplitude of the excitation load
z 0 displacement amplitude during the CSM tests
K s stiffness of blade spring in the nanoindenter
f frequency during the CSM tests
ε ˙ strain rate during the indentation process
h ˙ indentation rate during the indentation process
h indentation depth during the indentation process
h c contact depth during the indentation process
σ y yield strength
ρ GND , max cut-off of the GND density
n hardening exponent
E elastic modulus
r cut-off parameter in the Ruiz-Moreno model
r ( h ) cut-off parameter as a function of indentation depth in the modified Ruiz-Moreno model
ρ SSD statistically stored dislocation density
a contact radius
a remain remaining distance that causes the singular behavior in the Ruiz-Moreno model
h * characteristic length
z dimensionless inverse indentation depth
Π α ,   Π β first and second dimensionless function of the Ma model, respectively
h0.1°, h0.01°corresponding depth of the Hough transform error angles 0.1° and 0.01°, respectively

References

  1. Carroll, J.; Koukoura, S.; McDonald, A.; Weiss, S.; McArthur, S. Wind turbine gearbox failure and remaining useful life prediction using machine learning techniques. Wind Energy 2019, 22, 360–375. [Google Scholar] [CrossRef] [Green Version]
  2. Bhardwaj, U.; Teixeira, A.P.; Soares, C.G. Reliability prediction of an offshore wind turbine gearbox. Renew. Energy 2019, 141, 693–706. [Google Scholar] [CrossRef]
  3. He, H.F.; Liu, H.J.; Zhu, C.C.; Tang, J.Y. Study on the gear fatigue behavior considering the effect of residual stress based on the continuum damage approach. Eng. Fail. Anal. 2019, 104, 531–544. [Google Scholar] [CrossRef]
  4. Oliver, W.C.; Pharr, G.M. An improved technique for determining hardness and elastic modulus using load and displacement sensing indentation experiments. J. Mater. Res. 1992, 7, 1564–1583. [Google Scholar] [CrossRef]
  5. Oliver, W.C.; Pharr, G.M. Measurement of hardness and elastic modulus by instrumented indentation: Advances in understanding and refinements to methodology. J. Mater. Res. 2004, 19, 3–20. [Google Scholar] [CrossRef]
  6. Pharr, G.M.; Strader, J.H.; Oliver, W.C. Critical issues in making small-depth mechanical property measurements by nanoindentation with continuous stiffness measurement. J. Mater. Res. 2009, 24, 653–666. [Google Scholar] [CrossRef]
  7. Rodríguez, R.; Gutierrez, I. Correlation between nanoindentation and tensile properties influence of the indentation size effect. Mater. Sci. Eng. A 2003, 361, 377–384. [Google Scholar] [CrossRef]
  8. Zhang, Y.F.; Zheng, J.; Yu, J.X.; He, H.T. Impact of strain rate on the hardness and elastic modulus of human tooth enamel. J. Mech. Behav. Biomed. Mater. 2018, 78, 491–495. [Google Scholar] [CrossRef]
  9. Nix, W.D.; Gao, H. Indentation size effects in crystalline materials: A law for strain gradient plasticity. J. Mech. Phys. Solids 1998, 46, 411–425. [Google Scholar] [CrossRef]
  10. Durst, K.; Backes, B.; Franke, O.; Göken, M. Indentation size effect in metallic materials: Modeling strength from pop-in to macroscopic hardness using geometrically necessary dislocations. Acta Mater. 2006, 54, 2547–2555. [Google Scholar] [CrossRef]
  11. Ruiz-Moreno, A.; Hähner, P. Indentation size effects of ferritic/martensitic steels: A comparative experimental and modelling study. Mater. Des. 2018, 145, 168–180. [Google Scholar] [CrossRef]
  12. Campbell, J.E.; Kalfhaus, T.; Vassen, R.; Thompson, R.P.; Dean, J.; Clyne, T.W. Mechanical properties of sprayed overlayers on superalloy substrates, obtained via indentation testing. Acta Mater. 2018, 154, 237–245. [Google Scholar] [CrossRef]
  13. Ma, Z.S.; Zhou, Y.C.; Long, S.G.; Lu, C.S. An inverse approach for extracting elastic-plastic properties of thin films from small scale sharp indentation. J. Mater. Sci. Technol. 2012, 28, 626–635. [Google Scholar] [CrossRef]
  14. Jamil, M.; Khan, A.M.; Hegab, H.; Sarfraz, S.; Sharma, N.; Mia, M.; Gupta, M.K.; Zhao, G.L.; Moustabchir, H.; Pruncu, C.I. Internal cracks and non-metallic inclusions as root causes of casting failure in sugar mill roller shafts. Materials 2019, 12, 2474. [Google Scholar] [CrossRef] [PubMed] [Green Version]
  15. Nguyen, N.V.; Kim, J.J.; Kim, S.E. Methodology to extract constitutive equation at a strain rate level from indentation curves. Int. J. Mech. Sci. 2019, 152, 363–377. [Google Scholar] [CrossRef]
  16. Jia, Y.F.; Cui, Y.Y.; Xuan, F.Z.; Yang, F. Comparison between single loading-unloading indentation and continuous stiffness indentation. RSC. Adv. 2017, 7, 35655–35665. [Google Scholar] [CrossRef] [Green Version]
  17. Bucaille, J.L.; Stauss, S.; Felder, E.; Michler, J. Determination of plastic properties of metals by instrumented indentation using different sharp indenters. Acta Mater. 2003, 51, 1663–1678. [Google Scholar] [CrossRef]
  18. Li, X.D.; Bhushan, B. A review of nanoindentation continuous stiffness measurement technique and its applications. Mater. Charact. 2002, 48, 11–36. [Google Scholar] [CrossRef]
  19. Wang, W.; Liu, H.J.; Zhu, C.C.; Wei, P.T.; Tang, J.Y. Effects of microstructure on rolling contact fatigue of a wind turbine gear based on crystal plasticity modeling. Int. J. Fatigue 2019, 120, 73–86. [Google Scholar] [CrossRef]
  20. Liu, H.J.; Wang, W.; Zhu, C.C.; Jiang, C.X.; Wu, W.; Parker, R.G. A microstructure sensitive contact fatigue model of a carburized gear. Wear 2019, 436, 203035. [Google Scholar] [CrossRef]
  21. Busby, J.T.; Hash, M.C.; Was, G.S. The relationship between hardness and yield stress in irradiated austenitic and ferritic steels. J. Nucl. Mater. 2005, 336, 267–278. [Google Scholar] [CrossRef]
  22. Tiryakioğlu, M. On the relationship between Vickers hardness and yield stress in Al-Zn-Mg-Cu Alloys. Mater. Sci. Eng. A 2015, 633, 17–19. [Google Scholar] [CrossRef]
Figure 1. Methodology of the test process.
Metals 10 00125 g001
Figure 2. Load–depth curves under three different strain rates of 0.03, 0.1, and 0.3 s−1.
Metals 10 00125 g002
Figure 3. Hardness vs. indention depth for the three strain rates of 0.03, 0.1 and 0.3 s−1.
Metals 10 00125 g003
Figure 4. Elastic modulus vs. the depth for the three strain rates of 0.03, 0.1, and 0.3 s−1.
Metals 10 00125 g004
Figure 5. The morphologies and profiles at the height-horizontal section of indentation under three strain rates, (a) 0.03 s−1; (b) 0.1 s−1; (c) 0.3 s−1; (d) the statistics of the maximum pile–up height and the final depth.
Metals 10 00125 g005
Figure 6. The contact stiffness vs. depth curves under three strain rates: (a) 0.03 s−1; (b) 0.1 s−1; (c) 0.3 s−1; (d) the maximum depth of the straight-line segment in contact with the stiffness-–depth curves.
Metals 10 00125 g006
Figure 7. The fitting and analysis of the hardness measurement results: (a) ( H H 0 ) 2 versus h−1 of strain rate 0.03 s−1 fitted by the Nix–Gao model, the Ruiz-Moreno model, and the modified Ruiz-Moreno model; (b) a comparison of the true hardness of the three strain rates; (c) a comparison of the RSS for the Ruiz-Moreno model and the modified Ruiz-Moreno model under different cut-off values of h−1; (d) a comparison of the plateau value for the Ruiz-Moreno model and the modified Ruiz-Moreno model under different cut-off values of h−1.
Metals 10 00125 g007
Figure 8. Variation of the yield strength and hardening exponent with depth, Ma model for three strain rates, (a) 0.03 s−1; (b) 0.1 s−1; (c) 0. 3 s−1; (d) the hardening exponent under three strain rates.
Metals 10 00125 g008
Table 1. Chemical compositions of 18CrNiMo7-6 (wt.%).
ElementCSiMnPSCrNiMoAlCuFe
Chemical compositions0.1880.2040.5100.0070.0021.6581.6750.2990.0140.149Bal.

