Article

Inclusive Digital Practices in Pre-Service Teacher Training in Chile and Portugal: Design and Validation of a Scale to Assess the Social Determinants of the Digital Divide


by
Juan Alejandro Henríquez
1,2,3,*,
Eva Olmedo-Moreno
1 and
Jorge Expósito-López
1
1
Department of Methods of Research and Diagnosis in Education, University of Granada, 18071 Granada, Spain
2
Facultad de Ciencias de la Educación, Universidad Internacional de Valencia, 46002 Valencia, Spain
3
Facultad de Educación, Universidad de Las Américas, Santiago 8370040, Chile
*
Author to whom correspondence should be addressed.
Societies 2026, 16(1), 28; https://doi.org/10.3390/soc16010028
Submission received: 16 October 2025 / Revised: 5 January 2026 / Accepted: 11 January 2026 / Published: 14 January 2026

Abstract

This study examines the social determinants of the digital divide in pre-service teacher education through the design and validation of the Digital Hospitality Scale (DSBD-HD-FID). The instrument was developed to diagnose social inequalities across six key dimensions: socioeconomic status, geographic location, gender, age, disability status, and interculturality. These dimensions are understood as structural factors shaping access to, use of, and participation in digital environments within teacher education. The research followed a non-experimental, quantitative, and cross-sectional design, including content validation through expert judgment and statistical analysis based on a pilot sample of education students from Chile and Portugal. An exploratory factor analysis was conducted, and internal consistency was assessed using Cronbach’s alpha coefficient. The results confirm strong content and construct validity, as well as high reliability (α = 0.93). Empirical findings indicate that socioeconomic status and geographic location significantly condition access to connectivity and digital literacy, while gender differences emerge mainly in recreational uses and frequency of digital training. Beyond these results, the study highlights the relevance of addressing digital inequalities in teacher education through inclusive and equity-oriented training policies. The findings support the integration of digital hospitality, human rights education, and the Sustainable Development Goals into initial teacher training curricula as measurable and evaluable dimensions, providing an evidence-based framework to inform future teacher education policies aimed at reducing digital divides and promoting social cohesion.

1. Introduction

We know that the concept of the digital divide has been studied for decades and there is significant consensus that it refers to inequalities in, at least, access to, use of, and knowledge of digital technologies in general and information and communication technologies (ICT) in particular [1,2,3,4,5,6,7,8,9,10,11,12,13]. However, it was initially understood as the division or distance between those who have access to a certain digital infrastructure and those who do not. Today, it increasingly encompasses differences in the type of use, in the digital skills required for such use, and in the benefits obtained from it.
These technological gaps can amplify existing social inequalities, directly affecting people’s social, educational, and economic capital. For this reason, the digital divide has become highly important in the education sector, as it threatens to perpetuate inequalities in access to quality education [9]. Even at the level of international organizations, it is understood that it hinders the achievement of goals associated with sustainable development goals (SDGs) and human rights education standards [14,15,16,17]. Therefore, adequate digital, media, and information literacy remains essential [18,19,20], especially with regard to the development and strengthening of teachers’ digital skills [21], in the case of preservice teacher education or in-service training.
The United Nations (UN) has emphasized that ICTs, when used properly, can contribute to reducing inequalities, as they tend to facilitate equitable access to information, education, and participation for historically disadvantaged or marginalized groups, thereby reducing opportunity gaps. Five years after the start of the COVID-19 pandemic, these disparities have become particularly evident, due to the sudden migration to remote teaching modalities, with a large number of students and teachers lacking adequate technological resources [22]. Hence, it is necessary to focus attention on the frequency of use, the type of digital tools, and the corresponding adaptations to the virtualization of teaching-learning processes [23].
To cite one example, in Colombia, only 45.7% of education students had access to a personal computer or tablet, and 39.3% had reliable internet access during the health emergency. This access gap significantly limited the continuity of education in digital environments, confirming that, beyond infrastructure, there are clear differences in use and results associated with socioeconomic and contextual factors [24].
As we mentioned earlier, the three basic levels for understanding the digital divide (access, use, and knowledge) have had a broad impact on university education, especially in terms of academic performance, timely access to a first job, and participation in digital citizenship. Initially, public policies focused on closing the digital divide through investments in infrastructure and the distribution of equipment (computers and digital whiteboards, for example). However, it soon became clear that access alone did not guarantee real digital inclusion, since many people—even with devices and Internet access—were unable to use these tools in a meaningful way to improve their learning or quality of life. In this regard, ref. [3] proposed reformulating the concept of the digital divide to also encompass deficiencies in usage and utilization skills, emphasizing that digital exclusion has both material and skill-related dimensions. This explains the notion of meaningful use of the internet, and today of artificial intelligence, which refers to the need to equip people with skills, competencies, and ethical and socio-technical awareness so that technology can provide them with real and differentiated value [25]. We can see this today with the significant use of artificial intelligence in education, where most students have access to this technology, but only a portion use it frequently, which indicates a gap between access and use, whether due to lack of training or motivation [26].
Therefore, the digital divide is not homogeneous, but intersects with various social determinants that condition access to and use of technology. One of the most obvious factors is socioeconomic status. People from economically disadvantaged backgrounds tend to have less access to up-to-date devices, high-speed connections, and opportunities for training in digital skills [24]. This economic factor is also reflected in preservice teacher education. Ref. [27] documented that, in South Africa, education students from low-income backgrounds faced great difficulties in transitioning to online education during the pandemic due to a lack of sufficient technological resources. A large number of these future teachers had to continue their training in rural contexts, which leads to reflection on geographical location as a second social determinant of the digital divide.
Thus, digital exclusion tends to be greater in rural areas or areas far from large cities, where technological infrastructure may be limited and Internet services are less accessible or of lower quality. Ref. [28], in Turkey, analyzed the experiences of university students in remote learning and found interesting nuances around the rural–urban axis. Contrary to expectations, rural students with stable connectivity reported feeling more confident and autonomous in their online learning than their peers in urban environments, who experienced more stress and socioeconomic difficulties during lockdown. However, the overall situation remains disadvantageous for many rural areas. Ref. [29] emphasize that the lack of digital literacy among secondary school students and teachers, coupled with technological and economic deficiencies and poor Internet coverage in families, significantly restricts educational opportunities in this context. This affects and differentiates both countries, North–South, and within each country, hence the importance of ensuring differentiated and contextualized strategies to achieve an adequate reduction of the digital divide [30].
Other important social determinants are age and gender. With regard to the generational difference, we must demystify what once helped to understand and position an interesting idea, such as the use of concepts such as digital natives and immigrants [31,32]. As ref. [33] point out, this differentiation has had a negative impact on education, leading to a neglect of digital literacy among students compared to teachers. The generation gap exists, but that does not mean that children, adolescents, and young people do not need training in digital skills.
Ref. [34] investigated the attitudes of trainee early childhood teachers towards the integration of computers in the classroom and the reduction in digital divides among their students. Her findings showed that teacher training students had very positive attitudes towards educational technology and were more willing to incorporate it than teachers from previous generations. However, it also revealed that teacher trainees continue to feel challenged and uncertain when faced with digital environments, especially when it comes to reducing socio-familial gaps among their students. Therefore, age alone does not eliminate the usage gap; digital competence in teaching requires intentional development during preservice teacher education. In this vein, ref. [35] point out that including teacher digital competence as part of professional development from the training stage contributes directly to minimizing the digital divide in the education system. Their study with secondary school teachers in training in Spain found that, although they highly value their level of digital competence, the actual application of these skills in educational practice is still limited.
On the other hand, the gender digital divide is a socially constructed dimension that affects both access and technological trajectories of teachers and students. Historically, women have had a lower presence in ICT areas and have faced stereotypes that may have limited their confidence and opportunities to develop advanced digital skills [36]. Gender gaps have also been identified in professional digital competence. Ref. [37] developed and validated an instrument to measure this gap, finding subtle but significant differences in certain areas of digital competence in favor of male teachers. Although female teachers reported feeling digitally confident and motivated, as indicated by [38], structural obstacles persist that may hinder their full professional technological development. This is also true in the education and teaching sector. The authors, comparing teachers in Spain and Costa Rica, concluded that the globalization of ICT has positioned teachers as a cornerstone in the development of digital citizenship skills, with their role being essential in reducing digital divides.
This perspective of inclusion also encompasses other groups that are often marginalized in the digital world, such as people with disabilities and culturally diverse communities, whether they belong to indigenous or native peoples, ethnic communities, or migrants. People with disabilities face barriers to web accessibility, device adaptability, and universal design for learning (UDL), which constitutes a fifth social determinant of the digital divide. Ensuring digital accessibility is fundamental for this group, guaranteeing their right to inclusive education mediated by ICT [25]. Similarly, the intercultural dimension of the digital divide deserves attention, where indigenous communities, remote rural communities, or linguistic minorities in contexts of high migration may experience digital exclusion if the available technology does not take into account their language, customs, or specific needs.
Thus, reducing the digital divide in preservice teacher education requires a comprehensive approach that considers the multiple social determinants involved: economic factors, geographic location, age, gender, disability status, and interculturality. Each of these factors can influence how future teachers access and use technology.
In view of the above, it is important to have valid and reliable instruments to measure the digital divide and its respective social determinants. And, although there are instruments to measure access to technologies, use from the perspective of digital skills, and knowledge from self-perception, among others, it is essential to expand the measurement to include dimensions that link the digital divide with inequality, the SDGs, and human rights education standards.
Although numerous instruments have been developed to assess aspects of the digital divide, most existing scales tend to focus on specific and partial dimensions, such as access to digital technologies, self-perceived digital competence, or technical digital skills. Instruments grounded in digital literacy and digital competence frameworks have made significant contributions to understanding users’ abilities to operate technologies and participate in digital environments. However, these tools rarely integrate social determinants such as socioeconomic conditions, geographic context, gender, disability, or interculturality in a systematic and unified manner.
Likewise, instruments addressing inclusion or equity in digital education often emphasize accessibility or pedagogical adaptations, but they do not usually incorporate a broader ethical and socio-political perspective linked to human rights education or the Sustainable Development Goals. In contrast, the Digital Hospitality Scale (DSBD-HD-FID) is intentionally designed to articulate these dimensions within a single measurement model. Its structure combines traditional indicators of access and use with constructs related to digital hospitality, social inclusion, and global educational commitments, allowing for a more holistic diagnosis of digital inequalities in pre-service teacher education. This integrated approach differentiates the proposed instrument from existing models and supports its relevance as a complementary tool for research and policy-oriented analysis.
Ref. [39] describe the construction and validation of an instrument to diagnose the digital divide in vulnerable populations. Ref. [37], for their part, emphasize the construction of specific instruments to measure gender digital divides in teacher digital competence, stressing that only with targeted tools can these disparities be made visible. Additionally, ref. [38] point out the importance of adapting the assessment of digital competence to diverse educational environments.
However, regardless of the theory on which the researcher bases the construction of the instrument, the process, as indicated by [40], must follow theoretical and metric principles that maximize the validity of the inferences made from the instrument used. We know that the two psychometric characteristics that must be required of a measurement instrument are reliability and validity, which are essential for making relevant and appropriate inferences from the data obtained for decision-making.
The accuracy of the test score, that is, the variability around its true score, is reflected in the standard error of measurement, for which a standardized consistency index (called the reliability coefficient) has been proposed, ranging from 0 to 1, which is nothing more than an overall indicator of error. Therefore, reliability can be considered as temporal stability and as internal consistency, using different methods depending on which is intended. In this work, we will opt for reliability as internal consistency using the method based on item covariance. The mathematical procedure followed is Cronbach’s Alpha.
Validity, on the other hand, is a guarantee of the quality of a test. It refers to the degree to which empirical evidence and theory support the interpretation of the scores on a specific test.
Although there are different types of validity, in this study we have focused on content and construct validity. The former refers, in the words of [41], to the sample adequacy of the items in a test, as a sample of a broader domain of items representative of the construct or behavior. This is obtained by consulting groups of experts. They must accurately assess whether or not the items presented to the subject correspond to the general objective to be measured.
Construct validity, on the other hand, relates to the analysis of the internal structure of the test, which allows us to reflect on the dimensions of the construct. The mathematical procedure for obtaining it is factor analysis, from which we can determine the degree to which the empirical evidence and the dimensional structure coincide with the structure theoretically postulated in the test.
In addition to these psychometric characteristics, such as others more related to external evidence such as criterion validity, convergent validity, and discriminant validity, great objectivity is necessary with regard to referring to the degree to which the results are independent of the researcher or evaluator.
The three characteristics that objective tests must meet in this regard are:
  • The people administering the test must have a good relationship with the test takers and be familiar with the test to be used.
  • Responses must be recorded and processed without being influenced by the evaluator’s criteria.
  • The test must be administered under optimal conditions, taking care to avoid physical factors that could influence and alter the results.
All of these factors have been taken into account in the work presented, seeking the ideal conditions for implementation and controlling the conditions of application at all times, both for the instrument and for the evaluator [42].
To this end, our main objective has been to design and establish psychometric properties that guarantee reliability and validity, in order to extrapolate the results to the reference population.
This exploratory factor analysis (EFA) is a fundamental statistical technique for identifying and validating the underlying structure of the items in the designed scale, allowing us to reduce the complexity of the data and group the observed variables into latent factors that represent the theoretical dimensions of the construct under investigation. In the context of our study to analyze the social determinants of the digital divide in preservice teacher education, EFA facilitates the identification of underlying patterns, the removal of redundant or unrepresentative items, and the confirmation of the internal consistency of the scale, ensuring its validity and reliability as a measurement instrument. In addition, it provides a solid basis for further analysis and interprets the interrelationships between the social factors that affect the digital divide in the context of preservice teacher education, strengthening the methodological rigor of this research.
In this study, digital hospitality is defined as the set of conditions, practices, and institutional orientations that facilitate equitable, inclusive, and meaningful participation in digital environments. It refers not only to access to digital technologies, but also to the ways in which digital spaces are designed, mediated, and governed to recognize social diversity, reduce structural inequalities, and support the educational, social, and professional development of individuals. From this perspective, digital hospitality integrates technological, sociocultural, ethical, and educational dimensions, emphasizing openness, accessibility, and social justice as guiding principles for digital participation in pre-service teacher education.
In response to these needs, the present study set out to design and validate the Digital Hospitality Scale to analyze the social determinants of the digital divide in preservice teacher education DSBD-HD-FID. This work addresses the design of the scale, its validation, and analyzes some results that emerged from the Chile-Portugal pilot study.
Thus, our research question is as follows: How can the social determinants of the digital divide in initial teacher training be identified and measured through a framework that integrates digital hospitality, human rights education, and the Sustainable Development Goals?
Our main objective is to analyze the social determinants of the digital divide in preservice teacher education by designing a scale-type instrument to measure the status quo in this target group with regard to these inequalities.
As specific objectives, we consider it essential to be able to identify the most relevant social dimensions of the digital divide in initial teacher training. This is fundamental in order to achieve a cross-sectional analysis of the factors that influence the digital exclusion that still exists. In addition, we have set out to design a scale and ensure its validation by expert judgment and statistical analysis, in order to have a reliable instrument when measuring this divide.
Another objective was to apply the scale in a pilot study with students from Chile and Portugal and analyze its psychometric properties.
Finally, analyzing the relationship between the sociodemographic variables of the participants and the validated dimensions of the scale became a final relevant objective for our study.
In line with these objectives, six initial hypotheses were proposed, as detailed in the third point of the Section 2.
However, it is worth mentioning the lack of specific literature on these topics in an articulated manner, whether in relation to the digital divide in preservice teacher education or in relation to human rights education and sustainable development goals.

2. Materials and Methods

This section provides a detailed review of everything related to the study design, the sample, the variables associated with their respective initial hypotheses, the instrument design, and the statistical analysis of the data obtained in the Chile-Portugal Pilot Study. For more details, review the Supplementary Material.
Furthermore, it should be noted that this research was approved by the ethics committees of the University of Granada, under registration number “3002/CEIH/2022”–“5352/CEIH/2025” and the Central University of Chile, through the University of the Americas in the same country, under resolution “Project 152/2022”.

2.1. Study Design

This study adopts a non-experimental quantitative and cross-sectional design, aimed at the development and validation of a psychometric instrument. The main objective is to design, validate, and apply in a pilot phase a scale that allows for the analysis of the social determinants of the digital divide in preservice teacher education. This design is suitable for research that aims to obtain indicators of validity and reliability in the preliminary stages of instrument construction [43]. This type of design is based on the points established for the construction and psychometric analysis of instruments [40], which contemplate three phases (Figure 1).

2.2. Sample

The sample consisted of 185 students aged between 18 and 54 from the education faculties of a Chilean university and two Portuguese higher education institutions. In terms of age, 51.4% (n = 95) were between 18 and 24 years old, 30.8% (n = 57) were between 25 and 34 years old, and the remaining 17.8% were 35 years old or older. The sample was composed of a majority of women, representing 86.5% (n = 160), and 13% (n = 24) men, with 69.2% (n = 129) of Chilean nationality and 28.6% (n = 53) of Portuguese nationality. The selection was made using non-probabilistic convenience sampling, based on the accessibility and availability of the participating institutions. The total population invited to participate in this pilot study was 802 students, meaning that the sample corresponded to 23% of the indicated population.
It should be noted that the empirical study was conducted during the year 2023.
Although this presents some difficulties in terms of generalization, it can be counteracted by a differentiated analysis of the six initial hypotheses, which are directly related to the objectives and social determinants of the digital divide.

2.3. Variables and Initial Hypotheses

The main variables correspond to the social determinants of the digital divide proposed by [44]. Table 1 presents them together with their respective hypotheses, which are closely related to the general objective of the research and the first of the specific objectives.

2.4. Instrument Design and Data Collection

The instrument construction process was carried out in four phases:

2.4.1. Phase 1 Theoretical Review and Definition of the Construct

A review of the literature on the digital divide in education was conducted, particularly in higher education and specifically in relation to preservice teacher education. In addition, special attention was paid to literature referring to the social determinants of this divide. The purpose of this was to define the construct and establish the dimensions that would guide the development of items. Although the results of this information analysis are detailed in more depth in the introduction, it is important to note that, in addition to scientific and academic articles, various official reports on the issue from international organizations such as UNESCO, OEI, and IDB, among others, were also reviewed.

2.4.2. Phase 2 Initial Development of the Questionnaire

Based on the above classification, five-point Likert-scale items were developed, designed to capture students’ perceptions and experiences in relation to the digital divide (access, use, and training or appropriation). The initial version of the questionnaire included 29 items distributed across seven dimensions, in addition to an initial block for collecting sociodemographic data (age, gender, place of residence, etc.) that reflected the social determinants indicated above.

2.4.3. Phase 3 Content Validation Through Expert Judgment

The questionnaire was submitted for evaluation to a panel of 20 expert judges in educational technology and instrument design from 11 Ibero-American countries, in order to reflect the greatest possible cultural diversity. These experts assessed each item in terms of clarity, relevance, and suitability, using a five-point Likert scale. Qualitative observations were analyzed using Atlas.ti 22.06 software, coding and classifying frequent comments.
In addition, Kendall’s W coefficient was calculated to estimate the level of agreement among judges, following the critical values proposed by [45]. As a criterion, items with W ≥ 0.150 and significance ≤ 0.05 were prioritized.
In this phase, linguistic and conceptual corrections were made, eliminating ambiguous or redundant items.

2.4.4. Phase 4 Pilot Study and Data Collection

Subsequently, a pilot study was conducted with preservice teacher education students in Chile and Portugal. The questionnaire was administered online using the Google Forms platform, after being translated and linguistically adapted into Portuguese and reviewed by key informants at each institution. Incomplete or inconsistent questionnaires were discarded.
The purpose of this pilot study was to obtain data for a preliminary estimate of the construct validity and internal reliability of the instrument, which will be applied during 2023.

2.5. Data Analysis

SPSS (version 24) and Atlas.ti (version 22.06) software were used for data analysis.
First, a qualitative analysis was performed on the observations made by the expert judges during content validation. For this purpose, Atlas.ti was used to code the comments into categories related to the criteria of clarity, relevance, and suitability. This procedure allowed for the identification of patterns, coincidences, and recurring recommendations that guided the modification or elimination of certain items from the questionnaire.
Subsequently, quantitative analysis was performed using SPSS. First, descriptive statistics (means, deviations, asymmetry, kurtosis, frequencies, and percentages) were calculated to examine the characteristics of the sample and their responses to the items.
To assess content validity, Kendall’s W coefficient was applied to estimate the level of agreement among judges on the criteria of clarity, relevance, and suitability. Items with W values greater than 0.150 and significance equal to or less than 0.05 were considered acceptable, in accordance with the critical points proposed by [45].
Regarding construct validity, an Exploratory Factor Analysis (EFA) was performed using the principal component method with Equamax rotation. Previously, the adequacy of the sample was verified using the KMO measure and Bartlett’s sphericity test, ensuring that the correlation matrix was appropriate for factorization. The criteria for factor extraction were eigenvalues greater than 1, analysis of the sedimentation graph, and factor loadings equal to or greater than 0.30, following the recommendations of [46].
The internal reliability of the instrument was estimated using Cronbach’s alpha coefficient, calculating the overall value. In addition, the effect of removing each item on the overall coefficient was examined in order to detect possible elements that reduced internal consistency. A value of α ≥ 0.70 was adopted as the acceptability criterion, as indicated by [47].
Finally, to test the hypotheses regarding the social determinants of the digital divide, independence tests were applied using the likelihood ratio, establishing a significance level of 5% (p ≤ 0.05).

3. Results

In this section, we will present the results of the different validation processes for the scale. First, we will analyze the content validity through expert judgment, then we will present the construct validity through Exploratory Factor Analysis, then we will estimate the internal consistency of the instrument by calculating Cronbach’s Alpha coefficient, and we will conclude with a hypothesis test using the Likelihood Ratio technique.

3.1. Content Validity (Expert Judgment)

To evaluate content validity, the questionnaire was reviewed by a panel of 20 expert judges [48] in educational technology and instrument design from 11 Ibero-American countries. Each item was assessed on three criteria: clarity, relevance, and suitability, using a five-point Likert scale with a minimum value of 1 and a maximum value of 5 (where 1 = Very weak, 2 = Weak, 3 = Sufficient, 4 = Strong, and 5 = Very strong). All items were rated very positively in terms of clarity, suitability, and relevance, with average scores above 4 out of 5 in most cases. This reflects that, in general, the judges considered the items to be adequate and understandable for measuring the construct.
As part of the quantitative analysis, Kendall’s W coefficient was calculated to estimate the agreement between judges. According to the critical values established by [45], items with W ≥ 0.150 and asymptotic significance p ≤ 0.05 were considered acceptable.
Regarding the degree of agreement, Kendall’s W coefficient showed low levels of agreement in most items, indicating some dispersion in the judges’ individual and overall assessments. However, statistically significant agreement (p < 0.05) was obtained in eight items: i5, i6, i9, i20, i21, i22, i25, and i29. In these cases, the judges agreed more consistently in their assessments, reaching W coefficients between 0.150 and 0.300.
Overall, the results support the content validity of the instrument, as all items have high means in the three criteria evaluated and, although the degree of agreement is not uniform, the presence of items with significant agreement and the overall positive assessment allow us to conclude that the current version of the questionnaire is valid for application (Table 2).
However, given the cultural and linguistic diversity, wording adjustments were made to eight items to improve their clarity and suitability for the context of application. As a result, the final questionnaire consisted of 27 closed items and 2 open items, following the suggestions received.
The overall results of the assessment show a high level of acceptance of the items, as can be seen in Table 3, where ratings in the upper categories of the scale predominate.

3.2. Exploratory Factor Analysis

To evaluate the construct validity of the questionnaire, an Exploratory Factor Analysis (EFA) was applied using the principal component extraction method and Equamax orthogonal rotation with Kaiser normalization. This analysis was performed on the 87 sub-items that make up the instrument.
Before factorization, the suitability of the data was checked using the KMO sample adequacy measure and Bartlett’s sphericity test. The KMO value obtained was 0.755, considered “meritorious” according to ref. [49], while Bartlett’s test was significant (χ2 = 12,245.920; gl = 3741; p < 0.001), confirming the relevance of the factor analysis.
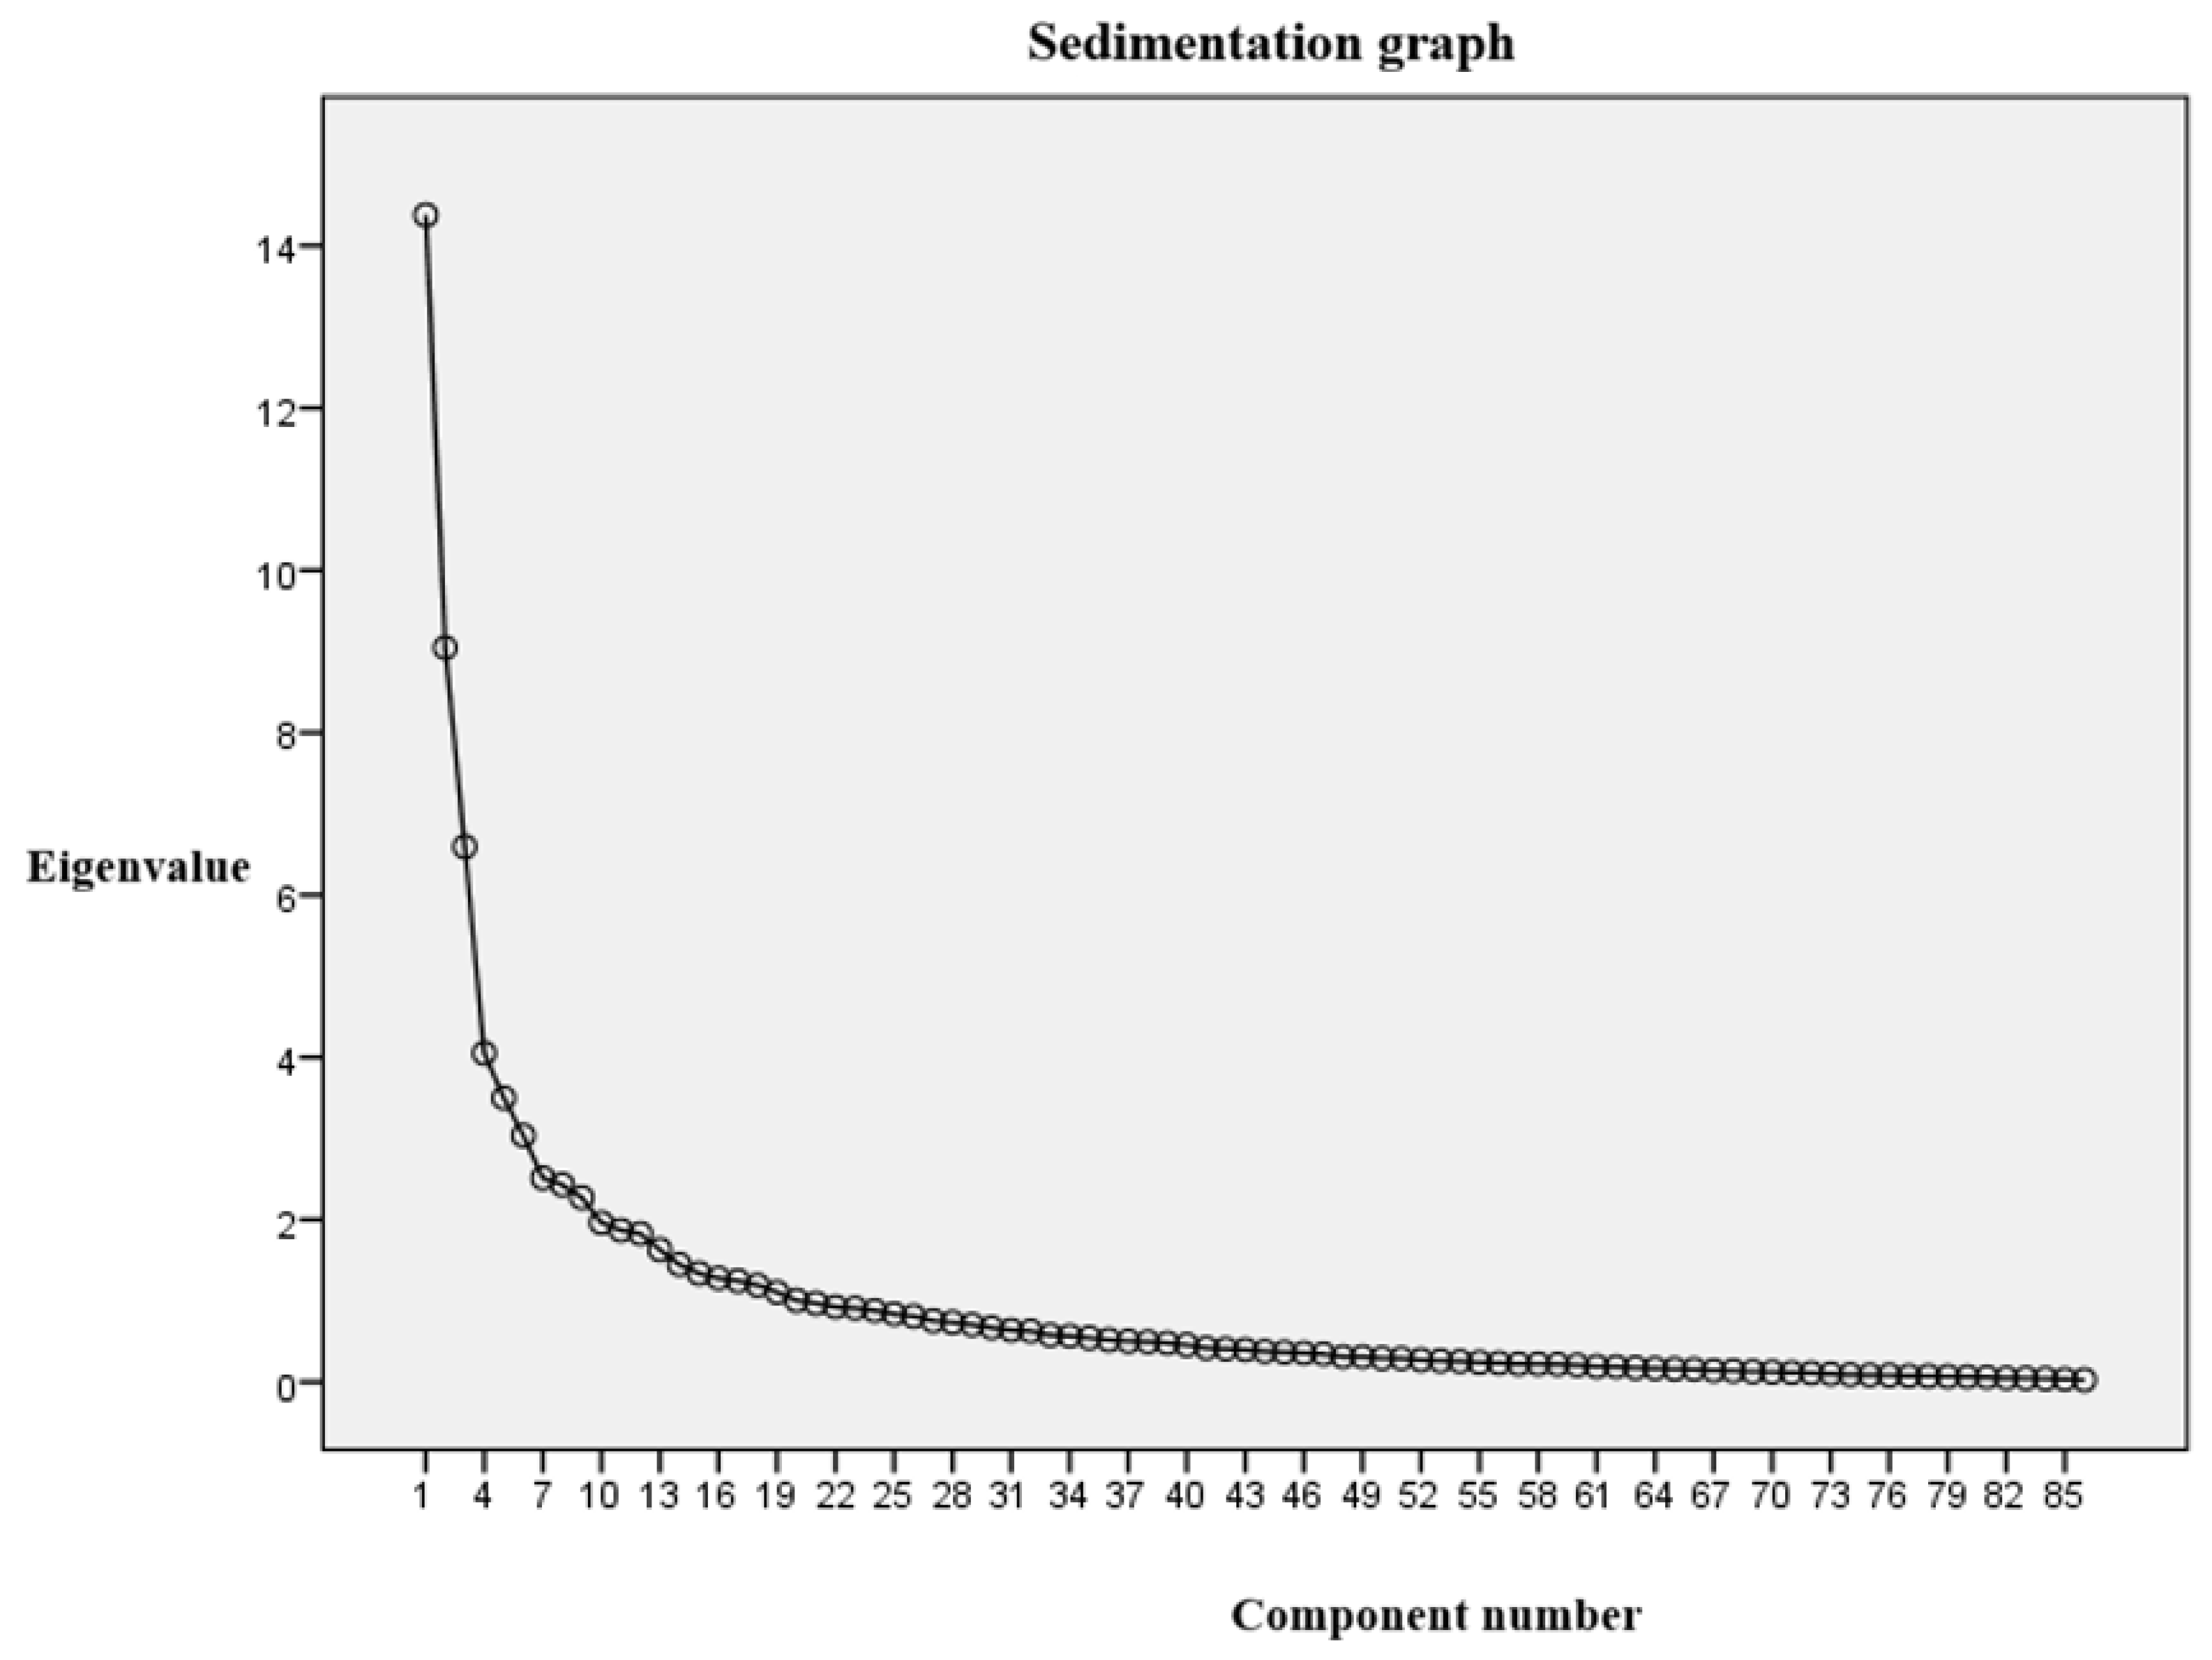
The EFA identified 20 components using the criterion of eigenvalues greater than 1, which together explain 74.04% of the total variance (Table 4). However, the sedimentation graph (Figure 2) showed an inflection point in the seventh component, a criterion that supports the retention of seven factors, which explain 50.09% of the cumulative variance before rotation. After applying Equamax rotation, the distribution of variance stabilized among the factors, reducing the initial concentration in the first components and improving interpretation.
Analysis of the rotated component matrix (see annexes) identified seven main components, which largely coincide with the conceptual dimensions proposed for the instrument. Items were assigned to each component based on factor loadings ≥ 0.30.

3.2.1. Component 1 (16.82% of Variance Explained): Human Rights Education and SDGs

Includes items P22.1, P22.2, P22.3, P22.4, P22.5, P22.6, and P22.7, all with loadings greater than 0.68 (maximum in P22.2 = 0.837). These items address content on human rights training and links to the Sustainable Development Goals (SDGs).

3.2.2. Component 2 (10.43% of Variance Explained): Digital Skills Training

This component groups items P20.1, P20.2, P20.3, P20.4, P20.5, and P20.6, with loadings between 0.787 and 0.853. They assess aspects related to the preparation and updating of students’ digital skills for teaching.

3.2.3. Component 3 (7.72% of Variance Explained): Sustainable Development Goals

This includes items P24.1, P24.2, P24.3, P24.4, P24.5, and P24.6, which have loadings between 0.651 and 0.806. This component refers to the degree of use of virtual environments and digital resources in academic practice.

3.2.4. Component 4 (4.75% of Variance Explained): Digital Hospitality

Mainly formed by items P27.1, P27.2, P27.3, P27.4, P27.5, P27.6, P27.7, and P27.8, with notable loadings in P27.5 (0.802) and P27.4 (0.784). It relates to the perception of inclusion and openness in digital contexts.

3.2.5. Component 5 (4.02% of Variance Explained): Digital Citizenship

Composed of items P19.1, P19.2, P19.3, P19.4, P19.5, and P19.6, with loadings ranging from 0.465 to 0.859. Assesses knowledge and practice of ethical and safe standards in digital environments.

3.2.6. Component 6 (3.45% of Variance Explained): Variables Related to Advanced Digital Skills and Context

Includes items such as P26.1, P26.2, P26.3, P26.4, P26.5, P26.6, P26.7, and P26.8, with loadings between 0.490 and 0.747. These variables are linked to the concept of hospitality and technological mediation in educational settings.

3.2.7. Component 7 (2.91% of Variance Explained): Acceptance of SDGs in Educational Policies

This assesses the degree of agreement with the integration of SDGs into educational policies and includes items 25.1 to 25.5, with loadings ranging from 0.455 to 0.684.

3.3. Reliability

To estimate the internal consistency of the instrument, Cronbach’s alpha coefficient was calculated considering the 87 sub-items that make up the scale. The overall result was α = 0.931 (standardized α = 0.936), which reflects a good level of reliability, according to the criteria of [47], who establish values above 0.70 as acceptable for applied studies (Table 5).
The corrected item-total analysis showed that the elimination of any of the items does not significantly improve the overall Alpha (see annexes), since the values observed in the column “Alpha if the item is eliminated” ranged from 0.929 to 0.932. This confirms that all items contribute positively to the internal homogeneity of the instrument.
Regarding the distribution of scores, the means per item ranged from 1.64 (P19.3) to 4.67 (P13.4), with standard deviations between 0.70 and 1.73. Some cases of negative asymmetry (e.g., P13.4, P25.5, and P27.6) and high kurtosis in items such as P13.4 (6.545) and P27.2 (8.694) were identified, indicating that the scores for these items are around the high values.
These results confirm that the instrument has high internal consistency, ensuring accuracy in measuring the social determinants of the digital divide in preservice teacher education.

3.4. Hypothesis Testing

3.4.1. By Family Income Range

A statistically significant association was found between family income range and computer connection (RV = 28.607; p = 0.027), indicating that the quality of the computer connection is influenced by socioeconomic status. Households with incomes below $200/€200 account for 62.1% of category 1, while at the highest levels (≥$2000/€2000), 66.7% fall into category 5, reflecting a marked digital divide.
The relationship between household income and tablet connection was statistically significant (RV = 27.873; p = 0.033), with a clear linear association (p < 0.001). As income increases, the presence in lower categories decreases and category 5 increases, reaching 83.3% in households with incomes above $2000/€2000. This shows that the quality of connectivity for tablets depends on socioeconomic status.
The consumption of streaming or music services showed a significant relationship (RV = 29.070; p = 0.023). Households with higher incomes show a higher frequency of use (66.7% in the “Always” category), compared to low levels, where intermediate categories predominate.
A significant relationship was found between family income and frequency of use of audiovisual editing applications (RV = 29.150; p = 0.023). People with low incomes concentrated their responses in intermediate categories (41.4% in category 3), while middle-income levels showed greater diversity and presence in high categories, indicating better conditions for the development of specific technological skills.

3.4.2. By Type of Locality

The likelihood ratio analysis showed a significant relationship between the type of locality and the frequency with which students receive training in gender issues (P22.1) (VR = 28.501; p = 0.005).
Urban areas account for the highest categories (4 and 5), with 59.2% and 77.8%, respectively. Semi-urban localities account for 37% in the highest category, while rural areas show the opposite pattern: 28.6% in the lowest category and only 4.8% in the highest.
Therefore, training in gender mainstreaming is uneven, with limited access in rural contexts.
A significant association was also found between place of residence and the frequency of training on the inclusion of people with disabilities (RV = 23.896; p = 0.021). Urban areas have high values in categories 4 and 5 (70.0% and 63.0%), followed by semi-urban areas (25.9% in category 5). In rural areas, low levels predominate: 19.0% in category 1 and only 9.5% in category 5.
The relationship between the type of locality and intercultural training was significant (RV = 32.455; p = 0.001). In urban environments, category 4 stands out with 88.9% and category 5 with 57.4%. Semi-urban areas show 40.7% in the highest category, although there is no presence in category 4. In rural areas, the percentages are concentrated in low categories (28.6% in categories 1 and 2).
Training on access to information and the internet as a right (P22.6) reached statistical significance (RV = 21.545; p = 0.043). Urban areas account for 80% and 63.3% in categories 4 and 5, respectively, while in rural areas only 9.5% reach the highest category and 19.0% are in the lowest category.
A significant association was found between location and environmental education (RV = 23.558; p = 0.023). Urban areas account for categories 4 and 5 (22.6% and 36.8%), while in semi-urban areas category 5 stands out with 40.7%. Rural areas show a higher percentage in lower categories (14.3% in category 1 and 33.3% in category 2).
Likewise, a significant association was found between the type of locality and training on SDG 4 (RV = 29.023; p = 0.004). Urban areas account for more than 56% in high categories (4 and 5), while semi-urban areas account for 44.4% in category 4 and none in category 5. Rural areas are distributed across intermediate categories.

3.4.3. By Gender

The likelihood ratio analysis showed statistically significant differences in two of the items evaluated:
P17.3. Frequency of online video game use (LR = 25.223; p = 0.001).
P19.5. Participation in sports or entertainment organizations through digital tools (RV = 17.351; p = 0.027).
Regarding the use of online video games (P17.3), the results show that males use them more frequently. Specifically, 45.8% of men fall into category 2 (occasional use), and 20.8% fall into category 5 (very frequent use), while females are concentrated in category 1 (58.2%), i.e., they never play online, with very low presence in high-frequency categories. This shows a clear difference in online video game consumption patterns between men and women.
On the other hand, in digital participation in sports or recreational organizations (P19.5), a different behavior is also observed. Among men, 25.0% fall into category 4 (frequent participation) and 12.5% into category 5 (always participating), while among women, category 1 predominates (48.1%), indicating a lack of participation in this area.
In relation to human rights, variable P23.5, which investigates the degree of agreement with the statement “Everyone should pay for their own internet connectivity,” showed significant differences (RV = 16.557; p = 0.035). Men were concentrated in the extreme categories, with 33.3% in category 1 (total disagreement) and another 33.3% in category 3, while only 4.2% were in category 4 (agreement). Women, on the other hand, showed a more homogeneous distribution, with 32.9% in category 2 and 17.1% in category 4, suggesting greater openness to individual co-responsibility.
Something similar occurred with variable P25.5, “All universities should commit to the SDGs in preservice teacher education,” which was also significant (RV = 16.640; p = 0.034). Although both genders showed a high level of consensus, with a predominance in category 5 (total agreement), women expressed a slightly higher level of commitment: 71.5% selected this category compared to 58.3% of men.
On the other hand, in the training dimension, variable P20.6, related to the frequency with which students receive training for the development of digital skills, showed significant differences (RV = 17.293; p = 0.027). While 50% of men were in category 3 (sometimes) and 29.2% in category 4, women were distributed more heavily in the higher categories, reaching 25.3% in category 5 (always).
No statistical significance was found with the rest of the sociodemographic variables.
Beyond their statistical significance, the results obtained in this study provide insight into the structural nature of the digital divide in pre-service teacher education. The observed associations between socioeconomic status and access to connectivity, as well as between geographic location and training opportunities in areas such as gender, disability, and interculturality, indicate that digital inequalities are not merely technical but deeply embedded in broader social conditions. Similarly, gender-related differences in patterns of digital use and training frequency reflect differentiated trajectories of digital participation that may reproduce existing social roles and expectations. From this perspective, the statistical findings underscore the need to interpret the digital divide as a multidimensional and socially determined phenomenon, with direct implications for the design of inclusive teacher education policies aimed at reducing inequality and promoting equitable digital participation.

4. Discussion

The Digital Hospitality Scale for the analysis of the social determinants of the digital divide in preservice teacher education (DSBD-HD-FID) demonstrated psychometric robustness in its pilot phase, with adequate levels of validity and reliability [40,47]. Factor analyses confirmed the relevance of the proposed theoretical dimensions, and internal consistency exceeded the criteria accepted in the literature, supporting its use as an initial diagnostic tool [46,49].
The results showed that the economic factor is one of the main determinants, directly affecting the quality of connectivity and access to digital resources [24]. Likewise, geographical location showed significant differences in the training received in areas such as gender, disability, and interculturality, to the detriment of students in rural areas [28,29]. Gender gaps were also found in the recreational use of technologies and in digital participation, although with nuances regarding the frequency of training received in digital skills, where women reported greater involvement [37].
Compared to other studies, the findings confirm previously documented trends. Research in pandemic contexts had already pointed to the relationship between socioeconomic status and access to devices or connectivity, as well as urban–rural differences in digital training [22,30]. The scale validated here, however, allows for the integration of dimensions that are often addressed in a fragmented manner, such as the intersection between gender, disability, and interculturality, into a single instrument, expanding the possibilities for analysis and aligning with recent proposals that call for a comprehensive understanding of the digital divide in education [34,36]. In this sense, the evidence obtained is consistent with studies that highlight the need to go beyond measuring access and basic use, moving toward an approach that considers the differential benefits derived from digital participation [3,25].
The added value of this research lies in the incorporation of digital hospitality as a measurable construct [44]. The scale not only diagnoses inequalities, but also introduces a novel perspective that articulates technological inclusion, human rights education, and sustainable development goals [14,15,16,17]. Digital hospitality offers a framework that transcends the deficit paradigm of the digital divide, placing the issue in the realm of openness, recognition of diversity, and social justice. This advance represents a significant contribution to the discipline, as it opens up the possibility of empirically evaluating an emerging concept and, at the same time, potentially applying it in education and training policies [50].
Finally, the results of this study suggest that reducing digital divides in preservice teacher education cannot be limited to technical or instrumental interventions. It involves rethinking digital skills training from a techno-pedagogical, ethical, and social framework [21,35], in which digital hospitality is presented as a guiding principle to ensure inclusion and equity. With a view to contributing to education and society in general, this proposal helps to highlight structural inequalities and promote strategies that recognize cultural, gender, generational, and functional diversity in the digital age [27,36]. The DSBD-HD-FID scale thus constitutes another step toward consolidating a more inclusive and teacher-transfer approach in research and educational practice, with the potential to guide curricular and public policy decisions.
From an applied perspective, digital hospitality can be operationalized in pre-service teacher education as a transversal framework guiding both curricular design and institutional decision-making. In practice, this involves embedding inclusive digital principles into teacher training programs, linking digital competence development with equity, accessibility, and recognition of social diversity. This may include structured training in inclusive digital practices, ethical and responsible technology use, accessibility for students with disabilities, and intercultural awareness in digital environments. At the policy and curricular levels, digital hospitality provides a coherent framework for aligning teacher education programs with human rights education and the Sustainable Development Goals, supporting the development of study plans that explicitly address structural digital inequalities. In this sense, the proposed scale functions as a diagnostic tool that can inform evidence-based curricular adjustments and policy-oriented decisions without prescribing fixed models, allowing adaptation to diverse educational contexts.
Although the present study does not aim to establish causal relationships, the significant associations identified between family income, gender, geographic location, and technological connectivity can be interpreted in light of broader structural conditions. Socioeconomic status appears to condition access to stable connectivity and digital resources, reflecting persistent inequalities in material and infrastructural opportunities. Geographic differences may be linked to territorial disparities in digital infrastructure and access to training opportunities, particularly affecting students in rural or non-urban contexts. Gender-related differences in patterns of digital use and connectivity may reflect socially mediated trajectories of digital participation shaped by cultural norms and differentiated expectations. Taken together, these findings suggest that the digital divide observed in pre-service teacher education is embedded in wider social structures, reinforcing the need for inclusive and context-sensitive approaches in teacher training and educational policy.

5. Conclusions

The research question for this study addressed how to identify and measure the social determinants of the digital divide in initial teacher training through a framework that integrates digital hospitality, human rights education, and the Sustainable Development Goals. The construction and validation of the DSBD-HD-FID scale allowed these principles to be operationalized in an empirical instrument capable of revealing social inequalities that affect the digital exclusion of students in teacher training.
The results of the pilot study in Chile and Portugal showed that the digital divide in this context cannot be understood solely in terms of access to devices or connectivity, but rather responds to multiple social and technology use factors, even more so with the emergence of artificial intelligence in recent years. Digital hospitality is a key concept for analyzing how digital literacy is achieved from a perspective of social justice, participation, equity, and critical thinking.
Despite its value in terms of its holistic view, the study has limitations. The application of the scale in only two countries, although it is a pilot study, and its cross-sectional design restrict the generalization of the findings, so we cannot speak of causality. In addition, the lack of intersectional analysis limits our understanding of how variables such as gender, disability, or linguistic diversity are intertwined in shaping the digital divide.
Future research should expand the use of the scale to diverse sociocultural contexts, incorporate longitudinal designs, and deepen the analysis of the ethical dimensions of digital hospitality.
In summary, the study demonstrates that measuring the digital divide in initial teacher training requires a critical and comprehensive approach that not only quantifies access but also evaluates the conditions for meaningful and equitable participation in virtual learning environments.

Supplementary Materials

The following supporting information can be downloaded at: https://www.mdpi.com/article/10.3390/soc16010028/s1.

Author Contributions

Conceptualization, J.A.H.; methodology, E.O.-M., J.E.-L. and J.A.H.; software, J.E.-L.; validation, J.A.H., E.O.-M., and J.E.-L.; formal analysis, J.A.H.; investigation, J.A.H., E.O.-M., and J.E.-L.; re-sources, J.A.H., E.O.-M., and J.E.-L.; data curation, J.A.H. and J.E.-L.; writing—original draft preparation, J.A.H.; writing—review and editing, J.A.H., E.O.-M., and J.E.-L.; visualization, J.A.H. and J.E.-L.; supervision, J.A.H., E.O.-M., and J.E.-L.; project administration, J.A.H., E.O.-M., and J.E.-L.; funding acquisition, J.A.H., E.O.-M., and J.E.-L. All authors have read and agreed to the published version of the manuscript.

Funding

This research was funded by Agencia Nacional de Investigación y Desarrollo. Subdirección de Capital Humano. Ministerio de Ciencia, Tecnología e Innovación, Gobierno de Chile, Beca de estudios de Doctorado en el Extranjero/2020-72210558 and The APC was funded by Grant PID2024-161044OB-I00 of project title: “Educational and work engagement through the development of emotional wellbeing and sense of belonging for social inclusion and community integration of young migrants (MENA and refugees) ELEVATE”, funded by MICIU/AEI/10.13039/501100011033 and by ERDF, EU.

Institutional Review Board Statement

The study was conducted in accordance with the Declaration of Helsinki and approved by the Ethics Committee of University of Granada, codes: 3002/CEIH/2022 and 5352/CEIH/2025 and Central University of Chile code: Project 152/2022.

Informed Consent Statement

Informed consent was obtained from all subjects involved in the study.

Data Availability Statement

The file “Processed data from the Chile-Portugal Pilot Study” can be downloaded from the following link: https://doi.org/10.5281/zenodo.18229500 (accessed on 15 October 2025).

Acknowledgments

We would like to thank Cláudia Prioste, Filomena Teixeira, António Moreira and Francisco Parrança da Silva for their special support during our international stay in Portugal, including their participation in the translation validation and cultural adaptation of the Digital Hospitality Scale from Spanish to Portuguese.

Conflicts of Interest

The authors declare no conflicts of interest. The funders had no role in the design of the study; in the collection, analyses, or interpretation of data; in the writing of the manuscript; or in the decision to publish the results.

Correction Statement

This article has been republished with a minor correction to the Funding statement. This change does not affect the scientific content of the article.

References

  1. Actis, J.L. Digital Gap in the Dominican Republic: Analysis of the availability in the household and individual use of computers and the Internet. Cienc. Y Soc. 2010, 35, 291–358. [Google Scholar] [CrossRef] [Scilit]
  2. Aguiar Pereira, J.M.B. Clivagens Digitais e a Participação Cívica e Política: Que Tipo de Cidadania Para o Século XXI? Ph.D. Thesis, Universidade do Porto, Porto, Portugal, 2018. Available online: https://repositorio-aberto.up.pt/bitstream/10216/114401/2/278862.pdf (accessed on 1 January 2025).
  3. Cabero Almenara, J.; Ruiz Palmero, J. Technologies of Information and Communication for inclusion: Reformulating the digital gap. Int. J. Educ. Res. Innov. (IJERI) 2018, 9, 16–30. Available online: http://hdl.handle.net/11441/66918 (accessed on 1 January 2025).
  4. Catalán Pesce, R. Los desafíos de la inclusión digital étnica. Rev. Diálogos Comun. 2010, 82. Available online: https://dialnet.unirioja.es/descarga/articulo/3728256.pdf (accessed on 1 January 2025).
  5. Martínez Domínguez, M. Access and use of information and communication technologies in Mexico: Determining factors. PAAKAT Rev. Tecnol. Y Soc. 2018, 8, 1–18. [Google Scholar] [CrossRef] [Scilit]
  6. Martínez Domínguez, M.; Gómez Navarro, D.A.; Morales López, J. Determinants of the digital divide in indigenous communities in Oaxaca. A Study Context A pandemic. Rev. Controv. Y Concurr. Latinoam. 2021, 12, 45–69. Available online: https://ojs.sociologia-alas.org/index.php/CyC/article/view/244 (accessed on 1 January 2025).
  7. Martínez López, O. Educational Digital Gap. When Territory Matters. Matters Soc. E Infanc. 2020, 4, 267–270. [Google Scholar] [CrossRef] [Scilit]
  8. Martínez Suárez, Y.; de Salvador Agra, S.; de Salvador González, X. Triply marked: Communicative disconnections in the southern Ecuadorian Amazon. Cuadernos.info 2015, 36, 89–107. [Google Scholar] [CrossRef] [Scilit]
  9. Prince Torres, Á. The digital divide as an obstacle to the universal right to education in times of pandemic. J. Acad. 2021, 4, 26–41. [Google Scholar] [CrossRef] [Scilit]
  10. Prioste, C.D. Technology and education: Looking for a pedagogy of freedom in the face of digital neocolonization. Série-Estud.—Periódico Programa Pós-Grad. Educ. UCDB 2019, 24, 9–29. [Google Scholar] [CrossRef] [Scilit]
  11. Ramírez Castañeda, L.A.; Sepúlveda López, J.J. Digital divide and digital inclusion: Socio-technological phenomena. Rev. EIA 2018, 15, 89–97. [Google Scholar] [CrossRef] [Scilit]
  12. Sepúlveda-Parrini, P.; Valdivia-Vizarreta, P.; Pineda-Herrero, P. Teaching and learning in cyberspace: Insights from cyberfeminist pedagogies for virtual education. A systematic literature review. Teknokultura. Rev. Cult. Digit. Y Mov. Soc. 2022, 19, 241–253. [Google Scholar] [CrossRef] [Scilit]
  13. Ziegler, S. Digital literacy in Rural Areas: An Indispensable Condition to Bridge the Divide in Latin America and the Caribbean. 2021. Available online: https://hdl.handle.net/11324/14462 (accessed on 1 January 2025).
  14. Fernández Aller, C. Digital Health, Global Health and Ethics. A look from the human rights approach. Rev. Diecisiete 2020, 3, 87–98. [Google Scholar] [CrossRef] [Scilit]
  15. Gil Cantero, F. La educación en Derechos Humanos en el sistema educativo. Rev. Investig. E Innovación Educ. 2017, 35, 43–56. Available online: https://revistas.uam.es/tarbiya/article/view/7245 (accessed on 1 January 2025).
  16. Organización de Estados Iberoamericanos para la Educación; la Ciencia y la Cultura (OEI); Oficina Internacional de Educación de la UNESCO (OIE-UNESCO). Guía para Asegurar la Inclusión y la Equidad en la Educación (Adaptación de UNESCO, 2017). OEI, OIE-UNESCO. 2018. Available online: https://unesdoc.unesco.org/ark:/48223/pf0000259592 (accessed on 1 January 2025).
  17. Riofrío Martínez-Villalba, J.C. La cuarta ola de derechos humanos: Los derechos digitales. Rev. Latinoam. Derechos Hum. 2014, 25, 15–45. Available online: https://www.revistas.una.ac.cr/index.php/derechoshumanos/article/view/6117 (accessed on 1 January 2025).
  18. Chibás Ortiz, F.; Machado Mazzetti, B.; Bonilla del Río, M.; Aguaded, I. From Smart, Sustainable and Healthy Cities to MIL Cities (Media Information Literacy): Rankings and UN 2030 Agenda. Chasqui Rev. Latinoam. Comun. 2022, 149, 147–162. [Google Scholar] [CrossRef] [Scilit]
  19. Sandoval Rubilar, P.; Rodriguez Alveal, F.; Maldonado Fuentes, A.C. Evaluation of digital and pedagogical literacy in ICT based on the opinions of Initial Teacher Education students. Educ. E Pesqui. 2017, 43, 127–143. [Google Scholar] [CrossRef] [Scilit]
  20. UNESCO. Navigating the Infodemic with MIL: Media and Information Literacy, 1st ed.; Chibás Ortiz, F.S., Novomisky, S., Eds.; Organización de las Naciones Unidas para la Educación, la Ciencia y la Cultura: París, Francia, 2022; Available online: https://unesdoc.unesco.org/ark:/48223/pf0000385748 (accessed on 1 January 2025).
  21. Redecker, C. European Framework for the Digital Competence of Educators; Punie, Y., Ed.; Fundación Universia/Instituto Nacional de Tecnologías Educativas y de Formación del Profesorado (INTEF): Madrid, Spain, 2020. (In Spanish) [Google Scholar] [CrossRef]
  22. Aguilar, S.J. Guidelines and tools for promoting digital equity. Inf. Learn. Sci. 2020, 121, 285–299. [Google Scholar] [CrossRef] [Scilit]
  23. Gabriel, F.; Marrone, R.; Van Sebille, Y.; Kovanovic, V.; de Laat, M. Digital education strategies around the world: Practices and policies. Ir. Educ. Stud. 2022, 41, 85–106. [Google Scholar] [CrossRef] [Scilit]
  24. Pinto-Santos Alba, R.; George-Reyes Carlos, E.; Cortés-Peña Omar, F. Digital gap in initial teacher training: Challenges in learning environments during the COVID-19 pandemic in La Guajira (Colombia). Form. Univ. 2022, 15, 49–60. [Google Scholar] [CrossRef] [Scilit]
  25. Hosman, L.; Pérez Comisso, M.A. How do we understand “meaningful use” of the internet? Of divides, skills and socio-technical awareness. J. Inf. Commun. Ethics Soc. 2020, 18, 461–479. [Google Scholar] [CrossRef] [Scilit]
  26. Núñez-Valdés, K.P.; Sepulveda-Irribarra, C.A.; Villegas-Dianta, C.A.; Castillo-Paredes, A.J. Artificial intelligence and professor training: Analysis of student perceptions. Form. Univ. 2025, 18, 1–12. [Google Scholar] [CrossRef] [Scilit]
  27. Arek-Bawa, O.; Reddy, S. Preparing Pre-Service Teachers for Teaching in the Digital Age. Athens J. Educ. 2025, 12, 79–98. [Google Scholar] [CrossRef] [Scilit]
  28. Aydın, Y.; Köse, M. COVID-19 Experience of Higher Education Students in Urban and Rural Areas. Selçuk Üniversitesi Edeb. Fakültesi Derg. 2021, 46, 337–354. Available online: https://sefad.selcuk.edu.tr/sefad/article/view/1408/1082 (accessed on 1 January 2025).
  29. Samane-Cutipa, V.A.; Quispe-Quispe, A.M.; Talavera-Mendoza, F.; Limaymanta, C.H. Digital Gaps Influencing the Online Learning of Rural Students in Secondary Education: A Systematic Review. Int. J. Inf. Educ. Technol. 2022, 12, 685–690. [Google Scholar] [CrossRef] [Scilit]
  30. Romero Morales, L.M.; Poveda Aguja, F.A. Views of technological mediation against educational quality after the COVID-19 pandemic. Univ. Y Soc. 2022, 14, 624–629. Available online: https://rus.ucf.edu.cu/index.php/rus/article/view/2994 (accessed on 1 January 2025).
  31. Barlow, J.P. (Ed.) A Declaration of the Independence of Cyberspace. In Periférica Internacional. Revista Para El Análisis De La Cultura Y El Territorio; EFF: Davos, Switzerland, 1996; Volume 1, pp. 241–242. [Google Scholar] [CrossRef] [Scilit]
  32. Prensky, M. Digital Natives, Digital Immigrants Part 1. Horizon 2001, 9, 1–6. [Google Scholar] [CrossRef] [Scilit]
  33. Cabero-Almenara, J.; Valencia-Ortiz, R.; Llorente-Cejudo, C.; Palacios-Rodríguez, A. Digital natives and immigrants in the context of COVID-19: The contradictions of a diversity of myths. Texto Livre 2023, 16, e42233. [Google Scholar] [CrossRef] [Scilit]
  34. Zilka, G.C. Attitudes of preservice kindergarten teachers toward the integration of computers and the reduction of the digital divide in kindergartens. Educ. Tech. Res. Dev. 2021, 69, 711–731. [Google Scholar] [CrossRef] [Scilit]
  35. García-Ruiz, C.; Luque-Jiménez, J. Digital competence of Secondary Education Teachers in initial training: Levels of perception and transfer to practice. Bordón. Rev. Pedagog. 2024, 76, 63–86. [Google Scholar] [CrossRef] [Scilit]
  36. Cernadas, E.; Aguayo, E.; Fernández-Delgado, M.; Calvo-Iglesias, E. STEM, a Non-Place for Women? Evidences and Transformative Initiatives. Soc. Sci. 2025, 14, 384. [Google Scholar] [CrossRef] [Scilit]
  37. Sánchez-Canut, S.; Usart-Rodríguez, M.; Lores-Gómez, B.; Martínez-Requejo, S. Gender Gap in Professional Digital Competence: Construction and Initial Validation of an Instrument for its Measurement. Feminismo/s 2025, 45, 139–172. [Google Scholar] [CrossRef] [Scilit]
  38. Pérez-Escoda, A.; Iglesias-Rodríguez, A.; Meléndez-Rodríguez, L.; Berrocal-Carvajal, V. Teacher’s Digital Competence for Reducing Digital Divide: Comparative Study Between Spain and Costa Rica. Tripodos 2020, 46, 77–96. Available online: https://raco.cat/index.php/Tripodos/article/view/369937 (accessed on 1 January 2025).
  39. Gutiérrez-Provecho, M.L.; López-Aguado, M.; García Llamas, J.L.; Quintanal Diaz, J. The digital divide in population at risk of social exclusión. Pedagog. Social. Rev. Interuniv. 2021, 39, 123–138. [Google Scholar] [CrossRef] [Scilit]
  40. Muñiz Fernández, J. Test theories: Classical theory and item response theory. Papeles Del. Psicólogo 2010, 31, 57–66. Available online: https://www.papelesdelpsicologo.es/pdf/1796.pdf (accessed on 1 January 2025).
  41. Martínez, C. Estadística Básica Aplicada; ECOE: Bogotá, Colombia, 2005. [Google Scholar]
  42. Olmedo Moreno, E.; Aguaded Ramírez, E.; Berrocal de Luna, E.; Buendía Eisman, L.; Carmona Fernández, M.; Expósito López, J.; Pegalajar Moral, M.; Sánchez Nuñez, C.S.N.; Tomé Fernández, M. Construction of an Instrument to Assess the Coexistence in Intercultural Secondary Classrooms. Int. Educ. Learn. Rev./Rev. Int. Educ. Y Aprendiz. 2013, 1, 3. [Google Scholar] [CrossRef] [Scilit]
  43. Ato, M.; López, J.J.; Benavente, A. A classification system for research designs in psychology. An. Psicol. 2013, 29, 1038–1059. [Google Scholar] [CrossRef] [Scilit]
  44. Henríquez, J.A. Digital Hospitality: A Concept for the Education of the 21st Century. Int. Educ. Learn. Rev. 2021, 9, 55–65. [Google Scholar] [CrossRef] [Scilit]
  45. Kendall, M.G. Rank Correlation Methods, 4th ed.; Charles Griffin: San Francisco, CA, USA, 1975; Volume 8, Available online: https://archive.org/details/rankcorrelationm0000kend (accessed on 1 January 2025).
  46. Comrey, A. Manual de Análisis Factorial; Cátedra: Madrid, Spain, 1985. [Google Scholar]
  47. Nunnally, J.C.; Bernstein, I.J. Teoría Psicométrica, 3rd ed.; México, D.F., Ed.; McGrawHill Latinoamericana: New York, NY, USA, 1995. [Google Scholar]
  48. Hernández López, V.; Juárez Hernández, L.G. Diseño y validación de contenido por juicio de expertos de un instrumento para para evaluar la acción tutorial en el nivel superior. Rev. UPIICSA Investig. Interdiscip. 2020, 6, 1–12. Available online: https://ruii.ipn.mx/index.php/RUII/article/view/73 (accessed on 1 January 2025).
  49. Kaiser, H.F. An index of factorial simplicity. Psycho 1974, 39, 31–36. [Google Scholar] [CrossRef] [Scilit]
  50. Gómez-Trigueros, I.M.; Yáñez de Aldecoa, C. The digital gap in the educational context: Education and learning for the digital citizen. Res. Educ. Learn. Innov. Arch. 2023, 30, 39–45. [Google Scholar] [CrossRef] [Scilit]
Figure 1. Phases of the study.
Societies 16 00028 g001
Figure 2. Sedimentation graph.
Societies 16 00028 g002
Table 1. Variables and hypotheses.
VariablesDescriptionHypothesis
Economic factorAmount of household incomeThe economic situation will influence access to and use of technologies, with the digital divide being smaller among those with higher incomes.
Geographic locationCharacterization of the territory contrasting between urban and rural areasStudents living in urban areas will show a smaller digital divide compared to those living in rural areas.
AgeGenerational difference and gapYounger students will be more familiar with and make greater use of technologies compared to older students.
GenderGender self-determinationThere will be differences in the digital divide according to gender.
Disability statusSelf-determination of a disabilityStudents with disabilities will face greater barriers in accessing and using technology compared to those who self-identify as non-disabled.
InterculturalitySelf-determination as belonging to an indigenous people or ethnic community.
Country of origin different from country of residence.
Students belonging to indigenous peoples or ethnic communities or who come from a country other than their country of residence and study will have more difficulties in accessing and using technology than those who do not self-identify as such.
Source: Authors’ elaboration.
Table 2. Kendall’s W by item.
ÍtemClarity M (DT)Suitability M (DT)Relevance M (DT)Kendall’s Wχ2glp
i14.70 (0.733)4.65 (0.813)4.65 (0.813)0.0170.66720.717
i24.79 (0.657)4.80 (0.523)4.75 (0.550)0.0251.00020.607
i34.85 (0.489)4.70 (0.801)4.75 (0.550)0.0200.80020.670
i44.85 (0.489)4.70 (0.801)4.75 (0.550)0.0502.00020.368
i54.05 (1.099)4.50 (0.827)4.60 (0.821)0.1757.00020.030
i64.15 (1.348)4.60 (0.995)4.80 (0.523)0.1907.60020.022
i74.65 (0.745)4.55 (0.826)4.80 (0.410)0.0582.33320.311
i84.20 (1.240)4.35 (0.988)4.45 (0.887)0.0672.66720.264
i94.10 (1.165)4.65 (0.745)4.65 (0.745)0.30012,00020.002
i104.45 (0.999)4.55 (0.826)4.80 (0.523)0.1134.52620.104
i114.45 (0.887)4.65 (0.671)4.75 (0.550)0.0883.50020.174
i124.60 (0.995)4.80 (0.616)4.80 (0.616)0.1004.00020.135
i134.70 (0.571)4.75 (0.550)4.75 (0.550)0.0502.00020.368
i144.65 (0.813)4.70 (0.657)4.85 (0.366)0.0341.36820.504
i154.80 (0.410)4.90 (0.308)4.80 (0.696)0.0502.00020.368
i164.60 (0.754)4.90 (0.308)4.85 (0.366)0.1305.20020.074
i174.65 (0.813)4.85 (0.366)4.75 (0.550)0.0502.00020.368
i184.45 (0.999)4.75 (0.639)4.70 (0.657)0.0502.00020.368
i194.45 (1.050)4.65 (0.813)4.60 (0.821)0.0120.50020.779
i204.30 (1.261)4.80 (0.616)4.80 (0.616)0.2008.00020.018
i214.00 (1.214)4.45 (1.146)4.45 (1.146)0.30012.00020.002
i224.10 (1.252)4.65 (0.875)4.60 (0.995)0.25810.33320.006
i234.55 (0.887)4.80 (0.523)4.80 (0.523)0.1004.00020.135
i244.75 (0.716)4.85 (0.366)4.90 (0.308)0.0120.50020.779
i254.65 (0.745)4.90 (0.308)4.90 (0.308)0.1506.00020.050
i264.65 (0.813)4.95 (0.224)5.00 (0.000)0.1305.20020.074
i274.65 (0.745)4.85 (0.489)4.90 (0.447)0.1405.60020.061
i284.55 (0.887)4.80 (0.523)4.85 (0.489)0.0883.50020.174
i294.35 (1.089)4.70 (0.801)4.70 (0.801)0.1506.00020.050
Source: Authors’ elaboration.
Table 3. Distribution of expert judges’ ratings of the items.
IndicatorTotalPercentage
Very strong139280%
Strong1669.5%
Sufficient1176.7%
Weak623.6%
Very weak30.2%
Total1740100%
Source: Authors’ elaboration.
Table 4. Total variance explained by the first 20 components.
ComponentInitial Eigenvalues% Variance% Accumulated
114.63116.8216.82
29.07210.4327.25
36.7147.7234.96
44.1314.7539.71
53.4954.0243.73
63.0053.4547.18
72.5292.9150.09
82.4512.8252.91
92.3162.6655.57
102.0272.3357.90
111.8832.1760.06
121.8682.1562.21
131.6121.8564.06
141.4681.6965.75
151.3611.5667.31
161.2941.4968.80
171.2451.4370.23
181.1901.3771.60
191.1101.2872.88
201.0141.1774.04
Source: Authors’ elaboration.
Table 5. Reliability statistics.
Cronbach’s AlphaCronbach’s Alpha Based on Standardized ItemsN of
Sub-Items
0.9310.93687
Source: Authors’ elaboration.
Disclaimer/Publisher’s Note: The statements, opinions and data contained in all publications are solely those of the individual author(s) and contributor(s) and not of MDPI and/or the editor(s). MDPI and/or the editor(s) disclaim responsibility for any injury to people or property resulting from any ideas, methods, instructions or products referred to in the content.