

Effects on Territorial Dynamics and Labor Commuting During the Pre- and Post-Pandemic Period in Chile


Abstract
1. Introduction
- (SO1) Analyze the probability of commuting in Chile between the years 2018 and 2022.
- (SO2) Compare commuting patterns and their relationship with socio-productive characteristics in different regions of Chile.
- (SO3) Examine the impact of the health crisis on commuting decisions across various regions in Chile.
1.1. Theoretical Framework
1.1.1. Context
1.1.2. Geographical Zones
- (a).
- Great North, comprising the regions of Arica, Tarapacá, and Antofagasta, is the area of Chile where mining contributes the most to the regional gross domestic product (GDP), accounting for an average share of 49.1% of the regional GDP between 2018 and 2022.
- (b).
- Small North, which includes the regions of Atacama and Coquimbo, although mining is also its main productive activity, generated on average 24.4% of the area’s GDP between 2018 and 2022. Construction and personal services are tied as the second most economically important sectors in the region, with 11.6% of regional GDP each [3].
- (c).
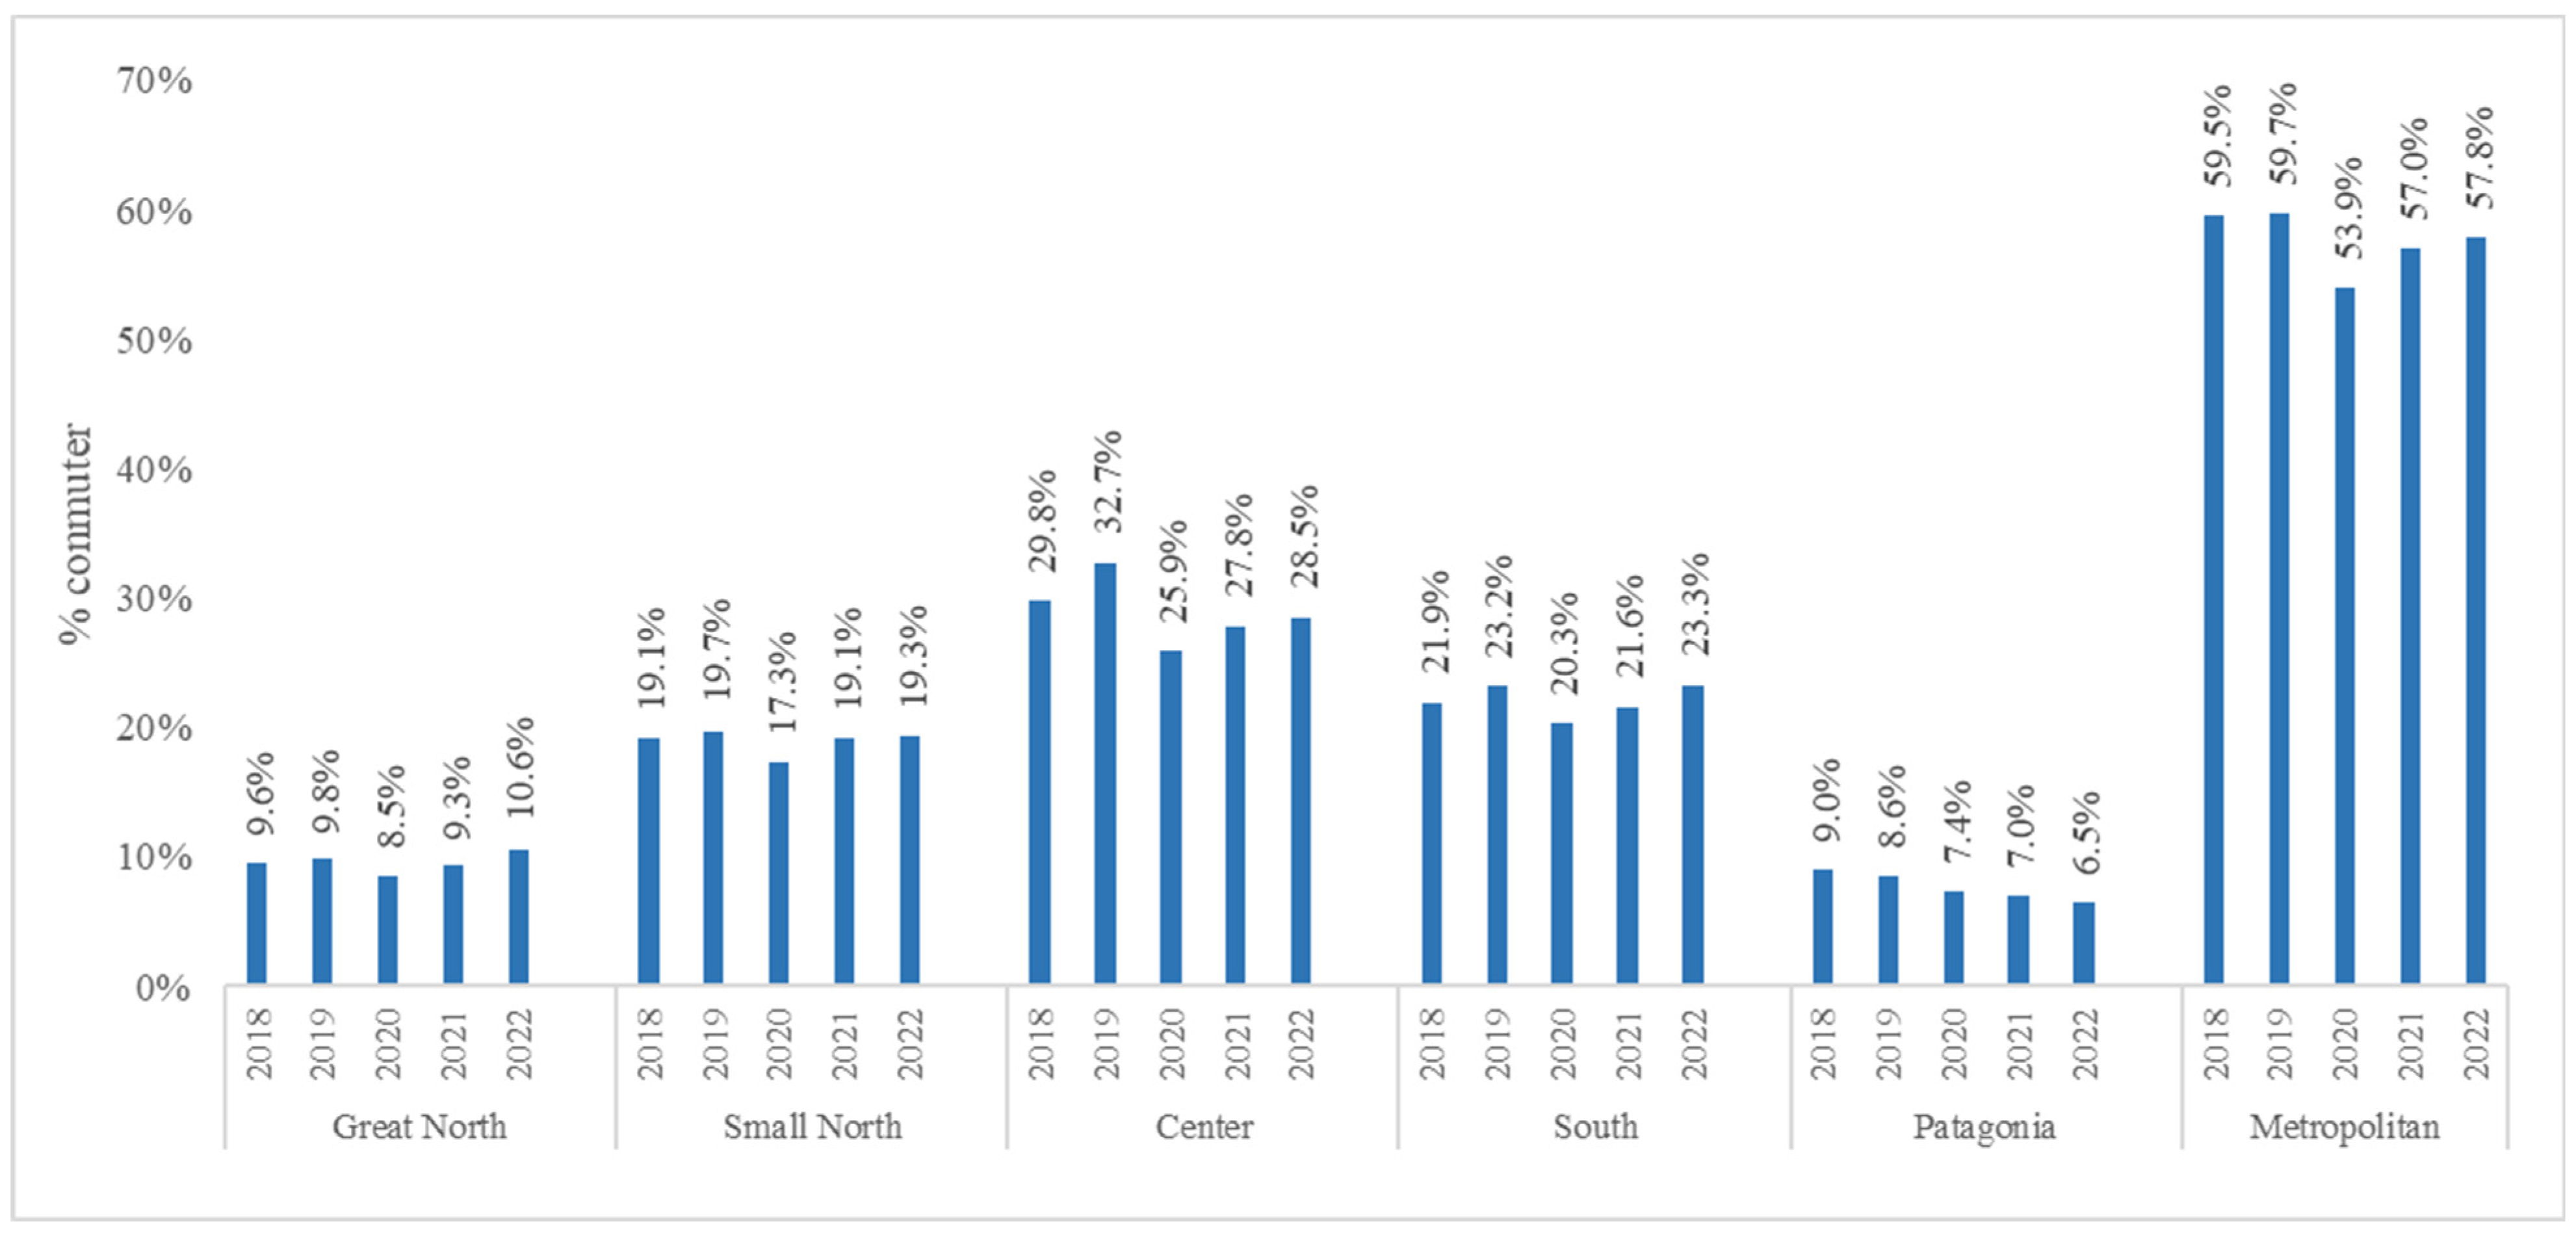
- Center, in this classification, consists of the regions of Valparaíso and O’Higgins. Unlike the classification by Mancilla et al. [5], the Metropolitan zone is studied separately due to its distinct intercommunal commuting patterns, likely resulting from the region’s high connectivity, which leads to higher commuting rates (Figure 1). In the Center zone, the sectors contributing the most to the regional GDP are financial and business services, housing and real estate services, and personal services, with average shares of 11.0%, 10.3%, and 13.8%, respectively.
- (d).
- Metropolitan, where financial and business services account for 23.4% of the regional GDP, doubled its contribution in the Center zone, making it the region with the most significant economic activity. The construction sector ranks second, contributing an average of 4.4% over the study period.
- (e).
- South comprises the regions of Maule, Biobío, Ñuble, and Araucanía, where the GDP is primarily driven by manufacturing industries and personal services, which contribute 16.3% and 17.2%, respectively, to the combined regional GDP. The third most significant activities are financial and business services and housing and real estate services, each accounting for 9.6% of the regional GDP.
- (f).
- Patagonia includes the regions of Los Ríos, Los Lagos, Aysén, and Magallanes, where the GDP is characterized by manufacturing industries and personal services, which contribute 17.2% and 15.4%, respectively, to the regional GDP. Commerce constitutes the third most significant sector, with an average contribution of 8.7% to the regional GDP.
1.1.3. Labor Commuting and Associated Variables
2. Materials and Methods
2.1. Logistic Models
2.2. Impact Evaluation
2.3. Data
3. Results
3.1. Commuting Probability
3.2. Probability of Commuting in Different Zones of Chile
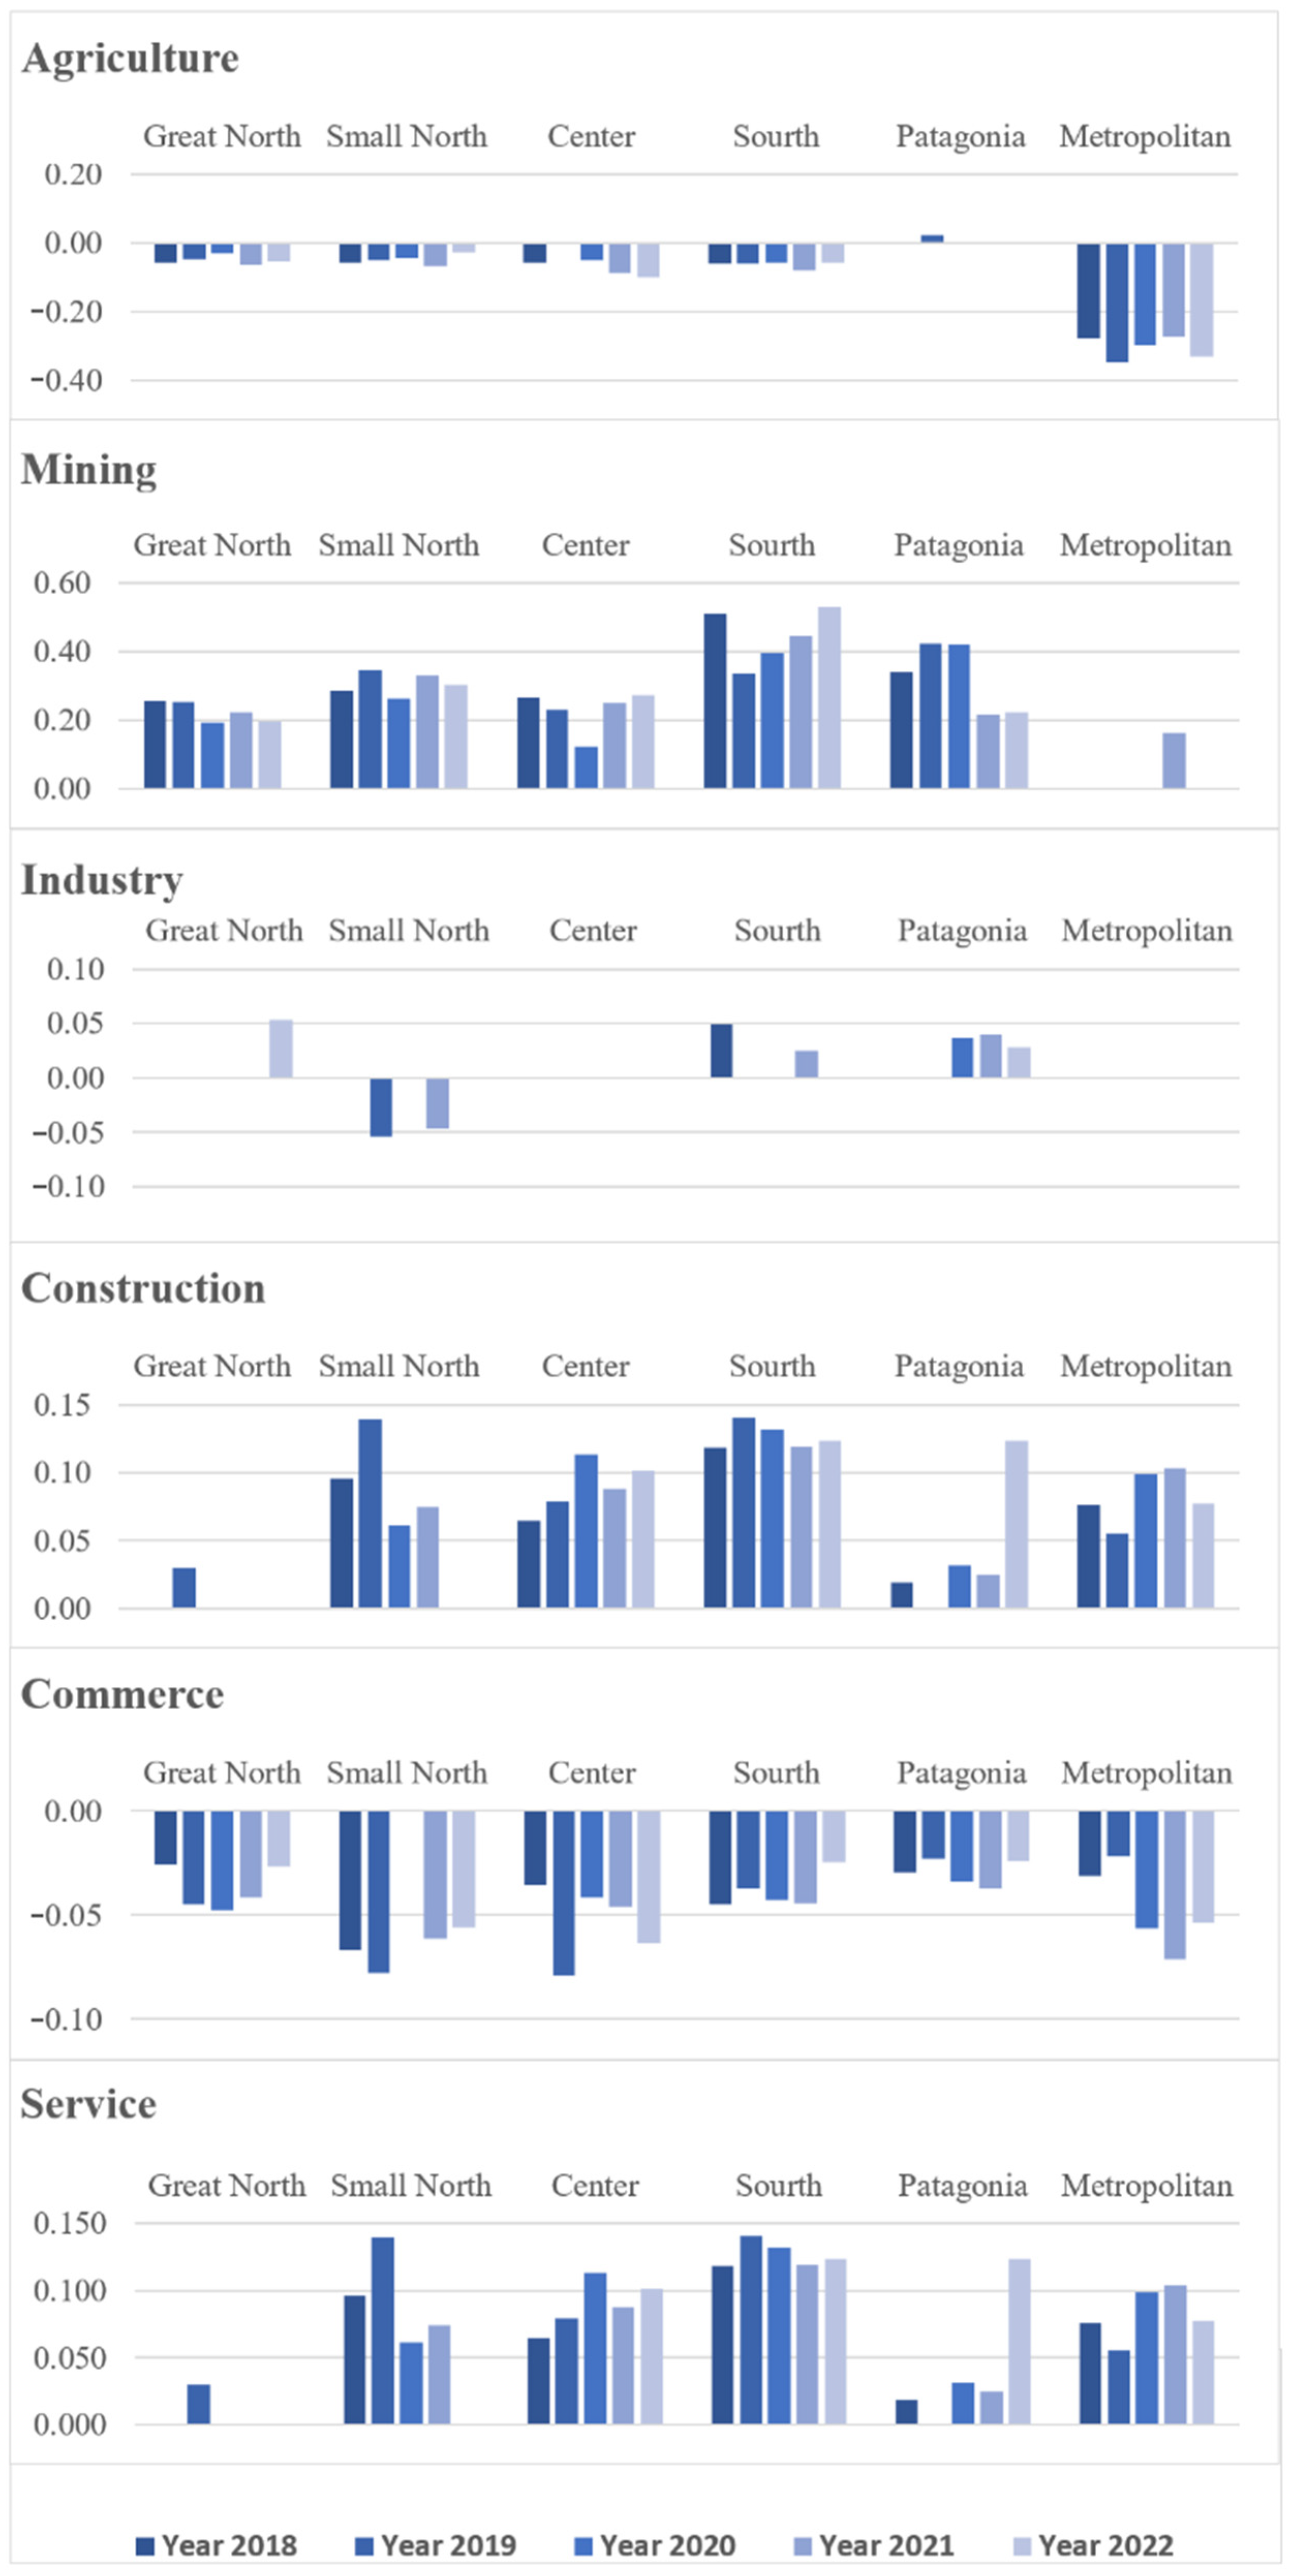
3.3. Impact of Productive Sectors on the Commuting Decision
4. Conclusions
Author Contributions
Funding
Institutional Review Board Statement
Informed Consent Statement
Data Availability Statement
Conflicts of Interest
Appendix A

| Great North | Small North | Center | South | Patagonia | Metropolitan | ||||||||
|---|---|---|---|---|---|---|---|---|---|---|---|---|---|
| ATT | p | ATT | p | ATT | p | ATT | p | ATT | p | ATT | p | ||
| Agriculture | 2018 | −0.058 | ** | −0.059 | ** | −0.059 | *** | −0.062 | *** | 0.010 | −0.278 | *** | |
| 2019 | −0.050 | ** | −0.052 | * | −0.022 | −0.062 | *** | 0.021 | * | −0.349 | *** | ||
| 2020 | −0.031 | ** | −0.045 | ** | −0.053 | ** | −0.057 | *** | −0.009 | −0.298 | *** | ||
| 2021 | −0.066 | *** | −0.068 | *** | −0.087 | *** | −0.081 | *** | 0.013 | −0.275 | *** | ||
| 2022 | −0.056 | * | −0.030 | + | −0.102 | *** | −0.057 | *** | 0.008 | −0.331 | *** | ||
| Mining | 2018 | 0.258 | *** | 0.288 | *** | 0.268 | *** | 0.509 | *** | 0.341 | *** | −0.013 | |
| 2019 | 0.252 | *** | 0.346 | *** | 0.230 | *** | 0.337 | *** | 0.424 | *** | −0.022 | ||
| 2020 | 0.194 | *** | 0.261 | *** | 0.125 | * | 0.397 | *** | 0.420 | ** | 0.117 | ||
| 2021 | 0.223 | *** | 0.330 | *** | 0.249 | *** | 0.447 | *** | 0.217 | ** | 0.163 | ** | |
| 2022 | 0.198 | *** | 0.304 | *** | 0.274 | *** | 0.530 | *** | 0.223 | ** | 0.037 | ||
| Industry | 2018 | 0.007 | −0.017 | −0.014 | 0.049 | ** | 0.007 | 0.000 | |||||
| 2019 | 0.021 | −0.054 | ** | −0.006 | 0.006 | 0.015 | −0.022 | ||||||
| 2020 | 0.037 | −0.025 | 0.024 | −0.002 | 0.036 | * | −0.034 | ||||||
| 2021 | 0.026 | −0.047 | * | 0.025 | 0.025 | + | 0.040 | ** | −0.003 | ||||
| 2022 | 0.053 | ** | 0.030 | 0.000 | −0.010 | 0.028 | * | −0.016 | |||||
| Construction | 2018 | 0.025 | 0.096 | *** | 0.065 | *** | 0.118 | *** | 0.019 | + | 0.076 | *** | |
| 2019 | 0.030 | * | 0.140 | *** | 0.079 | *** | 0.141 | *** | 0.007 | 0.055 | *** | ||
| 2020 | 0.027 | 0.061 | * | 0.113 | *** | 0.132 | *** | 0.031 | * | 0.099 | *** | ||
| 2021 | 0.020 | 0.074 | *** | 0.088 | *** | 0.119 | *** | 0.025 | * | 0.104 | *** | ||
| 2022 | −0.005 | 0.013 | 0.101 | *** | 0.124 | *** | 0.124 | *** | 0.077 | *** | |||
| Commerce | 2018 | −0.026 | ** | −0.067 | *** | −0.036 | ** | −0.045 | *** | −0.030 | *** | −0.031 | ** |
| 2019 | −0.045 | *** | −0.078 | *** | −0.079 | *** | −0.037 | *** | −0.023 | ** | −0.022 | + | |
| 2020 | −0.048 | *** | −0.014 | −0.041 | ** | −0.043 | ** | −0.034 | *** | −0.056 | *** | ||
| 2021 | −0.042 | *** | −0.061 | *** | −0.046 | *** | −0.044 | *** | −0.037 | *** | −0.072 | *** | |
| 2022 | −0.027 | ** | −0.056 | *** | −0.064 | *** | −0.024 | * | −0.024 | *** | −0.054 | *** | |
| Service | 2018 | −0.030 | ** | −0.050 | ** | −0.003 | −0.037 | ** | −0.005 | 0.028 | ** | ||
| 2019 | −0.028 | * | −0.015 | 0.001 | −0.018 | −0.013 | + | 0.025 | * | ||||
| 2020 | −0.033 | * | −0.080 | ** | −0.038 | * | −0.025 | −0.026 | + | 0.039 | * | ||
| 2021 | −0.017 | + | −0.045 | ** | −0.004 | −0.006 | −0.017 | + | 0.053 | *** | |||
| 2022 | −0.029 | ** | −0.047 | ** | 0.034 | * | −0.029 | * | −0.019 | ** | 0.044 | ** | |
| Great North | Small North | Center | South | Patagonia | Metropolitan | ||
|---|---|---|---|---|---|---|---|
| Agriculture | |||||||
| Untreated | 2018 | 3789 | 2998 | 7146 | 8378 | 4989 | 10,050 |
| Treated | 2018 | 395 | 553 | 962 | 1427 | 1114 | 250 |
| Robust Std. Err. | 2018 | 0.1179 | 0.0145 | 0.0152 | 0.0133 | 0.0856 | 0.0300 |
| Untreated | 2019 | 3572 | 2802 | 6104 | 7611 | 5589 | 8005 |
| Treated | 2019 | 343 | 491 | 873 | 1338 | 1140 | 203 |
| Robust Std. Err. | 2019 | 0.0107 | 0.0161 | 0.0176 | 0.0113 | 0.0092 | 0.0299 |
| Untreated | 2020 | 2150 | 1649 | 3994 | 4971 | 3024 | 4382 |
| Treated | 2020 | 161 | 257 | 599 | 914 | 621 | 84 |
| Robust Std. Err. | 2020 | 0.0142 | 0.0175 | 0.0193 | 0.0140 | 0.0130 | 0.0457 |
| Untreated | 2021 | 3331 | 3091 | 5694 | 7897 | 5234 | 6067 |
| Treated | 2021 | 214 | 342 | 783 | 1335 | 837 | 140 |
| Robust Std. Err. | 2021 | 0.0082 | 0.0147 | 0.0158 | 0.0104 | 0.0099 | 0.0350 |
| Untreated | 2022 | 3392 | 2870 | 5066 | 7790 | 4804 | 6638 |
| Treated | 2022 | 153 | 336 | 726 | 1310 | 703 | 165 |
| Robust Std. Err. | 2022 | 0.0225 | 0.0174 | 0.0170 | 0.0116 | 0.0100 | 0.0338 |
| Minning | |||||||
| Untreated | 2018 | 3958 | 3341 | 7980 | 9760 | 6074 | 10,246 |
| Treated | 2018 | 226 | 210 | 128 | 45 | 29 | 54 |
| Robust Std. Err. | 2018 | 0.039 | 0.0362 | 0.0417 | 0.0484 | 0.0900 | 0.0622 |
| Untreated | 2019 | 3684 | 3120 | 6854 | 8026 | 6707 | 8156 |
| Treated | 2019 | 231 | 172 | 123 | 23 | 22 | 52 |
| Robust Std. Err. | 2019 | 0.034 | 0.0391 | 0.0447 | 0.0966 | 0.1096 | 0.0616 |
| Untreated | 2020 | 2180 | 1754 | 4503 | 5865 | 3629 | 4435 |
| Treated | 2020 | 131 | 152 | 90 | 20 | 16 | 31 |
| Robust Std. Err. | 2020 | 0.042 | 0.0421 | 0.0542 | 0.0801 | 0.1228 | 0.0730 |
| Untreated | 2021 | 3350 | 3157 | 6362 | 9193 | 6040 | 6163 |
| Treated | 2021 | 195 | 276 | 115 | 39 | 31 | 44 |
| Robust Std. Err. | 2021 | 0.034 | 0.0327 | 0.0447 | 0.0586 | 0.0811 | 0.0570 |
| Untreated | 2022 | 3322 | 2970 | 5697 | 9066 | 5478 | 6741 |
| Treated | 2022 | 223 | 236 | 95 | 34 | 29 | 62 |
| Robust Std. Err. | 2022 | 0.033 | 0.0345 | 0.0471 | 0.0390 | 0.0814 | 0.0559 |
| Industry | |||||||
| Untreated | 2018 | 3804 | 3278 | 7365 | 8776 | 5484 | 9123 |
| Treated | 2018 | 380 | 273 | 743 | 1029 | 619 | 1177 |
| Robust Std. Err. | 2018 | 0.0181 | 0.0218 | 0.0162 | 0.0144 | 0.0111 | 0.0145 |
| Untreated | 2019 | 3555 | 3004 | 6362 | 8010 | 6022 | 7275 |
| Treated | 2019 | 360 | 288 | 615 | 939 | 707 | 933 |
| Robust Std. Err. | 2019 | 0.0185 | 0.0194 | 0.0192 | 0.0167 | 0.0109 | 0.0166 |
| Untreated | 2020 | 2100 | 1730 | 4106 | 5212 | 3246 | 3980 |
| Treated | 2020 | 211 | 171 | 483 | 664 | 396 | 474 |
| Untreated | 2020 | 0.0247 | 0.0265 | 0.0207 | 0.0167 | 0.0146 | 0.0228 |
| Untreated | 2021 | 3232 | 3125 | 5803 | 8138 | 5419 | 5493 |
| Treated | 2021 | 312 | 302 | 664 | 1080 | 647 | 681 |
| Robust Std. Err. | 2021 | 0.0200 | 0.0188 | 0.0175 | 0.0128 | 0.0120 | 0.0189 |
| Untreated | 2022 | 3201 | 2893 | 5243 | 8086 | 4883 | 6087 |
| Treated | 2022 | 340 | 306 | 545 | 990 | 614 | 697 |
| Robust Std. Err. | 2022 | 0.0201 | 0.0216 | 0.0195 | 0.0135 | 0.0117 | 0.0188 |
| Construction | |||||||
| Untreated | 2018 | 3558 | 3056 | 6864 | 8445 | 5233 | 8743 |
| Treated | 2018 | 626 | 495 | 1244 | 1360 | 870 | 1557 |
| Robust Std. Err. | 2018 | 0.0157 | 0.0214 | 0.0155 | 0.0148 | 0.0104 | 0.0138 |
| Untreated | 2019 | 3263 | 2819 | 5852 | 7635 | 5711 | 6978 |
| Treated | 2019 | 652 | 473 | 1125 | 1314 | 1018 | 1230 |
| Robust Std. Err. | 2019 | 0.0145 | 0.0235 | 0.0167 | 0.0144 | 0.0097 | 0.0158 |
| Untreated | 2020 | 1984 | 1642 | 3912 | 5011 | 3141 | 3832 |
| Treated | 2020 | 327 | 259 | 677 | 865 | 501 | 622 |
| Robust Std. Err. | 2020 | 0.0186 | 0.0268 | 0.0201 | 0.0176 | 0.0139 | 0.0227 |
| Untreated | 2021 | 2972 | 2888 | 5480 | 7805 | 5092 | 5274 |
| Treated | 2021 | 572 | 539 | 987 | 1413 | 974 | 900 |
| Robust Std. Err. | 2021 | 0.0148 | 0.0200 | 0.0165 | 0.0132 | 0.0104 | 0.0186 |
| Untreated | 2022 | 3000 | 2707 | 4931 | 7699 | 4633 | 5782 |
| Treated | 2022 | 541 | 492 | 857 | 1377 | 864 | 1002 |
| Robust Std. Err. | 2022 | 0.0161 | 0.0201 | 0.0175 | 0.0137 | 0.0137 | 0.0175 |
| Commerce | |||||||
| Untreated | 2018 | 3106 | 2617 | 6056 | 7478 | 4748 | 7104 |
| Treated | 2018 | 1078 | 934 | 2052 | 2327 | 1355 | 2487 |
| Robust Std. Err. | 2018 | 0.0097 | 0.0126 | 0.0113 | 0.0111 | 0.0072 | 0.0102 |
| Untreated | 2019 | 2868 | 2365 | 5189 | 6874 | 5182 | 5721 |
| Treated | 2019 | 1047 | 927 | 1788 | 2075 | 1547 | 2487 |
| Robust Std. Err. | 2019 | 0.091 | 0.0135 | 0.0128 | 0.0102 | 0.0067 | 0.01169 |
| Untreated | 2020 | 1725 | 1428 | 3489 | 4574 | 2853 | 3125 |
| Treated | 2020 | 586 | 473 | 1100 | 1302 | 789 | 1329 |
| Robust Std. Err. | 2020 | 0.0109 | 0.0159 | 0.0150 | 0.0126 | 0.0090 | 0.0155 |
| Untreated | 2021 | 2588 | 2532 | 4820 | 7043 | 4635 | 4283 |
| Treated | 2021 | 956 | 895 | 1647 | 2175 | 1431 | 1891 |
| Robust Std. Err. | 2021 | 0.00800 | 0.0128 | 0.0124 | 0.0094 | 0.0065 | 0.0132 |
| Untreated | 2022 | 2521 | 2358 | 4310 | 6943 | 4235 | 4651 |
| Treated | 2022 | 1020 | 841 | 1478 | 2133 | 1262 | 2133 |
| Robust Std. Err. | 2022 | 0.0085 | 0.0128 | 0.0130 | 0.0099 | 0.0068 | 0.0131 |
| Service | |||||||
| Untreated | 2018 | 2705 | 2465 | 5129 | 6188 | 3987 | 6234 |
| Treated | 2018 | 2479 | 1086 | 2979 | 3617 | 2116 | 4066 |
| Robust Std. Err. | 2018 | 0.0111 | 0.0181 | 0.0124 | 0.0125 | 0.0073 | 0.0107 |
| Untreated | 2019 | 2633 | 2351 | 4524 | 5689 | 4434 | 4905 |
| Treated | 2019 | 1282 | 941 | 2453 | 3260 | 2295 | 3303 |
| Robust Std. Err. | 2019 | 0.0109 | 0.0161 | 0.0139 | 0.0120 | 0.0071 | 0.0119 |
| Untreated | 2020 | 1416 | 1312 | 2949 | 3765 | 2323 | 2540 |
| Treated | 2020 | 895 | 589 | 1640 | 2111 | 1319 | 1914 |
| Robust Std. Err. | 2020 | 0.0143 | 0.0244 | 0.0380 | 0.0161 | 0.0144 | 0.0166 |
| Untreated | 2021 | 2249 | 2354 | 4196 | 6042 | 3929 | 3656 |
| Treated | 2021 | 1295 | 1073 | 2271 | 3176 | 2146 | 2518 |
| Robust Std. Err. | 2021 | 0.0100 | 0.0157 | 0.0139 | 0.0115 | 0.0097 | 0.0147 |
| Untreated | 2022 | 2277 | 2211 | 3701 | 5844 | 3472 | 4059 |
| Treated | 2022 | 1264 | 988 | 2087 | 3232 | 2097 | 2725 |
| Robust Std. Err. | 2022 | 0.0099 | 0.0174 | 0.0143 | 0.0116 | 0.0082 | 0.0135 |
References
- Green, A.E.; Hogarth, T.; Shackleton, R.E. Longer Distance Commuting as a substitute for migration in Britain: A review of trends, issues and implications. Int. J. Popul. Geogr. 1999, 5, 49–67. [Google Scholar] [CrossRef]
- Weller, J.; Gomez, M.; Caballero, A.; Tropa, J. El Impacto de la Crisis Sanitaria del COVID-19 en los Mercados Laborales Latinoamericanos. Documentos de Proyectos Cepal. 2020. Available online: https://repositorio.cepal.org/server/api/core/bitstreams/9a99df0b-2af2-49a9-a022-30358043be08/content (accessed on 4 December 2024).
- Banco Central de Chile—Statistics Database (BDE)—National Accounts. Available online: https://si3.bcentral.cl/Siete/en/Siete/Cuadro/CAP_CCNN/MN_CCNN76/CCNN2018_PIB_REGIONAL/637899744282781812 (accessed on 14 March 2024).
- Employment and Unemployment. Available online: https://www.ine.gob.cl/statistics/social/labour-market/employment-and-unemployment (accessed on 4 January 2024).
- Mancilla, C.; Ferrada, L.M.; Soza-Amigo, S.; Rovira, A. Labour Commutation in the Agricultural Sector—An Analysis of Agricultural Workers in Chile. Agriculture 2022, 12, 2110. [Google Scholar] [CrossRef]
- Naveed, A.; Javakhishvili-Larsen, N.; Schmidt, T.D. Labour mobility and local employment: Building a local employment base from labour mobility? Reg. Stud. 2016, 51, 1622–1634. [Google Scholar] [CrossRef]
- Aroca, P.; Atienza, M. La conmutación regional en Chile y su impacto en la Región de Antofagasta. EURE 2008, 34, 97–120. [Google Scholar] [CrossRef]
- Heise, S.; Porzio, T. The Aggregate and Distributional Effects of Spatial Frictions. NBER Working Paper Serie. 2021. Available online: https://www.nber.org/papers/w28792 (accessed on 2 May 2025).
- Jamett Sasonov, I.; Paredes Araya, D. Conmutación de larga distancia en Chile: Estimando el premio por trabajar muy lejos de casa. Estud. Econ. 2013, 40, 179–209. [Google Scholar] [CrossRef]
- Carriel, M.; Pérez-Trujillo, V.; Lufin, M.; Atienza, M. The impact of long-distance commuting on salaries and employment in host regions in Chile. J. Reg. Sci. 2023, 64, 462–490. [Google Scholar] [CrossRef]
- Ferrada, L.M.; Soza-Amigo, S.; Mancilla, C. Explicando La Conmutacion Laboral: El Caso De La Patagonia Chilena Explaining Labor Commutation: The Case of Chilean Patagonia. Rev. Anál. Econ. 2019, 34, 131–151. [Google Scholar] [CrossRef]
- Betho, R.; Chelengo, M.; Jones, S.; Keller, M.; Hassane, I.; Van Seventer, D.; Tarp, F. The macroeconomic impact of COVID-19 in Mozambique: A social accounting matrix approach. J. Int. Dev. 2021, 34, 823–860. [Google Scholar] [CrossRef]
- Henning, M. Regional labour flows between manufacturing and business services: Reciprocal integration and uneven geography. Eur. Urban Reg. Stud. 2019, 27, 290–302. [Google Scholar] [CrossRef]
- Lyons, M.S. The economic impact of COVID-19 on the creative industries: A sub-regional input–output approach. Lett. Spat. Resour. Sci. 2023, 16, 4. [Google Scholar] [CrossRef]
- Khlystova, O.; Kalyuzhnova, Y.; Belitski, M. The impact of the COVID-19 pandemic on the creative industries: A literature review and future research agenda. J. Bus. Res. 2022, 139, 1192–1210. [Google Scholar] [CrossRef] [PubMed]
- Castillo, C.; Mendez, L. Conmutación Laboral de Larga Distancia de los Trabajadores y Trabajadoras de la Región de la Araucanía; Estudios del Trabajo desde el Sur; Primera Edición; Ariadna Ediciones: Santiago, Chile, 2023; Volume 1, pp. 33–54. Available online: https://ariadnaediciones.cl/images/pdf/EstudiosTrabajoDesdeElSurVolV.pdf (accessed on 2 May 2025).
- Kim, J.; Kwan, M.P. The impact of the COVID-19 pandemic on people’s mobility: A longitudinal study of the U.S. from March to September of 2020. J. Transp. Geogr. 2021, 93, 103039. [Google Scholar] [CrossRef] [PubMed]
- Carriel, V.; Lufin, M.; Pérez-Trujillo, M. Do workers negative self-select when they commute? Evidence for the Chilean case of long-distance commuting. Ann. Reg. Sci. 2022, 69, 255–279. [Google Scholar] [CrossRef]
- Hazans, M. Does Commuting Reduce Wage Disparities? Growth Change 2004, 35, 360–390. [Google Scholar] [CrossRef]
- Cui, B.; Boisjoly, G.; El-Geneidy, A.; Levinson, D. Accessibility and the journey to work through the lens of equity. J. Transp. Geogr. 2019, 74, 269–277. [Google Scholar] [CrossRef]
- Notowidigdo, M.J. The Incidence of Local Labor Demand Shocks. Labor Econ. 2020, 38, 687–725. [Google Scholar] [CrossRef]
- Premji, S. Precarious Employment and Difficult Daily Commutes. Relat. Ind./Ind. Relat. 2017, 72, 77–98. [Google Scholar] [CrossRef]
- Halimah, P.; Chotib. Spatial entrapment of women workers in metropolitan areas. Int. J. Geomate 2021, 20, 98–104. [Google Scholar] [CrossRef]
- Bergantino, A.S.; Madio, L. Intra- and inter-regional commuting: Assessing the role of wage differentials. Pap. Reg. Sci. 2019, 98, 1085–1115. [Google Scholar] [CrossRef]
- Rosenbaum, P.R.; Robin, B.D. The central role of the propensity score in observational studies for causal effects. Biometrika 1983, 70, 41–55. [Google Scholar] [CrossRef]
- Bryson, A.; Dorsett, R.; Purdon, S. The Use of Propensity Score Matching in the Evaluation of Active Labour Market Policies; Department for Work and Pensions: London, UK, 2002; Volume 4, pp. 1–57. Available online: https://westminsterresearch.westminster.ac.uk/item/93w23/the-use-of-propensity-score-matching-in-the-evaluation-of-active-labour-market-policies (accessed on 6 January 2025).
- Becker, S.; Caliendo, M. Sensitivity Analysis for Average Treatment Effects. Stata J. 2007, 7, 71–83. [Google Scholar] [CrossRef]
- Supplementary Survey of Income. Available online: https://www.ine.gob.cl/statistics/social/individual-income-and-expenses/supplementary-survey-on-income (accessed on 3 January 2024).

| Mean | Standard Error | Number of Observations | Mean | Standard Error | Number of Observations | ||
|---|---|---|---|---|---|---|---|
| Agriculture | 0.0633 | 0.0006 | 182,922 | Income | 783,007.6 | 2236.0 | 1,789,770 |
| Mining | 0.0151 | 0.0003 | 182,922 | Working hours | 40.4618 | 0.0353 | 171,739 |
| Industry | 0.1053 | 0.0007 | 182,748 | t2018 | 0.2047 | 0.0009 | 44,189 |
| Construction | 0.1527 | 0.0008 | 182,748 | t2019 | 0.2091 | 0.0010 | 40,523 |
| Commerce | 0.2829 | 0.0011 | 182,748 | t2020 | 0.1816 | 0.0009 | 25,093 |
| Service | 0.3806 | 0.0011 | 182,748 | t2021 | 0.1983 | 0.0009 | 37,124 |
| Male | 0.5802 | 0.0012 | 182,922 | t2022 | 0.2063 | 0.0009 | 35,993 |
| Head of household | 0.4557 | 0.0012 | 182,922 | Great North | 0.1018 | 0.0005 | 16,922 |
| Primary education | 0.1370 | 0.0008 | 182,922 | Small North | 0.0902 | 0.0005 | 13,746 |
| Secondary education | 0.4195 | 0.0012 | 182,720 | Center | 0.1857 | 0.0008 | 24,396 |
| Tertiary education | 0.4433 | 0.0012 | 182,720 | Metropolitan | 0.2080 | 0.0011 | 16,789 |
| Full-time work | 0.8072 | 0.0010 | 172,036 | South | 0.2519 | 0.0009 | 35,481 |
| Informal employment | 0.2616 | 0.0010 | 182,922 | Patagonia | 0.1624 | 0.0006 | 27,929 |
| Age | 42.5062 | 0.0312 | 182,922 |
| Model 1 | Model 2 | Model 3 | |||||||
|---|---|---|---|---|---|---|---|---|---|
| Coef | dy/dx | p > z | Coef | dy/dx | p > z | Coef | dy/dx | p > z | |
| Mining | 1.673 | 0.252 | *** | 1.539 | 0.127 | *** | 1.268 | 0.103 | *** |
| (0.064) | (0.066) | (0.071) | |||||||
| Construction | 0.286 | 0.026 | *** | 0.294 | 0.013 | *** | 0.387 | 0.021 | *** |
| (0.028) | (0.032) | (0.033) | |||||||
| Industry | −0.008 | −0.001 | 0.022 | 0.001 | 0.066 | 0.003 | |||
| (0.034) | (0.035) | (0.035) | |||||||
| Commerce | −0.318 | −0.022 | *** | −0.296 | −0.010 | *** | −0.203 | −0.008 | *** |
| (0.025) | (0.026) | (0.027) | |||||||
| Agriculture | −0.707 | −0.043 | *** | −0.473 | −0.015 | *** | −0.414 | −0.016 | *** |
| (0.037) | (0.040) | (0.043) | |||||||
| Small North | 0.950 | 0.112 | *** | 1.017 | 0.065 | *** | 1.079 | 0.080 | *** |
| (0.046) | (0.046) | (0.049) | |||||||
| Center | 1.609 | 0.238 | *** | 1.637 | 0.141 | *** | 1.741 | 0.173 | *** |
| (0.040) | (0.041) | (0.044) | |||||||
| Metropolitan | 2.845 | 0.537 | *** | 2.875 | 0.393 | *** | 2.980 | 0.447 | *** |
| (0.040) | (0.041) | (0.043) | |||||||
| South | 1.374 | 0.189 | *** | 1.443 | 0.114 | *** | 1.547 | 0.142 | *** |
| (0.040) | (0.040) | (0.043) | |||||||
| Patagonia | −0.092 | −0.007 | −0.050 | −0.002 | −0.023 | −0.001 | |||
| (0.049) | (0.050) | (0.052) | |||||||
| Male | 0.361 | 0.017 | *** | 0.252 | 0.013 | *** | |||
| (0.022) | (0.023) | ||||||||
| Household Head | −0.001 | 0.000 | −0.135 | −0.006 | *** | ||||
| (0.022) | (0.023) | ||||||||
| Age | 0.026 | 0.001 | *** | −0.015 | −0.001 | ** | |||
| (0.004) | (0.005) | ||||||||
| Age2 | 0.000 | 0.000 | *** | 0.000 | 0.000 | + | |||
| (0.000) | (0.000) | ||||||||
| Secondary Education | 0.386 | 0.018 | *** | 0.163 | 0.008 | *** | |||
| (0.032) | (0.034) | ||||||||
| Tertiary Education | 0.855 | 0.051 | *** | 0.322 | 0.017 | *** | |||
| (0.034) | (0.039) | ||||||||
| Informal Employment | −0.773 | −0.025 | *** | ||||||
| (0.031) | |||||||||
| Full-time Work | 0.456 | 0.025 | *** | ||||||
| (0.031) | |||||||||
| Ln(Earning per Hour) | 0.371 | 0.017 | *** | ||||||
| (0.017) | |||||||||
| t2019 | −0.019 | −0.002 | −0.031 | −0.001 | −0.026 | −0.001 | |||
| (0.032) | (0.033) | (0.034) | |||||||
| t2020 | −0.173 | −0.013 | *** | −0.222 | −0.008 | *** | −0.226 | −0.009 | *** |
| (0.033) | (0.034) | (0.036) | |||||||
| t2021 | −0.175 | −0.013 | *** | −0.211 | −0.008 | *** | −0.212 | −0.009 | *** |
| (0.029) | (0.030) | (0.031) | |||||||
| t2022 | −0.092 | −0.007 | ** | −0.130 | −0.005 | *** | −0.131 | −0.006 | *** |
| (0.029) | (0.030) | (0.031) | |||||||
| Constant | −2.335 | *** | −3.523 | *** | −6.096 | *** | |||
| (0.044) | (0.109) | (0.192) | |||||||
| N | 182,748.0 | 182,547.0 | 168,132.0 | ||||||
| Pseudo r2 | 0.1511 | 0.1705 | 0.2030 | ||||||
| BIC | 46,745,491.9 | 45,607,067.6 | 40,708,063.1 | ||||||
| #Pr(conmuta) | 0.0883 | 0.04157 | 0.0473 | ||||||
| Correctly classified (%) | 69.17 | 68.77 | 66.06 | ||||||
| Positive predictive (%) | 74.02 | 77.73 | 82.36 | ||||||
| Negative predictive (%) | 66.24 | 63.36 | 56.22 | ||||||
| Great North | Small North | Center | South | Patagonia | Metropolitan | |||||||
|---|---|---|---|---|---|---|---|---|---|---|---|---|
| Minning | 0.159 | *** | 0.250 | *** | 0.203 | *** | 0.571 | *** | 0.283 | *** | 0.046 | |
| Construction | 0.040 | *** | 0.069 | *** | 0.061 | *** | 0.126 | *** | 0.049 | *** | 0.060 | *** |
| Industry | 0.042 | *** | 0.023 | * | 0.016 | + | 0.050 | *** | 0.036 | *** | −0.021 | |
| Commerce | −0.031 | *** | −0.016 | * | −0.025 | *** | −0.016 | * | −0.011 | * | −0.056 | *** |
| Agriculture | −0.031 | 0.007 | −0.042 | *** | −0.005 | 0.053 | *** | −0.298 | *** | |||
| Male | 0.062 | *** | 0.047 | *** | 0.054 | *** | 0.050 | *** | 0.019 | *** | 0.044 | *** |
| Household Head | 0.001 | −0.009 | * | −0.020 | *** | −0.027 | *** | −0.009 | * | −0.032 | *** | |
| Age | 0.005 | ** | 0.001 | + | 0.000 | −0.001 | −0.001 | −0.006 | *** | |||
| Age2 | 0.000 | *** | 0.000 | * | 0.000 | 0.000 | 0.000 | 0.000 | ** | |||
| Secondary Education | −0.016 | 0.040 | *** | 0.035 | *** | 0.032 | *** | −0.003 | 0.040 | ** | ||
| Tertiary Education | −0.024 | * | 0.051 | *** | 0.080 | *** | 0.057 | *** | 0.003 | 0.085 | *** | |
| Informal Employment | −0.039 | *** | −0.034 | *** | −0.065 | *** | −0.095 | *** | −0.030 | *** | −0.195 | *** |
| Full-time Work | −0.001 | 0.021 | ** | 0.074 | *** | 0.063 | *** | 0.006 | 0.138 | *** | ||
| Ln(Earning per Hour) | 0.032 | ** | 0.029 | *** | 0.063 | *** | 0.067 | *** | 0.012 | *** | 0.088 | *** |
| t2019 | −0.005 | −0.001 | 0.028 | ** | −0.078 | *** | −0.001 | 0.028 | * | |||
| t2020 | −0.018 | * | −0.014 | * | −0.019 | * | −0.091 | *** | −0.015 | *** | −0.020 | |
| t2021 | −0.011 | −0.012 | * | −0.018 | * | −0.094 | *** | −0.007 | −0.018 | |||
| t2022 | 0.000 | 0.001 | −0.007 | −0.080 | *** | −0.013 | * | −0.002 | ||||
| N | 17,051 | 14,836 | 31,452 | 41,912 | 27,543 | 35,338 | ||||||
| r2 | 0.0986 | 0.1603 | 0.0816 | 0.0737 | 0.0518 | 0.0814 | ||||||
| Wald chi2(18) | 516.22 | 962.47 | 1327.83 | 1687.53 | 387.74 | 1763.71 | ||||||
| #Pr(conmuta) | 0.0825 | 0.0713 | 0.1648 | 0.2244 | 0.0584 | 0.4514 | ||||||
| Average age | 41.192 | 43.205 | 43.059 | 43.217 | 42.856 | 41.834 | ||||||
| Average Monthly Hourly Income | 15,684.3 | 13,314.4 | 13,497.8 | 12,269.9 | 13,805 | 16,385.6 | ||||||
| Correctly classified (%) | 58.37 | 60.16 | 59.46 | 58.72 | 58.40 | 46.9 | ||||||
| Positive predictive (%) | 12.15 | 30.87 | 63.04 | 71.09 | 12.99 | 95.09 | ||||||
| Negative predictive (%) | 86.28 | 77.84 | 57.29 | 51.26 | 85.82 | 17.8 | ||||||
Disclaimer/Publisher’s Note: The statements, opinions and data contained in all publications are solely those of the individual author(s) and contributor(s) and not of MDPI and/or the editor(s). MDPI and/or the editor(s) disclaim responsibility for any injury to people or property resulting from any ideas, methods, instructions or products referred to in the content. |
© 2025 by the authors. Licensee MDPI, Basel, Switzerland. This article is an open access article distributed under the terms and conditions of the Creative Commons Attribution (CC BY) license (https://creativecommons.org/licenses/by/4.0/).
Share and Cite
Ferrada, L.M.; Mancilla, C.; Soza-Amigo, S. Effects on Territorial Dynamics and Labor Commuting During the Pre- and Post-Pandemic Period in Chile. Societies 2025, 15, 133. https://doi.org/10.3390/soc15050133
Ferrada LM, Mancilla C, Soza-Amigo S. Effects on Territorial Dynamics and Labor Commuting During the Pre- and Post-Pandemic Period in Chile. Societies. 2025; 15(5):133. https://doi.org/10.3390/soc15050133
Chicago/Turabian StyleFerrada, Luz María, Claudio Mancilla, and Sergio Soza-Amigo. 2025. "Effects on Territorial Dynamics and Labor Commuting During the Pre- and Post-Pandemic Period in Chile" Societies 15, no. 5: 133. https://doi.org/10.3390/soc15050133
APA StyleFerrada, L. M., Mancilla, C., & Soza-Amigo, S. (2025). Effects on Territorial Dynamics and Labor Commuting During the Pre- and Post-Pandemic Period in Chile. Societies, 15(5), 133. https://doi.org/10.3390/soc15050133