


The Impact of Family Complexity on the Risk of Developmental Delay and Socio-Emotional Difficulties in Early Childhood

Abstract
1. Introduction
2. Methods
2.1. Data
2.2. Measures
2.2.1. Dependent Variables: Developmental Delay and Socio-Emotional Difficulties
Risk of Developmental Delay
Socio-Emotional Difficulties
2.2.2. Predictor Variable: Family Complexity
- Biological child, with two parents, only with full (if any) siblings (83.1%);
- Biological child, with two parents with half- and/or step-siblings (8.4%);
- Step-child, with two parents (1.5%);
- Child with a single mother (7%).
2.2.3. Moderator Variables
Mother’s Highest Educational Attainment
Covering Household Expenses
Place of Residence of the Mother at the Time of Birth
Relationship Quality of the Biological Parents of the Children
2.2.4. Control Variables
Birthweight
Sex of the Cohort Child
Age of the 3-Year-Old Cohort Child, in Months
Maternal Age at Birth of the Cohort Child
Siblings in the Household, by Siblings’ Age
2.3. Statistical Analyses
3. Results
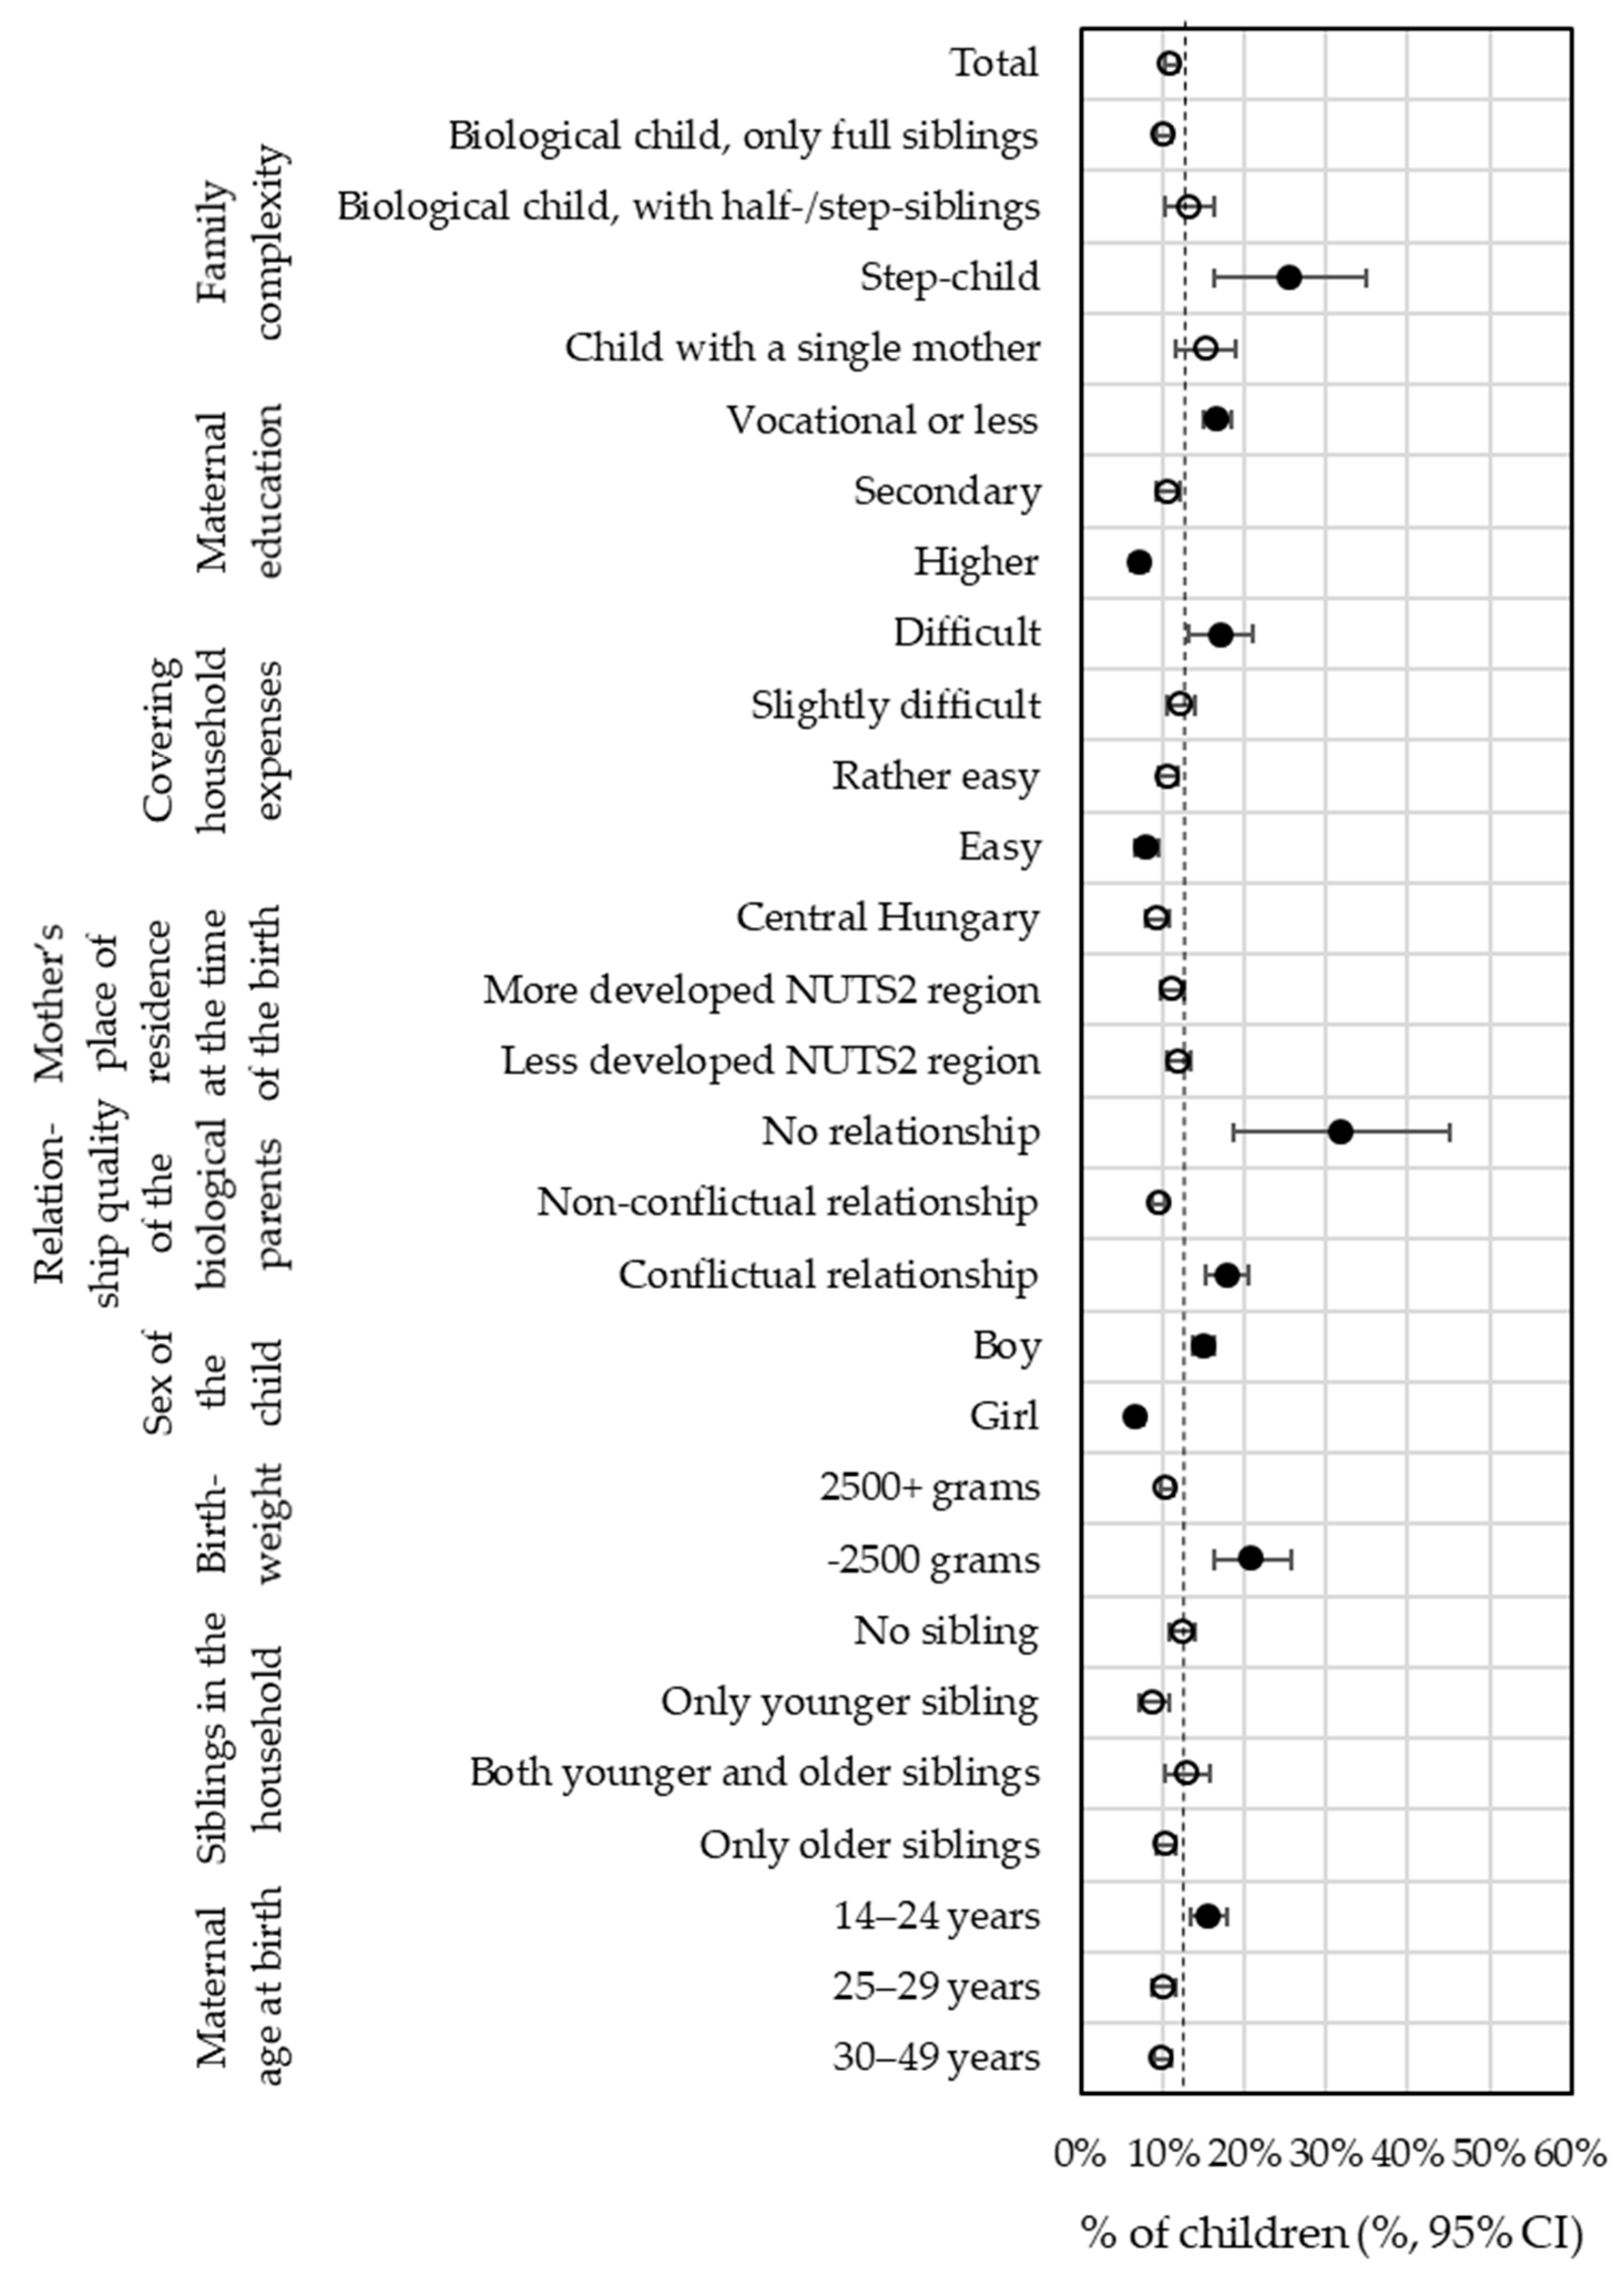
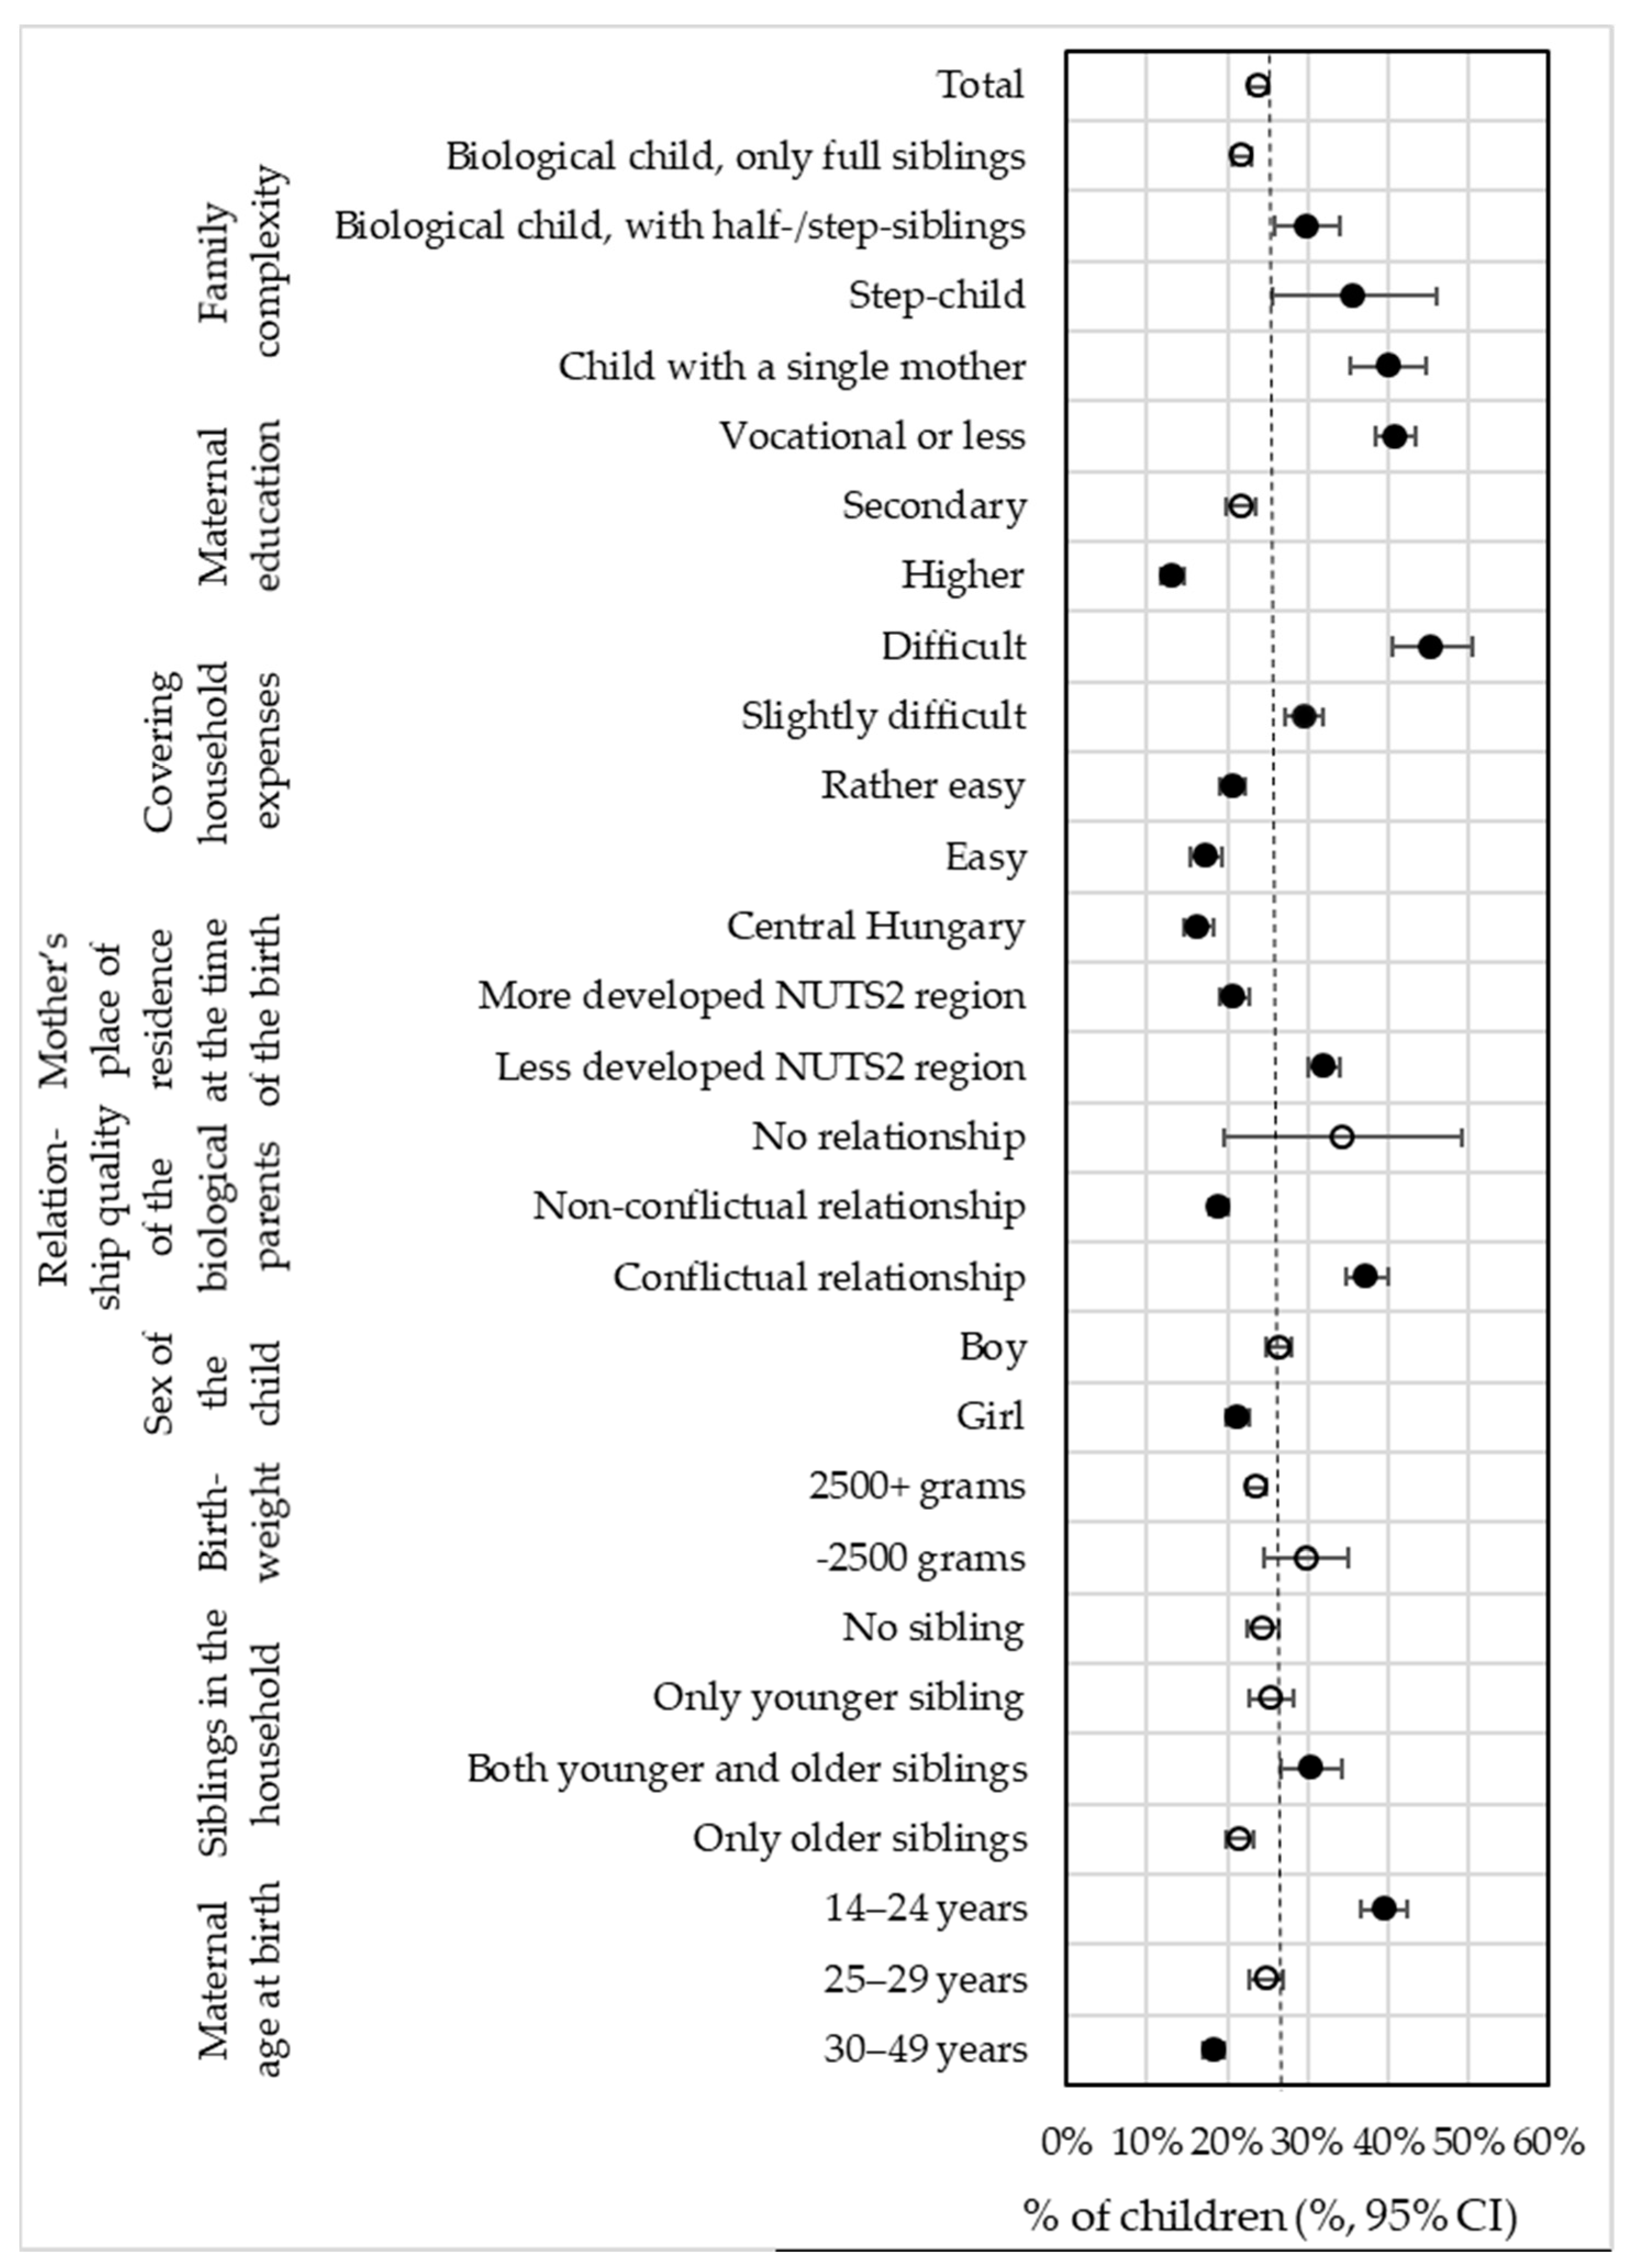
3.1. Bivariate Analyses
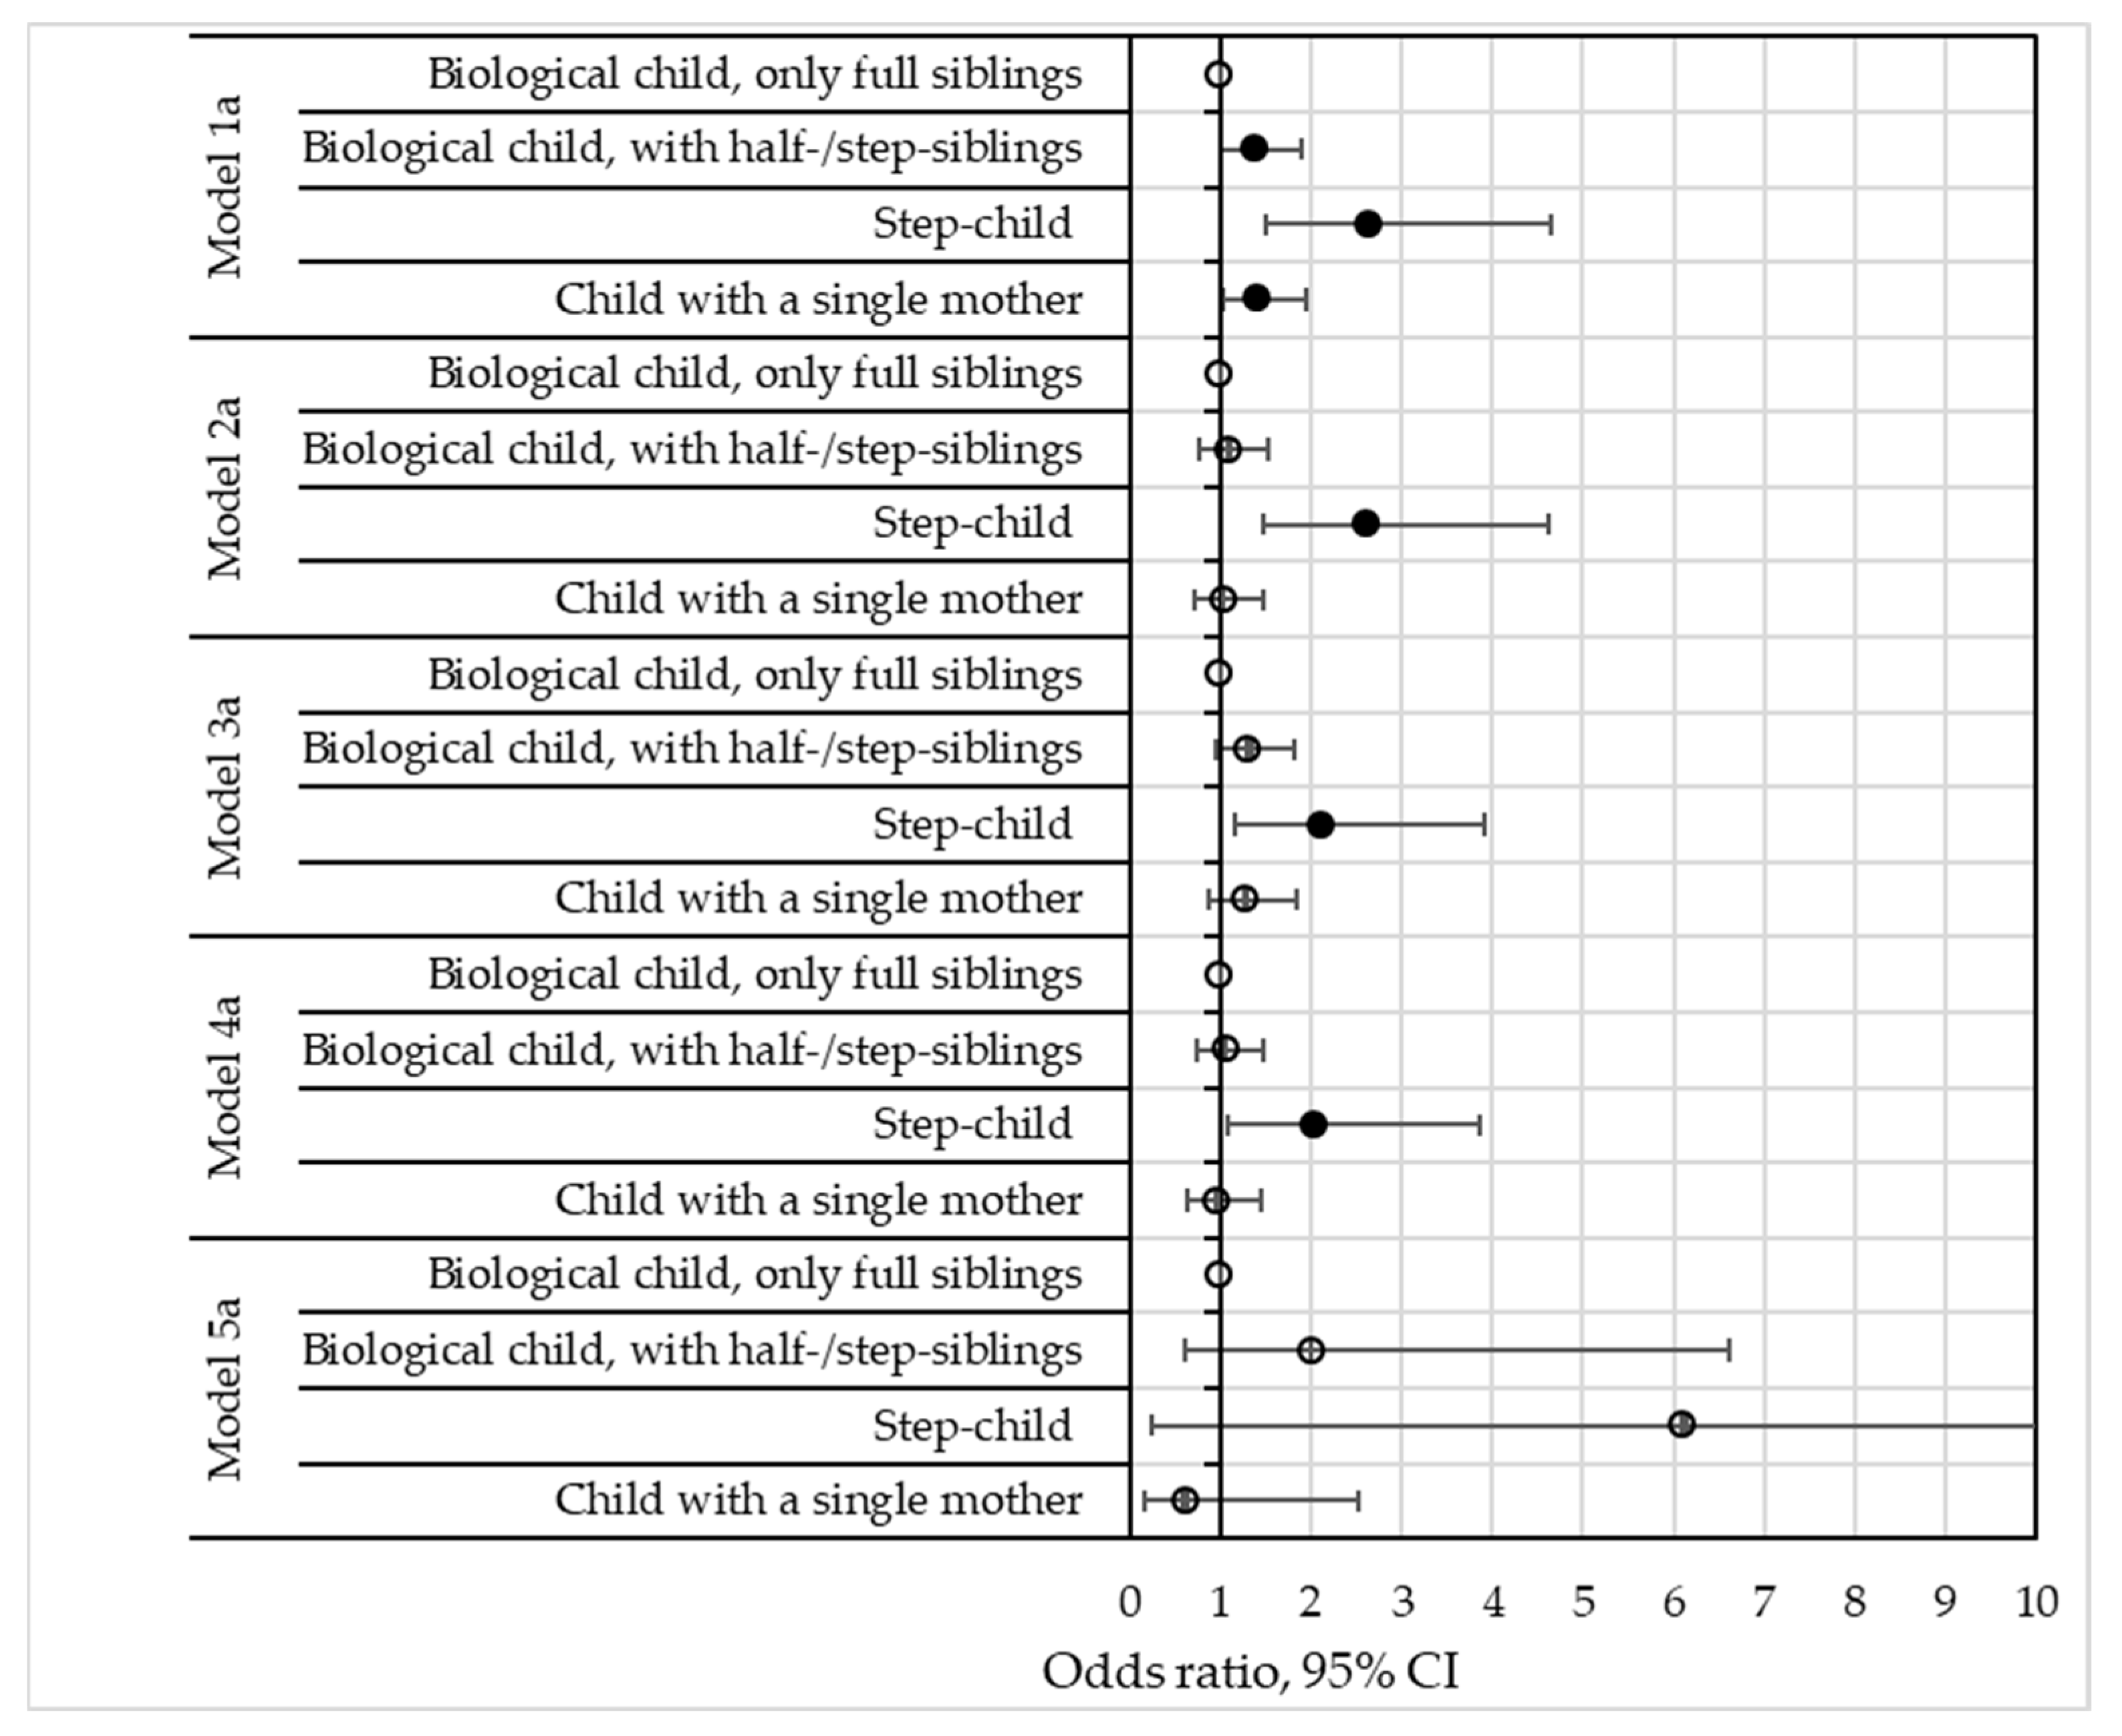
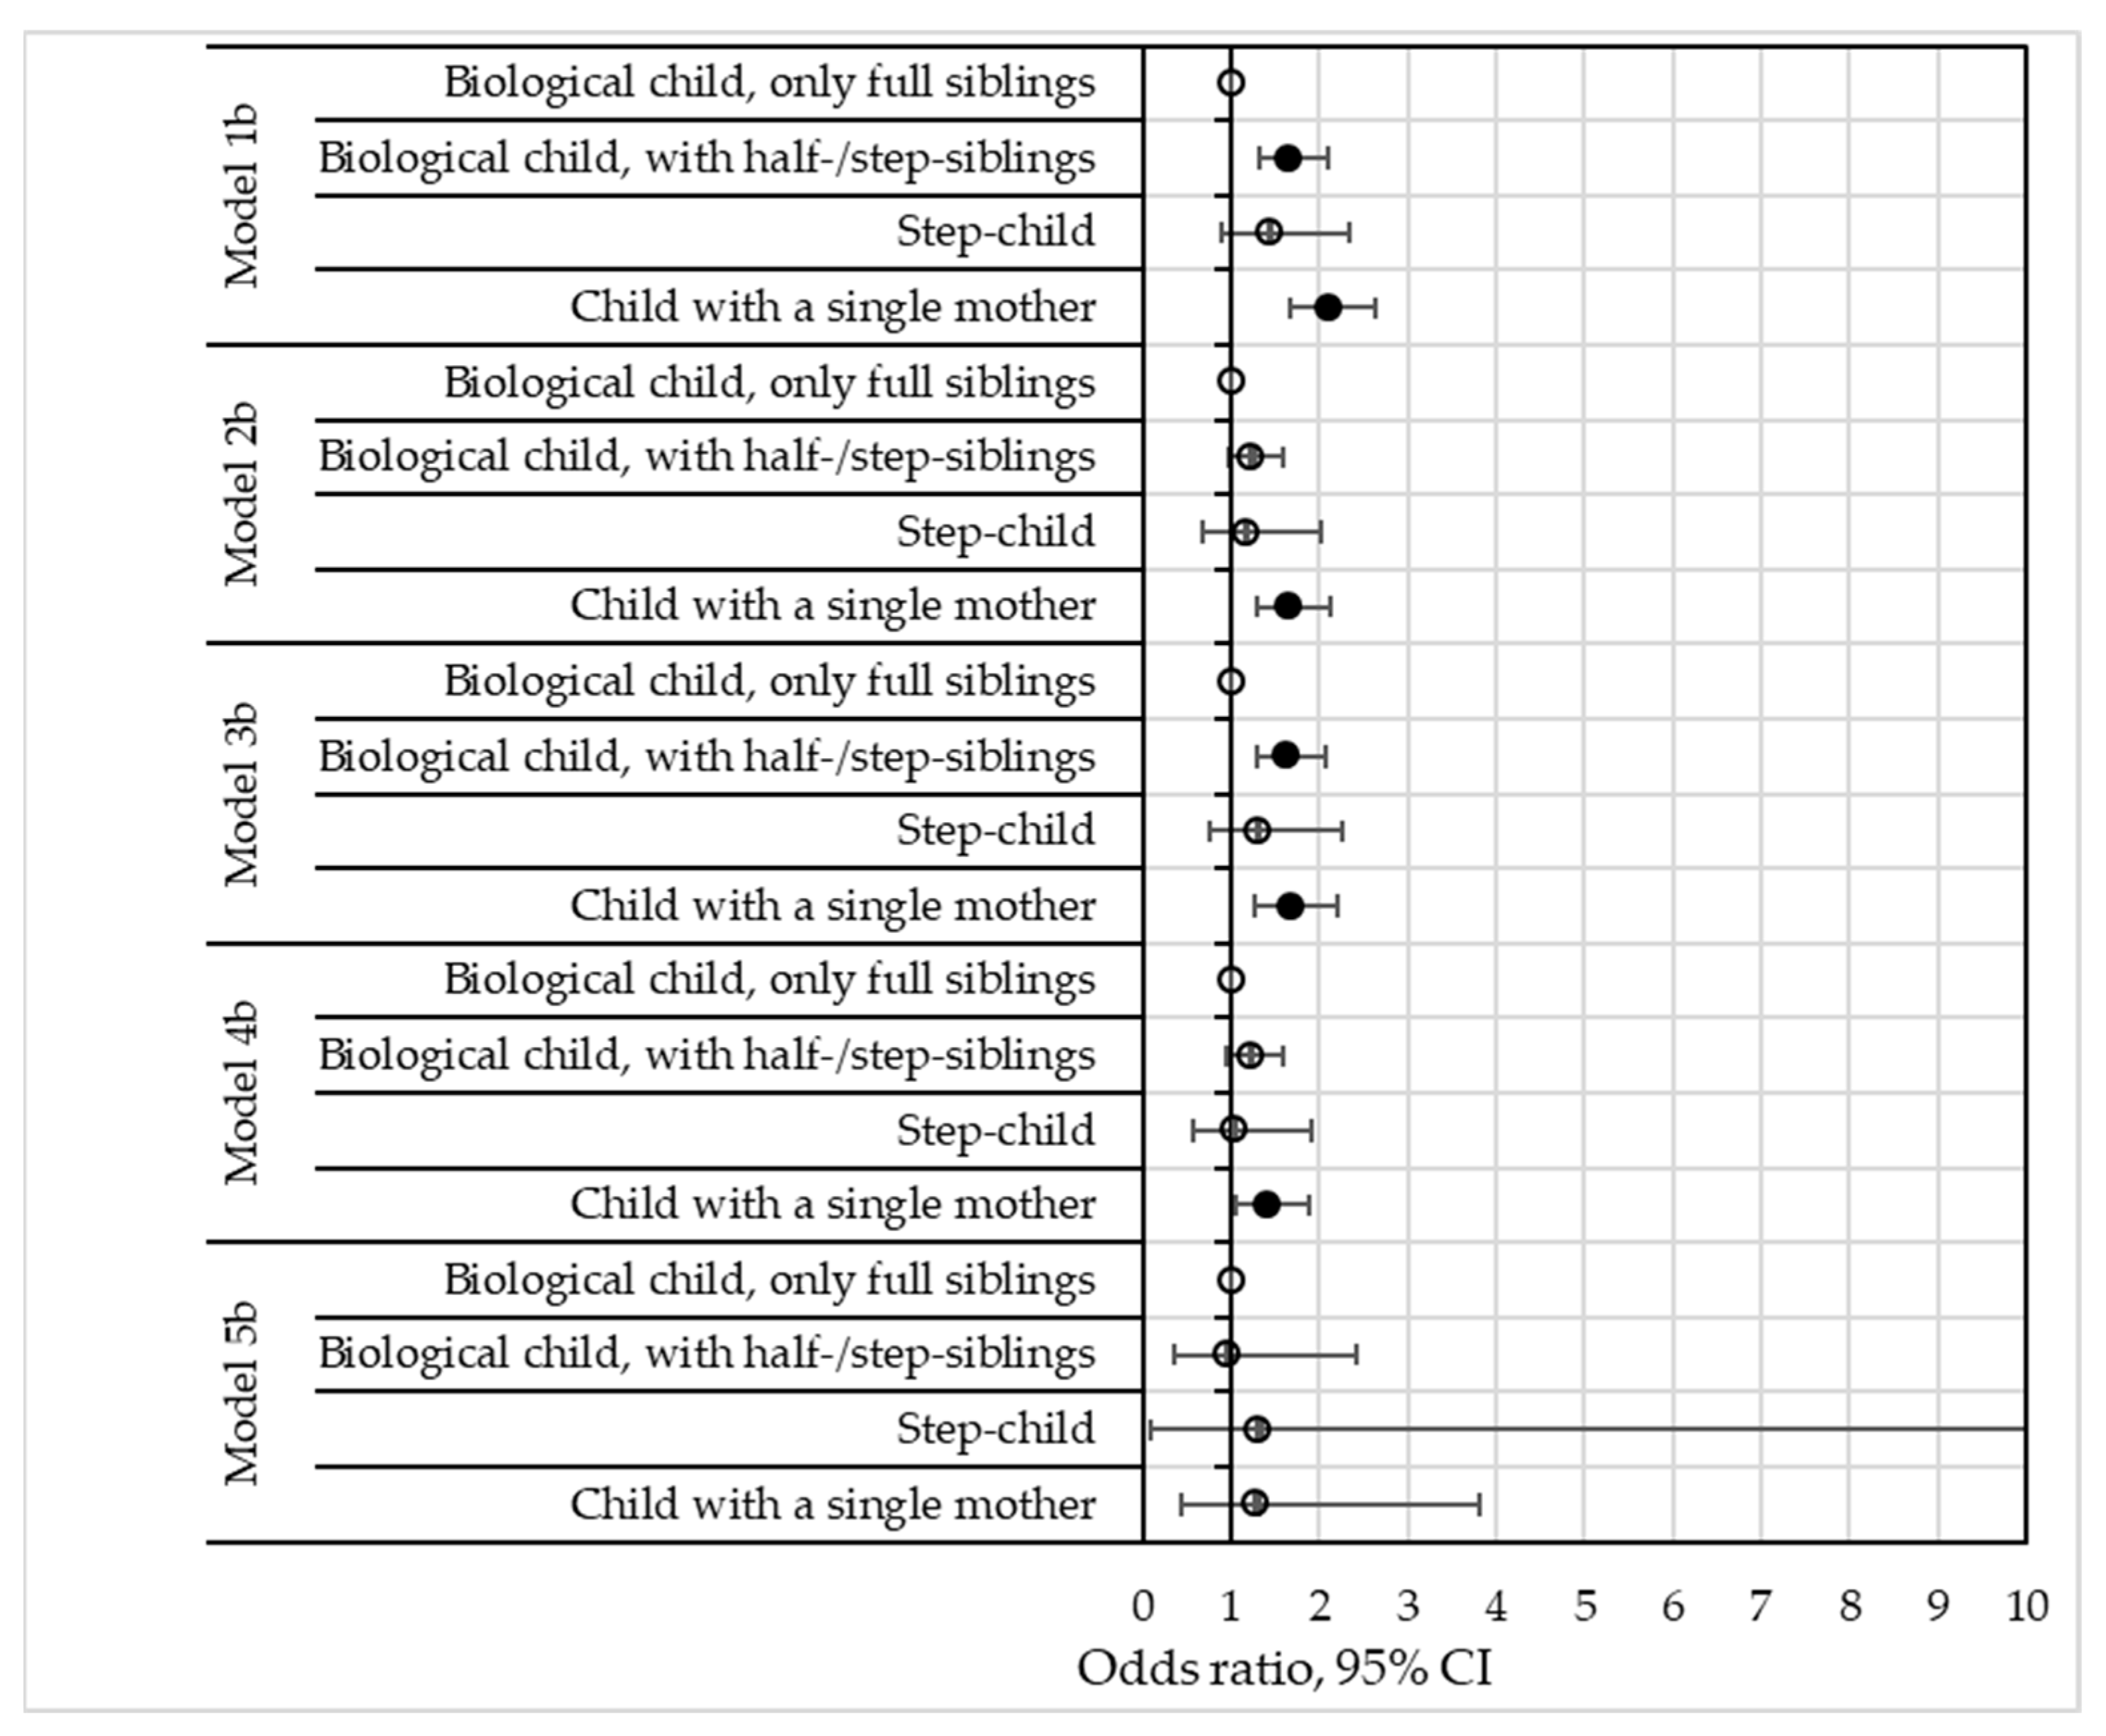
3.2. Logistic Regression Analyses
Q1: Are there significant differences in the risk to children of developmental delay and socio-emotional difficulties according to their family complexity at age 3?
Q2: Are the benefits to children in full biological (intact) families due to a selection effect by high socioeconomic status, measured by parental educational attainment (Q2a), financial background (Q2b) and regional location of residence (Q2c)?
Q3: How are the relationships between family structure and child outcomes affected by interparental conflict?
Q4: Which of the combined patterns of family structure, educational attainment and interparental conflict put children at highest risk of developmental delay and socio-emotional difficulties in early childhood?
4. Discussion
Author Contributions
Funding
Institutional Review Board Statement
Informed Consent Statement
Data Availability Statement
Conflicts of Interest
Appendix A

| Risk of Developmental Delay (Based on ASQ-3) | Model 1a. | Model 2a. | Model 3a. | Model 4a. | Model 5a. | |||||
|---|---|---|---|---|---|---|---|---|---|---|
| OR | P > |z| | OR | P > |z| | OR | P > |z| | OR | P > |z| | OR | P > |z| | |
| Age of the mother (Ref. 25–29 years old) | ||||||||||
| 14–24 years old | 1.559 | 0.001 | 1.212 | 0.179 | 1.500 | 0.002 | 1.195 | 0.220 | 1.191 | 0.233 |
| 30–49 years old | 1.007 | 0.948 | 1.177 | 0.174 | 1.014 | 0.904 | 1.187 | 0.157 | 1.183 | 0.169 |
| Sex of child (girl) | 0.379 | 0.000 | 0.366 | 0.000 | 0.367 | 0.000 | 0.358 | 0.000 | 0.361 | 0.000 |
| Age of child (month) | 0.778 | 0.000 | 0.783 | 0.000 | 0.775 | 0.000 | 0.779 | 0.000 | 0.766 | 0.000 |
| Born with LBW (yes) | 2.526 | 0.000 | 2.263 | 0.000 | 2.471 | 0.000 | 2.208 | 0.000 | 2.276 | 0.000 |
| Sibling composition in household by their age (Ref. No sibling) | ||||||||||
| Only younger sibling | 0.714 | 0.016 | 0.745 | 0.045 | 0.730 | 0.027 | 0.758 | 0.061 | 0.758 | 0.062 |
| Both younger and older sibling | 1.007 | 0.967 | 0.935 | 0.698 | 1.028 | 0.868 | 0.961 | 0.821 | 0.940 | 0.730 |
| Only older sibling | 0.892 | 0.306 | 0.791 | 0.045 | 0.919 | 0.458 | 0.820 | 0.094 | 0.834 | 0.126 |
| Family complexity (Ref. Biological child, only full siblings) | ||||||||||
| Biological child, with half- and/or step-siblings | 1.383 | 0.044 | 1.093 | 0.606 | 1.316 | 0.091 | 1.056 | 0.755 | 2.001 | 0.256 |
| Step-child | 2.644 | 0.001 | 2.616 | 0.001 | 2.129 | 0.015 | 2.048 | 0.027 | 6.102 | 0.275 |
| Child with a single mother | 1.412 | 0.033 | 1.031 | 0.866 | 1.270 | 0.203 | 0.956 | 0.833 | 0.615 | 0.499 |
| Educational attainment of the mother (Ref. At most vocational education ISCED-97: 0, 1, 2, 3C) | ||||||||||
| Secondary (ISCED-97: 3A, 3B, 4) | 0.649 | 0.001 | 0.664 | 0.001 | 0.614 | 0.002 | ||||
| Higher (ISCED-97: 5, 6) | 0.439 | 0.000 | 0.456 | 0.000 | 0.446 | 0.000 | ||||
| Covering household expenses (Ref. Very difficult or difficult) | ||||||||||
| Slightly difficult | 0.782 | 0.193 | 0.770 | 0.182 | 0.807 | 0.345 | ||||
| Rather easy | 0.766 | 0.155 | 0.774 | 0.184 | 0.781 | 0.267 | ||||
| Easy or very easy | 0.616 | 0.024 | 0.627 | 0.033 | 0.631 | 0.063 | ||||
| Residence place of mother at the time of pregnancy (Ref. Central Hungary NUTS2 region) | ||||||||||
| Developed NUTS2 region | 0.995 | 0.965 | 1.032 | 0.799 | 1.012 | 0.779 | ||||
| Less developed NUTS2 region | 0.938 | 0.615 | 0.976 | 0.848 | 0.993 | 0.758 | ||||
| Quality of relationship with biological father of the child (Ref. Non-conflictual relationship) | ||||||||||
| Conflictual relationship | 1.946 | 0.000 | 1.870 | 0.000 | 1.527 | 0.047 | ||||
| No relationship | 3.042 | 0.004 | 3.333 | 0.003 | 5.648 | 0.012 | ||||
| Family complexity * Educational attainment of mother | ||||||||||
| Biological child, with half- and/or step-siblings * Secondary | 0.878 | 0.773 | ||||||||
| Biological child, with half- and/or step-siblings * Higher | 1.358 | 0.567 | ||||||||
| Step-child * Secondary | 2.854 | 0.217 | ||||||||
| Step-child * Higher | 1.675 | 0.734 | ||||||||
| Child with a single mother * Secondary | 0.488 | 0.226 | ||||||||
| Child with a single mother * Higher | 0.240 | 0.212 | ||||||||
| Family complexity * Covering household expenses | ||||||||||
| Biological child, with half- and/or step-siblings * Slightly difficult | 0.543 | 0.260 | ||||||||
| Biological child, with half- and/or step-siblings * Rather easy | 0.675 | 0.471 | ||||||||
| Biological child, with half- and/or step-siblings * Easy or very easy | 0.427 | 0.232 | ||||||||
| Step-child * Slightly difficult | 0.245 | 0.343 | ||||||||
| Step-child * Rather easy | 0.084 | 0.084 | ||||||||
| Step-child * Easy or very easy | 0.232 | 0.377 | ||||||||
| Child with a single mother * Slightly difficult | 1.927 | 0.349 | ||||||||
| Child with a single mother * Rather easy | 3.031 | 0.108 | ||||||||
| Child with a single mother * Easy or very easy | 4.379 | 0.067 | ||||||||
| Family complexity * Place of residence | ||||||||||
| Biological child, with half- and/or step-siblings * More developed NUTS2 region | 1.018 | 0.968 | ||||||||
| Biological child, with half- and/or step-siblings * Less developed NUTS2 region | 0.604 | 0.266 | ||||||||
| Step-child * More developed NUTS2 region | 1.433 | 0.717 | ||||||||
| Step-child * Less developed NUTS2 region | 2.523 | 0.327 | ||||||||
| Child with a single mother * More developed NUTS2 region | 1.078 | 0.888 | ||||||||
| Child with a single mother * Less developed NUTS2 region | 0.838 | 0.746 | ||||||||
| Family complexity * Quality of relationship with biological father | ||||||||||
| Biological child, full siblings * No relationship | 1 | |||||||||
| Biological child, half-/step-siblings * Conflictual relationship | 1.214 | 0.700 | ||||||||
| Biological child, half-/step-siblings * No relationship | 1 | |||||||||
| Step-child * Conflictual relationship | 0.509 | 0.470 | ||||||||
| Step-child * No relationship | 0.511 | 0.647 | ||||||||
| Child with a single mother * Conflictual relationship | 0.936 | 0.916 | ||||||||
| Child with a single mother * No relationship | 1 | |||||||||
| Educational attainment of mother * Quality of relationship with biological father | ||||||||||
| Secondary * Conflictual relationship | 1.697 | 0.085 | ||||||||
| Secondary * No relationship | 2.613 | 0.594 | ||||||||
| Higher * Conflictual relationship | 1.353 | 0.318 | ||||||||
| Higher * No relationship | 1 | |||||||||
| Family complexity * Educational attainment of mother * Quality of relationship with biological father | ||||||||||
| Biological child, only with full siblings * Vocational or less * No relationship | 1 | |||||||||
| Biological child, only with full siblings * Secondary * No relationship | 1 | |||||||||
| Biological child, only with full siblings * Higher * No relationship | 1 | |||||||||
| Biological child, with half- and/or step-siblings * Vocational or less * No relationship | 1 | |||||||||
| Biological child, with half- and/or step-siblings * Secondary * Conflictual relationship | 1.046 | 0.956 | ||||||||
| Biological child, with half- and/or step-siblings * Secondary * No relationship | 1 | |||||||||
| Biological child, with half- and/or step-siblings * Higher * Conflictual relationship | 0.315 | 0.357 | ||||||||
| Biological child, with half- and/or step-siblings * Higher * No relationship | 1 | |||||||||
| Step-child * Secondary * Conflictual relationship | 0.488 | 0.696 | ||||||||
| Step-child * Secondary * No relationship | 1 | |||||||||
| Step-child * Higher * Conflictual relationship | 1 | |||||||||
| Step-child * Higher * No relationship | 1 | |||||||||
| Step-child * Secondary * Conflictual relationship | 0.745 | 0.808 | ||||||||
| Child with a single mother * Secondary * No relationship | 1 | |||||||||
| Child with a single mother * Higher * Conflictual relationship | 2.185 | 0.593 | ||||||||
| Child with a single mother * Higher * No relationship | 1 | |||||||||
| Constant | 1352.9 | 0.000 | 2420.0 | 0.000 | 1399.3 | 0.000 | 2356.2 | 0.000 | 4348.9 | 0.000 |
| Log pseudolikelihood | −1867.3 | −1733.0 | −1809.0 | −1681.1 | −1659.9 | |||||
| Number of obs. | 5775 | 5490 | 5692 | 5409 | 5391 | |||||
| Wald chi2(8) | 188.3 | 233.1 | 225.3 | 260.4 | 283.4 | |||||
| Prob > chi2 | 0.000 | 0.000 | 0.000 | 0.000 | 0.000 | |||||
| Pseudo R2 | 0.055 | 0.070 | 0.068 | 0.083 | 0.094 | |||||
| Socio-Emotional Difficulties (Based on SDQ) | Model 1b. | Model 2b. | Model 3b. | Model 4b. | Model 5b. | |||||
|---|---|---|---|---|---|---|---|---|---|---|
| OR | P > |z| | OR | P > |z| | OR | P > |z| | OR | P > |z| | OR | P > |z| | |
| Age of the mother (Ref. 25–29 years old) | ||||||||||
| 14–24 years old | 1.844 | 0.000 | 1.133 | 0.232 | 1.647 | 0.000 | 1.039 | 0.719 | 1.020 | 0.855 |
| 30–49 years old | 0.685 | 0.000 | 0.881 | 0.141 | 0.689 | 0.000 | 0.878 | 0.137 | 0.865 | 0.103 |
| Sex of child (girl) | 0.741 | 0.000 | 0.745 | 0.000 | 0.741 | 0.000 | 0.746 | 0.000 | 0.745 | 0.000 |
| Age of child (month) | 0.928 | 0.045 | 0.927 | 0.052 | 0.923 | 0.039 | 0.925 | 0.052 | 0.926 | 0.058 |
| Born with LBW (yes) | 1.334 | 0.035 | 0.948 | 0.718 | 1.348 | 0.034 | 0.970 | 0.843 | 0.954 | 0.763 |
| Sibling composition in household by their age (Ref. No sibling) | ||||||||||
| Only younger sibling | 1.090 | 0.377 | 1.242 | 0.036 | 1.128 | 0.226 | 1.290 | 0.015 | 1.283 | 0.018 |
| Both younger and older sibling | 1.270 | 0.042 | 0.992 | 0.948 | 1.208 | 0.123 | 0.969 | 0.814 | 0.956 | 0.735 |
| Only older sibling | 0.996 | 0.964 | 0.831 | 0.041 | 0.954 | 0.586 | 0.812 | 0.025 | 0.801 | 0.018 |
| Family complexity (Ref. Biological child, only full siblings) | ||||||||||
| Biological child, with half- and/or step-siblings | 1.658 | 0.000 | 1.235 | 0.100 | 1.634 | 0.000 | 1.229 | 0.112 | 0.946 | 0.908 |
| Step-child | 1.439 | 0.146 | 1.167 | 0.582 | 1.301 | 0.351 | 1.044 | 0.890 | 1.314 | 0.836 |
| Child with a single mother | 2.105 | 0.000 | 1.661 | 0.000 | 1.678 | 0.000 | 1.409 | 0.022 | 1.279 | 0.659 |
| Educational attainment of the mother (Ref. At most vocational education ISCED-97: 0,1,2,3C) | ||||||||||
| Secondary (ISCERD-97: 3A, 3B, 4) | 0.520 | 0.000 | 0.543 | 0.000 | 0.593 | 0.000 | ||||
| Higher (ISCED-97: 5, 6) | 0.326 | 0.000 | 0.340 | 0.000 | 0.350 | 0.000 | ||||
| Covering household expenses (Ref. Very difficult or difficult) | ||||||||||
| Slightly difficult | 0.692 | 0.007 | 0.712 | 0.019 | 0.742 | 0.087 | ||||
| Rather easy | 0.541 | 0.000 | 0.579 | 0.000 | 0.569 | 0.001 | ||||
| Easy or very easy | 0.493 | 0.000 | 0.527 | 0.000 | 0.509 | 0.000 | ||||
| Residence place of mother at the time of pregnancy (Ref. Central Hungary NUTS2 region) | ||||||||||
| Developed NUTS2 region | 1.053 | 0.589 | 1.104 | 0.311 | 1.038 | 0.729 | ||||
| Less developed NUTS2 region | 1.526 | 0.000 | 1.516 | 0.000 | 1.389 | 0.001 | ||||
| Quality of relationship with biological father of the child (Ref. Non-conflictual relationship) | ||||||||||
| Conflictual relationship | 2.705 | 0.000 | 2.558 | 0.000 | 3.084 | 0.000 | ||||
| No relationship | 1.129 | 0.712 | 1.108 | 0.759 | 2.266 | 0.125 | ||||
| Family complexity * Educational attainment of mother | ||||||||||
| Biological child, with half- and/or step-siblings * Secondary | 0.836 | 0.604 | ||||||||
| Biological child, with half- and/or step-siblings * Higher | 1.714 | 0.156 | ||||||||
| Step-child * Secondary | 0.353 | 0.207 | ||||||||
| Step-child * Higher | 1.482 | 0.733 | ||||||||
| Child with a single mother * Secondary | 0.420 | 0.043 | ||||||||
| Child with a single mother * Higher | 0.875 | 0.795 | ||||||||
| Family complexity * Covering household expenses | ||||||||||
| Biological child, with half- and/or step-siblings * Slightly difficult | 0.706 | 0.384 | ||||||||
| Biological child, with half- and/or step-siblings * Rather easy | 0.762 | 0.506 | ||||||||
| Biological child, with half- and/or step-siblings * Easy or very easy | 1.103 | 0.835 | ||||||||
| Step-child * Slightly difficult | 1.291 | 0.821 | ||||||||
| Step-child * Rather easy | 1.670 | 0.665 | ||||||||
| Step-child * Easy or very easy | 2.128 | 0.558 | ||||||||
| Child with a single mother * Slightly difficult | 0.948 | 0.912 | ||||||||
| Child with a single mother * Rather easy | 1.786 | 0.231 | ||||||||
| Child with a single mother * Easy or very easy | 1.294 | 0.658 | ||||||||
| Family complexity * Place of residence | ||||||||||
| Biological child, with half- and/or step-siblings * More developed NUTS2 region | 1.662 | 0.173 | ||||||||
| Biological child, with half- and/or step-siblings * Less developed NUTS2 region | 1.762 | 0.116 | ||||||||
| Step-child * More developed NUTS2 region | 1.617 | 0.555 | ||||||||
| Step-child * Less developed NUTS2 region | 0.878 | 0.873 | ||||||||
| Child with a single mother * More developed NUTS2 region | 1.194 | 0.687 | ||||||||
| Child with a single mother * Less developed NUTS2 region | 1.591 | 0.274 | ||||||||
| Family complexity * Quality of relationship with biological father | ||||||||||
| Biological child, full siblings * No relationship | 1 | |||||||||
| Biological child, half/step-siblings * Conflictual relationship | 0.626 | 0.215 | ||||||||
| Biological child, half/step-siblings * No relationship | 1 | |||||||||
| Step-child * Conflictual relationship | 0.326 | 0.175 | ||||||||
| Step-child * No relationship | 0.741 | 0.890 | ||||||||
| Child with a single mother * Conflictual relationship | 0.386 | 0.085 | ||||||||
| Child with a single mother * No relationship | 1 | |||||||||
| Educational attainment of mother * Quality of relationship with biological father | ||||||||||
| Secondary * Conflictual relationship | 0.738 | 0.202 | ||||||||
| Secondary * No relationship | 0.259 | 0.265 | ||||||||
| Higher * Conflictual relationship | 0.855 | 0.495 | ||||||||
| Higher * No relationship | 0.353 | 0.453 | ||||||||
| Family complexity * Educational attainment of mother * Quality of relationship with biological father | ||||||||||
| Biological child, only with full siblings * Vocational or less * No relationship | 1 | |||||||||
| Biological child, only with full siblings * Secondary * No relationship | 1 | |||||||||
| Biological child, only with full siblings * Higher * No relationship | 1 | |||||||||
| Biological child, with half- and/or step-siblings * Vocational or less * No relationship | 5.461 | 0.012 | ||||||||
| Biological child, with half- and/or step-siblings * Secondary * Conflictual relationship | 1 | |||||||||
| Biological child, with half- and/or step-siblings * Secondary * No relationship | 0.729 | 0.717 | ||||||||
| Biological child, with half- and/or step-siblings * Higher * Conflictual relationship | 1 | |||||||||
| Biological child, with half- and/or step-siblings * Higher * No relationship | 1 | |||||||||
| Step-child * Secondary * Conflictual relationship | 4.956 | 0.274 | ||||||||
| Step-child * Secondary * No relationship | 1 | |||||||||
| Step-child * Higher * Conflictual relationship | 1 | |||||||||
| Step-child * Higher * No relationship | 1 | |||||||||
| Child with a single mother * Secondary * Conflictual relationship | 4.388 | 0.106 | ||||||||
| Child with a single mother * Secondary * No relationship | 1 | |||||||||
| Child with a single mother * Higher * Conflictual relationship | 0.216 | 0.220 | ||||||||
| Child with a single mother * Higher * No relationship | 1 | |||||||||
| Constant | 4.8 | 0.244 | 13.7 | 0.065 | 5.0 | 0.250 | 11.7 | 0.094 | 11.5 | 0.099 |
| Log pseudolikelihood | −3037.2 | −2748.6 | −2896.5 | −2633.1 | −2604.5 | |||||
| Number of obs. | 5843 | 5551 | 5761 | 5471 | 5461 | |||||
| Wald chi2(8) | 245.1 | 470.2 | 316.6 | 486.9 | 540.9 | |||||
| Prob > chi2 | 0.000 | 0.000 | 0.000 | 0.000 | 0.000 | |||||
| Pseudo R2 | 0.044 | 0.089 | 0.061 | 0.100 | 0.109 | |||||
| Delta-Method | 95% CI | |||||
|---|---|---|---|---|---|---|
| Margin | Std. Err. | z | P > |z| | Lower | Upper | |
| Family complexity * Quality of relationship with biological father | ||||||
| Biological child, only full siblings * Non-conflictual relationship | 0.078 | 0.005 | 16.830 | 0.000 | 0.069 | 0.087 |
| Biological child, only full siblings * Conflictual relationship | 0.148 | 0.014 | 10.400 | 0.000 | 0.120 | 0.176 |
| Biological child, only full siblings * No relationship | – | |||||
| Biological child, with half- and/or step-siblings * Non-conflictual relationship | 0.082 | 0.017 | 4.940 | 0.000 | 0.049 | 0.114 |
| Biological child, with half- and/or step-siblings * Conflictual relationship | 0.126 | 0.050 | 2.540 | 0.011 | 0.029 | 0.223 |
| Biological child, with half- and/or step-siblings * No relationship | – | |||||
| Step-child * Non-conflictual relationship | 0.192 | 0.091 | 2.100 | 0.036 | 0.013 | 0.370 |
| Step-child * Conflictual relationship | – | |||||
| Step-child * No relationship | – | |||||
| Child with a single mother * Non-conflictual relationship | 0.058 | 0.024 | 2.430 | 0.015 | 0.011 | 0.106 |
| Child with a single mother * Conflictual relationship | 0.127 | 0.051 | 2.510 | 0.012 | 0.028 | 0.227 |
| Child with a single mother * No relationship | – | |||||
| Family complexity * Educational attainment of mother | ||||||
| Biological child, only full siblings * Vocational or less | – | |||||
| Biological child, only full siblings * Secondary | – | |||||
| Biological child, only full siblings * Higher | – | |||||
| Biological child, with half- and/or step-siblings * Vocational or less | – | |||||
| Biological child, with half- and/or step-siblings * Secondary | – | |||||
| Biological child, with half- and/or step-siblings * Higher | – | |||||
| Step-child * Vocational or less | 0.175 | 0.068 | 2.560 | 0.011 | 0.041 | 0.309 |
| Step-child * Secondary | 0.266 | 0.109 | 2.440 | 0.015 | 0.052 | 0.479 |
| Step-child * Higher | – | |||||
| Child with a single mother * Vocational or less | 0.191 | 0.048 | 4.000 | 0.000 | 0.098 | 0.285 |
| Child with a single mother * Secondary | – | |||||
| Child with a single mother * Higher | – | |||||
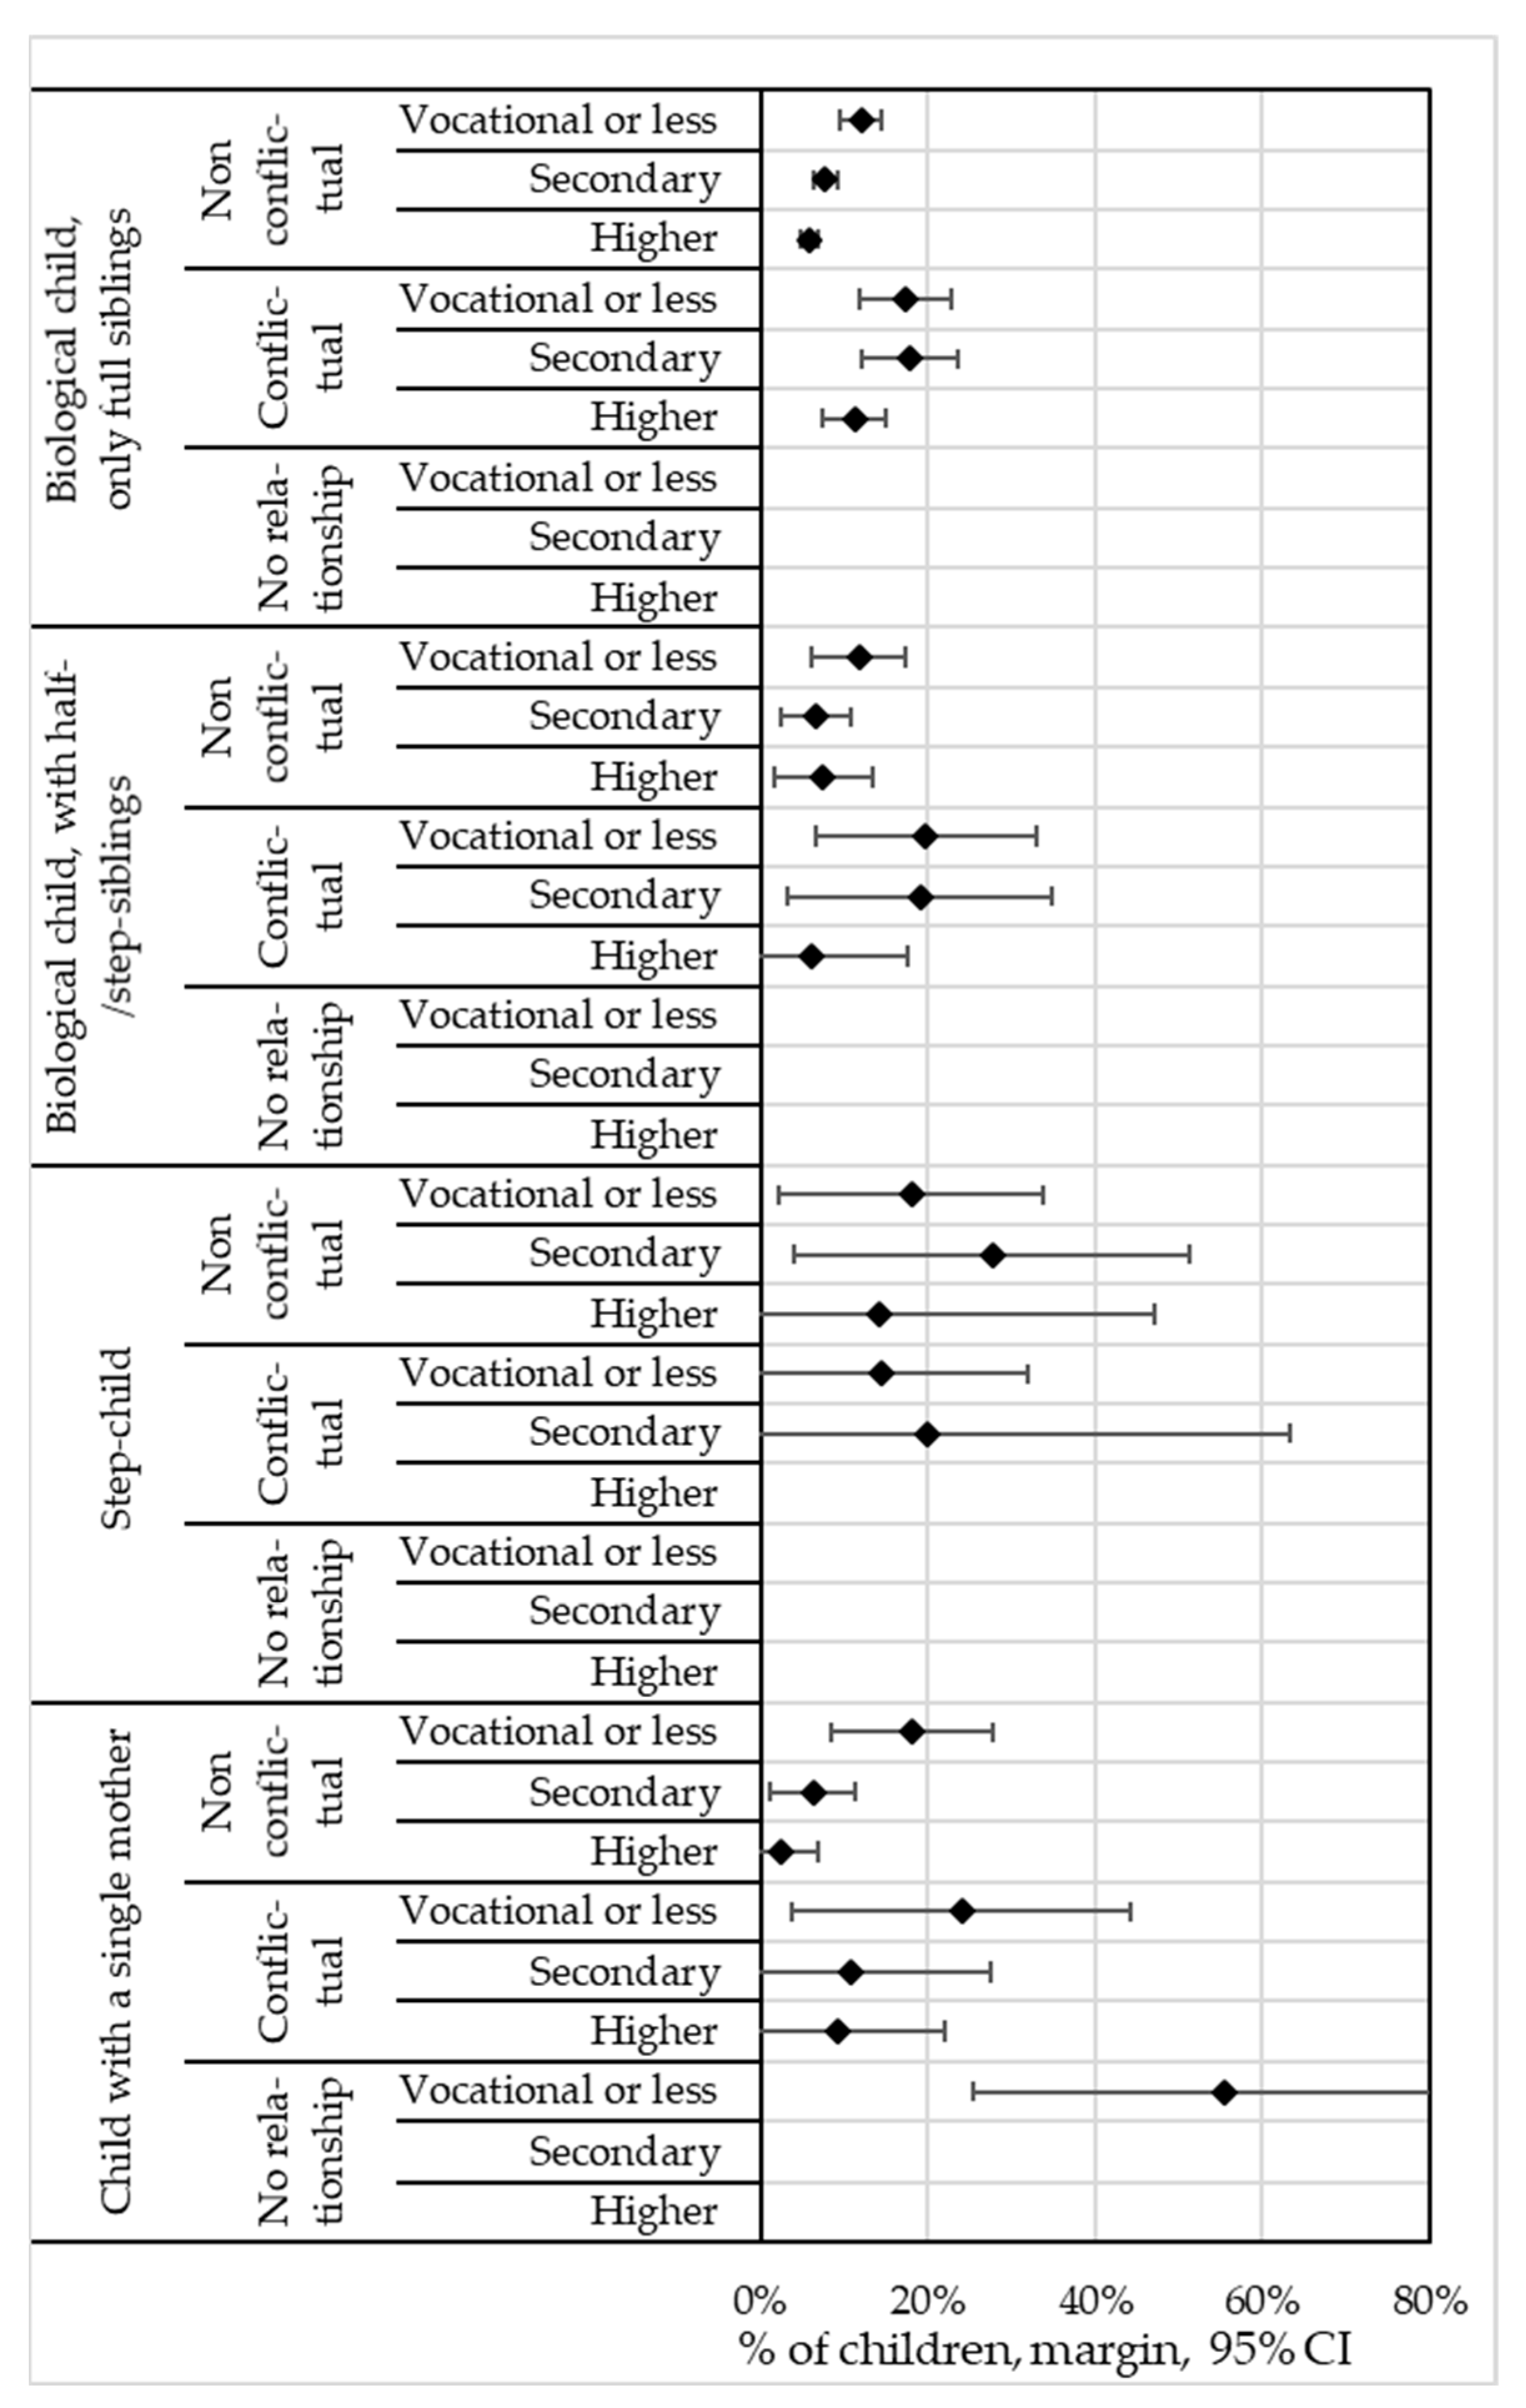
| Family complexity * Educational attainment of mother * Quality of relationship with biological father | ||||||
| Biological child, only full siblings * Non-conflictual relationship * Vocational or less | 0.120 | 0.013 | 9.320 | 0.000 | 0.095 | 0.145 |
| Biological child, only full siblings * Non-conflictual relationship * Secondary | 0.077 | 0.008 | 10.020 | 0.000 | 0.062 | 0.092 |
| Biological child, only full siblings * Non-conflictual relationship * Higher | 0.057 | 0.006 | 10.250 | 0.000 | 0.046 | 0.068 |
| Biological child, only full siblings * Conflictual relationship * Vocational or less | 0.172 | 0.028 | 6.190 | 0.000 | 0.118 | 0.227 |
| Biological child, only full siblings * Conflictual relationship * Secondary | 0.178 | 0.029 | 6.200 | 0.000 | 0.122 | 0.235 |
| Biological child, only full siblings * Conflictual relationship * Higher | 0.112 | 0.020 | 5.720 | 0.000 | 0.073 | 0.150 |
| Biological child, only full siblings * No relationship * Vocational or less | – | |||||
| Biological child, only full siblings * No relationship * Secondary | – | |||||
| Biological child, only full siblings * No relationship * Higher | – | |||||
| Biological child, with half- and/or step-siblings * Non-conflictual relationship * Vocational or less | 0.117 | 0.029 | 4.110 | 0.000 | 0.061 | 0.173 |
| Biological child, with half- and/or step-siblings * Non-conflictual relationship * Secondary | 0.067 | 0.021 | 3.160 | 0.002 | 0.025 | 0.108 |
| Biological child, with half- and/or step-siblings * Non-conflictual relationship * Higher | 0.075 | 0.030 | 2.520 | 0.012 | 0.016 | 0.133 |
| Biological child, with half- and/or step-siblings * Conflictual relationship * Vocational or less | 0.198 | 0.067 | 2.960 | 0.003 | 0.067 | 0.329 |
| Biological child, with half- and/or step-siblings * Conflictual relationship * Secondary | 0.191 | 0.081 | 2.360 | 0.018 | 0.032 | 0.349 |
| Biological child, with half- and/or step-siblings * Conflictual relationship * Higher | 0.060 | 0.059 | 1.020 | 0.307 | −0.055 | 0.175 |
| Biological child, with half- and/or step-siblings * No relationship * Vocational or less | – | |||||
| Biological child, with half- and/or step-siblings * No relationship * Secondary | – | |||||
| Biological child, with half- and/or step-siblings * No relationship * Higher | – | |||||
| Step-child * Non-conflictual relationship * Vocational or less | 0.180 | 0.081 | 2.210 | 0.027 | 0.020 | 0.339 |
| Step-child * Non-conflictual relationship * Secondary | 0.277 | 0.121 | 2.300 | 0.022 | 0.041 | 0.514 |
| Step-child * Non-conflictual relationship * Higher | 0.141 | 0.168 | 0.840 | 0.404 | −0.189 | 0.471 |
| Step-child * Conflictual relationship * Vocational or less | 0.145 | 0.089 | 1.630 | 0.104 | −0.030 | 0.320 |
| Step-child * Conflictual relationship * Secondary | 0.198 | 0.222 | 0.890 | 0.373 | −0.238 | 0.634 |
| Step-child * Conflictual relationship * Higher | – | |||||
| Step-child * No relationship * Vocational or less | 0.387 | 0.289 | 1.340 | 0.180 | −0.179 | 0.954 |
| Step-child * No relationship * Secondary | 0.743 | 0.201 | 3.700 | 0.000 | 0.349 | 1.137 |
| Step-child * No relationship * Higher | – | |||||
| Single mother * Non-conflictual relationship * Vocational or less | 0.181 | 0.049 | 3.670 | 0.000 | 0.085 | 0.278 |
| Single mother * Non-conflictual relationship * Secondary | 0.062 | 0.026 | 2.390 | 0.017 | 0.011 | 0.113 |
| Single mother * Non-conflictual relationship * Higher | 0.023 | 0.024 | 0.970 | 0.330 | −0.023 | 0.070 |
| Single mother * Conflictual relationship * Vocational or less | 0.240 | 0.103 | 2.330 | 0.020 | 0.038 | 0.443 |
| Single mother * Conflictual relationship * Secondary | 0.107 | 0.086 | 1.240 | 0.215 | −0.062 | 0.276 |
| Single mother * Conflictual relationship * Higher | 0.091 | 0.066 | 1.370 | 0.170 | −0.039 | 0.221 |
| Single mother * No relationship * Vocational or less | 0.555 | 0.154 | 3.620 | 0.000 | 0.255 | 0.856 |
| Single mother * No relationship * Secondary | – | |||||
| Single mother * No relationship * Higher | – | |||||
| Delta-Method | 95% CI | |||||
|---|---|---|---|---|---|---|
| Margin | Std. Err. | z | P > |z| | Lower | Upper | |
| Family complexity * Quality of relationship with biological father | ||||||
| Biological child, only full siblings * Non-conflictual relationship | 0.176 | 0.007 | 26.880 | 0.000 | 0.163 | 0.189 |
| Biological child, only full siblings * Conflictual relationship | 0.359 | 0.020 | 18.070 | 0.000 | 0.320 | 0.398 |
| Biological child, only full siblings * No relationship | – | |||||
| Biological child, with half- and/or step-siblings * Non-conflictual relationship | 0.221 | 0.028 | 7.920 | 0.000 | 0.166 | 0.276 |
| Biological child, with half- and/or step-siblings * Conflictual relationship | 0.424 | 0.082 | 5.180 | 0.000 | 0.264 | 0.584 |
| Biological child, with half- and/or step-siblings * No relationship | – | |||||
| Step-child * Non-conflictual relationship | 0.290 | 0.095 | 3.060 | 0.002 | 0.104 | 0.476 |
| Step-child * Conflictual relationship | – | |||||
| Step-child * No relationship | – | |||||
| Child with a single mother * Non-conflictual relationship | 0.248 | 0.038 | 6.480 | 0.000 | 0.173 | 0.323 |
| Child with a single mother * Conflictual relationship | 0.234 | 0.085 | 2.760 | 0.006 | 0.068 | 0.401 |
| Child with a single mother * No relationship | 0.240 | 0.108 | 2.230 | 0.026 | 0.029 | 0.452 |
| Family complexity * Educational attainment of mother | ||||||
| Biological child, only full siblings * Vocational or less | – | |||||
| Biological child, only full siblings * Secondary | – | |||||
| Biological child, only full siblings * Higher | – | |||||
| Biological child, with half- and/or step-siblings * Vocational or less | – | |||||
| Biological child, with half- and/or step-siblings * Secondary | – | |||||
| Biological child, with half- and/or step-siblings * Higher | – | |||||
| Step-child * Vocational or less | – | |||||
| Step-child * Secondary | – | |||||
| Step-child * Higher | – | |||||
| Child with a single mother * Vocational or less | 0.463 | 0.062 | 7.510 | 0.000 | 0.342 | 0.584 |
| Child with a single mother * Secondary | 0.204 | 0.045 | 4.550 | 0.000 | 0.116 | 0.292 |
| Child with a single mother * Higher | 0.167 | 0.053 | 3.130 | 0.002 | 0.063 | 0.272 |
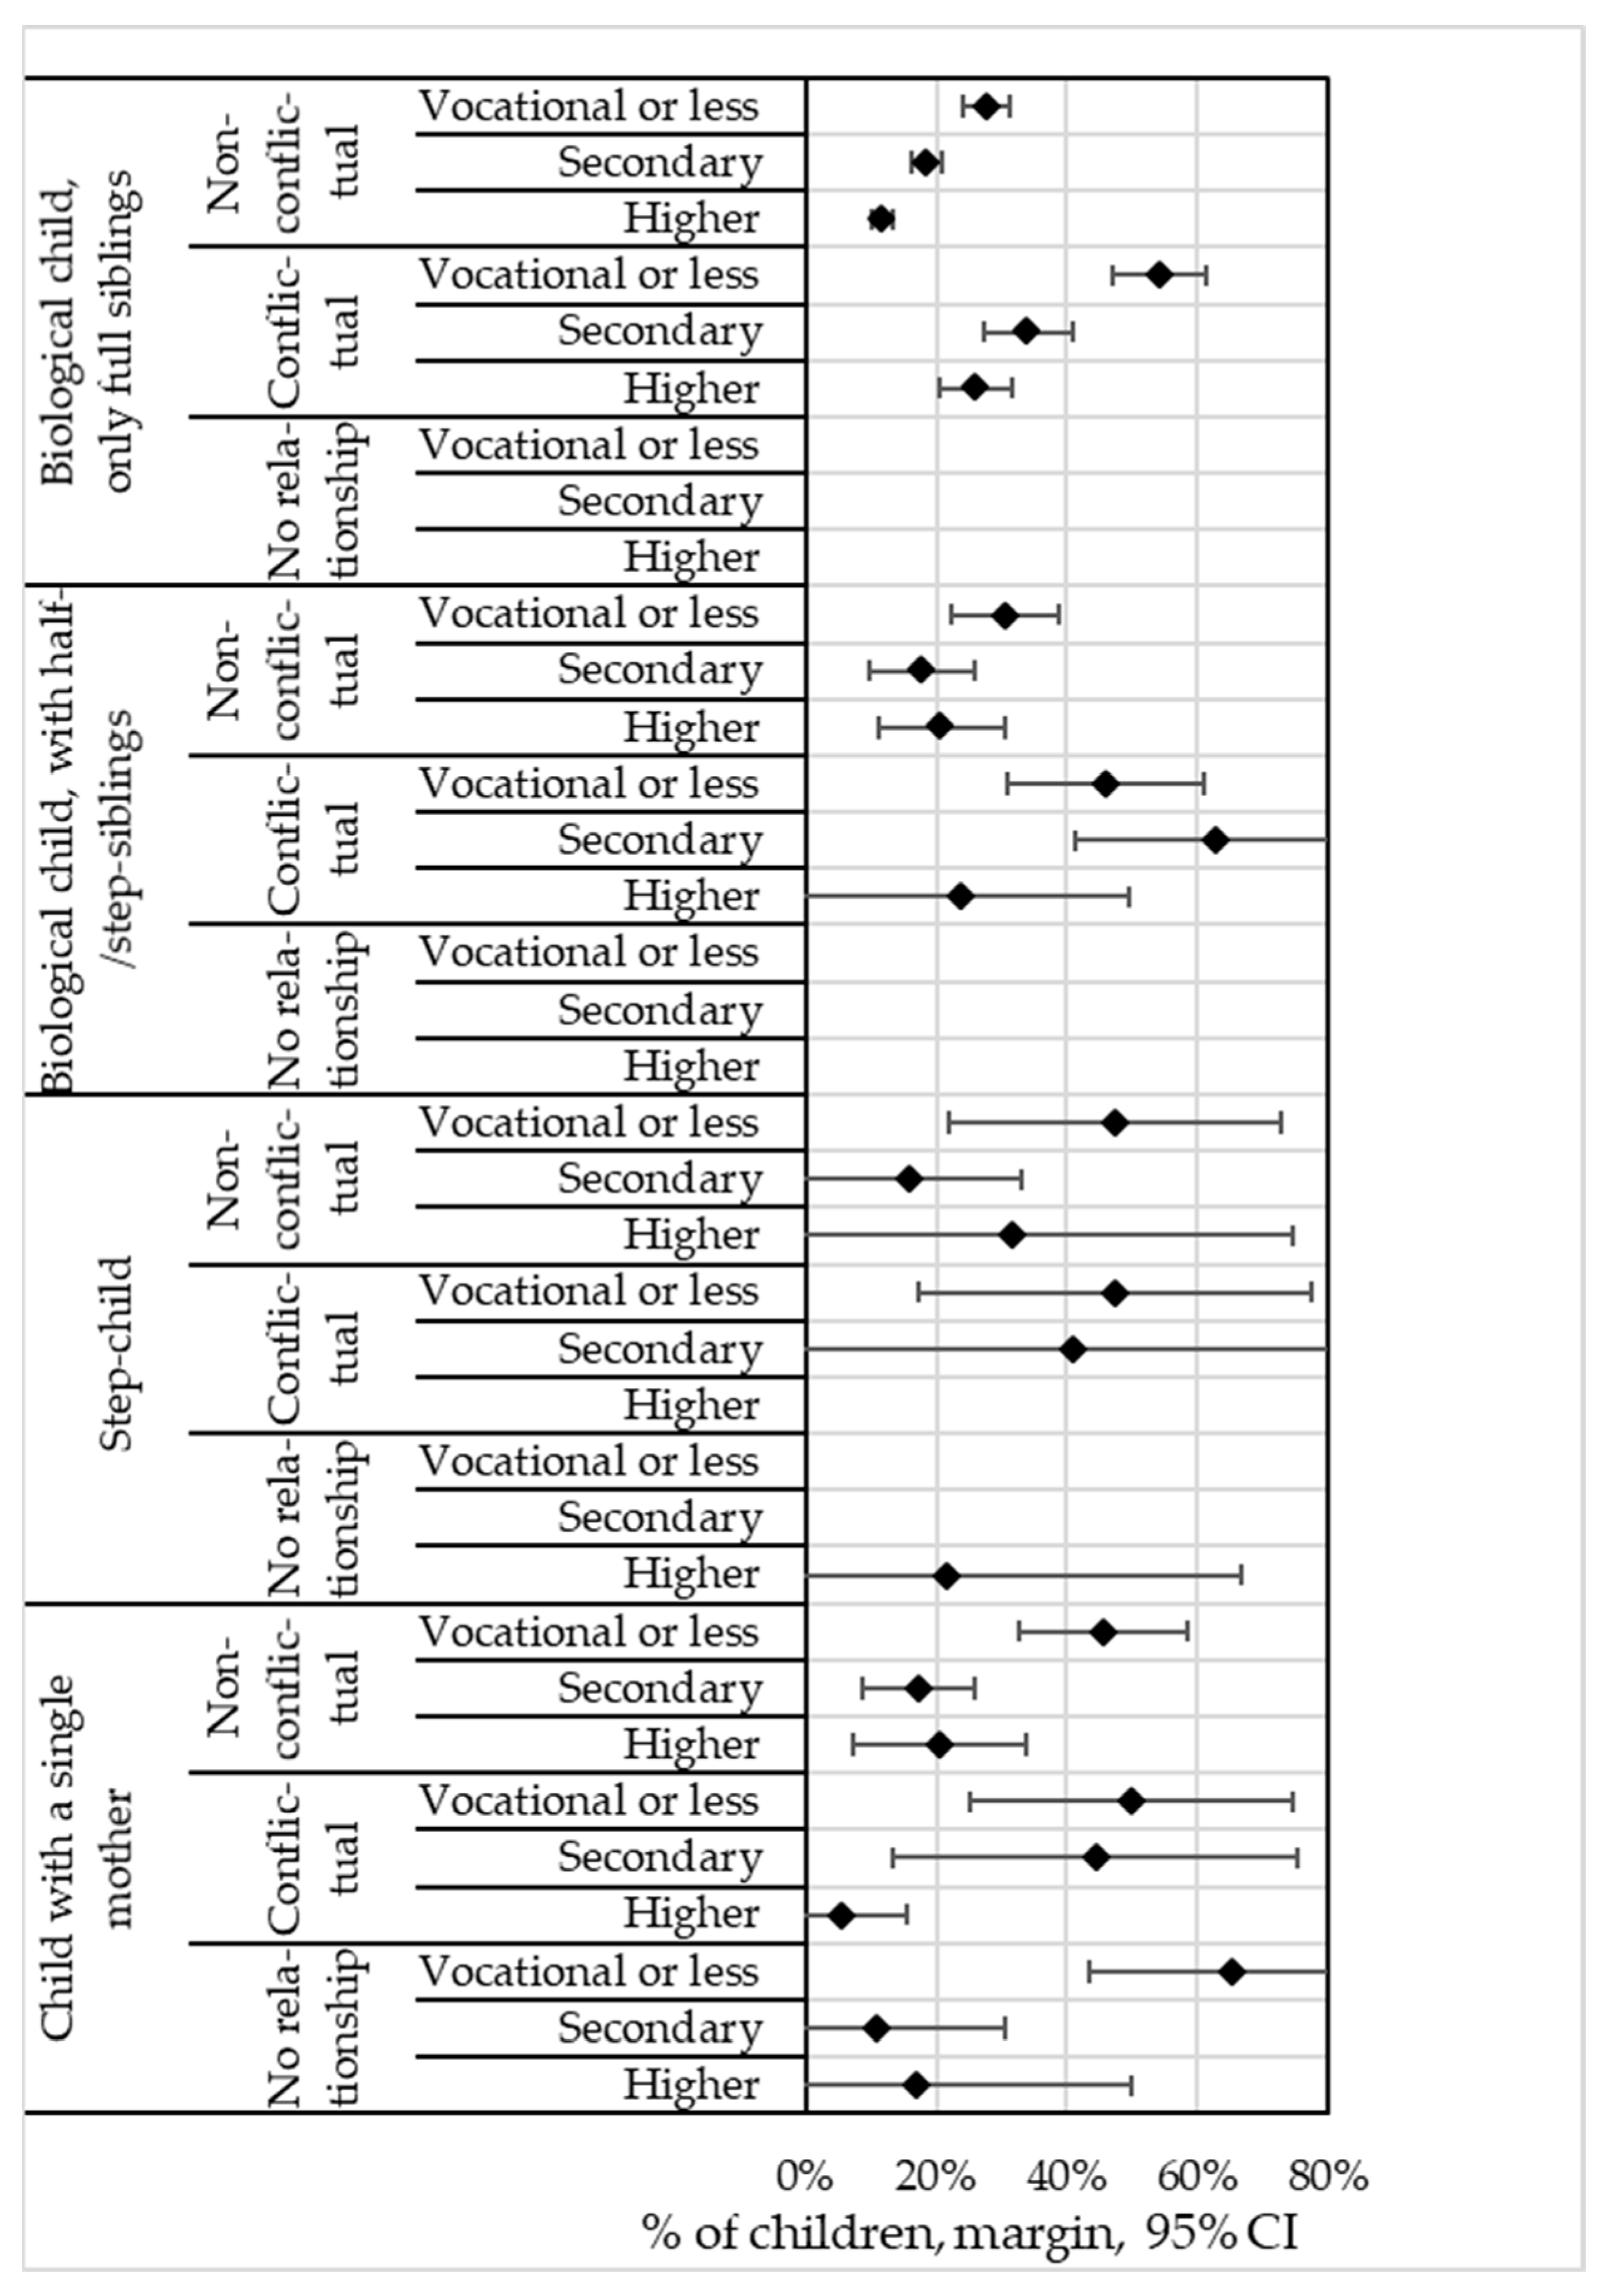
| Family complexity * Educational attainment of mother * Quality of relationship with biological father | ||||||
| Biological child, only full siblings * Non-conflictual relationship * Vocational or less | 0.277 | 0.018 | 15.470 | 0.000 | 0.242 | 0.312 |
| Biological child, only full siblings * Non-conflictual relationship * Secondary | 0.185 | 0.012 | 15.750 | 0.000 | 0.162 | 0.208 |
| Biological child, only full siblings * Non-conflictual relationship * Higher | 0.118 | 0.008 | 14.940 | 0.000 | 0.103 | 0.133 |
| Biological child, only full siblings * Conflictual relationship * Vocational or less | 0.541 | 0.037 | 14.780 | 0.000 | 0.469 | 0.613 |
| Biological child, only full siblings * Conflictual relationship * Secondary | 0.340 | 0.035 | 9.700 | 0.000 | 0.272 | 0.409 |
| Biological child, only full siblings * Conflictual relationship * Higher | 0.261 | 0.028 | 9.280 | 0.000 | 0.206 | 0.316 |
| Biological child, only full siblings * No relationship * Vocational or less | – | |||||
| Biological child, only full siblings * No relationship * Secondary | – | |||||
| Biological child, only full siblings * No relationship * Higher | – | |||||
| Biological child, with half- and/or step-siblings * Non-conflictual relationship * Vocational or less | 0.305 | 0.042 | 7.180 | 0.000 | 0.222 | 0.388 |
| Biological child, with half- and/or step-siblings * Non-conflictual relationship * Secondary | 0.179 | 0.041 | 4.410 | 0.000 | 0.099 | 0.258 |
| Biological child, with half- and/or step-siblings * Non-conflictual relationship * Higher | 0.208 | 0.050 | 4.190 | 0.000 | 0.111 | 0.306 |
| Biological child, with half- and/or step-siblings * Conflictual relationship * Vocational or less | 0.459 | 0.077 | 5.960 | 0.000 | 0.308 | 0.610 |
| Biological child, with half- and/or step-siblings * Conflictual relationship * Secondary | 0.629 | 0.110 | 5.700 | 0.000 | 0.413 | 0.845 |
| Biological child, with half- and/or step-siblings * Conflictual relationship * Higher | 0.241 | 0.130 | 1.860 | 0.063 | −0.013 | 0.495 |
| Biological child, with half- and/or step-siblings * No relationship * Vocational or less | – | |||||
| Biological child, with half- and/or step-siblings * No relationship * Secondary | – | |||||
| Biological child, with half- and/or step-siblings * No relationship * Higher | – | |||||
| Step-child * Non-conflictual relationship * Vocational or less | 0.473 | 0.129 | 3.660 | 0.000 | 0.219 | 0.726 |
| Step-child * Non-conflictual relationship * Secondary | 0.158 | 0.088 | 1.800 | 0.072 | −0.014 | 0.330 |
| Step-child * Non-conflictual relationship * Higher | 0.317 | 0.218 | 1.460 | 0.145 | −0.110 | 0.745 |
| Step-child * Conflictual relationship * Vocational or less | 0.474 | 0.153 | 3.100 | 0.002 | 0.174 | 0.774 |
| Step-child * Conflictual relationship * Secondary | 0.408 | 0.243 | 1.680 | 0.093 | −0.068 | 0.884 |
| Step-child * Conflictual relationship * Higher | – | |||||
| Step-child * No relationship * Vocational or less | – | |||||
| Step-child * No relationship * Secondary | – | |||||
| Step-child * No relationship * Higher | 0.216 | 0.230 | 0.940 | 0.347 | −0.234 | 0.667 |
| Child with a single mother * Non-conflictual relationship * Vocational or less | 0.455 | 0.066 | 6.950 | 0.000 | 0.327 | 0.583 |
| Child with a single mother * Non-conflictual relationship * Secondary | 0.172 | 0.044 | 3.900 | 0.000 | 0.086 | 0.259 |
| Child with a single mother * Non-conflictual relationship * Higher | 0.204 | 0.067 | 3.020 | 0.003 | 0.071 | 0.336 |
| Child with a single mother * Conflictual relationship * Vocational or less | 0.498 | 0.126 | 3.940 | 0.000 | 0.250 | 0.746 |
| Child with a single mother * Conflictual relationship * Secondary | 0.445 | 0.158 | 2.820 | 0.005 | 0.135 | 0.754 |
| Child with a single mother * Conflictual relationship * Higher | 0.053 | 0.052 | 1.030 | 0.305 | −0.048 | 0.154 |
| Child with a single mother * No relationship * Vocational or less | 0.654 | 0.112 | 5.850 | 0.000 | 0.435 | 0.873 |
| Child with a single mother * No relationship * Secondary | 0.109 | 0.101 | 1.080 | 0.280 | −0.089 | 0.306 |
| Child with a single mother * No relationship * Higher | 0.170 | 0.168 | 1.010 | 0.313 | −0.160 | 0.500 |
References
- Lee, D.; McLanahan, S. Family structure transitions and child development: Instability, selection, and population heterogeneity. Am. Sociol. Rev. 2015, 80, 738–763. [Google Scholar] [CrossRef]
- McLanahan, S.; Tach, L.; Schneider, D. The causal effects of father absence. Annu. Rev. Sociol. 2013, 39, 399–427. [Google Scholar] [CrossRef]
- Waldfogel, J.; Craigie, T.A.; Brooks-Gunn, J. Fragile families and child wellbeing. Future Child. Cent. Future Child. David Lucile Packard Found. 2010, 20, 87–112. [Google Scholar] [CrossRef]
- Amato, P.R. Children’s adjustment to divorce: Theories, hypotheses, and empirical support. J. Marriage Fam. 1993, 55, 43–58. [Google Scholar] [CrossRef]
- Dubowitz, H.; Black, M.M.; Cox, C.E.; Kerr, M.A.; Litrownik, A.J.; Radhakrishna, A.; English, D.J.; Schneider, M.W.; Runyan, D.K. Father involvement and children’s functioning at age 6 years: A multisite study. Child Maltreatment 2001, 6, 300–309. [Google Scholar] [CrossRef]
- Krueger, P.M.; Jutte, D.P.; Franzini, L.; Elo, I.; Hayward, M.D. Family structure and multiple domains of child well-being in the United States: A cross-sectional study. Popul. Health Metr. 2015, 13, 6. [Google Scholar] [CrossRef]
- Stevenson, M.; Black, K. How Divorce Affects Offspring; Brown and Benchmark: Madison, WI, USA, 1995. [Google Scholar]
- Daly, M.; Wilson, M. The Darwinian psychology of discriminative parental solicitude. Neb. Symp. Motiv. 1987, 35, 91–144. [Google Scholar]
- Case, A.; Paxson, C. Mothers and others: Who invests in children’s health? J. Health Econ. 2001, 20, 301–328. [Google Scholar] [CrossRef]
- Tillman, K.H. Family structure pathways and academic disadvantage among adolescents in stepfamilies. Sociol. Inq. 2007, 77, 383–424. [Google Scholar] [CrossRef]
- Jeynes, W.H. The impact of parental remarriage on children: A meta-analysis. Marriage Fam. Rev. 2006, 40, 75–102. [Google Scholar] [CrossRef]
- Ginther, D.K.; Pollak, R.A. Family structure and children’s educational outcomes: Blended families, stylized facts, and descriptives regressions. Demography 2004, 41, 671–696. [Google Scholar] [CrossRef] [PubMed]
- Halpern-Meekin, S.; Tach, L. Heterogeneity in two-parent families and adolescent well-being. J. Marriage Fam. 2008, 70, 435–451. [Google Scholar] [CrossRef]
- Hofferth, S.L. Residential father family type and child well-being: Investment versus selection. Demography 2006, 43, 53–77. [Google Scholar] [CrossRef]
- Tillman, K.H. Coresident sibling composition and the academic ability, expectations and performance of youth. Sociol. Perspect. 2008, 51, 679–711. [Google Scholar] [CrossRef]
- Vogt Yuan, A.S. Sibling relationships and adolescents’ mental health: The interrelationship of structure and quality. J. Fam. Issues 2009, 30, 1221–1244. [Google Scholar] [CrossRef]
- Lucas, N.; Nicholson, J.M.; Erbas, B. Child mental health after parental separation: The impact of resident/non-resident parenting, parent mental health, conflict and socioeconomics. J. Fam. Stud. 2013, 19, 53–69. [Google Scholar] [CrossRef][Green Version]
- Amato, P.R. Research on divorce: Continuing trends and new developments. J. Marriage Fam. 2010, 72, 650–666. [Google Scholar] [CrossRef]
- Lansford, J.E.; Malone, P.S.; Castellino, D.R.; Dodge, K.A.; Pettit, G.S.; Bates, J.E. Trajectories of internalizing, externalizing, and grades for children who have and have not experienced their parents’ divorce or separation. J. Fam. Psychol. 2006, 20, 292–301. [Google Scholar] [CrossRef]
- Andreß, H.-J.; Borgloh, B.; Bröckel, M.; Giesselmann, M.; Hummelsheim, D. The economic consequences of partnership dissolution: A comparative analysis of panel studies from Belgium, Germany, Great Britain, Italy, and Sweden. Eur. Sociol. Rev. 2006, 22, 533–560. [Google Scholar] [CrossRef]
- Barrett, A.E.; Turner, R.J. Family structure and mental health: The mediating effects of socioeconomic status, family process, and social stress. J. Health Soc. Behav. 2005, 46, 156–169. [Google Scholar] [CrossRef]
- Sun, Y.; Li, Y. Children’s well-being during parents’ marital disruption process: A pooled time-series analysis. J. Marriage Fam. 2002, 64, 472–488. [Google Scholar] [CrossRef]
- Amato, P.R.; Sobolewski, J.M. The effects of divorce and marital discord on adult children’s psychological well-being. Am. Sociol. Rev. 2001, 66, 900–921. [Google Scholar] [CrossRef]
- Lansford, J.E. Parental divorce and children’s adjustment. Perspect. Psychol. Sci. 2009, 4, 140–152. [Google Scholar] [CrossRef]
- Auersperg, F.; Vlasak, T.; Ponocny, I.; Barth, A. Long-term effects of parental divorce on mental health: A meta-analysis. J. Psychiatr. Res. 2019, 119, 107–115. [Google Scholar] [CrossRef]
- O’Hara, K.L.; Sandler, I.N.; Wolchik, S.A.; Tein, J.-Y. Coping in context: The effects of long-term relations between interparental conflict and coping on the development of child psychopathology following parental divorce. Dev. Psychopathol. 2019, 31, 1695–1713. [Google Scholar] [CrossRef]
- Hosokawa, R.; Katsura, T. Marital relationship, parenting practices, and social skills development in preschool children. Child Adolesc. Psychiatry Ment. Health 2017, 11, 2. [Google Scholar] [CrossRef] [PubMed]
- Davies, P.T.; Hentges, R.F.; Coe, J.L.; Martin, M.J.; Sturge-Apple, M.L.; Cummings, E.M. The multiple faces of interparental conflict: Implications for cascades of children’s insecurity and externalizing problems. J. Abnorm. Psychol. 2016, 125, 664–678. [Google Scholar] [CrossRef]
- Brock, R.L.; Kochanska, G. Interparental conflict, children’s security with parents, and long-term risk of internalizing problems: A longitudinal study from ages 2 to 10. Dev. Psychopathol. 2016, 28, 45–54. [Google Scholar] [CrossRef]
- McCoy, K.; Cummings, E.M.; Davies, P.T. Constructive and destructive marital conflict, emotional security and children’s prosocial behaviour. J. Child Psychol. Psychiatry 2009, 50, 270–279. [Google Scholar] [CrossRef] [PubMed]
- Troxel, W.M.; Matthews, K.A. What are the costs of marital conflict and dissolution to children’s physical health? Clin. Child Fam. Psychol. Rev. 2004, 7, 29–57. [Google Scholar] [CrossRef]
- Benson, M.J.; Buehler, C.; Gerard, J.M. Interparental hostility and early adolescent problem behavior: Spillover via maternal acceptance, harshness, inconsistency, and intrusiveness. J. Early Adolesc. 2008, 28, 428–454. [Google Scholar] [CrossRef]
- Chapple, S. Child Well-Being and Sole-Parent Family Structure in the OECD; OECD: Paris, France, 2009. [Google Scholar] [CrossRef]
- Bradley, R.H.; Corwyn, R.F. Socioeconomic status and child development. Annu. Rev. Psychol. 2002, 53, 371–399. [Google Scholar] [CrossRef] [PubMed]
- Letourneau, N.L.; Duffett-Leger, L.; Levac, L.; Watson, B.; Young-Morris, C. Socioeconomic status and child development: A meta-analysis. J. Emot. Behav. Disord. 2013, 21, 211–224. [Google Scholar] [CrossRef]
- Pillas, D.; Marmot, M.; Naicker, K.; Goldblatt, P.; Morrison, J.; Pikhart, H. Social inequalities in early childhood health and development: A European-wide systematic review. Pediatr. Res. 2014, 76, 418–424. [Google Scholar] [CrossRef] [PubMed]
- Kalil, A.; Ryan, R. Parenting practices and socioeconomic gaps in childhood outcomes. Future Child. 2020, 30, 29–54. [Google Scholar] [CrossRef]
- Masarik, A.S.; Conger, R.D. Stress and child development: A review of the Family Stress Model. Curr. Opin. Psychol. 2017, 13, 85–90. [Google Scholar] [CrossRef]
- Hajdu, T.; Kertesi, G.; Kézdi, G. Idő és pénz a gyermeknevelésben Magyarországon, 1993–2010. Közgazdasági Szle. 2022, 69, 1255–1297. [Google Scholar] [CrossRef]
- Nagy, Z. Középső csoportos gyermekek készségfejlettsége: Összefüggés a RÖVID DIFER és Piaget feladatai között. Iskolakultúra 2010, 20, 20–29. [Google Scholar]
- Kas, B.; Jakab, Z.; Lőrik, J. Development and norming of the Hungarian CDI-III: A screening tool for language delay. Int. J. Lang. Commun. Disord. 2022, 57, 252–273. [Google Scholar] [CrossRef]
- Harcsa, I.; Monostori, J. A háztartás- és családszerkezeti váltzások hosszú távú trendjei Magyarországon európai kontextusban: Teóriák, tévképzetek, tények. Demográfia 2017, 60, 299–332. [Google Scholar] [CrossRef]
- Harcsa, I.; Monostori, J. A háztartásszerkezet és az iskolai végzettség összefüggései. In Társadalmi Riport; Kolosi, T., Tóth, I.G., Eds.; TÁRKI: Budapest, Hungary, 2018; pp. 109–124. [Google Scholar]
- Harcsa, I.; Monostori, J. A mozaikcsaládok. Socio.hu Társadalomtudományi Szle. 2020, 10, 1–26. [Google Scholar] [CrossRef]
- Monostori, J.; Szabó, L. Háztartás- és családszerkezet. In Demográfiai Portré; Monostori, J., Őri, P., Spéder, Z., Eds.; KSH Népességtudományi Kutatóintézet: Budapest, Hungary, 2021; pp. 99–120. [Google Scholar]
- Veroszta, Z. (Ed.) Technical report. Growing Up in Hungary—Cohort ’18 Hungarian Birth Cohort Study. Prenatal research, preparational phase. In Working Papers on Population, Family and Welfare; No. 30; Hungarian Demographic Research Institute: Budapest, Hungary, 2018. [Google Scholar] [CrossRef]
- Veroszta, Z. (Ed.) Conceptual framework. Growing Up in Hungary—Cohort ’18 Hungarian birth cohort study. In Working Papers on Population, Family and Welfare; No. 32; Hungarian Demographic Research Institute: Budapest, Hungary, 2019. [Google Scholar] [CrossRef]
- Szabó, L.; Boros, J.; Fábián, I.; Gresits, G.; Hortobágyi, A.; Kapitány, B.; Kis, R.; Kopcsó, K.; Leitheiser, F.; Rohr, A.; et al. Growing Up in Hungary—Cohort ’18 Hungarian Birth Cohort Study. Technical report 2. Prenatal wave. In Working Papers on Population, Family and Welfare; No. 38.; Hungarian Demographic Research Institute: Budapest, Hungary, 2021. [Google Scholar] [CrossRef]
- Veroszta, Z.; Boros, J.; Fábián, I.; Kapitány, B.; Kis, R.; Kopcsó, K.; Leitheiser, F.; Szabó, L.; Spéder, Z. Féléves kutatási szakasz. Technikai riport. Kohorsz ’18 Magyar Születési Kohorszvizsgálat. In Kutatási Jelentések; 105.; KSH Népességtudományi Kutatóintézet: Budapest, Hungary, 2022. [Google Scholar]
- Kapitány, B. The target population and the sampling. In Working Papers on Population, Family and Welfare; Veroszta, Z., Ed.; Technical Report: Growing Up in Hungary—Cohort ’18 Hungarian Birth Cohort Study; Prenatal Research, Preparational Phase; No. 30; Hungarian Demographic Research Institute: Budapest, Hungary, 2018; pp. 7–12. [Google Scholar] [CrossRef]
- Squires, J.; Bricker, D. Ages & Stages Questionnaires, Third Edition (ASQ-3): A Parent-Completed Child Monitoring System; Paul, H., Ed.; Brookes Publishing Co., Inc.: Baltimore, MD, USA, 2009. [Google Scholar]
- Lábadi, B.; Pohárnok, M. The Hungarian Version of the 12-, 16-, 18- and 36-Month Ages & Stages Questionnaires, 3rd ed.; (ASQ-3); Institute of Psychology, University of Pécs: Pécs, Hungary, 2019; manuscript in preparation. [Google Scholar]
- Charkaluk, M.-L.; Rousseau, J.; Calderon, J.; Bernard, J.Y.; Forhan, A.; Heude, B.; Kaminski, M.; on behalf of the EDEN Mother–Child Cohort Study Group. Ages and Stages Questionnaire at 3 Years for Predicting IQ at 5–6 Years. Pediatrics 2017, 139, e20162798. [Google Scholar] [CrossRef] [PubMed]
- Halbwachs, M.; Muller, J.-B.; Nguyen, T.S.; de La Rochebrochard, E.; Gascoin, G.; Branger, B.; Rouger, V.; Rozé, J.-C.; Flamant, C. Usefulness of parent-completed ASQ for neurodevelopmental screening of preterm children at five years of age. PLoS ONE 2013, 8, e71925. [Google Scholar] [CrossRef] [PubMed]
- Steenis, L.J.P.; Verhoeven, M.; Hessen, D.J.; van Baar, A.L. Parental and professional assessment of early child development: The ASQ-3 and the Bayley-III-NL. Early Hum. Dev. 2015, 91, 217–225. [Google Scholar] [CrossRef]
- Goodman, R. The Strengths and Difficulties Questionnaire: A research note. J. Child Psychol. Psychiatry 1997, 38, 581–586. [Google Scholar] [CrossRef]
- Birkás, E.; Lakatos, K.; Tóth, I.; Gervai, J. Gyermekkori viselkedési problémák felismerésének lehetőségei rövid kerdőívekkel I: A Strengths and Difficulties Questionnaire magyar változata. Psychiatr. Hung. 2008, 23, 358–365. [Google Scholar] [PubMed]
- Goodman, A.; Heiervang, E.; Fleitlich-Bilyk, B.; Alyahri, A.; Patel, V.; Mullick, M.S.I.; Slobodskaya, H.; dos Santos, D.N.; Goodman, R. Cross-national differences in questionnaires do not necessarily reflect comparable differences in disorder prevalence. Soc. Psychiatry Psychiatr. Epidemiol. 2012, 47, 1321–1331. [Google Scholar] [CrossRef] [PubMed]
- Dahlberg, A.; Fält, E.; Ghaderi, A.; Sarkadi, A.; Salari, R. Swedish norms for the Strengths and Difficulties Questionnaire for children 3–5 years rated by parents and preschool teachers. Scand. J. Psychol. 2020, 61, 253–261. [Google Scholar] [CrossRef]
- Gilford, R.; Bengtson, V. Measuring marital satisfaction in three generations: Positive and negative dimensions. J. Marriage Fam. 1979, 41, 387–398. [Google Scholar] [CrossRef]
- Silverstein, M.; Bengtson, V.L. Longitudinal Study of Generations, California 1971, 1985, 1988, 1991, 1994, 1997, 2000, 2005: Version 4 [Data Set]; Inter-University Consortium for Political and Social Research: Ann Arbor, MI, USA, 2008. [Google Scholar] [CrossRef]
- Kopcsó, K. Scale adaptation. In Working Papers on Population, Family and Welfare; Veroszta, Z., Ed.; Technical Report; Growing Up in Hungary—Cohort ’18 Hungarian Birth Cohort Study; Prenatal Research, Preparational Phase; No. 30; Hungarian Demographic Research Institute: Budapest, Hungary, 2018; pp. 24–29. [Google Scholar] [CrossRef]


| Children from Different Families: | Margin | 95% CI Lower Upper | |
|---|---|---|---|
| Biological child, only full siblings * Non-conflictual relationship * Higher education (reference group) | 0.06 | 0.05 | 0.07 |
| 1. Biological child, only full siblings * Non-conflictual relationship * Vocational or less | 0.12 | 0.09 | 0.15 |
| 2. Biological child, only full siblings * Conflictual relationship * Vocational or less | 0.17 | 0.12 | 0.23 |
| 3. Biological child, only full siblings * Conflictual relationship * Secondary | 0.18 | 0.12 | 0.23 |
| 4. Biological child, only full siblings * Conflictual relationship * Higher | 0.11 | 0.07 | 0.15 |
| 5. Step-children * No relationship * Secondary | 0.74 | 0.35 | 1.14 |
| 6. Child with a single mother * Non-conflictual relationship * Vocational or less | 0.18 | 0.08 | 0.28 |
| 7. Child with a single mother * No relationship * Vocational or less | 0.56 | 0.25 | 0.86 |
| Children from Different Families: | Margin | 95% CI Lower Upper | |
|---|---|---|---|
| Biological child, only full siblings * Non-conflictual relationship * Higher education (reference group) | 0.12 | 0.10 | 0.13 |
| 1. Biological child, only full siblings * Non-conflictual relationship * Vocational or less | 0.28 | 0.24 | 0.31 |
| 2. Biological child, only full siblings * Non-conflictual relationship * Secondary | 0.18 | 0.16 | 0.21 |
| 3. Biological child, only full siblings * Conflictual relationship * Vocational or less | 0.54 | 0.47 | 0.61 |
| 4. Biological child, only full siblings * Conflictual relationship * Secondary | 0.34 | 0.27 | 0.41 |
| 5. Biological child, only full siblings * Conflictual relationship * Higher | 0.26 | 0.21 | 0.32 |
| 6. Biological child, with half-/step-siblings * Non-conflictual relationship * Vocational or less | 0.31 | 0.22 | 0.39 |
| 7. Biological child, with half-/step-siblings * Conflictual relationship * Vocational or less | 0.46 | 0.31 | 0.61 |
| 8. Biological child, with half-/step-siblings * Conflictual relationship * Secondary | 0.63 | 0.41 | 0.85 |
| 9. Step-children * Non-conflictual relationship * Vocational or less | 0.47 | 0.22 | 0.73 |
| 10. Step-children * Conflictual relationship * Vocational or less | 0.47 | 0.17 | 0.77 |
| 11. Child with a single mother * Non-conflictual relationship * Vocational or less | 0.46 | 0.33 | 0.58 |
| 12. Child with a single mother * Conflictual relationship * Vocational or less | 0.50 | 0.25 | 0.75 |
| 13. Child with a single mother * Conflictual relationship * Secondary | 0.44 | 0.14 | 0.75 |
| 14. Child with a single mother * No relationship * Vocational or less | 0.65 | 0.44 | 0.87 |
Disclaimer/Publisher’s Note: The statements, opinions and data contained in all publications are solely those of the individual author(s) and contributor(s) and not of MDPI and/or the editor(s). MDPI and/or the editor(s) disclaim responsibility for any injury to people or property resulting from any ideas, methods, instructions or products referred to in the content. |
© 2023 by the authors. Licensee MDPI, Basel, Switzerland. This article is an open access article distributed under the terms and conditions of the Creative Commons Attribution (CC BY) license (https://creativecommons.org/licenses/by/4.0/).
Share and Cite
Monostori, J.; Szabó, L.; Kopcsó, K. The Impact of Family Complexity on the Risk of Developmental Delay and Socio-Emotional Difficulties in Early Childhood. Societies 2023, 13, 192. https://doi.org/10.3390/soc13080192
Monostori J, Szabó L, Kopcsó K. The Impact of Family Complexity on the Risk of Developmental Delay and Socio-Emotional Difficulties in Early Childhood. Societies. 2023; 13(8):192. https://doi.org/10.3390/soc13080192
Chicago/Turabian StyleMonostori, Judit, Laura Szabó, and Krisztina Kopcsó. 2023. "The Impact of Family Complexity on the Risk of Developmental Delay and Socio-Emotional Difficulties in Early Childhood" Societies 13, no. 8: 192. https://doi.org/10.3390/soc13080192
APA StyleMonostori, J., Szabó, L., & Kopcsó, K. (2023). The Impact of Family Complexity on the Risk of Developmental Delay and Socio-Emotional Difficulties in Early Childhood. Societies, 13(8), 192. https://doi.org/10.3390/soc13080192