
Slow and Steady, or Hard and Fast? A Systematic Review and Meta-Analysis of Studies Comparing Body Composition Changes between Interval Training and Moderate Intensity Continuous Training

 , , ,
, , , 
Abstract
:1. Introduction
2. Material and Methods
2.1. Inclusion/Exclusion Criteria
2.2. Search Strategy
2.3. Screening/Coding of Studies
2.4. Methodological Quality and Certainty of Evidence
2.5. Statistical Analyses
3. Results
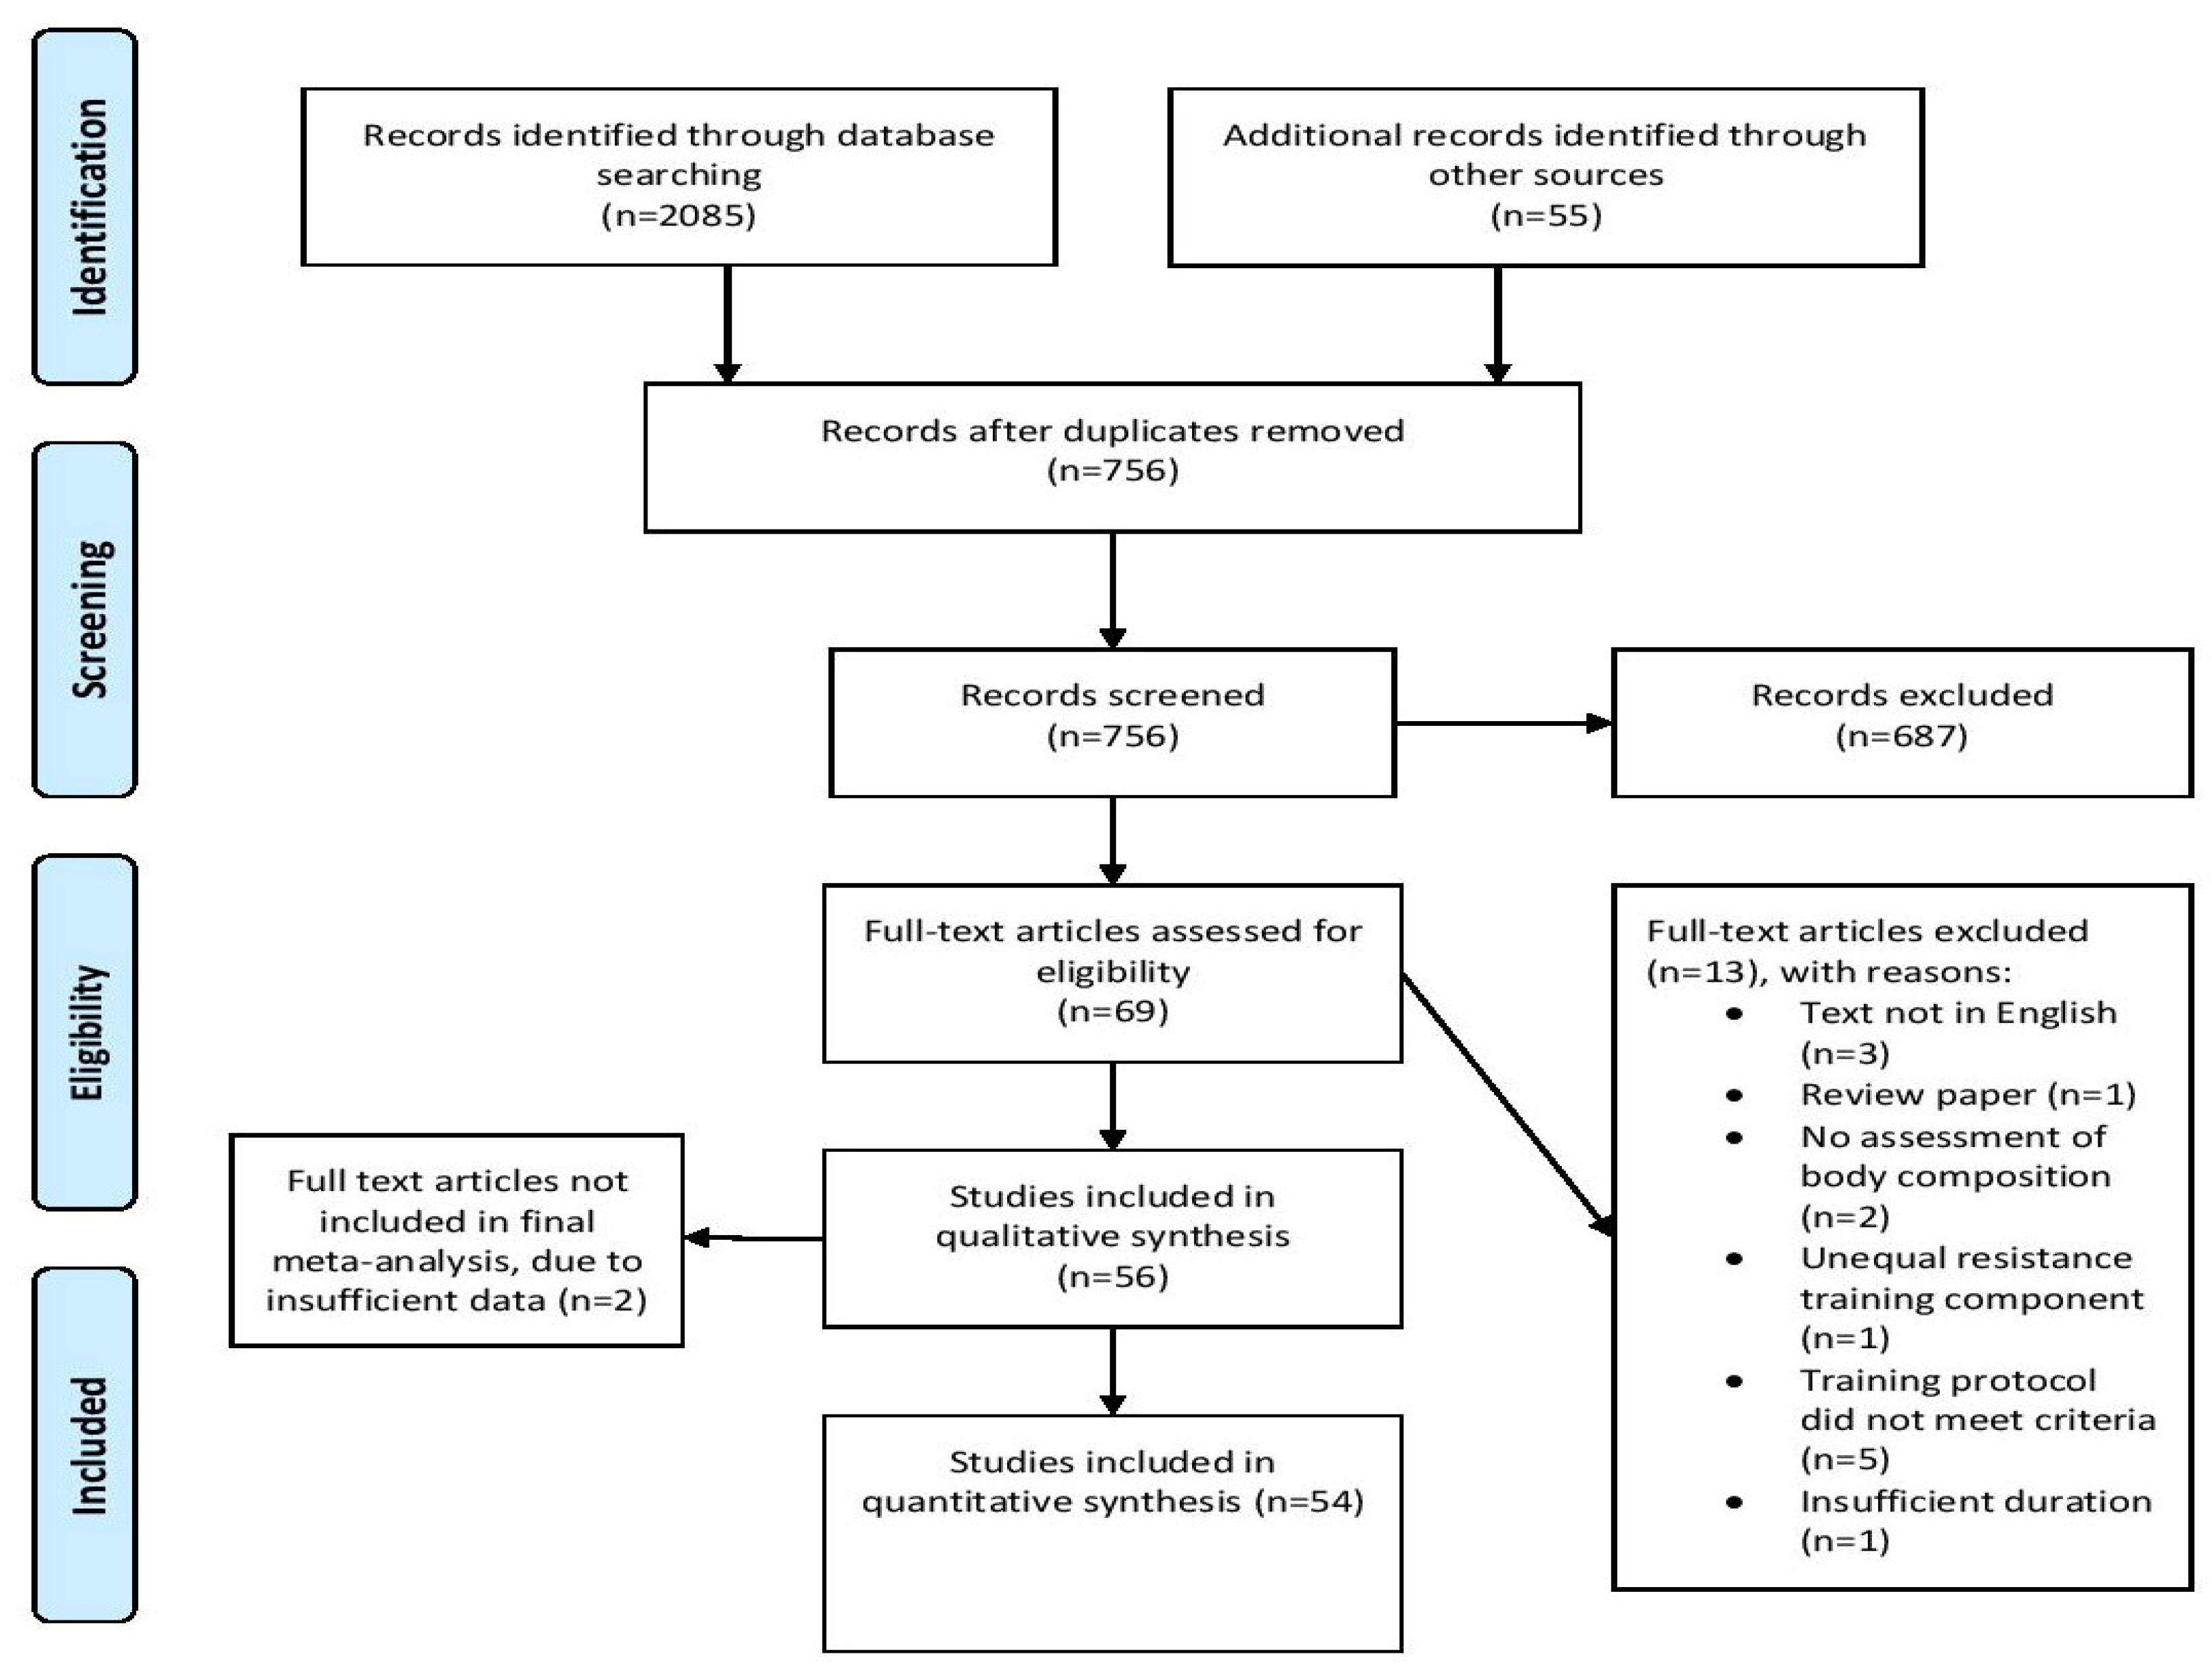
3.1. Search Results
3.2. Methodological Quality
3.3. Main Models
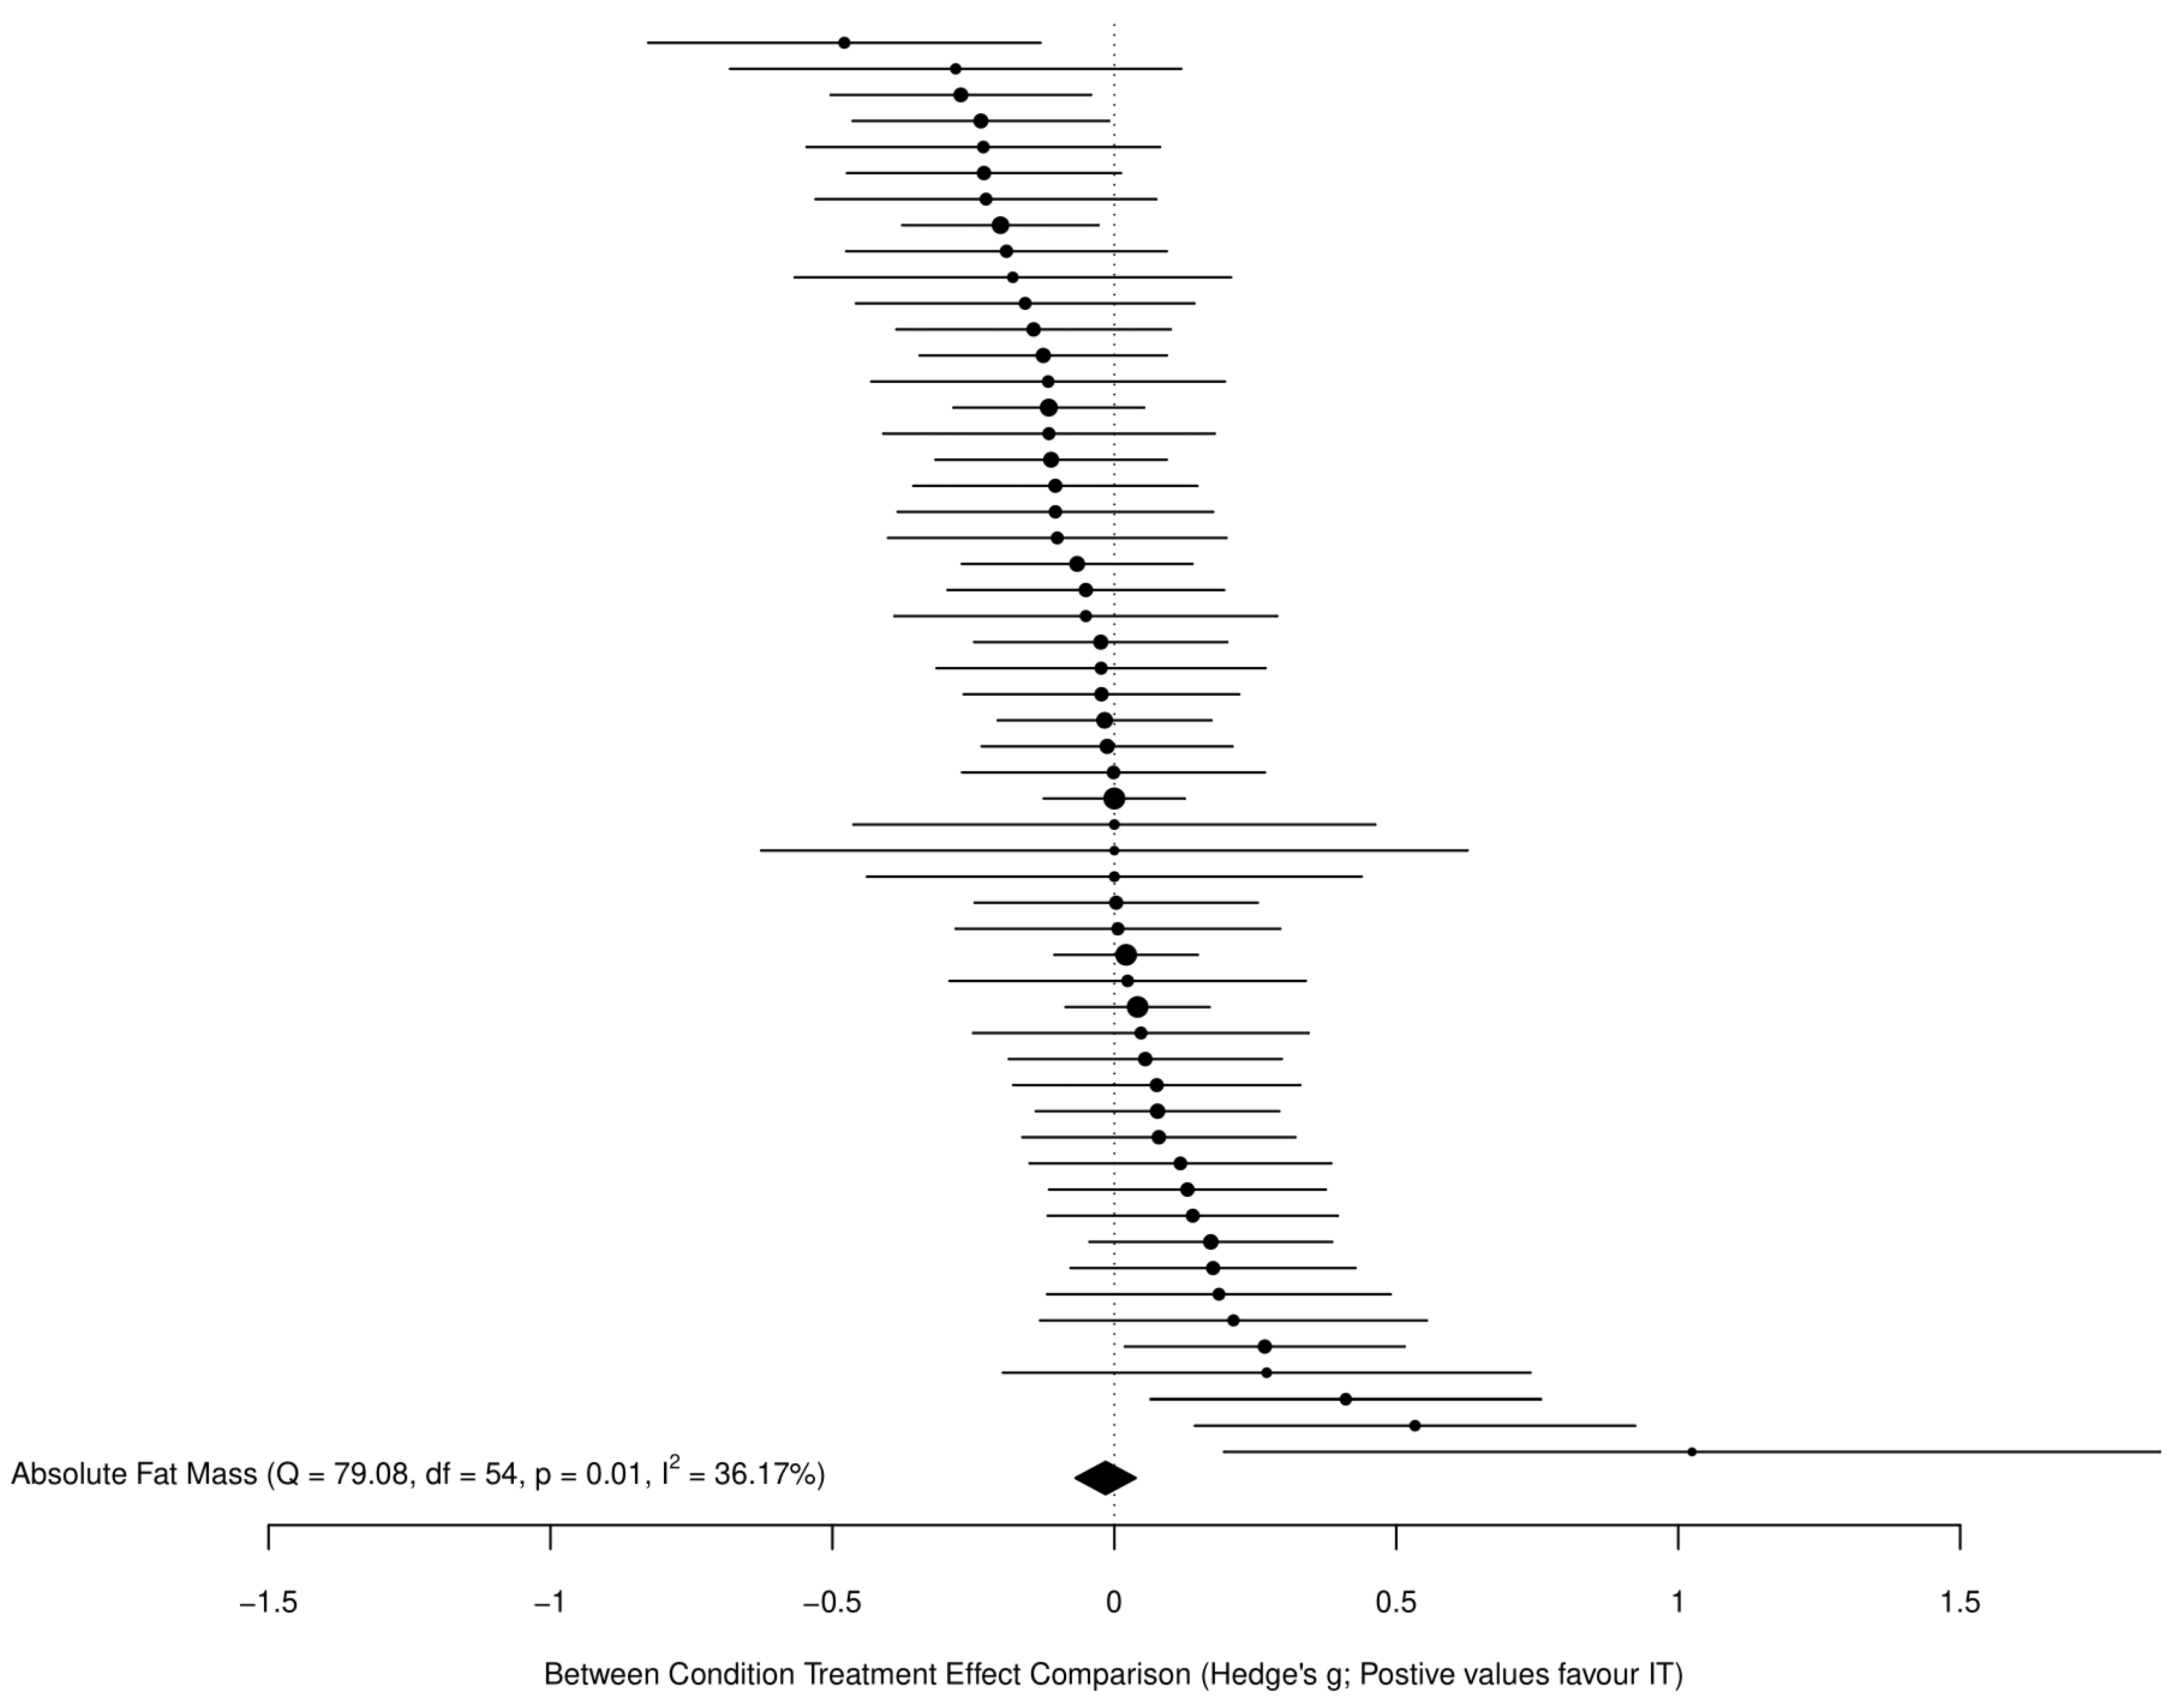
3.3.1. Fat Mass
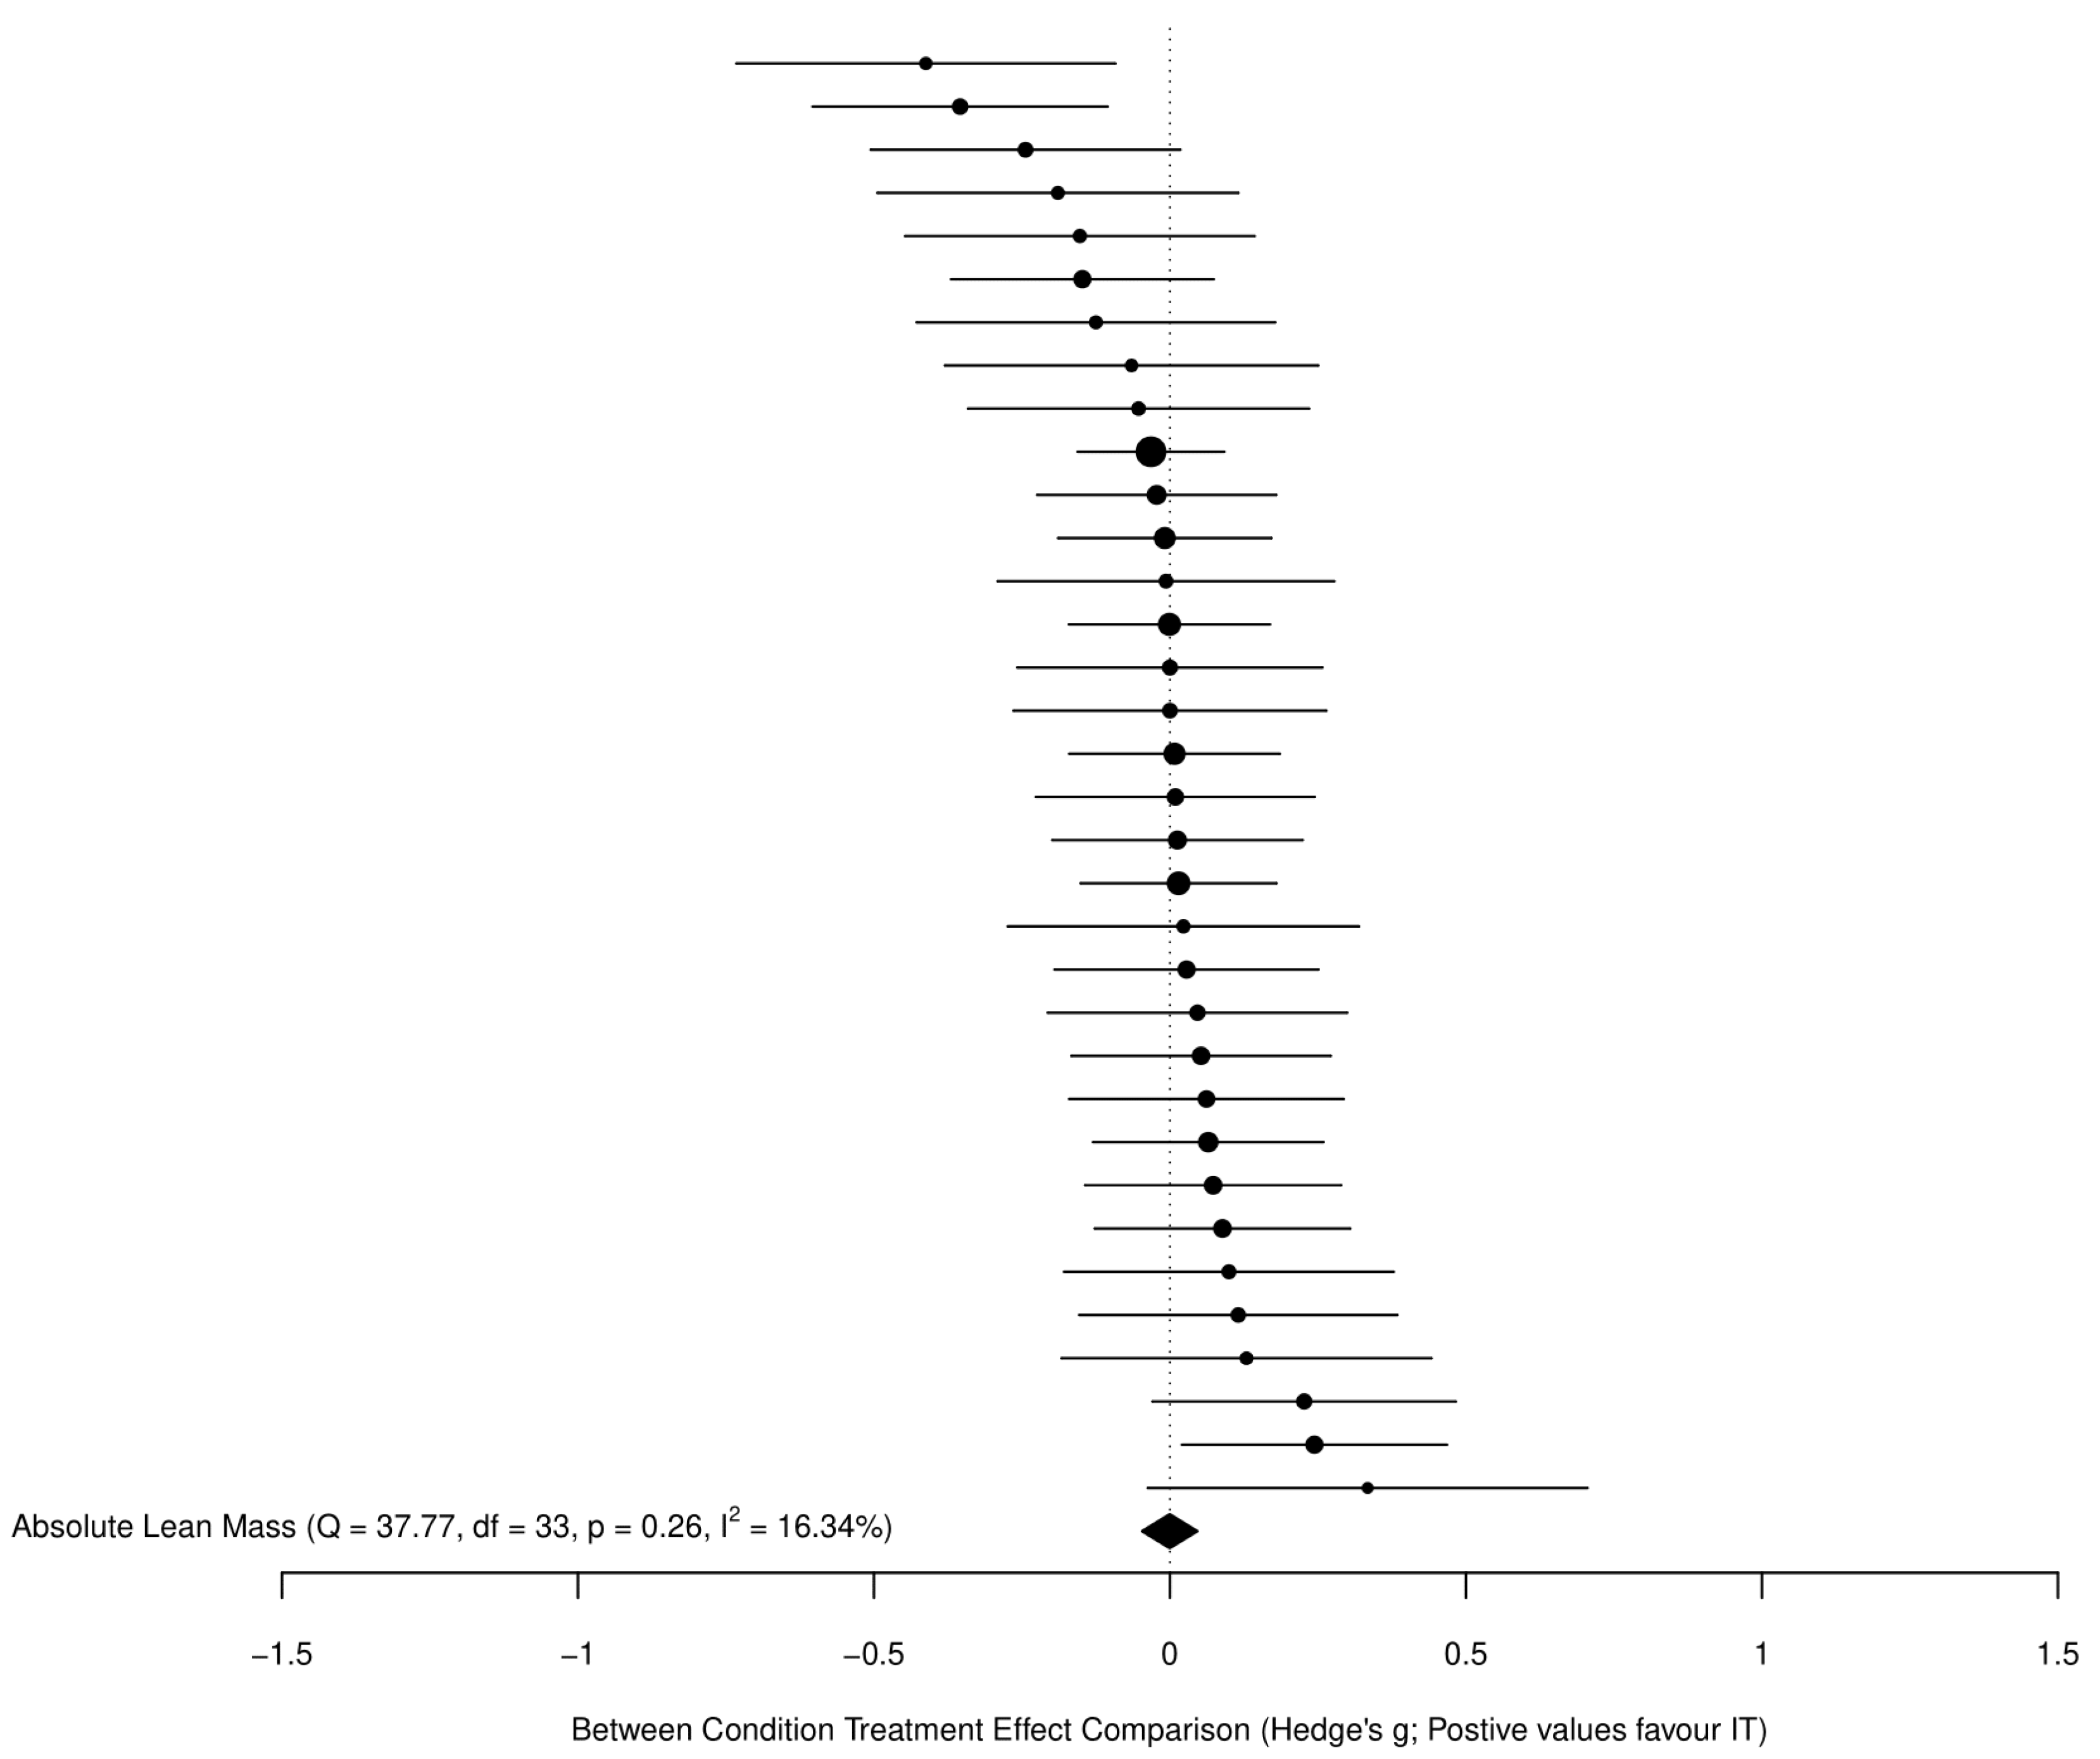
3.3.2. Fat-Free Mass
3.3.3. GRADE Summary of Findings for Main Outcomes
3.4. Secondary Analyses
3.4.1. Within-Condition Treatment Effects
3.4.2. Sub-Group and Meta-Regression Analyses
3.4.3. Adherence, Dropouts and Adverse Events
3.4.4. Inter-Individual Response Variation
4. Discussion
4.1. Changes in Fat Mass
4.2. Changes in Fat-Free Mass
4.3. Exercise Adherence and Dropouts
4.4. Adverse Events
4.5. Inter-Individual Response Variation
4.6. Limitations
5. Conclusions
Supplementary Materials
Author Contributions
Funding
Institutional Review Board Statement
Informed Consent Statement
Data Availability Statement
Conflicts of Interest
References
- Genton, L.; Graf, C.E.; Karsegard, V.L.; Kyle, U.G.; Pichard, C. Low fat-free mass as a marker of mortality in community-dwelling healthy elderly subjects. Age Ageing 2013, 42, 33–39. [Google Scholar] [CrossRef] [PubMed] [Green Version]
- Lima, R.M.; Bezerra, L.M.; Rabelo, H.T.; Silva, M.A.; Silva, A.J.; Bottaro, M.; de Oliveira, R.J. Fat-free mass, strength, and sarcopenia are related to bone mineral density in older women. J. Clin. Densitom. 2009, 12, 35–41. [Google Scholar] [CrossRef]
- Haykowsky, M.J.; Brubaker, P.H.; Morgan, T.M.; Kritchevsky, S.; Eggebeen, J.; Kitzman, D.W. Impaired aerobic capacity and physical functional performance in older heart failure patients with preserved ejection fraction: Role of lean body mass. J. Gerontol. A Biol. Sci. Med. Sci. 2013, 68, 968–975. [Google Scholar] [CrossRef] [PubMed] [Green Version]
- Hydren, J.R.; Borges, A.S.; Sharp, M.A. Systematic review and meta-analysis of predictors of military task performance: Maximal lift capacity. J. Strength Cond. Res. 2017, 31, 1142–1164. [Google Scholar] [CrossRef]
- Zamboni, M.; Mazzali, G.; Fantin, F.; Rossi, A.; Di Francesco, V. Sarcopenic obesity: A new category of obesity in the elderly. Nutr. Metab. Cardiovasc. Dis. 2008, 18, 388–395. [Google Scholar] [CrossRef]
- Stoner, L.; Rowlands, D.; Morrison, A.; Credeur, D.; Hamlin, M.; Gaffney, K.; Lambrick, D.; Matheson, A. Efficacy of exercise intervention for weight loss in overweight and obese adolescents: Meta-analysis and implications. Sports Med. 2016, 46, 1737–1751. [Google Scholar] [CrossRef] [Green Version]
- Miller, C.T.; Fraser, S.F.; Levinger, I.; Straznicky, N.E.; Dixon, J.B.; Reynolds, J.; Selig, S.E. The effects of exercise training in addition to energy restriction on functional capacities and body composition in obese adults during weight loss: A systematic review. PLoS ONE 2013, 8, e81692. [Google Scholar]
- Keating, S.E.; Johnson, N.A.; Mielke, G.I.; Coombes, J.S. A systematic review and meta-analysis of interval training versus moderate-intensity continuous training on body adiposity. Obes. Rev. 2017, 18, 943–964. [Google Scholar] [CrossRef]
- Viana, R.B.; Naves, J.P.A.; Coswig, V.S.; de Lira, C.A.B.; Steele, J.; Fisher, J.P.; Gentil, P. Is interval training the magic bullet for fat loss? A systematic review and meta-analysis comparing moderate-intensity continuous training with high-intensity interval training (HIIT). Br. J. Sports Med. 2019, 53, 655–664. [Google Scholar] [CrossRef]
- Hollings, M.; Coombes, J.; Mavros, Y.; Keating, S.; Fiatarone-Singh, M. Expression of concern: Is interval training the magic bullet for fat loss? A systematic review and meta-analysis comparing moderate-intensity continuous training with high-intensity training (HIIT). Br. J. Sports Med. 2019. [Google Scholar] [CrossRef] [Green Version]
- Sultana, R.N.; Sabag, A.; Keating, S.E.; Johnson, N.A. The effect of low-volume high-intensity interval training on body composition and cardiorespiratory fitness: A systematic review and meta-analysis. Sports Med. 2019, 49, 1687–1721. [Google Scholar] [CrossRef] [PubMed]
- Morris, B. Estimating effect sizes from pretest-posttest-control group designs. Organ. Res. Methods 2008, 11, 364–386. [Google Scholar] [CrossRef]
- Moeyaert, M.; Ugille, M.; Beretvas, S.N.; Ferron, J.; Bunuan, R.; Van den Noortgate, W. Methods for dealing with multiple outcomes in meta-analysis: A comparison between averaging effect sizes, robust variance estimation and multilevel meta-analysis. Int. J. Soc.Res. Methodol. 2017, 20, 559–572. [Google Scholar] [CrossRef]
- Higgins, J.P.T.; Thomas, J.; Chandler, J.; Cumpston, M.; Li, T.; Page, M.J.; Welch, V.A. Cochrane Handbook for Systematic Reviews of Interventions, Version 6.2 ed.; Cochrane: London, UK, 2021; Available online: www.training.cochrane.org/handbook (accessed on 6 November 2021).
- Konopka, A.R.; Harber, M.P. Skeletal muscle hypertrophy after aerobic exercise training. Exerc. Sport Sci. Rev. 2014, 42, 53. [Google Scholar] [CrossRef]
- Callahan, M.J.; Parr, E.B.; Hawley, J.A.; Camera, D.M. Can high-intensity interval training promote skeletal muscle anabolism? Sports Med. 2021, 51, 405–421. [Google Scholar] [CrossRef]
- Maillard, F.; Rousset, S.; Pereira, B.; Boirie, Y.; Duclos, M.; Boisseau, N. High-intensity interval training is more effective than moderate-intensity continuous training in reducing abdominal fat mass in postmenopausal women with type 2 diabetes: A randomized crossover study. Diabetes Metab. 2018, 44, 516–517. [Google Scholar] [CrossRef] [PubMed]
- Kelley, G.A.; Kelley, K.S.; Pate, R.R. Are there inter-individual differences in fat mass and percent body fat as a result of aerobic exercise training in overweight and obese children and adolescents? A meta-analytic perspective. Child. Obes. 2020, 16, 301–306. [Google Scholar] [CrossRef]
- Düking, P.; Holmberg, H.C.; Kunz, P.; Leppich, R.; Sperlich, B. Intra-individual physiological response of recreational runners to different training mesocycles: A randomized cross-over study. Eur. J. Appl. Physiol. 2020, 120, 2705–2713. [Google Scholar] [CrossRef]
- Bonet, J.B.; Magalhães, J.; Viscor, G.; Pagès, T.; Ventura, J.L.; Torrella, J.R.; Javierre, C. Inter-individual different responses to continuous and interval training in recreational middle-aged women runners. Front. Physiol. 2020, 11, 579835. [Google Scholar] [CrossRef]
- Schulhauser, K.T.; Bonafiglia, J.T.; McKie, G.L.; McCarthy, S.F.; Islam, H.; Townsend, L.K.; Grisebach, D.; Todd, C.; Gurd, B.J.; Hazell, T. Individual patterns of response to traditional and modified sprint interval training. J. Sports Sci. 2021, 39, 1077–1087. [Google Scholar] [CrossRef]
- Tong, T.K.; Zhang, H.; Shi, H.; Liu, Y.; Ai, J.; Nie, J.; Kong, Z. Comparing time efficiency of sprint vs. high-intensity interval training in reducing abdominal visceral fat in obese young women: A randomized, controlled trial. Front. Physiol. 2018, 9, 1048. [Google Scholar] [CrossRef]
- Atkinson, G.; Williamson, P.; Batterham, A.M. Issues in the determination of ‘responders’ and ‘non-responders’ in physiological research. Exp. Physiol. 2019, 104, 1215–1225. [Google Scholar] [CrossRef]
- Senior, A.M.; Viechtbauer, W.; Nakagawa, S. Revisiting and expanding the meta-analysis of variation: The log coefficient of variation ratio. Res. Synth. Methods 2020, 11, 553–567. [Google Scholar] [CrossRef]
- Moher, D.; Liberati, A.; Tetzlaff, J.; Altman, D.G.; PRISMA Group. Preferred reporting items for systematic reviews and meta-analyses: The PRISMA statement. PLoS Med. 2009, 6, e1000097. [Google Scholar] [CrossRef] [Green Version]
- Greenhalgh, T.; Peacock, R. Effectiveness and efficiency of search methods in systematic reviews of complex evidence: Audit of primary sources. BMJ 2005, 331, 1064–1065. [Google Scholar] [CrossRef] [Green Version]
- Cooper, H.; Hedges, L.; Valentine, J. The Handbook of Research Synthesis and Meta-Analysis, 2nd ed.; Russell Sage Foundation: New York, NY, USA, 2009. [Google Scholar]
- Elkins, M.R.; Herbert, R.D.; Moseley, A.M.; Sherrington, C.; Maher, C. Rating the quality of trials in systematic reviews of physical therapy interventions. Cardiopulm. Phys.Ther. J. 2010, 21, 20–26. [Google Scholar] [CrossRef] [PubMed]
- Moseley, A.M.; Herbert, R.D.; Sherrington, C.; Maher, C.G. Evidence for physiotherapy practice: A survey of the Physiotherapy Evidence Database (PEDro). Aust. J. Physiother. 2002, 48, 43–49. [Google Scholar] [CrossRef] [Green Version]
- Kummel, J.; Kramer, A.; Giboin, L.S.; Gruber, M. Specificity of balance training in healthy individuals: A systematic review and meta-analysis. Sports Med. 2016, 46, 1261–1271. [Google Scholar] [CrossRef] [PubMed]
- Schünemann, H.; Brożek, J.; Guyatt, G.; Oxman, A.; The GRADE Working Group. GRADE Handbook for Grading Quality of Evidence and Strength of Recommendations. 2013. Available online: https://gdt.gradepro.org/app/handbook/handbook.html (accessed on 11 July 2021).
- GRADEpro Guideline Development Tool; McMaster University: Hamilton, ON, Canada, 2020; Available online: https://gradepro.org/ (accessed on 30 June 2021).
- Viechtbauer, W. Conducting meta-analysis in R with metafor package. J. Stat. Software 2010, 36, 1–48. [Google Scholar] [CrossRef] [Green Version]
- Cohen, J. Statistical Power Analysis for the Behavioral Sciences, 2nd ed.; Lawrence Erlbaum: Hillsdale, NJ, USA, 1988. [Google Scholar]
- Amrhein, V.; Greenland, S.; McShane, B. Scientists rise up against statistical significance. Nature 2019, 567, 305–307. [Google Scholar] [CrossRef] [PubMed] [Green Version]
- McShane, B.B.; Gal, D.; Gelman, A.; Robert, C.; Tackett, J.L. Abandon statistical significance. Am. Stat. 2019, 73 (Suppl. 1), 235–245. [Google Scholar] [CrossRef] [Green Version]
- Higgins, J.P.; Thompson, S.G.; Deeks, J.J.; Altman, D.G. Measuring inconsistency in meta-analyses. BMJ 2003, 327, 557–560. [Google Scholar] [CrossRef] [Green Version]
- Higgins, J.P.; Altman, D.G.; Gøtzsche, P.C.; Jüni, P.; Moher, D.; Oxman, A.D.; Savović, J.; Schulz, K.F.; Weeks, L.; Sterne, J.A. The Cochrane Collaboration’s tool for assessing risk of bias in randomised trials. BMJ 2011, 343, d5928. [Google Scholar] [CrossRef] [Green Version]
- Hecksteden, A.; Kraushaar, J.; Scharhag-Rosenberger, F.; Theisen, D.; Senn, S.; Meyer, T. Individual response to exercise training—A statistical perspective. J. Appl. Physiol. 2015, 118, 1450–1459. [Google Scholar] [CrossRef] [Green Version]
- Nakagawa, S.; Poulin, R.; Mengersen, K.; Reinhold, K.; Engqvist, L.; Lagisz, M.; Senior, A.M. Meta-analysis of variation: Ecological and evolutionary applications and beyond. Methods Ecol. Evol. 2015, 6, 143–152. [Google Scholar] [CrossRef]
- Connolly, L.J.; Nordsborg, N.B.; Nyberg, M.; Weihe, P.; Krustrup, P.; Mohr, M. Low-volume high-intensity swim training is superior to high-volume low-intensity training in relation to insulin sensitivity and glucose control in inactive middle-aged women. Eur. J. Appl. Physiol. 2016, 116, 1889–1897. [Google Scholar] [CrossRef] [PubMed]
- Safarimosavi, S.; Mohebbi, H.; Rohani, H. High-intensity interval vs. continuous endurance training: Preventive effects on hormonal changes and physiological adaptations in prediabetes patients. J. Strength Cond. Res. 2021, 35, 731–738. [Google Scholar] [CrossRef] [PubMed]
- De Araujo, A.C.C.; Roschel, H.; Picanço, A.R.; do Prado, D.M.; Villares, S.M.; de Sá Pinto, A.L.; Gualano, B. Similar health benefits of endurance and high-intensity interval training in obese children. PLoS ONE 2012, 7, e42747. [Google Scholar] [CrossRef]
- Boer, P.H.; Meeus, M.; Terblanche, E.; Rombaut, L.; Wandele, I.D.; Hermans, L.; Gysel, T.; Ruige, J.; Calders, P. The influence of sprint interval training on body composition, physical and metabolic fitness in adolescents and young adults with intellectual disability: A randomized controlled trial. Clin. Rehabil. 2014, 28, 221–231. [Google Scholar] [CrossRef] [PubMed]
- Boer, P.H.; Moss, S.J. Effect of continuous aerobic vs. interval training on selected anthropometrical, physiological and functional parameters of adults with Down syndrome. J. Intellect. Disabil. Res. 2016, 60, 322–334. [Google Scholar] [CrossRef]
- Buchan, D.S.; Ollis, S.; Young, J.D.; Thomas, N.E.; Cooper, S.M.; Tong, T.K.; Nie, J.; Malina, R.M.; Baker, J.S. The effects of time and intensity of exercise on novel and established markers of CVD in adolescent youth. Am. J. Hum. Biol. 2011, 23, 517–526. [Google Scholar] [CrossRef] [PubMed]
- Camacho-Cardenosa, A.; Brazo-Sayavera, J.; Camacho-Cardenosa, M.; Marcos-Serrano, M.; Timón, R.; Olcina, G. Effects of high intensity interval training on fat mass parameters in adolescents. Rev. Esp. Salud Publica 2016, 90, e1–e9. [Google Scholar] [PubMed]
- Cheema, B.S.; Davies, T.B.; Stewart, M.; Papalia, S.; Atlantis, E. The feasibility and effectiveness of high-intensity boxing training versus moderate-intensity brisk walking in adults with abdominal obesity: A pilot study. BMC Sports Sci. Med. Rehabil. 2015, 7, 3. [Google Scholar] [CrossRef]
- Cocks, M.; Shaw, C.S.; Shepherd, S.O.; Fisher, J.P.; Ranasinghe, A.; Barker, T.A.; Wagenmakers, A.J. Sprint interval and moderate-intensity continuous training have equal benefits on aerobic capacity, insulin sensitivity, muscle capillarisation and endothelial eNOS/NAD(P)Hoxidase protein ratio in obese men. J. Physiol. 2016, 594, 2307–2321. [Google Scholar] [CrossRef]
- Devin, J.L.; Sax, A.T.; Hughes, G.I.; Jenkins, D.G.; Aitken, J.F.; Chambers, S.K.; Dunn, J.C.; Bolam, K.A.; Skinner, T.L. The influence of high-intensity compared with moderate-intensity exercise training on cardiorespiratory fitness and body composition in colorectal cancer survivors: A randomised controlled trial. J. Cancer Surviv. 2016, 10, 467–479. [Google Scholar] [CrossRef] [PubMed]
- Dias, K.A.; Ingul, C.B.; Tjønna, A.E.; Keating, S.E.; Gomersall, S.R.; Follestad, T.; Hosseini, M.S.; Hollekim-Strand, S.M.; Ro, T.B.; Haram, M.; et al. Effect of high-intensity interval training on fitness, fat mass and cardiometabolic biomarkers in children with obesity: A randomised controlled trial. Sports Med. 2018, 48, 733–746. [Google Scholar] [CrossRef]
- Earnest, C.P.; Lupo, M.; Thibodaux, J.; Hollier, C.; Butitta, B.; Lejeune, E.; Johannsen, N.M.; Gibala, M.J.; Church, T.S. Interval training in men at risk for insulin resistance. Int. J. Sports Med. 2013, 34, 355–363. [Google Scholar] [CrossRef]
- Eimarieskandari, R.; Zilaeibouri, S.; Zilaeibouri, M.; Ahangarpour, A. Comparing two modes of exercise training with different intensity on body composition in obese young girls. Ovidius Univ. Ann. Ser. Phys. Educ. Sport Mov. Health 2012, 12, 473–478. [Google Scholar]
- Elmer, D.J.; Laird, R.H.; Barberio, M.D.; Pascoe, D.D. Inflammatory, lipid, and body composition responses to interval training or moderate aerobic training. Eur. J. Appl. Physiol. 2016, 116, 601–609. [Google Scholar] [CrossRef]
- Fisher, G.; Brown, A.W.; Brown, M.M.B.; Alcorn, A.; Noles, C.; Winwood, L.; Resuehr, H.; George, B.; Jeansonne, M.M.; Allison, D.B. High intensity interval- vs moderate intensity- training for improving cardiometabolic health in overweight or obese males: A randomized controlled trial. PLoS ONE 2015, 10, e0138853. [Google Scholar] [CrossRef]
- Galedari, M.; Azarbayjani, M.A.; Peeri, M. Effects of type of exercise along with caloric restriction on plasma apelin 36 and HOMA-IR in overweight men. Sci. Sports 2017, 32, e137–e145. [Google Scholar] [CrossRef]
- Gillen, J.B.; Martin, B.J.; MacInnis, M.J.; Skelly, L.E.; Tarnopolsky, M.A.; Gibala, M.J. Twelve weeks of sprint interval training improves indices of cardiometabolic health similar to traditional endurance training despite a five-fold lower exercise volume and time commitment. PLoS ONE 2016, 11, e0154075. [Google Scholar]
- Gripp, F.; Nava, R.C.; Cassilhas, R.C.; Esteves, E.A.; Magalhães, C.O.D.; Dias-Peixoto, M.F.; de Castro Magalhães, F.; Amorim, F.T. HIIT is superior than MICT on cardiometabolic health during training and detraining. Eur. J. Appl. Physiol. 2021, 121, 159–172. [Google Scholar] [CrossRef]
- Higgins, S.; Fedewa, M.V.; Hathaway, E.D.; Schmidt, M.D.; Evans, E.M. Sprint interval and moderate-intensity cycling training differentially affect adiposity and aerobic capacity in overweight young-adult women. Appl. Physiol. Nutr. Metab. 2016, 41, 1177–1183. [Google Scholar] [CrossRef]
- Hwang, C.L.; Yoo, J.K.; Kim, H.K.; Hwang, M.H.; Handberg, E.M.; Petersen, J.W.; Christou, D.D. Novel all-extremity high-intensity interval training improves aerobic fitness, cardiac function and insulin resistance in healthy older adults. Exp. Gerontol. 2016, 82, 112–119. [Google Scholar] [CrossRef] [Green Version]
- Keating, S.E.; Machan, E.A.; O’Connor, H.T.; Gerofi, J.A.; Sainsbury, A.; Caterson, I.D.; Johnson, N.A. Continuous exercise but not high intensity interval training improves fat distribution in overweight adults. J. Obes. 2014, 2014, 834865. [Google Scholar] [CrossRef]
- Koubaa, A. Effect of intermittent and continuous training on body composition cardiorespiratory fitness and lipid profile in obese adolescents. IOSR J. Pharm. 2013, 3, 31–37. [Google Scholar] [CrossRef]
- Lunt, H.; Draper, N.; Marshall, H.C.; Logan, F.J.; Hamlin, M.J.; Shearman, J.P.; Cotter, J.D.; Kimber, N.E.; Blackwell, G.; Frampton, C.M. High intensity interval training in a real world setting: A randomized controlled feasibility study in overweight inactive adults, measuring change in maximal oxygen uptake. PLoS ONE 2014, 9, e83256. [Google Scholar]
- Macpherson, R.E.; Hazell, T.J.; Olver, T.D.; Paterson, D.H.; Lemon, P.W. Run sprint interval training improves aerobic performance but not maximal cardiac output. Med. Sci. Sports Exerc. 2011, 43, 115–122. [Google Scholar] [CrossRef]
- Mäder, U.; Roth, P.; Furrer, R.; Brêchet, J.P.; Boutellier, U. Influence of continuous and discontinuous training protocols on subcutaneous adipose tissue and plasma substrates. Int. J. Sports Med. 2001, 22, 344–349. [Google Scholar] [CrossRef] [PubMed]
- Magalhães, J.P.; Santos, D.A.; Correia, I.R.; Hetherington-Rauth, M.; Ribeiro, R.; Raposo, J.F.; Matos, A.; Bicho, M.D.; Sardinha, L.B. Impact of combined training with different exercise intensities on inflammatory and lipid markers in type 2 diabetes: A secondary analysis from a 1-year randomized controlled trial. Cardiovasc. Diabetol. 2020, 19, 169. [Google Scholar] [CrossRef]
- Maillard, F.; Rousset, S.; Pereira, B.; Traore, A.; Del Amaze, P.d.P.; Boirie, Y.; Duclos, M.; Boisseau, N. High-intensity interval training reduces abdominal fat mass in postmenopausal women with type 2 diabetes. Diabetes Metab. 2016, 42, 433–441. [Google Scholar] [CrossRef] [PubMed]
- Martínez, S.R.; Ríos, L.J.C.; Tamayo, I.M.; Almeida, L.G.; López-Gomez, M.A.; Jara, C.C. An after-school, high-intensity, interval physical activity programme improves health-related fitness in children. Mot. Rev. Educ. Fis. 2016, 22, 359–367. [Google Scholar] [CrossRef]
- Martins, C.; Kazakova, I.; Ludviksen, M.; Mehus, I.; Wisloff, U.; Kulseng, B.; Morgan, L.; King, N. High-intensity interval training and isocaloric moderate-intensity continuous training result in similar improvements in body composition and fitness in obese individuals. Int. J. Sport Nutr. Exerc. Metab. 2016, 26, 197–204. [Google Scholar] [CrossRef]
- Matsuo, T.; Saotome, K.; Seino, S.; Eto, M.; Shimojo, N.; Matsushita, A.; Iemitsu, M.; Ohshima, H.; Tanaka, K.; Mukai, C. Low-volume, high-intensity, aerobic interval exercise for sedentary adults: VO₂max, cardiac mass, and heart rate recovery. Eur. J. Appl. Physiol. 2014, 114, 1963–1972. [Google Scholar] [CrossRef] [PubMed]
- Matsuo, T.; So, R.; Shimojo, N.; Tanaka, K. Effect of aerobic exercise training followed by a low-calorie diet on metabolic syndrome risk factors in men. Nutr Metab Cardiovasc. Dis. 2015, 25, 832–838. [Google Scholar] [CrossRef] [PubMed]
- Mohr, M.; Nordsborg, N.B.; Lindenskov, A.; Steinholm, H.; Nielsen, H.P.; Mortensen, J.; Weihe, P.; Krustrup, P. High-intensity intermittent swimming improves cardiovascular health status for women with mild hypertension. BioMed Res. Int. 2014, 2014, 728289. [Google Scholar] [CrossRef] [Green Version]
- Moreira, M.M.; Souza, H.P.; Schwingel, P.A.; Sá, C.K.; Zoppi, C.C. Effects of aerobic and anaerobic exercise on cardiac risk variables in overweight adults. Arq. Bras. Cardiol. 2008, 91, 219–226. [Google Scholar] [CrossRef] [Green Version]
- Morrissey, C.; Montero, D.; Raverdy, C.; Masson, D.; Amiot, M.J.; Vinet, A. Effects of exercise intensity on microvascular function in obese adolescents. Int. J. Sports Med. 2018, 39, 450–455. [Google Scholar] [CrossRef]
- Murphy, A.; Kist, C.; Gier, A.J.; Edwards, N.M.; Gao, Z.; Siegel, R.M. The feasibility of high-intensity interval exercise in obese adolescents. Clin. Pediatr. 2015, 54, 87–90. [Google Scholar] [CrossRef] [Green Version]
- Nalcakan, G.R. The effects of sprint interval vs. continuous endurance training on physiological and metabolic adaptations in young healthy adults. J. Hum. Kinet. 2014, 44, 97–109. [Google Scholar] [CrossRef] [PubMed] [Green Version]
- Nybo, L.; Sundstrup, E.; Jakobsen, M.D.; Mohr, M.; Hornstrup, T.; Simonsen, L.; Bülow, J.; Randers, M.B.; Nielsen, J.J.; Aagaard, P.; et al. High-intensity training versus traditional exercise interventions for promoting health. Med. Sci. Sports Exerc. 2010, 42, 1951–1958. [Google Scholar] [CrossRef] [PubMed] [Green Version]
- Oh, S.; So, R.; Shida, T.; Matsuo, T.; Kim, B.; Akiyama, K.; Isobe, T.; Okamoto, Y.; Tanaka, K.; Shoda, J. High-intensity aerobic exercise improves both hepatic fat content and stiffness in sedentary obese men with nonalcoholic fatty liver disease. Sci. Rep. 2017, 7, 43029. [Google Scholar] [CrossRef] [PubMed] [Green Version]
- Panissa, V.; Alves, E.; Salermo, G.; Franchini, E.; Takito, M. Can short-term high-intensity intermittent training reduce adiposity? Sports Sci. Health 2016, 12, 99–104. [Google Scholar] [CrossRef]
- Pasetti, S.R.; Gonçalves, A.; Padovani, C.R. Continuous training versus interval training in deep water running: Health effects for obese women. Rev. Andal. Med. Deport. 2012, 5, 3–7. [Google Scholar] [CrossRef] [Green Version]
- Ramírez-Vélez, R.; Tordecilla-Sanders, A.; Téllez, T.L.A.; Camelo-Prieto, D.; Hernández-Quiñonez, P.A.; Correa-Bautista, J.E.; Garcia-Hermoso, A.; Ramirez-Campillo, R.; Izquierdo, M. Similar cardiometabolic effects of high- and moderate-intensity training among apparently healthy inactive adults: A randomized clinical trial. J. Transl. Med. 2017, 15, 118. [Google Scholar] [CrossRef] [Green Version]
- Ramos, J.S.; Dalleck, L.C.; Borrani, F.; Mallard, A.R.; Clark, B.; Keating, S.E.; Fassett, R.G.; Coombes, J.S. The effect of different volumes of high-intensity interval training on proinsulin in participants with the metabolic syndrome: A randomised trial. Diabetologia 2016, 59, 2308–2320. [Google Scholar] [CrossRef] [Green Version]
- Reljic, D.; Wittmann, F.; Fischer, J.E. Effects of low-volume high-intensity interval training in a community setting: A pilot study. Eur. J. Appl. Physiol. 2018, 118, 1153–1167. [Google Scholar] [CrossRef]
- Sasaki, H.; Morishima, T.; Hasegawa, Y.; Mori, A.; Ijichi, T.; Kurihara, T.; Goto, K. 4 weeks of high-intensity interval training does not alter the exercise-induced growth hormone response in sedentary men. Springerplus 2014, 3, 336. [Google Scholar] [CrossRef] [Green Version]
- Schjerve, I.E.; Tyldum, G.A.; Tjønna, A.E.; Stølen, T.; Loennechen, J.P.; Hansen, H.E.; Haram, P.M.; Heinrich, G.; Bye, A.; Najjar, S.M.; et al. Both aerobic endurance and strength training programmes improve cardiovascular health in obese adults. Clin. Sci. 2008, 115, 283–293. [Google Scholar] [CrossRef] [Green Version]
- Shepherd, S.O.; Cocks, M.; Tipton, K.D.; Ranasinghe, A.M.; Barker, T.A.; Burniston, J.G.; Wagenmakers, A.J.; Shaw, C.S. Sprint interval and traditional endurance training increase net intramuscular triglyceride breakdown and expression of perilipin 2 and 5. J. Physiol. 2013, 591, 657–675. [Google Scholar] [CrossRef] [PubMed]
- Shepherd, S.O.; Wilson, O.J.; Taylor, A.S.; Thøgersen-Ntoumani, C.; Adlan, A.M.; Wagenmakers, A.J.; Shaw, C.S. Low-volume high-intensity interval training in a gym setting improves cardio-metabolic and psychological health. PLoS ONE 2015, 10, e0139056. [Google Scholar]
- Shing, C.M.; Webb, J.J.; Driller, M.W.; Williams, A.D.; Fell, J.W. Circulating adiponectin concentration and body composition are altered in response to high-intensity interval training. J. Strength Cond. Res. 2013, 27, 2213–2218. [Google Scholar] [CrossRef]
- Sijie, T.; Hainai, Y.; Fengying, Y.; Jianxiong, W. High intensity interval exercise training in overweight young women. J. Sports Med. Phys. Fit. 2012, 52, 255–262. [Google Scholar]
- Sim, A.Y.; Wallman, K.E.; Fairchild, T.J.; Guelfi, K.J. Effects of high-intensity intermittent exercise training on appetite regulation. Med. Sci. Sports Exerc. 2015, 47, 2441–2449. [Google Scholar] [CrossRef] [PubMed] [Green Version]
- Starkoff, B.E.; Eneli, I.U.; Bonny, A.E.; Hoffman, R.P.; Devor, S.T. Estimated aerobic capacity changes in adolescents with obesity following high intensity interval exercise. Int. J. Kinesiol. Sports Sci. 2014, 2, 1–8. [Google Scholar]
- Thomas, T.R.; Adeniran, S.B.; Etheridge, G.L. Effects of different running programs on VO2 max, percent fat, and plasma lipids. Can. J. Appl. Sport Sci. 1984, 9, 55–62. [Google Scholar]
- Trapp, E.G.; Chisholm, D.J.; Freund, J.; Boutcher, S.H. The effects of high-intensity intermittent exercise training on fat loss and fasting insulin levels of young women. Int. J. Obes. 2008, 32, 684–691. [Google Scholar] [CrossRef] [Green Version]
- Wallman, K.; Plant, L.A.; Rakimov, B.; Maiorana, A.J. The effects of two modes of exercise on aerobic fitness and fat mass in an overweight population. Res. Sports Med. 2009, 17, 156–170. [Google Scholar] [CrossRef]
- Winding, K.M.; Munch, G.W.; Iepsen, U.W.; Van Hall, G.; Pedersen, B.K.; Mortensen, S.P. The effect on glycaemic control of low-volume high-intensity interval training versus endurance training in individuals with type 2 diabetes. Diabetes Obes. Metab. 2018, 20, 1131–1139. [Google Scholar] [CrossRef] [Green Version]
- Zhang, H.; Tong, T.K.; Qiu, W.; Zhang, X.; Zhou, S.; Liu, Y.; He, Y. Comparable Effects of High-intensity interval training and prolonged continuous exercise training on abdominal visceral fat reduction in obese young women. J. Diabetes Res. 2017, 2017, 5071740. [Google Scholar] [CrossRef]
- Schoenfeld, B.; Dawes, J. High-intensity interval training: Applications for general fitness training. Strength Cond. J. 2009, 31, 44–46. [Google Scholar] [CrossRef] [Green Version]
- Moniz, S.C.; Islam, H.; Hazell, T.J. Mechanistic and methodological perspectives on the impact of intense interval training on post-exercise metabolism. Scand. J. Med. Sci. Sports 2020, 30, 638–651. [Google Scholar] [CrossRef]
- Thomas, D.M.; Bouchard, C.; Church, T.; Slentz, C.; Kraus, W.E.; Redman, L.M.; Martin, C.K.; Silva, A.M.; Vossen, M.; Westerterp, K.; et al. Why do individuals not lose more weight from an exercise intervention at a defined dose? An energy balance analysis. Obes. Rev. 2012, 13, 835–847. [Google Scholar] [CrossRef] [PubMed] [Green Version]
- King, N.A.; Hopkins, M.; Caudwell, P.; Stubbs, R.J.; Blundell, J.E. Individual variability following 12 weeks of supervised exercise: Identification and characterization of compensation for exercise-induced weight loss. Int. J. Obes. 2008, 32, 177–184. [Google Scholar] [CrossRef] [PubMed] [Green Version]
- Bouchard, C.; Tremblay, A.; Després, J.P.; Thériault, G.; Nadeau, A.; Lupien, P.J.; Moorjani, S.; Prudhomme, D.; Fournier, G. The response to exercise with constant energy intake in identical twins. Obes. Res. 1994, 2, 400–410. [Google Scholar] [CrossRef]
- Swift, D.L.; McGee, J.E.; Earnest, C.P.; Carlisle, E.; Nygard, M.; Johannsen, N.M. The effects of exercise and physical activity on weight loss and maintenance. Prog. Cardiovasc. Dis. 2018, 61, 206–213. [Google Scholar] [CrossRef]
- Lee, J.J.; Pedley, A.; Hoffmann, U.; Massaro, J.M.; Fox, C.S. Association of changes in abdominal fat quantity and quality with incident cardiovascular disease risk factors. J. Am. Coll. Cardiol. 2016, 68, 1509–1521. [Google Scholar] [CrossRef]
- Grgic, J.; Mcllvenna, L.C.; Fyfe, J.J.; Sabol, F.; Bishop, D.J.; Schoenfeld, B.J.; Pedisic, Z. Does aerobic training promote the same skeletal muscle hypertrophy as resistance training? a systematic review and meta-analysis. Sports Med. 2019, 49, 233–254. [Google Scholar] [CrossRef] [Green Version]
- Steele, J.; Androulakis-Korakakis, P.; Perrin, C.; Fisher, J.P.; Gentil, P.; Scott, C.; Rosenberger, A. Comparisons of resistance training and “cardio” exercise modalities as countermeasures to microgravity-induced physical deconditioning: New perspectives and lessons learned from terrestrial studies. Front. Physiol. 2019, 10, 1150. [Google Scholar] [CrossRef]
- Ekkekakis, P.; Parfitt, G.; Petruzzello, S.J. The pleasure and displeasure people feel when they exercise at different intensities: Decennial update and progress towards a tripartite rationale for exercise intensity prescription. Sports Med. 2011, 41, 641–671. [Google Scholar] [CrossRef] [PubMed]
- Rhodes, R.E.; Kates, A. Can the affective response to exercise predict future motives and physical activity behavior? a systematic review of published evidence. Ann. Behav. Med. 2015, 49, 715–731. [Google Scholar] [CrossRef]
- Oliveira, B.R.R.; Santos, T.M.; Kilpatrick, M.; Pires, F.O.; Deslandes, A.C. Affective and enjoyment responses in high intensity interval training and continuous training: A systematic review and meta-analysis. PLoS ONE 2018, 13, e0197124. [Google Scholar] [CrossRef] [Green Version]
- Nicolaï, S.P.; Kruidenier, L.M.; Leffers, P.; Hardeman, R.; Hidding, A.; Teijink, J.A. Supervised exercise versus non-supervised exercise for reducing weight in obese adults. J. Sports Med. Phys. Fit. 2009, 49, 85–90. [Google Scholar]
- Massamba, A.; Dufour, S.P.; Favret, F.; Hureau, T.J. Small-sided games are not as effective as intermittent running to stimulate aerobic metabolism in prepubertal soccer players. Int. J. Sports Physiol. Perform. 2020, 16, 273–279. [Google Scholar] [CrossRef]
- Rice, T.; Hong, Y.; Pérusse, L.; Després, J.P.; Gagnon, J.; Leon, A.S.; Skinner, J.S.; Wilmore, J.H.; Bouchard, C.; Rao, D.C. Total body fat and abdominal visceral fat response to exercise training in the HERITAGE Family Study: Evidence for major locus but no multifactorial effects. Metabolism 1999, 48, 1278–1286. [Google Scholar] [CrossRef]
- Schumann, M.; Feuerbacher, J.F.; Sünkeler, M.; Freitag, N.; Rønnestad, B.; Doma, K.; Lundberg, T. An updated systematic review and meta-analysis on the compatibility of concurrent aerobic and strength training for skeletal muscle size and function. SportRxiv 2021. [Google Scholar] [CrossRef] [PubMed]
- Sabag, A.; Little, J.P.; Johnson, N.A. Low-volume high-intensity interval training for cardiometabolic health. J. Physiol. 2021. [Google Scholar] [CrossRef]
- Calbet, J.A.L.; Ponce-González, J.G.; Calle-Herrero, J.; Perez-Suarez, I.; Martin-Rincon, M.; Santana, A.; Morales-Alamo, D.; Holmberg, H.C. Exercise preserves lean mass and performance during severe energy deficit: The role of exercise volume and dietary protein content. Front. Physiol. 2017, 8, 483. [Google Scholar] [CrossRef] [Green Version]
- Jakicic, J.M.; Marcus, B.H.; Lang, W.; Janney, C. Effect of exercise on 24-month weight loss maintenance in overweight women. Arch. Intern. Med. 2008, 168, 1550–1559, discussion 1559–1560. [Google Scholar] [CrossRef]


| Study | Sample Population (age) | Duration (weeks) | Group (n) | Modality/Intensity | Frequency (weeks) | Time per Session | Body Composition Method |
|---|---|---|---|---|---|---|---|
| [43] | Obese children (aged 8–12 years) | 12 | MICT: 15 IT: 15 | MICT: 80% of peak heart rate IT: 3–6 sets of 60 s sprint at 100% of the peak velocity with 3 min active recovery period at 50% of the exercise velocity. | MICT: 2× IT: 2× | MICT: 30–60 min IT: 9–18 min | BIA |
| [44] | Young adults with intellectual disabilities (aged 16–18 years) | 15 | MICT: 15 IT: 17 CON: 14 | MICT: Cycling, walking/running, stepping at 30% peak watts IT: First 7 weeks: 10, 15 s sprint bouts at ventilatory threshold (100 + RPM), 45 s recovery period at 50 RPM Weeks 8–15: intensity increased to 110% VT | MICT: 2× IT: 2× | MICT: 40 min IT: 40 min | BIA |
| [45] | Down syndrome adults (mean age 34 years) | 12 | MICT: 13 IT: 13 CON: 16 | MICT: Continuous cycling/walking at 70–80% VO2 peak, 85% after week 6 IT: 10 × 30 s sprints, 90 s rest period | MICT: 3× IT: 3× | MICT: 30 min IT: 30 min | BIA |
| [46] | Adolescents (mean age 16 years) | 7 | MICT: 16 IT: 17 CON: 24 | MICT: Running at moderate intensity at 70% VO2 max (VO2 max retested at week 4) IT: 4–6 all-out sprints × 30 s, 30 s recovery period (20 s recovery period for week 7) | MICT: 3× IT: 3× | MICT: 20 min IT: 16 min | Skinfolds |
| [47] | Children (mean age: 11 years) | 8 | MICT: 16 IT: 18 | MICT: Running at 65–75% HRmax IT: 3–6 bouts, 20 s max-effort sprint, 60 s rest period (40 s at week 5, 20 s at week 8) | MICT: 3× IT: 3× | MICT: 4–9 min IT: 4–9 min | BIA |
| [48] | Obese adults (mean age: 39 years) | 12 | MICT: 6 IT: 6 | MICT: Brisk walking at 4 METs IT: 4–7 intervals at a 2:1 ratio, then 5 boxing drills × 3 intervals at a 2:1 ratio, RPE 15–17 (>75% HRmax) | MICT: 4× IT: 4× | MICT: 50 min IT: 50 min | Skinfolds |
| [49] | Obese adult men (mean age: 25 years) | 4 | MICT: 8 IT: 8 | MICT: Continuous cycling @ 65% VO2 peak IT: 4–7 sprints × 30 s at 200% W-max, 120 s at 30 W in-between | MICT: 5× IT: 3× | MICT: 40–60 min IT: 10–17.5 min | DXA |
| [50] | Colorectal cancer survivors (mean age: 62 years) | 4 | MICT: 14 IT: 21 | MICT: Continuous cycling at 50–70% HRpeak IT: 4 cycling intervals × 240 s at 85–95% HRpeak, 180 s active rest | MICT: 3× IT: 3× | MICT: 50 min IT: 38 min | DXA |
| [51] | Obese children (aged 7–16 years) | 12 | MICT: 22 IT: 18 CON: 16 | MICT: 60–70% HRmax IT: 4 intervals of 240 s at 85–95% HRmax, 180 s active recovery at 50–70% HRmax | MICT: 3× IT: 3× | MICT: 44 min IT: 28 min | DXA and ADP |
| [52] | Adult men at risk for insulin resistance (mean age: 48 years) | 12 | MICT: 16 IT: 21 | MICT: Worked towards 6 kcal/kg per week for 6 weeks (+2 per week until 12 kcal/kg per week) treadmill at 50–70% VO2 max IT: Performed MICT protocol until week 6 then transitioned, 2–8 bouts of 60 s at 90–95% VO2 max, 60 s recovery period at 50% VO2 max | MICT: 3–4× IT: 3–4× | MICT: Work-dependent IT: 4–16 min | DXA |
| [53] | Obese young women (mean age: 22 years) | 8 | MICT: 7 IT: 7 CON: 6 | MICT: Continuous treadmill at 50–70% at HRpeak IT: 4 intervals of 240 s at 85–95% HRpeak, 180 s active rest | MICT: 3× IT: 3× | MICT: 41 min IT: 33 min | BIA |
| [54] | Sedentary young men (mean age: 21 years) | 8 | MICT: 6 IT: 6 | MICT: Continuous treadmill at 70–80% VO2 max IT: 12 intervals of 60 s at 90–110% VO2 max, 60 s rest period | MICT: 3× IT: 3× | MICT: 30 min IT: 30 min | DXA |
| [55] | Obese young men (aged 17–22 years) | 6 | MICT: 13 IT: 15 | MICT: Cycling at 55–65% VO2 peak IT: 4 intervals of 240 s at 15% APmax, then 30 s at 85% APmax, then 120 s at 15% APmax | MICT: 5× IT: 3× | MICT: 45–60 min IT: 20 min | DXA |
| [56] | Overweight men (aged 20–40 years) | 12 | MICT: 12 IT: 10 | MICT: Walking/jogging at 65% HRmax IT: 6–12 intervals of 60 s at 90–95% HRmax, 60 s active rest | MICT: 3× IT: 3× | MICT: 18–35 min IT: 12–24 min | DXA |
| [57] | Sedentary young men (mean age: 27 years) | 12 | MICT: 10 IT: 9 CON: 6 | MICT: Continuous cycling at 70% HRmax IT: 3 all-out intervals of 20 s at 0.5 kg/kg resistance, 120 s low-intensity active rest | MICT: 3× IT: 3× | MICT: 45 min IT: 10 min | ADP |
| [58] | Male police officers (mean age: 39 years) | 8 | MICT: 11 IT: 11 | MICT: Continuous running at 60–75% V-shuttle max IT: 7–10 intervals of 85–100% V-shuttle max (V-shuttle based on individual shuttle test results) | MICT: 3× IT: 3× | MICT: 27.8-33.4 min IT: 14.8–19.1 min | DXA |
| [59] | Overweight young women (mean age: 20 years) | 6 | MICT: 29 IT: 23 | MICT: Continuous cycling at 60–70% HRR IT: 5–7 all-out intervals of 30 s, 240 s active recovery | MICT: 3× IT: 3× | MICT: 20–30 min IT: 22.5–31.5 min | DXA |
| [60] | Healthy, sedentary older adults (aged 55–79 years) | 8 | MICT: 14 IT: 15 CONT: 14 | MICT: 70% of peak heart rate IT: 4 × 4 min intervals at 90% of peak heart rate with 3 × 3 min active recovery periods at 70% of peak heart rate. | MICT: 4× IT: 4× | MICT: 47 min IT: 40 min | DXA |
| [61] | Inactive, overweight adults (aged 18–55 years) | 12 | MICT: 11 IT: 11 CONT: 11 | MICT: 50–65% VO2peak IT: cycling, 4–6 sets of 30–60 s at 120% VO2peak with 120–180 s at 30 W. | MICT: 3× IT: 3× | MICT: 30–45 min IT: 20–24 min | DXA |
| [62] | Obese adolescents (mean age: 13 years) | 12 | MICT: 15 IT: 14 | MICT: 60–70% of VO2max IT: running for 2 min at 80–90% of VO2max followed by recovery periods of 1 min. | MICT: 3× IT: 3× | MICT: 30–40 min | Skinfolds |
| [63] | Overweight, inactive adults (aged 35–60 years) | 12 | MICT: 17 IT (AIT): 11 IT (MVIT): 16 | MICT: Walking, 65–75% of HRmax IT (AIT): jogging, 4 cycles of 4 min at 85–95% HRmax followed by 3 min recovery at 65–75% HRmax. IT (MVIT): 30 s of “all out” exercise followed by 4 min of low intensity recovery. | MICT: 3× IT (AIT): 3× IT (MVIT): 3× | MICT: 48 min IT (AIT): 40 min IT (MVIT): 24.5–40 min | BIA |
| [64] | Healthy, recreationally active young adults (mean age: 23 years) | 6 | MICT: 10 IT: 10 | MICT: running, 65% of VO2max IT: 4–6 bouts of 30 s maximal running efforts with 4 min of recovery (active recovery encouraged) | MICT: 3× IT: 3× | MICT: 30–60 min IT: 18–27 min | ADP |
| [65] | Overweight, untrained men (aged 28–46 years) | 10 | MICT: 7 IT: 7 | MICT: 50% of VO2max IT: 25 sets of 80 s at 35% VO2max followed by 40 s at 80% VO2max. | MICT: 3× IT: 3× | MICT: 50 min IT: 50 min | Skinfolds |
| [66] | Adults with type 2 diabetes (mean age: 59 years) | 52 | MICT: 24 IT: 19 CONT: 24 | MICT: cycling 40–60% of HRR IT: cycling, 2 min at 70–80% of HRR with 1 min at 40–60% of HRR. 1 min at 90% of HRR with 1 min resting at 40–60% of HRR. | MICT: 3× IT: 3× | MICT: 45 ± 7.1 min IT: 33.1 ± 6.4 min | DXA |
| [67] | Postmenopausal women with type 2 diabetes (mean age: 69 years) | 16 | MICT: 8 IT: 8 | MICT: 55–60% of individual HR reserve IT: 60 cycle (maximum) of 8 s at 77–85% HRmax with active recovery of 20–30 rpm for 12 s. | MICT: 2× IT: 2× | MICT: 40 min IT: 25 min | DXA |
| [68] | Children (aged 7–9 years) | 12 | MICT: 56 IT: 38 | MICT: 20 min of moderate-intensity aerobic exercises and games followed by 20 min of sport. IT: 20 min of 10–20 s of high-intensity intermittent exercises followed by 20 min of sports activities. | MICT: 2× IT: 2× | MICT: 40 min IT: 40 min | BIA |
| [69] | Sedentary Obese Adults (aged 34 years) | 12 | MICT: 14 IT: 16 ½ IT: 16 | MICT: 70% of peak HR IT: 8 s of maximal intensity sprint intervals on a bike at 85–90% of peak HR, with 12 s rest intervals pedaling as slow as possible. Sequence continued until the 250 kcal target was met. ½ IT: Same as IT but with a 125 kcal target. | MICT: 3× IT: 3× ½ IT: 3× | MICT: 32 min(avg.) IT: 20 min(avg.) ½ IT: 10 min (avg.) | DXA |
| [70] | Sedentary adult men (aged 29 years) | 8 | MICT: 12 IT: 12 | MICT: 60-65% VO2max IT: 3, 3 min intervals of high intensity cycling at 80–85% VO2max with 2 active rest intervals. | MICT: 3× IT: 3× | MICT: 45 min IT: 18 min total including 5 min of combined warm-up and cool down. | DXA |
| [71] | Adult men with metabolic syndrome (mean age: 48 years) | 8 | MICT: 13 IT: 13 | MICT: cycling at 60–65% of VO2peak IT: 3 sets of 3 min cycling at 80–85% VO2peak with a 2 min active rest between sets at 50% VO2peak | MICT: 3× IT: 3× | MICT: 45 min IT: 18 min | DXA |
| [72] | Sedentary premenopausal women (mean age: 45 years) | 15 | MICT: 21 IT: 21 CON: 20 | MICT: Moderate intensity swimming at ~70% HRmax. IT: 6–10 × 30 s all-out swimming with 2 min recovery in between each bout at.~90% HRmax | MICT:3× IT: 3× | MICT: 1 h IT: 15–25 min total. | DXA |
| [73] | Overweight adults (mean age: 40 years) | 12 | MICT: 8 IT: 8 CON: 7 | MICT: Biking at 10% lower than anaerobic threshold. IT: Biking at 20% above anaerobic threshold with an exercise:pause ratio of 2:1. | MICT: 3× IT: 3× | Both groups completed 20 min in the first week, with increments of 10 min per week until a total of 60 min per session was reached in the fourth week. | BIA |
| [74] | Obese adolescents (mean age: 15 years) | 12 | MICT: 13 IT: 16 | MICT: Boxing and Nordic walking at 60–75% of maximal HR. IT: 4 to 6 intervals of 2 min–2 min 30 s in duration at 90–95% of HRmax interspersed by 1 min 30 s intervals at 55% of HRmax | MICT: 3× IT: 3× | MICT: 40 to 60 min. IT: 24 to 32 mins | DXA |
| [75] | Obese adolescents (mean age: 14 years) | 4 | MICT: 8 IT: 10 | MICT: 65% HRmax IT: 1 min vigorous treadmill exercise at 80% to 90% HRmax interspersed with 2 min recovery intervals at 60% HRmax | MICT: 3× IT: 3× | MICT: 50 min | BIA |
| [76] | Recreationally active men (mean age: 21.7 years) | 7 | MICT: 7 IT: 8 | MICT: Cycling at 60% of VO2max. IT: 4–6 Wingate sprints (resistance = 7.5% of subject BW) with 4.5 min recovery | MICT: 3× IT: 3× | MICT: 30–50 min IT: 30 min | Skinfolds |
| [77] | Untrained men (mean age: 33 years) | 12 | MICT: 9 IT; 8 CON:11 | MICT: 80% HRmax IT: Five intervals of 2 min of near-maximal running (HR above 95% of their HRmax at the end of the 2 min period interspersed by 1 min rest. | MICT: 3× IT: 2× (attempted 3 but accomplished 2 on average due to injuries or other reasons) | MICT: 1 h IT: 20 min | DXA |
| [78] | Sedentary obese males (mean age: 48.4 years) | 12 | MICT: 13 IT: 20 | MICT: Cycling at 60–65% VO2max IT: 3 sets of 180 s cycling at 80–85% VO2max with 120 s recovery period at 50% VO2max | MICT: 3× IT: 3× | MICT: 40 min IT 13 min | DXA |
| [79] | Untrained women (mean age: 28.4 years) | 6 | MICT: 12 IT: 11 | MICT: Cycling at 70% HRmax IT: Cycling 15 sets 60 s at 90% HRmax with 30 s recovery period at 60% HRmax | MICT: 3× IT: 3× | MICT: 29 min IT: 22 min | Skinfolds |
| [80] | Untrained obese women (mean age: 46 years) | 12 | MICT: 12 IT: 18 | MICT: Deep water running at 65–85% HRR IT: Deep water running 8–15, 15 s sprints with 30s recovery interspersed with 5–14 min intervals at 70–75% HRmax | MICT: 3× IT: 3× | MICT: 47 min IT: 47 min (including recovery periods) | Skinfolds |
| [81] | Healthy physically inactive adults (mean age: 32 years) | 12 | MICT: 9 IT: 11 | MICT: Treadmill, 60–80% HRR IT: Treadmill, 4 sets 240 s at 85–95% peak HRR with 240 s recovery period at 65% peak HRR | MICT: 3× IT: 3× | MICT: 20–65 min (including warm up and cool down) IT: 35 to 55 min (including warm up and cool down) | BIA |
| [82] | Adults with metabolic syndrome (mean age: 57 years) | 16 | MICT: 21 IT (a): 22 IT (b): 23 | MICT: Cycling, 60–70% of peak heart rate IT (a) Cycling, 4HIIT group-4 240 s sets at 85–95% peak heart rate with 180 s recovery period at 50–70% peak heart rate IT (b) Cycling, 1HIIT group- 1 set 240 s at 85–95% peak heart rate with 180 s cool down at 60–70% peak heart rate | MICT: 5× IT (a): 3× IT (b): 3× | MICT: 30 min IT (a): 4HIIT, 38 min (including warm up and cool down). IT (b): 1 HIIT, 17 min (including warm up and cool down) | DXA |
| [83] | Sedentary adults (mean age: 31 years) | 8 | MICT: 7 IT (a): 9 IT (b): 11 | MICT: Cycling, 65–75% HRmax IT (a): 2 × 4 HIIT, cycling 2 sets 240 s at 85–95% HRMax with 120 s active rest IT (b): 5 × 1 HIIT, cycling 5 sets 60 s at 85–95% HRMax with 60 s active rest | MICT: 2× IT (a): 2× IT (b): 2× | MICT: 38 min (including warm up and cool down) IT (a): 15 min (including warm up and cool down) IT (b): 14 min (Including warm up and cool down) | BIA |
| [84] | Sedentary males (age not reported) | 4 | MICT:12 IT: 12 | MICT: Cycling, 45% VO2max IT: Cycling, 10 sets, 60 s at 85% VO2max with 30 s rest period between sets | MICT:3× IT:3× | MICT: 22 min IT: 15 min (including rest periods) | BIA |
| [85] | Obese adults (mean age: 46 years) | 12 | MICT: 13 IT:14 | MICT: Treadmill, 60–70% HRMax IT: Treadmill, 4 sets 240 s at 85–95% HRMax with 180 s rest periods at 50–60% HRMax | MICT:3× IT: 3× | MICT: 47 min IT: 42 min (including warm up and cool down) | DXA |
| [86] | Sedentary males (mean age: 2 years) | 6 | MICT: 8 IT: 8 | MICT: Cycling, ~65% VO2Peak IT: Cycling, four to six, 30 s ‘all out’ sprints (Wingate test) with 270 s rest between each test | MICT:5× IT:3× | MICT: 40 to 60 min IT: 20–30 min (including rest periods) | DXA |
| [87] | Overweight adults (mean age: 42 years) | 10 | MICT: 44 IT: 46 | MICT: Cycling, ~70% MHR IT: Cycling, >90% MHR, repeated sprints of 15–60 s, interspersed with periods of recovery cycling | MICT: 5× IT: 3× | MICT: 30–45 min IT: 18–25 min | BIA |
| [88] | Trained young adults (mean age: 19 years) | 8 | MICT: 7 IT: 7 | MICT: Rowing, Blood Lactate Concentrations of 2–3 mmol/L IT: Rowing, eight, 2.5 min intervals at 90% of mean 4 min maximal power output achieved during the incremental exercise test. Recovery duration was until HR returned 70% MHR, at 40% of mean maximal power output | MICT: 2× IT: 2× | MICT: 35/40 min IT: 27–55 min (including recovery) | DXA |
| [89] | Overweight Young Adults (mean age: 20 years) | 12 | MICT: 16 IT: 17 CON: 19 | MICT: Walking/Jogging, HR associated with 50% of VO2max IT: Running, five, 3 min intervals at the HR associated with 85% VO2max with 3 min active rest at HR associated 50% VO2max between each interval | MICT: 5× IT: 5× | MICT: 55 min IT: 42 min (Including warm up and cool down) | DXA |
| [90] | Overweight Males (mean age: 31 yrs) | 12 | MICT: 10 IT: 10 CON: 10 | MICT: Cycling, ~60% VO2peak IT: Cycling, 15 s at a power output equivalent to ~170% VO2peak with an active recovery period of 60 s at a power output equivalent to ~32% VO2peak Relative total work was matched between both groups | MICT: 3× IT: 3× | MICT: 30–45 min IT: 30–45 min | DXA |
| [91] | Obese Children (mean age: 15 years) | 6 | MICT: 13 IT: 14 | MICT: Cycling, 65–70% APMHR IT: Cycling, ten, 2 min bouts at 90–95% APMHR, with 1 min of active recovery at 55% APMHR between each bout | MICT: 3× IT: 3× | MICT: 40 min IT: 40 min (Including warmup and cool down) | ADP |
| [92] | Healthy Untrained Adults (aged 18–32 years) | 12 | MICT A: 14 MICT B: 18 IT: 15 | MICT A: Running, 4 m, 75% MHR MICT B: Running, 2 m, 75% MHR IT: Running, 8 bouts of 60 s intervals at 90% MHR followed by 180 s rest between each bout | MICT: 3× IT: 3× | MICT A: ~32 min/~500 cal/session MICT B: ~16 min/~250 cal/session IT: 29 min | Hydrostatic densitometry |
| [93] | Healthy Inactive Young Females (mean age: 21 years) | 15 | MICT: 15 IT: 15 | MICT: Cycling, 60% VO2peak IT: Cycling, maximum of 60 bouts of 8 s:12 s ratio of sprinting and slow pedaling | MICT: 3× IT: 3× | MICT: 20–50 min IT: 15–30 min (Including warmup and cool down | DXA |
| [94] | Obese Adults (mean age: 43 years) | 8 | MICT: 6 IT: 7 CON: 8 | MICT: Cycling, 50–65% VO2 peak IT: 2 min ratio of high to low intensity of 90–105% VO2peak and 30–45% VO2peak | MICT: 4× IT: 4× | MICT: 30 min IT:30 min (Including recovery) | DXA |
| [95] | Overweight Adults (mean age: 56 years) | 11 | MICT: 12 IT: 13 CON: 7 | MICT: Cycling, 50% Wpeak IT: Cycling, 1 min at 95% Wpeak, with 1 min active recovery at 20% Wpeak between each bout. | MICT: 3× IT: 3× | MICT: 135 min IT: 75 min (Including the warmup) | DXA |
| [96] | Overweight Young Females (mean age: 21 years) | 12 | MICT: 15 IT: 15 CON: 13 | MICT: Cycling, 60% VO2max until 300 kJ of work is reached IT: Cycling, repeated 4 min bouts at 90% VO2max with 3 min passive recovery between bouts until 300 kJ of work is reached | MICT: 3–4× IT: 3–4× | MICT: Until 300 kJ of work was reached IT: Until 300 kJ of work was reached | DXA |
| Characteristic | Number of Groups within Studies = 60 |
|---|---|
| Age (years) | 30 (21, 44) |
| Unknown | 1 |
| Sex (% Male) | 54 (32, 100) |
| BMI (kg·m2) | 28.3 (25.4, 30.5) |
| Unknown | 7 |
| Training Status | |
| Recreationally Active | 1 (1.7%) |
| Trained | 1 (1.7%) |
| Untrained | 58 (97%) |
| Was Nutrition Controlled? | |
| No | 31 (52%) |
| Yes | 29 (48%) |
| Included Caloric Deficit? | |
| No | 57 (95%) |
| Yes | 3 (5.0%) |
| Include Resistance Training Intervention? | |
| No | 59 (98%) |
| Yes | 1 (1.7%) |
| Were IT/MICT Work-Matched? | |
| No | 34 (57%) |
| Yes | 25 (42%) |
| Yes, matched for time | 1 (1.7%) |
| Intervention Duration (weeks) | 12 (8, 12) |
| IT Frequency (median days per week) | |
| 2 | 8 (13%) |
| 3 | 44 (73%) |
| 3.5 | 2 (3.3%) |
| 4 | 3 (5.0%) |
| 4.5 | 2 (3.3%) |
| 5 | 1 (1.7%) |
| MICT Frequency (median days per week) | |
| 2 | 8 (13%) |
| 3 | 38 (63%) |
| 3.5 | 2 (3.3%) |
| 4 | 3 (5.0%) |
| 4.5 | 2 (3.3%) |
| 5 | 7 (12%) |
| Was IT Performed as SIT or HIIT? | |
| HIIT | 45 (75%) |
| SIT | 15 (25%) |
| IT Interval Number Performed | 5 (4, 10) |
| Unknown | 5 |
| IT Interval Duration (median s) | 60 (30, 180) |
| IT Total Exercise Duration (min) | 9.4 (3.4, 16.0) |
| MICT Session Duration (min) | 38 (30, 45) |
| Unknown | 3 |
| IT Adherence (% Sessions) | 90 (83, 98) |
| Unknown | 24 |
| MICT Adherence (% Sessions) | 90 (84, 97) |
| Unknown | 25 |
| IT Adverse Event Number | |
| 0 | 12 (63%) |
| 1 | 2 (11%) |
| 2 | 2 (11%) |
| 3 | 1 (5.3%) |
| 4 | 1 (5.3%) |
| 5 | 1 (5.3%) |
| Unknown | 41 |
| MICT Adverse Event Number | |
| 0 | 10 (67%) |
| 1 | 3 (20%) |
| 2 | 2 (13%) |
| Unknown | 45 |
Publisher’s Note: MDPI stays neutral with regard to jurisdictional claims in published maps and institutional affiliations. |
© 2021 by the authors. Licensee MDPI, Basel, Switzerland. This article is an open access article distributed under the terms and conditions of the Creative Commons Attribution (CC BY) license (https://creativecommons.org/licenses/by/4.0/).
Share and Cite
Steele, J.; Plotkin, D.; Van Every, D.; Rosa, A.; Zambrano, H.; Mendelovits, B.; Carrasquillo-Mercado, M.; Grgic, J.; Schoenfeld, B.J. Slow and Steady, or Hard and Fast? A Systematic Review and Meta-Analysis of Studies Comparing Body Composition Changes between Interval Training and Moderate Intensity Continuous Training. Sports 2021, 9, 155. https://doi.org/10.3390/sports9110155
Steele J, Plotkin D, Van Every D, Rosa A, Zambrano H, Mendelovits B, Carrasquillo-Mercado M, Grgic J, Schoenfeld BJ. Slow and Steady, or Hard and Fast? A Systematic Review and Meta-Analysis of Studies Comparing Body Composition Changes between Interval Training and Moderate Intensity Continuous Training. Sports. 2021; 9(11):155. https://doi.org/10.3390/sports9110155
Chicago/Turabian StyleSteele, James, Daniel Plotkin, Derrick Van Every, Avery Rosa, Hugo Zambrano, Benjiman Mendelovits, Mariella Carrasquillo-Mercado, Jozo Grgic, and Brad J. Schoenfeld. 2021. "Slow and Steady, or Hard and Fast? A Systematic Review and Meta-Analysis of Studies Comparing Body Composition Changes between Interval Training and Moderate Intensity Continuous Training" Sports 9, no. 11: 155. https://doi.org/10.3390/sports9110155