Physiological Predictors of Performance on the CrossFit “Murph” Challenge
Abstract
1. Introduction
2. Materials and Methods
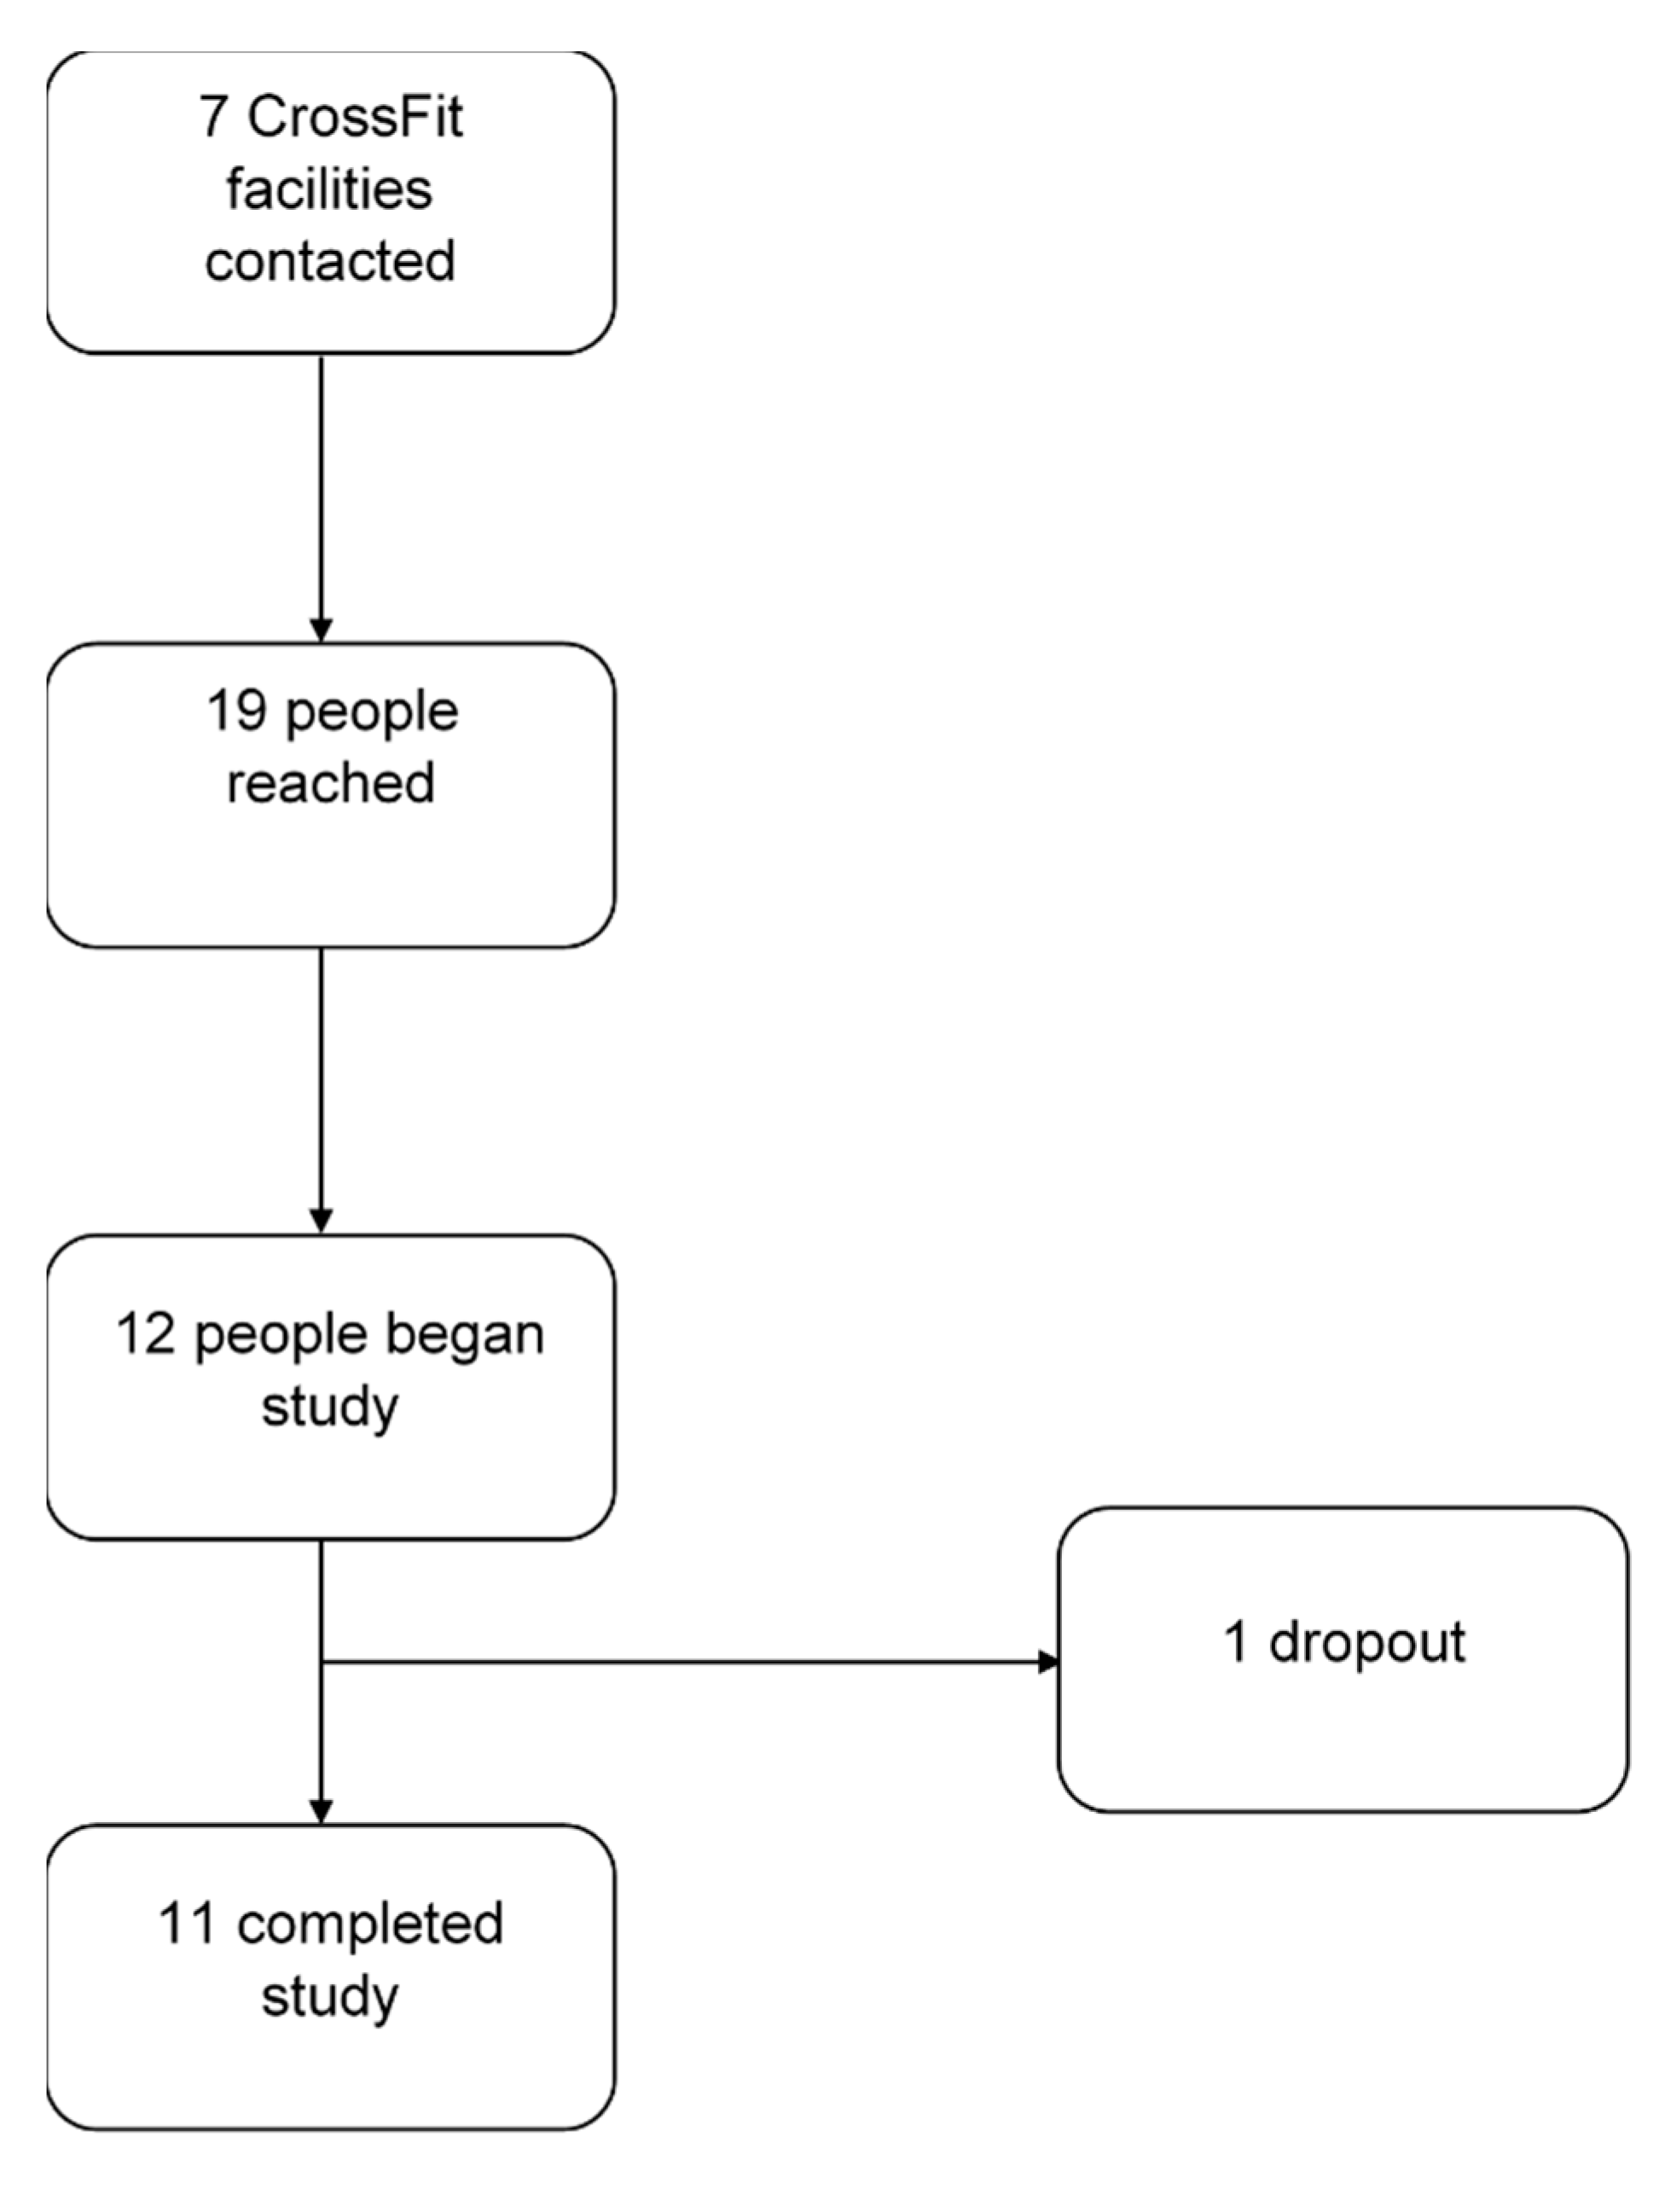
2.1. Participants
2.2. Body Composition
2.3. Muscular Strength
2.4. Upper-Body Endurance
2.5. Wingate Anaerobic Test
2.6. Cardiorespiratory Fitness (VO2Max)
2.7. Visit 2
2.8. Statistical Analysis
3. Results
3.1. Participant Characteristics
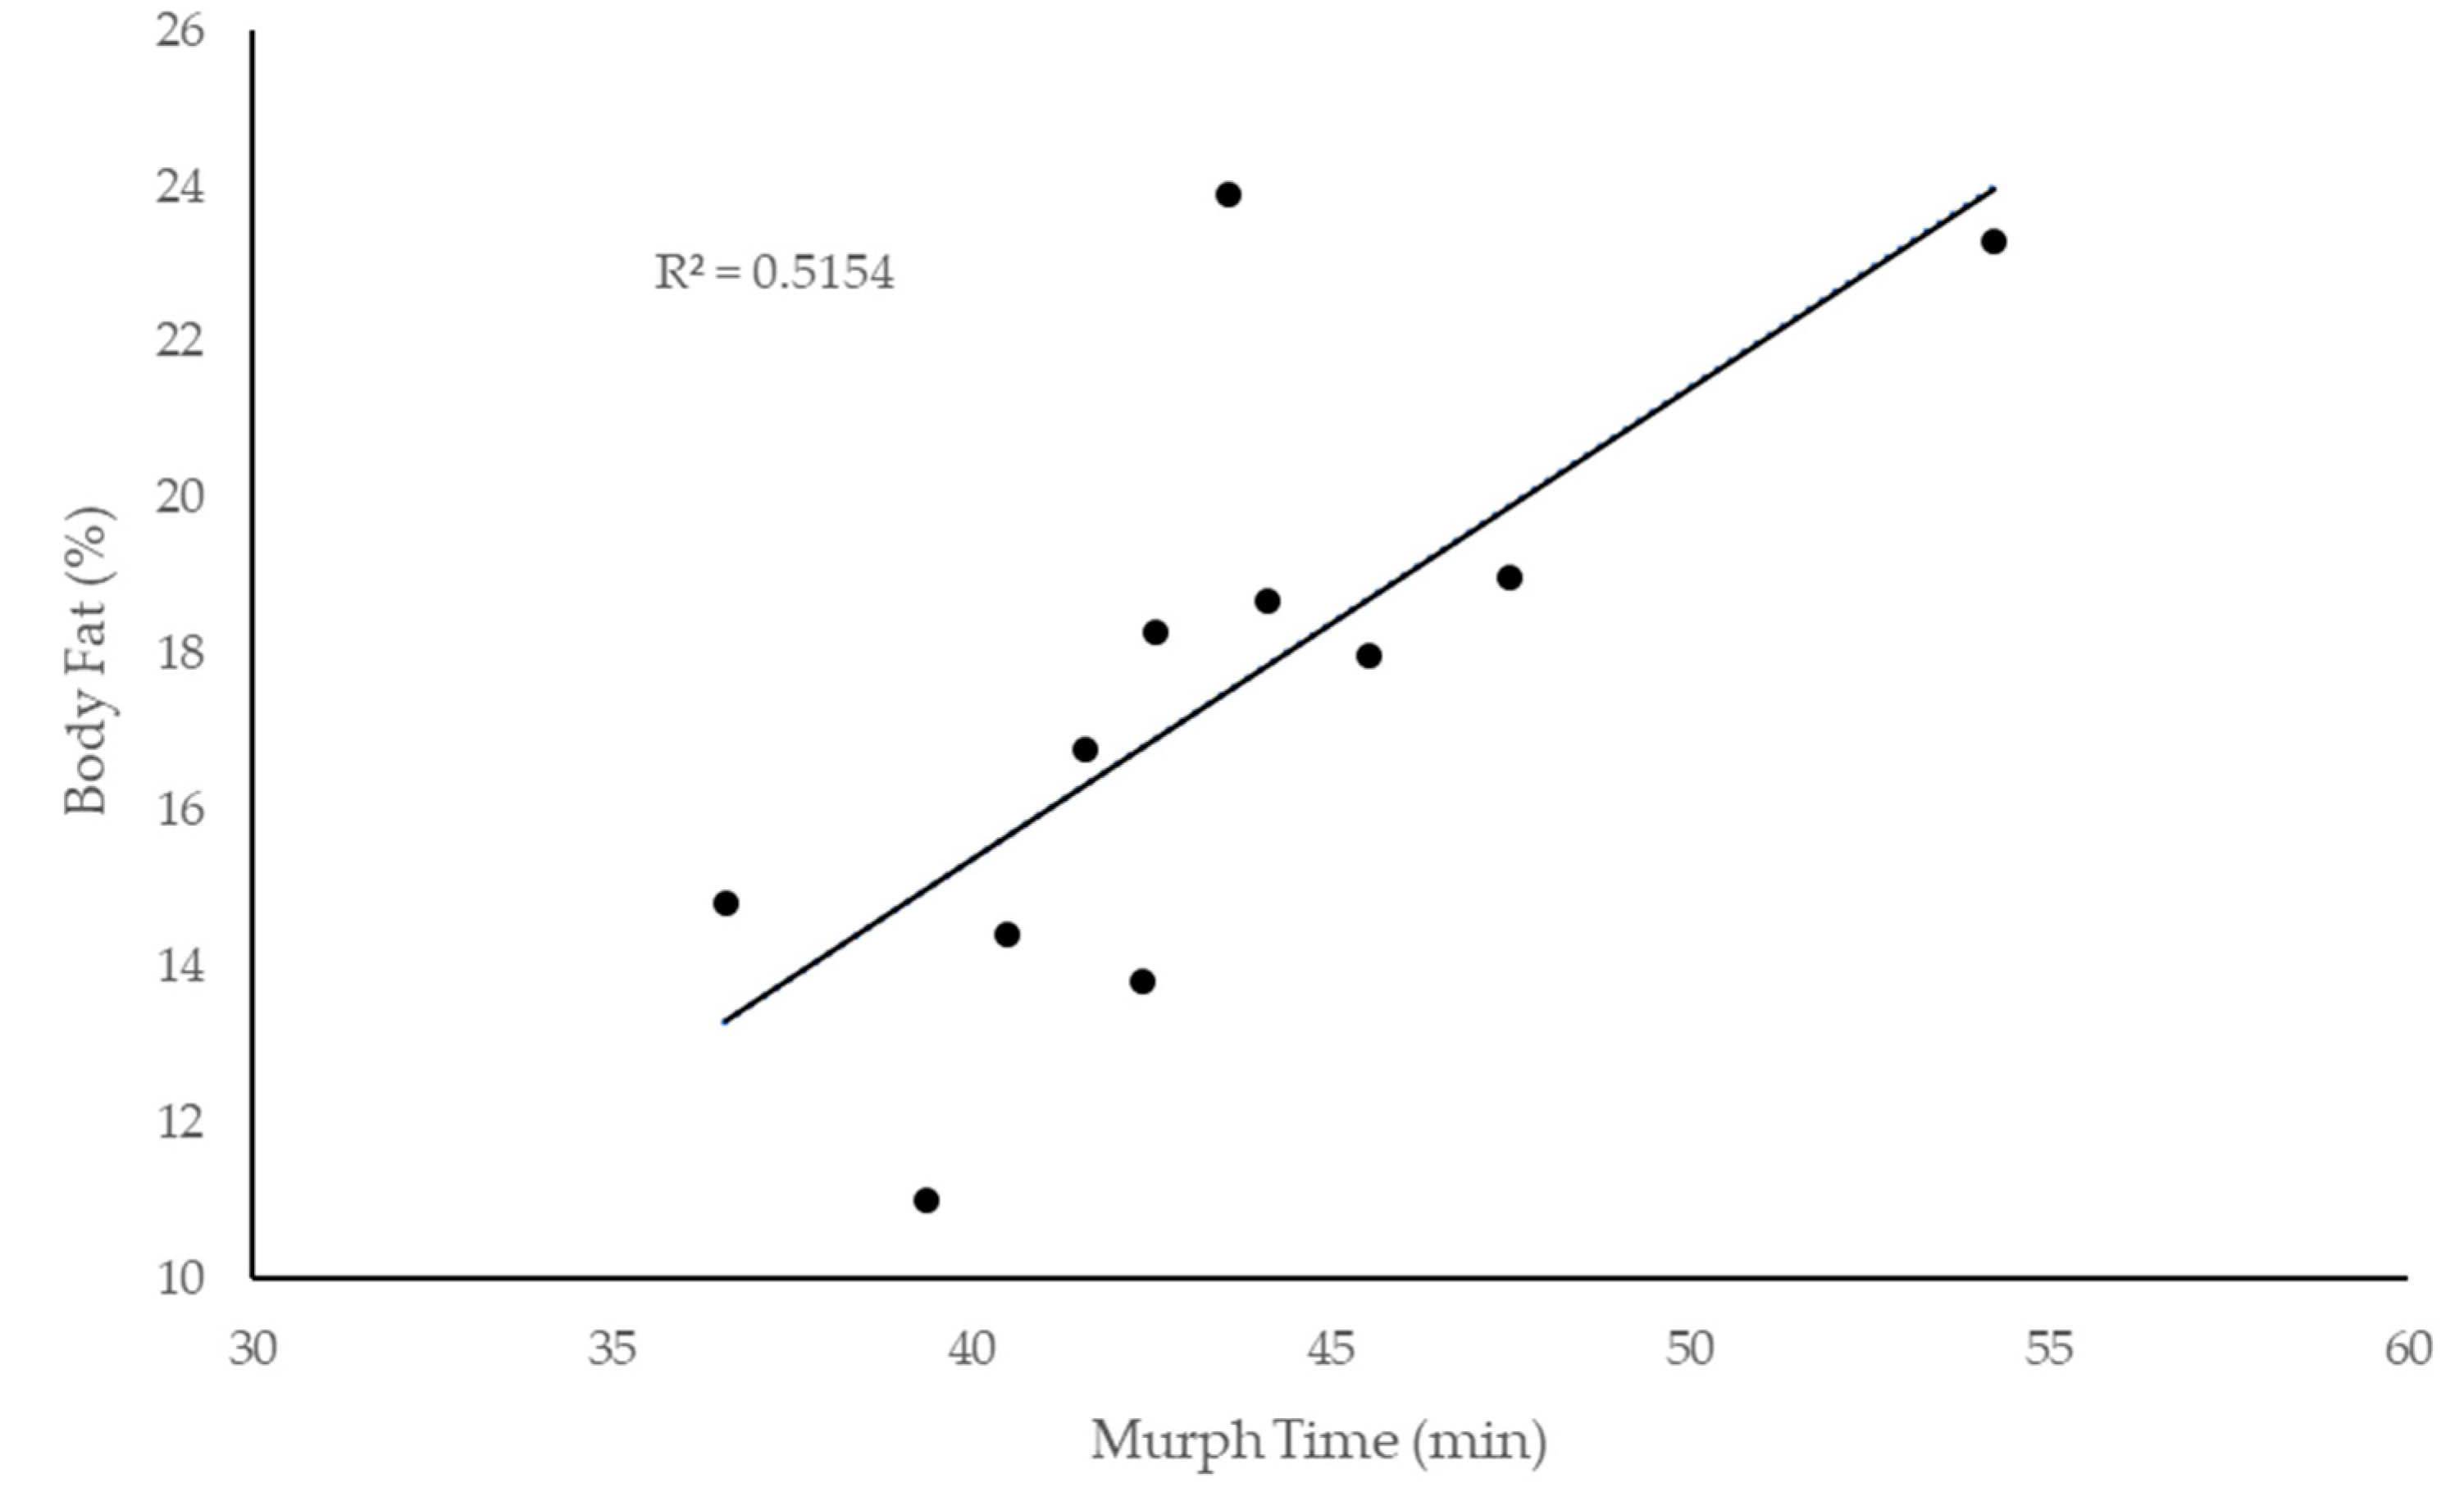
3.2. Physiological Responses and Predictors of Murph
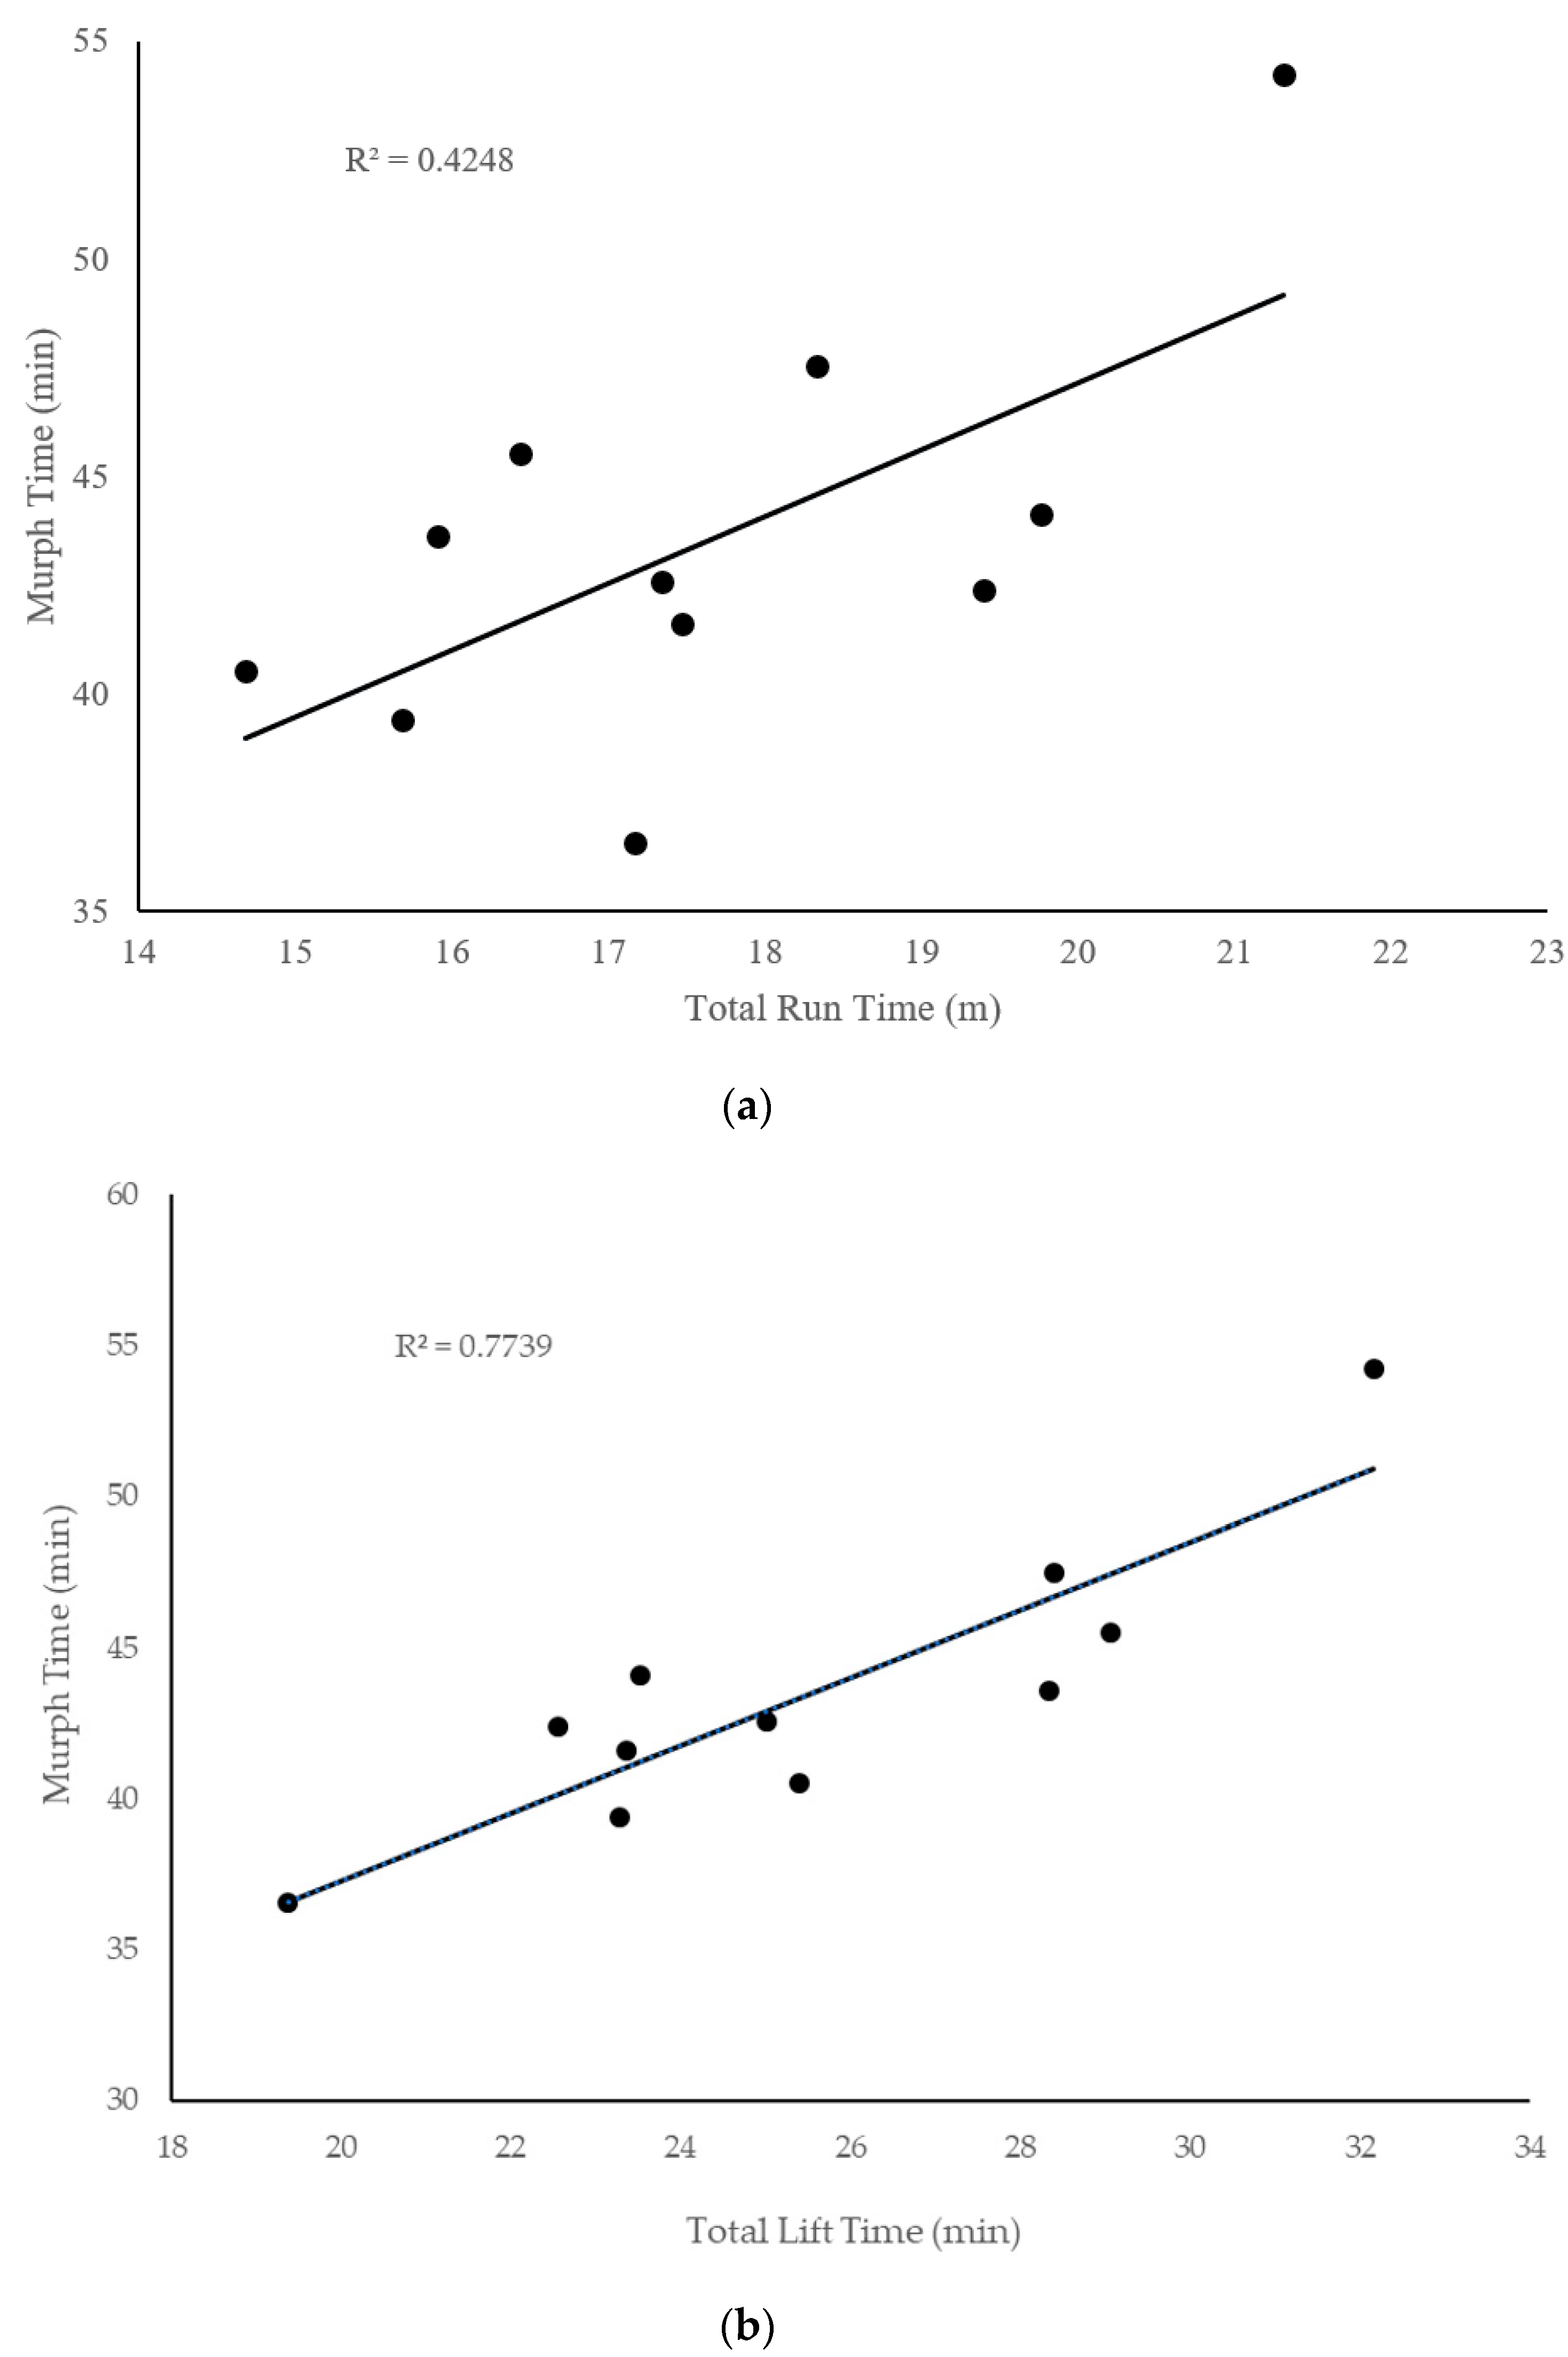
3.3. Physiological Predictors of Murph Subcomponents
4. Discussion
4.1. Summary
4.2. Predictors of Murph Performance
4.3. Sub-Components Analysis
4.4. Limitations
5. Conclusions
Author Contributions
Funding
Conflicts of Interest
References
- Lexico. Lexico Powered by Oxford. 2020. Available online: https://www.lexico.com/en/definition/crossfit (accessed on 21 June 2020).
- Crossfit.com. about Affiliation. Availabe online: https://www.crossfit.com/affiliate (accessed on 12 September 2019).
- The Murph Challenge Official Leaderboard. 2019. Available online: Themurphchallenge.com (accessed on 15 September 2019).
- Chamiri, K.; Chaouachi, A.; Racinais, S. Anaerobic Power and Capacity. In Exercise Physiology: From a Cellular to an Integrative Approach; IOS Press: Amsterdam, The Netherlands, 2010. [Google Scholar]
- Tabata, I.; Ogita, F.; Miyachi, M. Effects of moderate-intensity endurance and high-intensity intermittent training on anaerobic capacity and VO(2max). Med. Sci. Sports Exerc. 1996, 28, 1327–1330. [Google Scholar] [CrossRef] [PubMed]
- Kell, R.T.; Bell, G.; Quinney, A. Musculoskeletal Fitness, Health Outcomes and Quality of Lift. Sports Med. 2001, 31, 863–873. [Google Scholar] [CrossRef] [PubMed]
- Abadie, B.R.; Wentworth, M.C. Prediction of one repetition maximal strength from a 5–10 repetition submaximal strength test in college-aged females. J. Exerc. Physiol. Online 2000, 3, 1–8. [Google Scholar]
- Bellar, D.; Hatchett, A.; Judge, L.W.; Breaux, M.E.; Marcus, L. The relationship of aerobic capacity, anaerobic peak power and experience to performance in CrossFit exercise. Biol. Sport 2015, 32, 315–320. [Google Scholar] [CrossRef]
- Butcher, S.J.; Neyedly, T.J.; Horvey, K.J.; Benko, C.R. Do physiological measures predict selected CrossFit® benchmark performance? Open Access J. Sports Med. 2015, 6, 241–247. [Google Scholar] [CrossRef]
- Dexheimer, J.D.; Schroeder, E.T.; Sawyer, B.J.; Pettitt, R.W.; Aguinaldo, A.L.; Torrence, W.A. Physiological Performance Measures as Indicators of CrossFit® Performance. Sports 2019, 7, 93. [Google Scholar] [CrossRef]
- Feito, Y.; Giardina, M.J.; Butcher, S.; Mangine, G.T. Repeated anaerobic tests predict performance among a group of advanced CrossFit-trained athletes. Appl. Physiol. Nutr. Metab. 2019, 44, 727–735. [Google Scholar] [CrossRef]
- Schoenfeld, B.J.; Peterson, M.D.; Ogborn, D.; Contreras, B.; Sonmez, G.T. Effects of Low- vs. High-Load Resistance Training on Muscle Strength and Hypertrophy in Well-Trained Men. J. Strength Cond Res. 2015, 29, 2954–2963. [Google Scholar] [CrossRef]
- Riebe, D.; Ehrman, J.; Liquori, G.; Magal, M. ACSM’s Guidelines for Exercise Testing and Prescription, 10th ed.; Wolters Kluwer: Philadelphia, PA, USA, 2018. [Google Scholar]
- Imboden, M.T.; Welch, W.A.; Swartz, A.M.; Montoye, A.H.; Finch, H.W.; Harber, M.P.; Kaminsky, L.A. Reference standards for body fat measures using GE dual energy X-ray absorptiometry in Caucasian adults. PLoS ONE 2017, 12, e0175110. [Google Scholar] [CrossRef]
- Nikolaidis, P.T. Physical Fitness is Inversely Related with Body Mass Index and Body Fat Percentage in Soccer Players Aged 16–18. Med. Pregl. 2012, 65, 470–475. [Google Scholar] [CrossRef]
- Sporis, G.; Jukic, I.; Bok, D.; Vuleta, D., Jr.; Harasin, D. Impact of Body Composition on Performance in Fitness Tests among Personnel of the Croatian Navy. Coll. Antropol. 2011, 35, 335–339. [Google Scholar] [PubMed]
- Mangine, G.T.; Stratton, M.T.; Almeda, C.G.; Roberts, M.D.; Esmat, T.A.; VanDusseldorp, T.A.; Feito, Y. Physiological differences between advanced CrossFit athletes, recreational CrossFit participants, and physically-active adults. PLoS ONE 2020, 15, e0223548. [Google Scholar] [CrossRef] [PubMed]
- Pihlainen, K.; Santtila, M.; Hakkinen, K.; Kyrolainen, H. Associations of Physical Fitness and Body Composition Characteristics with Simulated Military Task Performance. J. Strength Cond. Res. 2018, 32, 1089–1098. [Google Scholar] [CrossRef] [PubMed]
- Crawford, K.; Fleishman, K.; Abt, J.P.; Sell, T.C.; Lovalekar, M.; Nagai, T.; Deluzio, J.; Rowe, R.S.; McGrail, M.A.; Lephart, S.M. Less body fat improves physical and physiological performance in army soldiers. Mil. Med. 2011, 176, 35–43. [Google Scholar] [CrossRef] [PubMed]
- Barandun, U.; Knechtle, B.; Knechtle, P.; Klipstein, A.; Rust, C.A.; Rosemann, T.; Lepers, R. Running speed during training and percent body fat predict race time in recreational male marathoners. Open Access J. Sports Med. 2012, 3, 51–58. [Google Scholar] [CrossRef]
- Tanda, G.; Knechtle, B. Marathon performance in relation to body fat percentage and training indices in recreational male runners. Open Access J. Sports Med. 2013, 4, 141–149. [Google Scholar]
- Knechtle, B.; Barandun, U.; Knechtle, P.; Zingg, M.A.; Rosemann, T.; Rust, C.A. Prediction of half-marathon race time in recreational female and male runners. SpringerPlus 2014, 3, 248. [Google Scholar] [CrossRef]
- Dean, J.A.; Foster, C.; Thompson, N. A simplified method of assessing muscular strength. Med. Sci. Sports Exerc. 1987, 19, S63. [Google Scholar] [CrossRef]
- Invergo, J.J.; Ball, T.E.; Looney, M. Relationship of Push-ups and Absolute Muscular Endurance to Bench Press Strength. J. Appl. Sport Sci. Res. 1991, 5, 121–125. [Google Scholar]
- Mayhew, J.L.; Ball, T.E.; Arnold, M.D.; Bowen, J.C. Push-ups as a Measure of Upper Body Strength. J. Appl. Sport Sci. Res. 1991, 5, 16–21. [Google Scholar]
- Coyle, E.F. Integration of the physiological factors determining endurance performance ability. Exerc. Sport Sci. Rev. 1995, 23, 25–63. [Google Scholar] [CrossRef] [PubMed]
- Vorup, J.; Tybirk, J.; Gunnarsson, T.P.; Ravnholt, T.; Dalsgaard, S.; Bangsbo, J. Effect of speed endurance and strength training on performance, running economy and muscular adaptations in endurance-trained runners. Eur. J. Appl. Physiol. 2016, 116, 1331–1341. [Google Scholar] [CrossRef] [PubMed]
- Nummela, A.T.; Paavolainen, L.M.; Sharwood, K.A.; Lambert, M.I.; Noakes, T.D.; Rusko, H.K. Neuromuscular factors determining 5 km running performance and running economy in well-trained athletes. Eur. J. Appl. Physiol. 2006, 97, 1–8. [Google Scholar] [CrossRef] [PubMed]
- Baumann, C.W.; Rupp, J.C.; Ingalls, C.P.; Doyle, J.A. Anaerobic work capacity’s contribution to 5-km-race performance in female runners. Int. J. Sports Physiol. Perform 2012, 7, 170–174. [Google Scholar] [CrossRef] [PubMed]
- Jones, A.M.; Doust, J.H. A 1% Treadmill Grade Most Accurately Reflects the Energy Cost of Outdoor Running. J. Sports Sci. 1996, 14, 321–327. [Google Scholar] [CrossRef] [PubMed]


| Mean (±sd) | |
|---|---|
| Age (years) | 27.18 ± 3.31 |
| CrossFit Experience (months) | 46.82 ± 30.70 |
| Body Mass (kg) | 83.32 ± 12.76 |
| BMI (kg/m2) | 26.74 ± 2.41 |
| Height (cm) | 176.09 ± 7.76 |
| Physiological Parameter | Mean (±sd) | r-Value | p-Value |
|---|---|---|---|
| Body Composition | |||
| Body Fat (%) | 17.45 ± 3.90 | 0.718 * | 0.013 |
| Muscular Strength and Endurance | |||
| Strength Total (kg) | 267.09 ± 56.57 | −0.023 | 0.947 |
| Relative Strength Total | 3.04 ± 0.71 | −0.002 | 0.996 |
| Upper Body Endurance (repetitions) | 33.27 ± 5.46 | −0.021 | 0.95 |
| Anaerobic Power | |||
| Peak Power (W) | 1054.25 ± 190.63 | 0.024 | 0.943 |
| Relative Peak Power (W/kg) | 12.42 ± 1.13 | −0.347 | 0.296 |
| Average Power (W) | 765.91 ± 128.73 | −0.014 | 0.968 |
| Relative Average Power (W/kg) | 9.00 ± 0.70 | −0.436 | 0.180 |
| Anaerobic Fatigue (%) | 53.78 ± 6.65 | 0.165 | 0.628 |
| Work (kJ) | 21.97 ± 3.65 | −0.074 | 0.828 |
| Aerobic Capacity | |||
| VO2max (L/min) | 4.14 ± 0.87 | −0.061 | −0.858 |
| VO2max (mL/kg/min) | 49.52 ± 7.13 | −0.423 | 0.195 |
| Physiological Responses | |||
| Post Lactate (mmol/L) | 10.01 ± 3.04 | −0.343 | 0.366 |
| Change in lactate (mmol/L) | 7.60 ± 3.50 | −0.408 | 0.316 |
| Max HR (bpm) | 185.63 ± 7.64 | −0.294 | 0.381 |
| Average HR (bpm) | 168.81 ± 6.41 | −0.056 | 0.871 |
| Murph Subcomponents | |||
| Run 1 (min) | 7.46 ± 1.84 | 0.206 | 0.544 |
| Run 2 (min) | 10.10 ± 1.71 | 0.509 | 0.110 |
| Total Run (min) | 17.60 ± 1.97 | 0.652 * | 0.030 |
| Lift Time (min) | 25.49 ± 3.65 | 0.880 ** | <0.001 |
| Physiological Parameter | Run 1 | Run 2 | Total Run | Total Lift |
|---|---|---|---|---|
| Body Composition | ||||
| Body Fat (r) | 0.337 | 0.797 ** | 0.386 | 0.728 * |
| p | 0.31 | 0.003 | 0.241 | 0.011 |
| Muscular Strength and Endurance | ||||
| Strength Total (r) | 0.242 | −0.167 | 0.051 | −0.097 |
| p | 0.473 | 0.623 | 0.881 | 0.776 |
| Relative Strength Total (r) | 0.384 | 0.155 | 0.483 | −0.32 |
| p | 0.244 | 0.648 | 0.132 | 0.338 |
| Bench Endurance (r) | −0.526 | 0.354 | −0.188 | 0.135 |
| p | 0.096 | 0.285 | 0.581 | 0.693 |
| Anaerobic Power | ||||
| Peak Power (r) | 0.04 | −0.175 | −0.138 | 0.091 |
| p | 0.907 | 0.606 | 0.685 | 0.791 |
| Relative Peak Power (r) | 0.026 | −0.23 | −0.181 | −0.321 |
| p | 0.941 | 0.496 | 0.594 | 0.336 |
| Average Power (r) | −0.252 | −0.143 | −0.383 | 0.208 |
| p | 0.456 | 0.674 | 0.245 | 0.538 |
| Relative Average Power (r) | −0.48 | −0.211 | −0.634 * | −0.126 |
| p | 0.135 | 0.533 | 0.036 | 0.713 |
| Anaerobic Fatigue (r) | 0.712 * | −0.022 | 0.649 * | −0.241 |
| p | 0.014 | 0.949 | 0.031 | 0.475 |
| Work (r) | −0.252 | −0.215 | −0.447 | 0.169 |
| p | 0.455 | 0.525 | 0.168 | 0.619 |
| Aerobic Capacity | ||||
| VO2max (r) | −0.246 | −0.129 | −0.371 | 0.139 |
| p | 0.465 | 0.706 | 0.261 | 0.685 |
| Relative VO2max (r) | −0.386 | −0.214 | −0.568 | −0.179 |
| p | 0.241 | 0.528 | 0.068 | 0.599 |
© 2020 by the authors. Licensee MDPI, Basel, Switzerland. This article is an open access article distributed under the terms and conditions of the Creative Commons Attribution (CC BY) license (http://creativecommons.org/licenses/by/4.0/).
Share and Cite
Carreker, J.D.; Grosicki, G.J. Physiological Predictors of Performance on the CrossFit “Murph” Challenge. Sports 2020, 8, 92. https://doi.org/10.3390/sports8070092
Carreker JD, Grosicki GJ. Physiological Predictors of Performance on the CrossFit “Murph” Challenge. Sports. 2020; 8(7):92. https://doi.org/10.3390/sports8070092
Chicago/Turabian StyleCarreker, Ja’Deon D., and Gregory J. Grosicki. 2020. "Physiological Predictors of Performance on the CrossFit “Murph” Challenge" Sports 8, no. 7: 92. https://doi.org/10.3390/sports8070092
APA StyleCarreker, J. D., & Grosicki, G. J. (2020). Physiological Predictors of Performance on the CrossFit “Murph” Challenge. Sports, 8(7), 92. https://doi.org/10.3390/sports8070092


