Skeletal Muscle Fiber Adaptations Following Resistance Training Using Repetition Maximums or Relative Intensity


 , , ,
, , , 
Abstract
1. Introduction
2. Materials and Methods
2.1. Subjects
2.2. Resistance Training
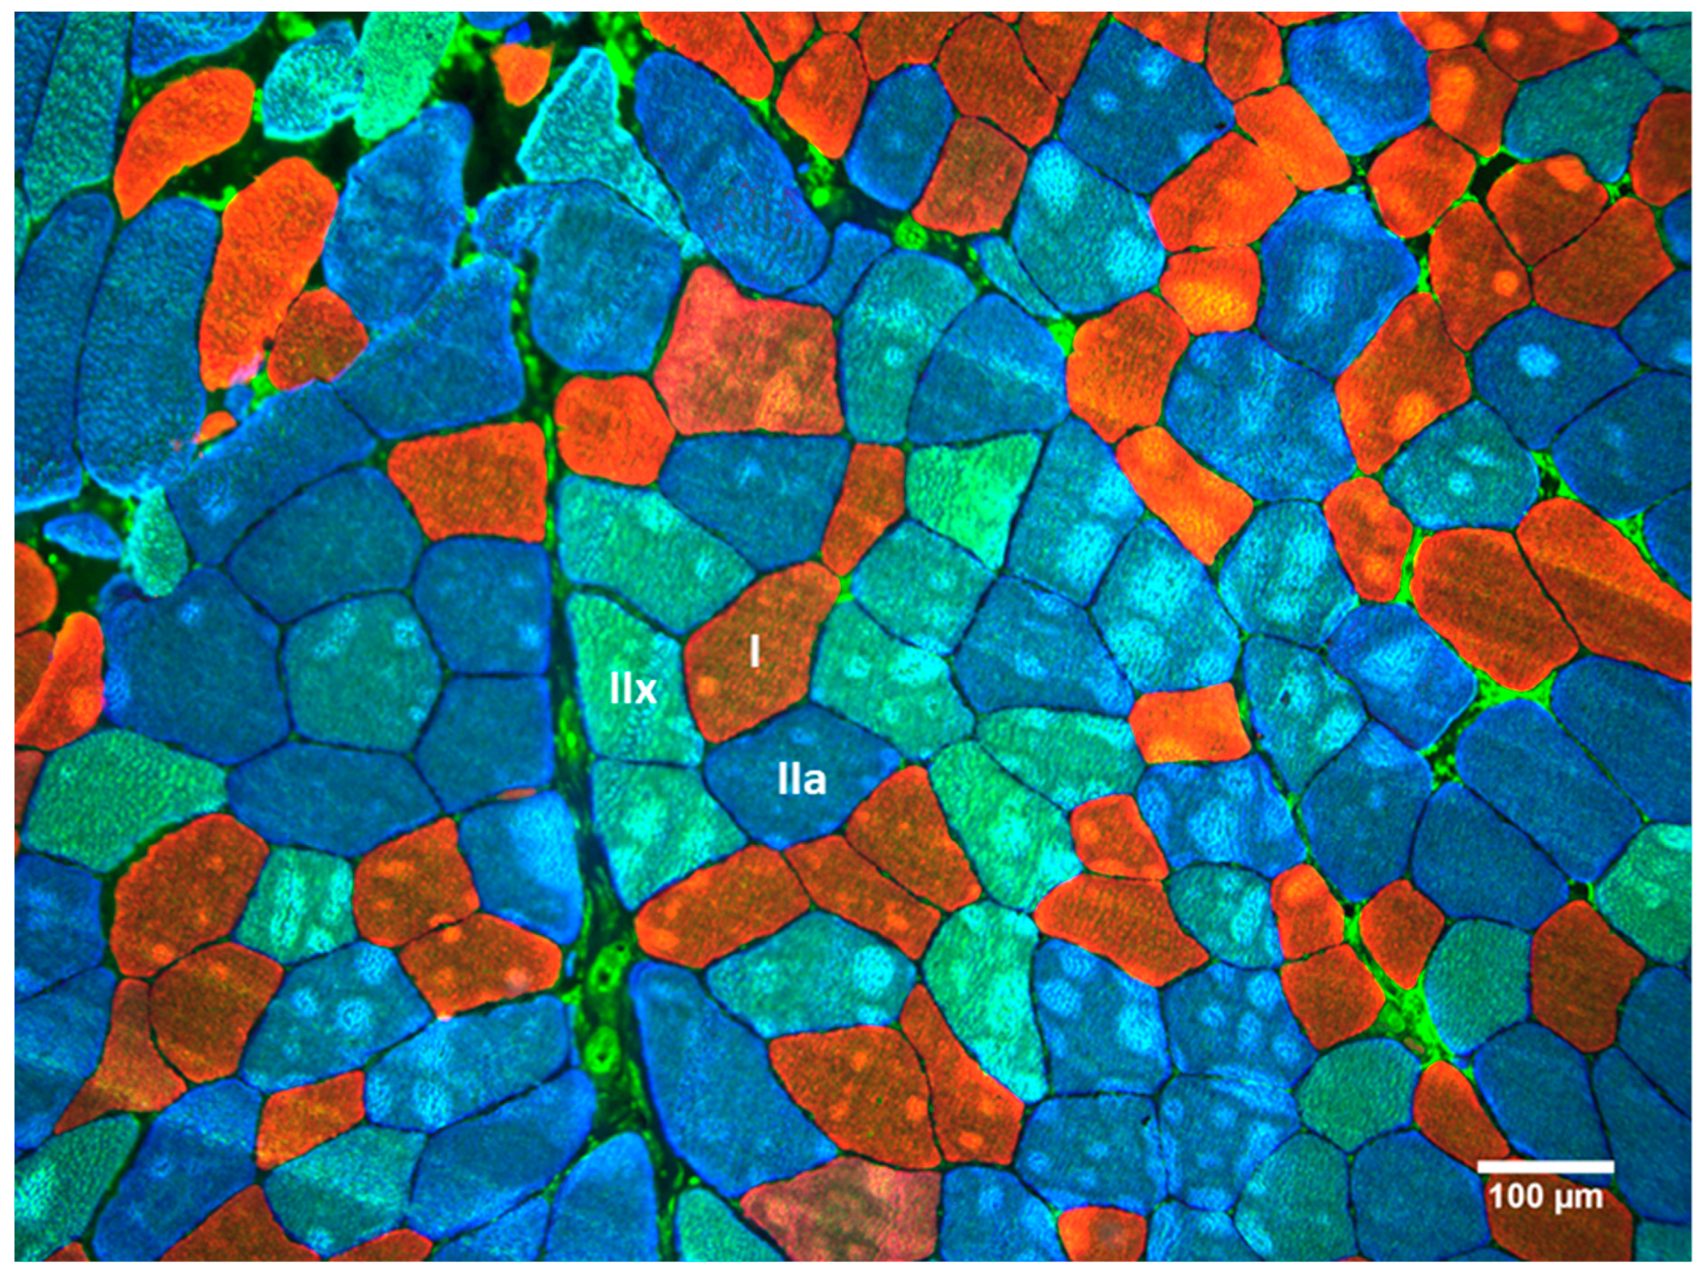
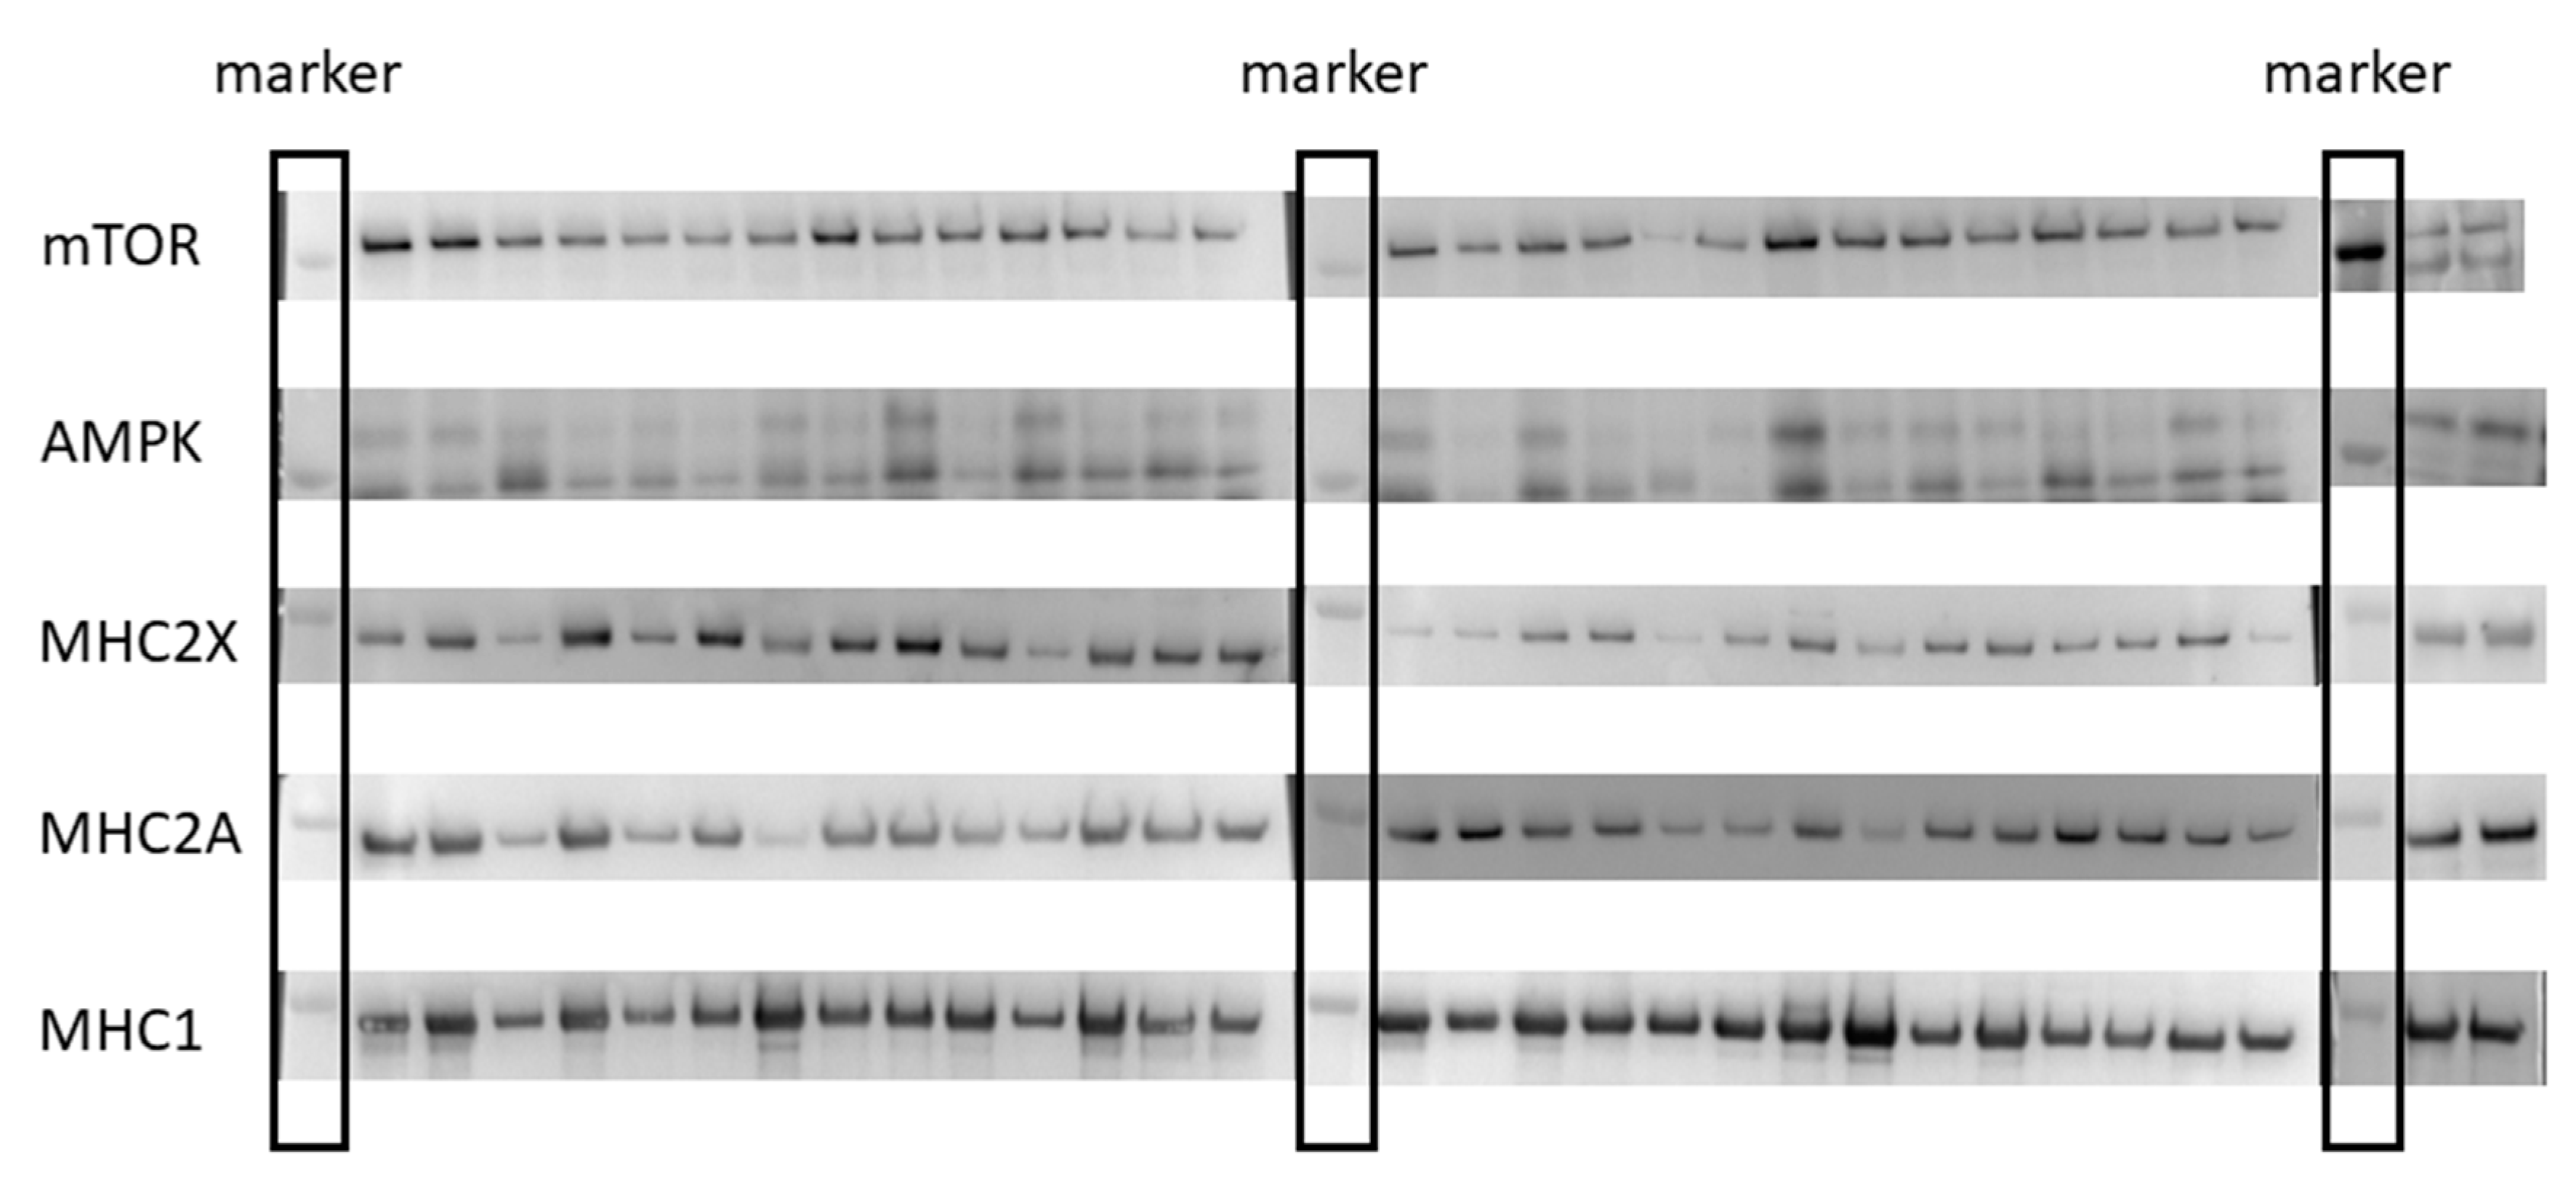
2.3. Muscle Biopsy Sampling and Processing
2.4. Ultrasonography
2.5. Statistical Analysis
3. Results
4. Discussion
5. Conclusions
Author Contributions
Funding
Acknowledgments
Conflicts of Interest
References
- Carroll, K.M.; Bernards, J.R.; Bazyler, C.D.; Taber, C.B.; Stuart, C.A.; DeWeese, B.H.; Sato, K.; Stone, M.H. Divergent Performance Outcomes Following Resistance Training Using Repetition Maximums or Relative Intensity. Int. J. Sports Physiol. Perform. 2018, 29, 1–28. [Google Scholar] [CrossRef] [PubMed]
- Morán-Navarro, R.; Pérez, C.E.; Mora-Rodríguez, R.; de la Cruz-Sánchez, E.; González-Badillo, J.J.; Sánchez-Medina, L.; Pallarés, J.G. Time course of recovery following resistance training leading or not to failure. Eur. J. Appl. Physiol. 2017, 117, 2387–2399. [Google Scholar] [CrossRef] [PubMed]
- Fry, A.C.; Allemeier, C.A.; Staron, R.S. Correlation between percentage fiber type area and myosin heavy chain content in human skeletal muscle. Eur. J. Appl. Physiol. Occup. Physiol. 1994, 68, 246–251. [Google Scholar] [CrossRef] [PubMed]
- Adams, G.R.; Hather, B.M.; Baldwin, K.M.; Dudley, G.A. Skeletal muscle myosin heavy chain composition and resistance training. J. Appl. Physiol. (1985) 1993, 74, 911–915. [Google Scholar] [CrossRef] [PubMed]
- Reiser, P.J.; Moss, R.L.; Giulian, G.G.; Greaser, M.L. Shortening velocity in single fibers from adult rabbit soleus muscles is correlated with myosin heavy chain composition. J. Biol. Chem. 1985, 260, 9077–9088. [Google Scholar] [PubMed]
- Pette, D.; Staron, R.S. Myosin isoforms, muscle fiber types, and transitions. Microsc. Res. Tech. 2000, 50, 500–509. [Google Scholar] [CrossRef]
- Schoenfeld, B.J. The mechanisms of muscle hypertrophy and their application to resistance training. J. Strength Cond. Res. 2010, 24, 2857–2872. [Google Scholar] [CrossRef] [PubMed]
- Campos, G.E.; Luecke, T.J.; Wendeln, H.K.; Toma, K.; Hagerman, F.C.; Murray, T.F.; Ragg, K.E.; Ratamess, N.A.; Kraemer, W.J.; Staron, R.S. Muscular adaptations in response to three different resistance-training regimens: Specificity of repetition maximum training zones. Eur. J. Appl. Physiol. 2002, 88, 50–60. [Google Scholar] [CrossRef] [PubMed]
- Andersen, J.L.; Aagaard, P. Myosin heavy chain IIX overshoot in human skeletal muscle. Muscle Nerve 2000, 23, 1095–1104. [Google Scholar] [CrossRef]
- Baar, K. Training for endurance and strength: Lessons from cell signaling. Med. Sci. Sports Exerc. 2006, 38, 1939–1944. [Google Scholar] [CrossRef]
- Wilkinson, S.B.; Phillips, S.M.; Atherton, P.J.; Patel, R.; Yarasheski, K.E.; Tarnopolsky, M.A.; Rennie, M.J. Differential effects of resistance and endurance exercise in the fed state on signalling molecule phosphorylation and protein synthesis in human muscle. J. Physiol. 2008, 586, 3701–3717. [Google Scholar] [CrossRef] [PubMed]
- Coffey, V.G.; Hawley, J.A. The molecular bases of training adaptation. Sports Med. 2007, 37, 737–763. [Google Scholar] [CrossRef] [PubMed]
- Glass, D.J. Skeletal muscle hypertrophy and atrophy signaling pathways. Int. J. Biochem. Cell Biol. 2005, 37, 1974–1984. [Google Scholar] [CrossRef] [PubMed]
- Atherton, P.J.; Babraj, J.; Smith, K.; Singh, J.; Rennie, M.J.; Wackerhage, H. Selective activation of AMPK-PGC-1alpha or PKB-TSC2-mTOR signaling can explain specific adaptive responses to endurance or resistance training-like electrical muscle stimulation. FASEB J. 2005, 19, 786–788. [Google Scholar] [CrossRef] [PubMed]
- Kawamori, N.; Rossi, S.J.; Justice, B.D.; Haff, E.E.; Pistilli, E.E.; O’Bryant, H.S.; Stone, M.H.; Haff, G.G. Peak force and rate of force development during isometric and dynamic mid-thigh clean pulls performed at various intensities. J. Strength Cond. Res. 2006, 20, 483–491. [Google Scholar]
- Thomas, C.; Comfort, P.; Chiang, C.Y.; Jones, P.A. Relationship between isometric mid-thigh pull variables and sprint and change of direction performance in collegiate athletes. J. Train. 2015, 4, 6–10. [Google Scholar] [CrossRef]
- McGuigan, M.R.; Winchester, J.B. The relationship between isometric and dynamic strength in college football players. J. Sports Sci. Med. 2008, 7, 101–105. [Google Scholar]
- DeWeese, B.H.; Hornsby, G.; Stone, M.; Michael, H.S. The training process: Planning for strength-power training in track and field. Part 1: Theoretical aspects. J. Sport Health Sci. 2015, 4, 308–317. [Google Scholar] [CrossRef]
- Harris, G.R.; Stone, M.H.; O’bryant, H.S.; Proulx, C.M.; Johnson, R.L. Short-term performance effects of high power, high force, or combined weight-training methods. J. Strength Cond. Res. 2000, 14, 14–20. [Google Scholar]
- Painter, K.B.; Haff, G.G.; Ramsey, M.W.; McBride, J.; Triplett, T.; Sands, W.A.; Lamont, H.S.; Stone, M.E.; Stone, M.H. Strength Gains: Block Versus Daily Undulating Periodization Weight Training Among Track and Field Athletes. Int. J. Sports Physiol. Perform. 2012, 7, 161–169. [Google Scholar] [CrossRef]
- Stuart, C.A.; Yin, D.; Howell, M.E.; Dykes, R.J.; Laffan, J.J.; Ferrando, A.A. Hexose transporter mRNAs for GLUT4, GLUT5, and GLUT12 predominate in human muscle. Am. J. Physiol. Endocrinol. Metab. 2006, 291, E1067–E1073. [Google Scholar] [CrossRef] [PubMed]
- Bergström, J. Muscle electrolytes in man. Scand. J. Clin. Lab. Investig. 1962, 14, 1–110. [Google Scholar]
- Layne, A.S.; Nasrallah, S.; South, M.A.; Howell, M.E.; McCurry, M.P.; Ramsey, M.W.; Stone, M.H.; Stuart, C.A. Impaired muscle AMPK activation in the metabolic syndrome may attenuate improved insulin action after exercise training. J. Clin. Endocrinol. Metab. 2011, 96, 1815–1826. [Google Scholar] [CrossRef] [PubMed]
- Hopkins, W.G.; Marshall, S.W.; Batterham, A.M.; Hanin, J. Progressive statistics for studies in sports medicine and exercise science. Med. Sci. Sports Exerc. 2009, 41, 3–13. [Google Scholar] [CrossRef] [PubMed]
- Burd, N.A.; Mitchell, C.J.; Churchward-Venne, T.A.; Phillips, S.M. Bigger weights may not beget bigger muscles: Evidence from acute muscle protein synthetic responses after resistance exercise. Appl. Physiol. Nutr. Metab. 2012, 37, 551–554. [Google Scholar] [CrossRef] [PubMed]
- Luden, N.; Hayes, E.; Galpin, A.; Minchev, K.; Jemiolo, B.; Raue, U.; Trappe, T.A.; Harber, M.P.; Bowers, T.; Trappe, S. Myocellular basis for tapering in competitive distance runners. J. Appl. Physiol.(1985) 2010, 108, 1501–1509. [Google Scholar] [CrossRef] [PubMed]
- Murach, K.; Raue, U.; Wilkerson, B.; Minchev, K.; Jemiolo, B.; Bagley, J.; Luden, N.; Trappe, S. Single muscle fiber gene expression with run taper. PLoS ONE 2014, 9, e108547. [Google Scholar] [CrossRef]
- Ahtiainen, J.P.; Walker, S.; Silvennoinen, M.; Kyröläinen, H.; Nindl, B.C.; Häkkinen, K.; Nyman, K.; Selänne, H.; Hulmi, J.J. Exercise type and volume alter signaling pathways regulating skeletal muscle glucose uptake and protein synthesis. Eur. J. Appl. Physiol. 2015, 115, 1835–1845. [Google Scholar] [CrossRef]
- Dreyer, H.C.; Fujita, S.; Glynn, E.L.; Drummond, M.J.; Volpi, E.; Rasmussen, B.B. Resistance exercise increases leg muscle protein synthesis and mTOR signalling independent of sex. Acta Physiol. (Oxf) 2010, 199, 71–81. [Google Scholar] [CrossRef]
- Coffey, V.G.; Zhong, Z.; Shield, A.; Canny, B.J.; Chibalin, A.V.; Zierath, J.R.; Hawley, J.A. Early signaling responses to divergent exercise stimuli in skeletal muscle from well-trained humans. FASEB J. 2006, 20, 190–192. [Google Scholar] [CrossRef]
- Ogasawara, R.; Kobayashi, K.; Tsutaki, A.; Lee, K.; Abe, T.; Fujita, S.; Nakazato, K.; Ishii, N. mTOR signaling response to resistance exercise is altered by chronic resistance training and detraining in skeletal muscle. J. Appl. Physiol. (1985) 2013, 114, 934–940. [Google Scholar] [CrossRef] [PubMed]
- Klossner, S.; Durieux, A.C.; Freyssenet, D.; Flueck, M. Mechano-transduction to muscle protein synthesis is modulated by FAK. Eur. J. Appl. Physiol. 2009, 106, 389–398. [Google Scholar] [CrossRef] [PubMed]
- Hoffman, N.J.; Parker, B.L.; Chaudhuri, R.; Fisher-Wellman, K.H.; Kleinert, M.; Humphrey, S.J.; Yang, P.; Holliday, M.; Trefely, S.; Fazakerley, D.J.; et al. Global Phosphoproteomic Analysis of Human Skeletal Muscle Reveals a Network of Exercise-Regulated Kinases and AMPK Substrates. Cell Metab. 2015, 22, 922–935. [Google Scholar] [CrossRef] [PubMed]
- Potts, G.K.; McNally, R.M.; Blanco, R.; You, J.S.; Hebert, A.S.; Westphall, M.S.; Coon, J.J.; Hornberger, T.A. A map of the phosphoproteomic alterations that occur after a bout of maximal-intensity contractions. J. Physiol. 2017, 595, 5209–5226. [Google Scholar] [CrossRef] [PubMed]
- Damas, F.; Phillips, S.M.; Lixandrão, M.E.; Vechin, F.C.; Libardi, C.A.; Roschel, H.; Tricoli, V.; Ugrinowitsch, C. Early resistance training-induced increases in muscle cross-sectional area are concomitant with edema-induced muscle swelling. Eur. J. Appl. Physiol. 2016, 116, 49–56. [Google Scholar] [CrossRef] [PubMed]
- Nobukuni, T.; Joaquin, M.; Roccio, M.; Dann, S.G.; Kim, S.Y.; Gulati, P.; Byfield, M.P.; Backer, J.M.; Natt, F.; Bos, J.L.; et al. Amino acids mediate mTOR/raptor signaling through activation of class 3 phosphatidylinositol 3OH-kinase. Proc. Natl. Acad. Sci. USA 2005, 102, 14238–14243. [Google Scholar] [CrossRef] [PubMed]


| RISR | RM Zone | ||||
|---|---|---|---|---|---|
| Training Block | Week | (Sets) × (Reps) | Day 1 and 2 | Day 3 | |
| (A) VJ and IMTP Testing | |||||
| Strength-Endurance | 1 | 3 × 10 | 80.0% | 70.0% | 3 × 8−12 |
| 2 | 3 × 10 | 85.0% | 75.0% | 3 × 8−12 | |
| 3 | 3 × 10 | 90.0% | 80.0% | 3 × 8−12 | |
| (B) VJ and IMTP Testing | |||||
| Max-Strength * | 4 | 3 × 5 | 85.0% | 70.0% | 3 × 4−6 |
| 5 | 3 × 5 | 87.5% | 72.5% | 3 × 4−6 | |
| 6 | 3 × 5 | 92.5% | 75.0% | 3 × 4−6 | |
| 7 | 3 × 5 | 80.0% | 65.0% | 3 × 4−6 | |
| (C) VJ and IMTP Testing | |||||
| Overreach | 8 | 5 × 5 | 85.0% | 75.0% | 5 × 4−6 |
| (D) VJ and IMTP Testing | |||||
| Speed-Strength | 9 | 3 × 3 | 87.5% | 67.5% | 3 × 2−4 |
| 10 | 3 × 2 | 85.0% | 65.0% | 3 × 1−3 | |
| (E) VJ and IMTP testing | |||||
| Training Block | Day 1 | Day 2 | Day 3 |
|---|---|---|---|
| Strength-Endurance | Back Squat, Overhead Press, Bench Press, DB Tricep Ext. | CG MTP, CG SLDL, BB Bent-Row, DB Bent Lateral Raise | Back Squat, Overhead Press, Bench Press, DB Tricep Ext. |
| Max-Strength | Back Squat, Push Press, Incline Bench Press, Wtd. Dips | CG MTP, Clean Pull, SG SLDL, Pull-Ups | Back Squat, Push Press, Incline Bench Press, Wtd. Dips |
| Overreach | Back Squat, Push Press, DB Step Up, Bench Press | CG CM Shrug, Clean Pull, CG SLDL, SA DB Bent-Row | Back Squat, Push Press, DB Step Up, Bench Press |
| Speed-Strength | Back Squat + Rocket Jump, Push Press, Bench Press + Med Ball Chest Pass | CG MTP, CG CM Shrug, Vertical Med Ball Toss | Back Squat + Rocket Jump, Push Press, Bench Press + Med Ball Chest Pass |
| Relative Intensity Effects | Repetition Maximum Effects | Between-Group Effects | |||||
|---|---|---|---|---|---|---|---|
| Variable | g (90% CI) | pre ± SD | post ± SD | g (90% CI) | pre ± SD | post ± SD | g (90% CI) |
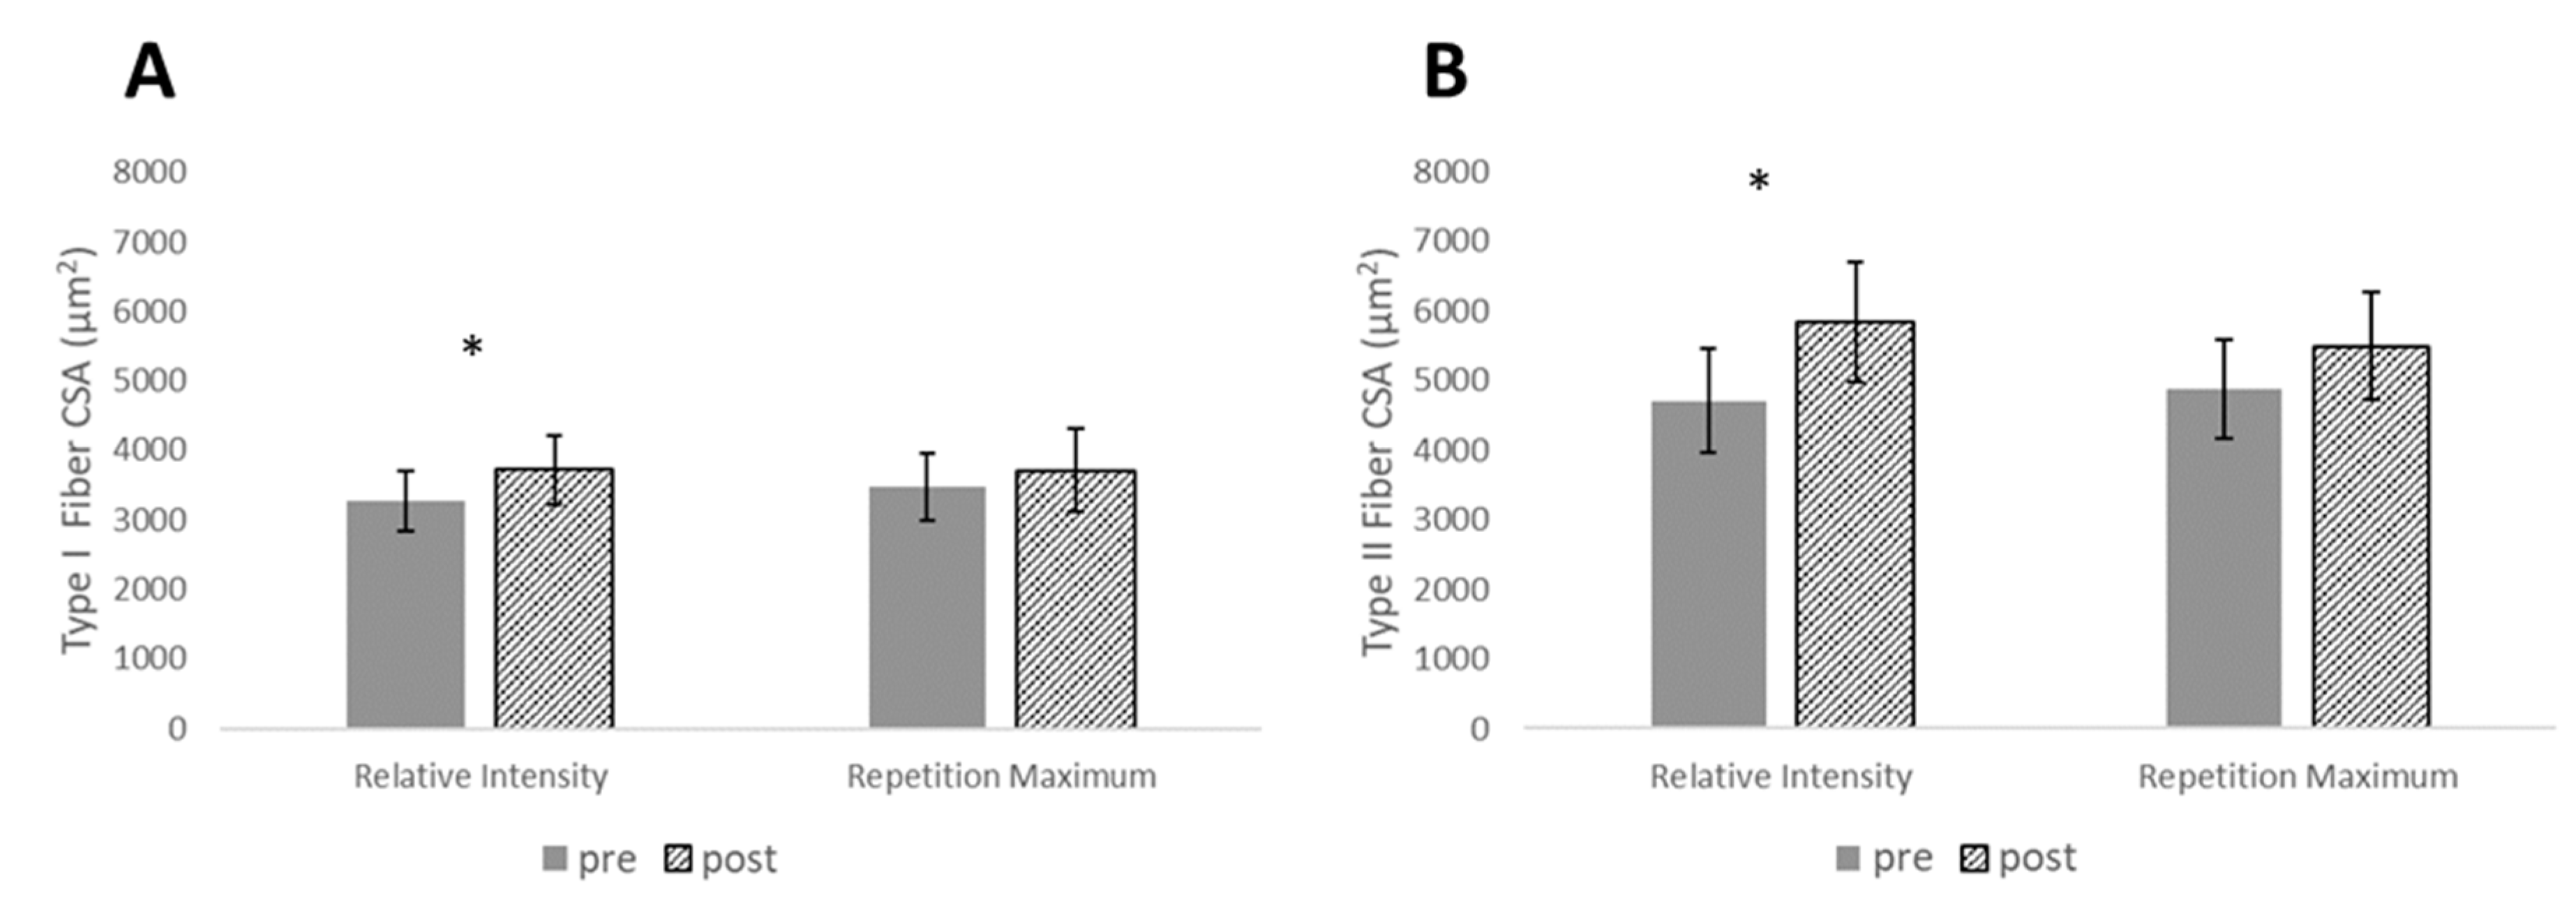
| Type I CSA (µm2) | 0.56 (0.22–0.89) | 3277 ± 692 | 3720 ± 793 | 0.26 (−0.02–0.54) | 3470 ± 789 | 3713 ± 974 | 0.48 (−0.35–1.31) |
| Type II CSA (µm2) | 0.81 (0.37–1.26) | 4079 ± 1195 | 5839 ± 1399 | 0.49 (−0.05–1.02) | 4883 ± 1137 | 5493 ± 1241 | 0.50 (−0.33–1.33) |
| ACSA (cm2) | 0.53 (0.33–0.73) | 39.10 ± 6.25 | 42.53 ± 5.76 | 0.14 (0.00–0.28) | 40.77 ± 9.22 | 42.09 ± 8.75 | 1.03 (0.20–1.86) |
| MT (cm2) | 1.47 (0.99–1.95) | 2.12 ± 0.33 | 3.62 ± 0.32 | 0.80 (0.46–1.14) | 2.48 ± 0.38 | 2.83 ± 0.43 | 0.72 (−0.11–1.55) |
| Relative Intensity Effects | Repetition Maximum Effects | Between-Group Effects | |||
|---|---|---|---|---|---|
| g (90% CI) | Fold Change ± SD | g (90% CI) | Fold Change ± SD | g (90% CI) | |
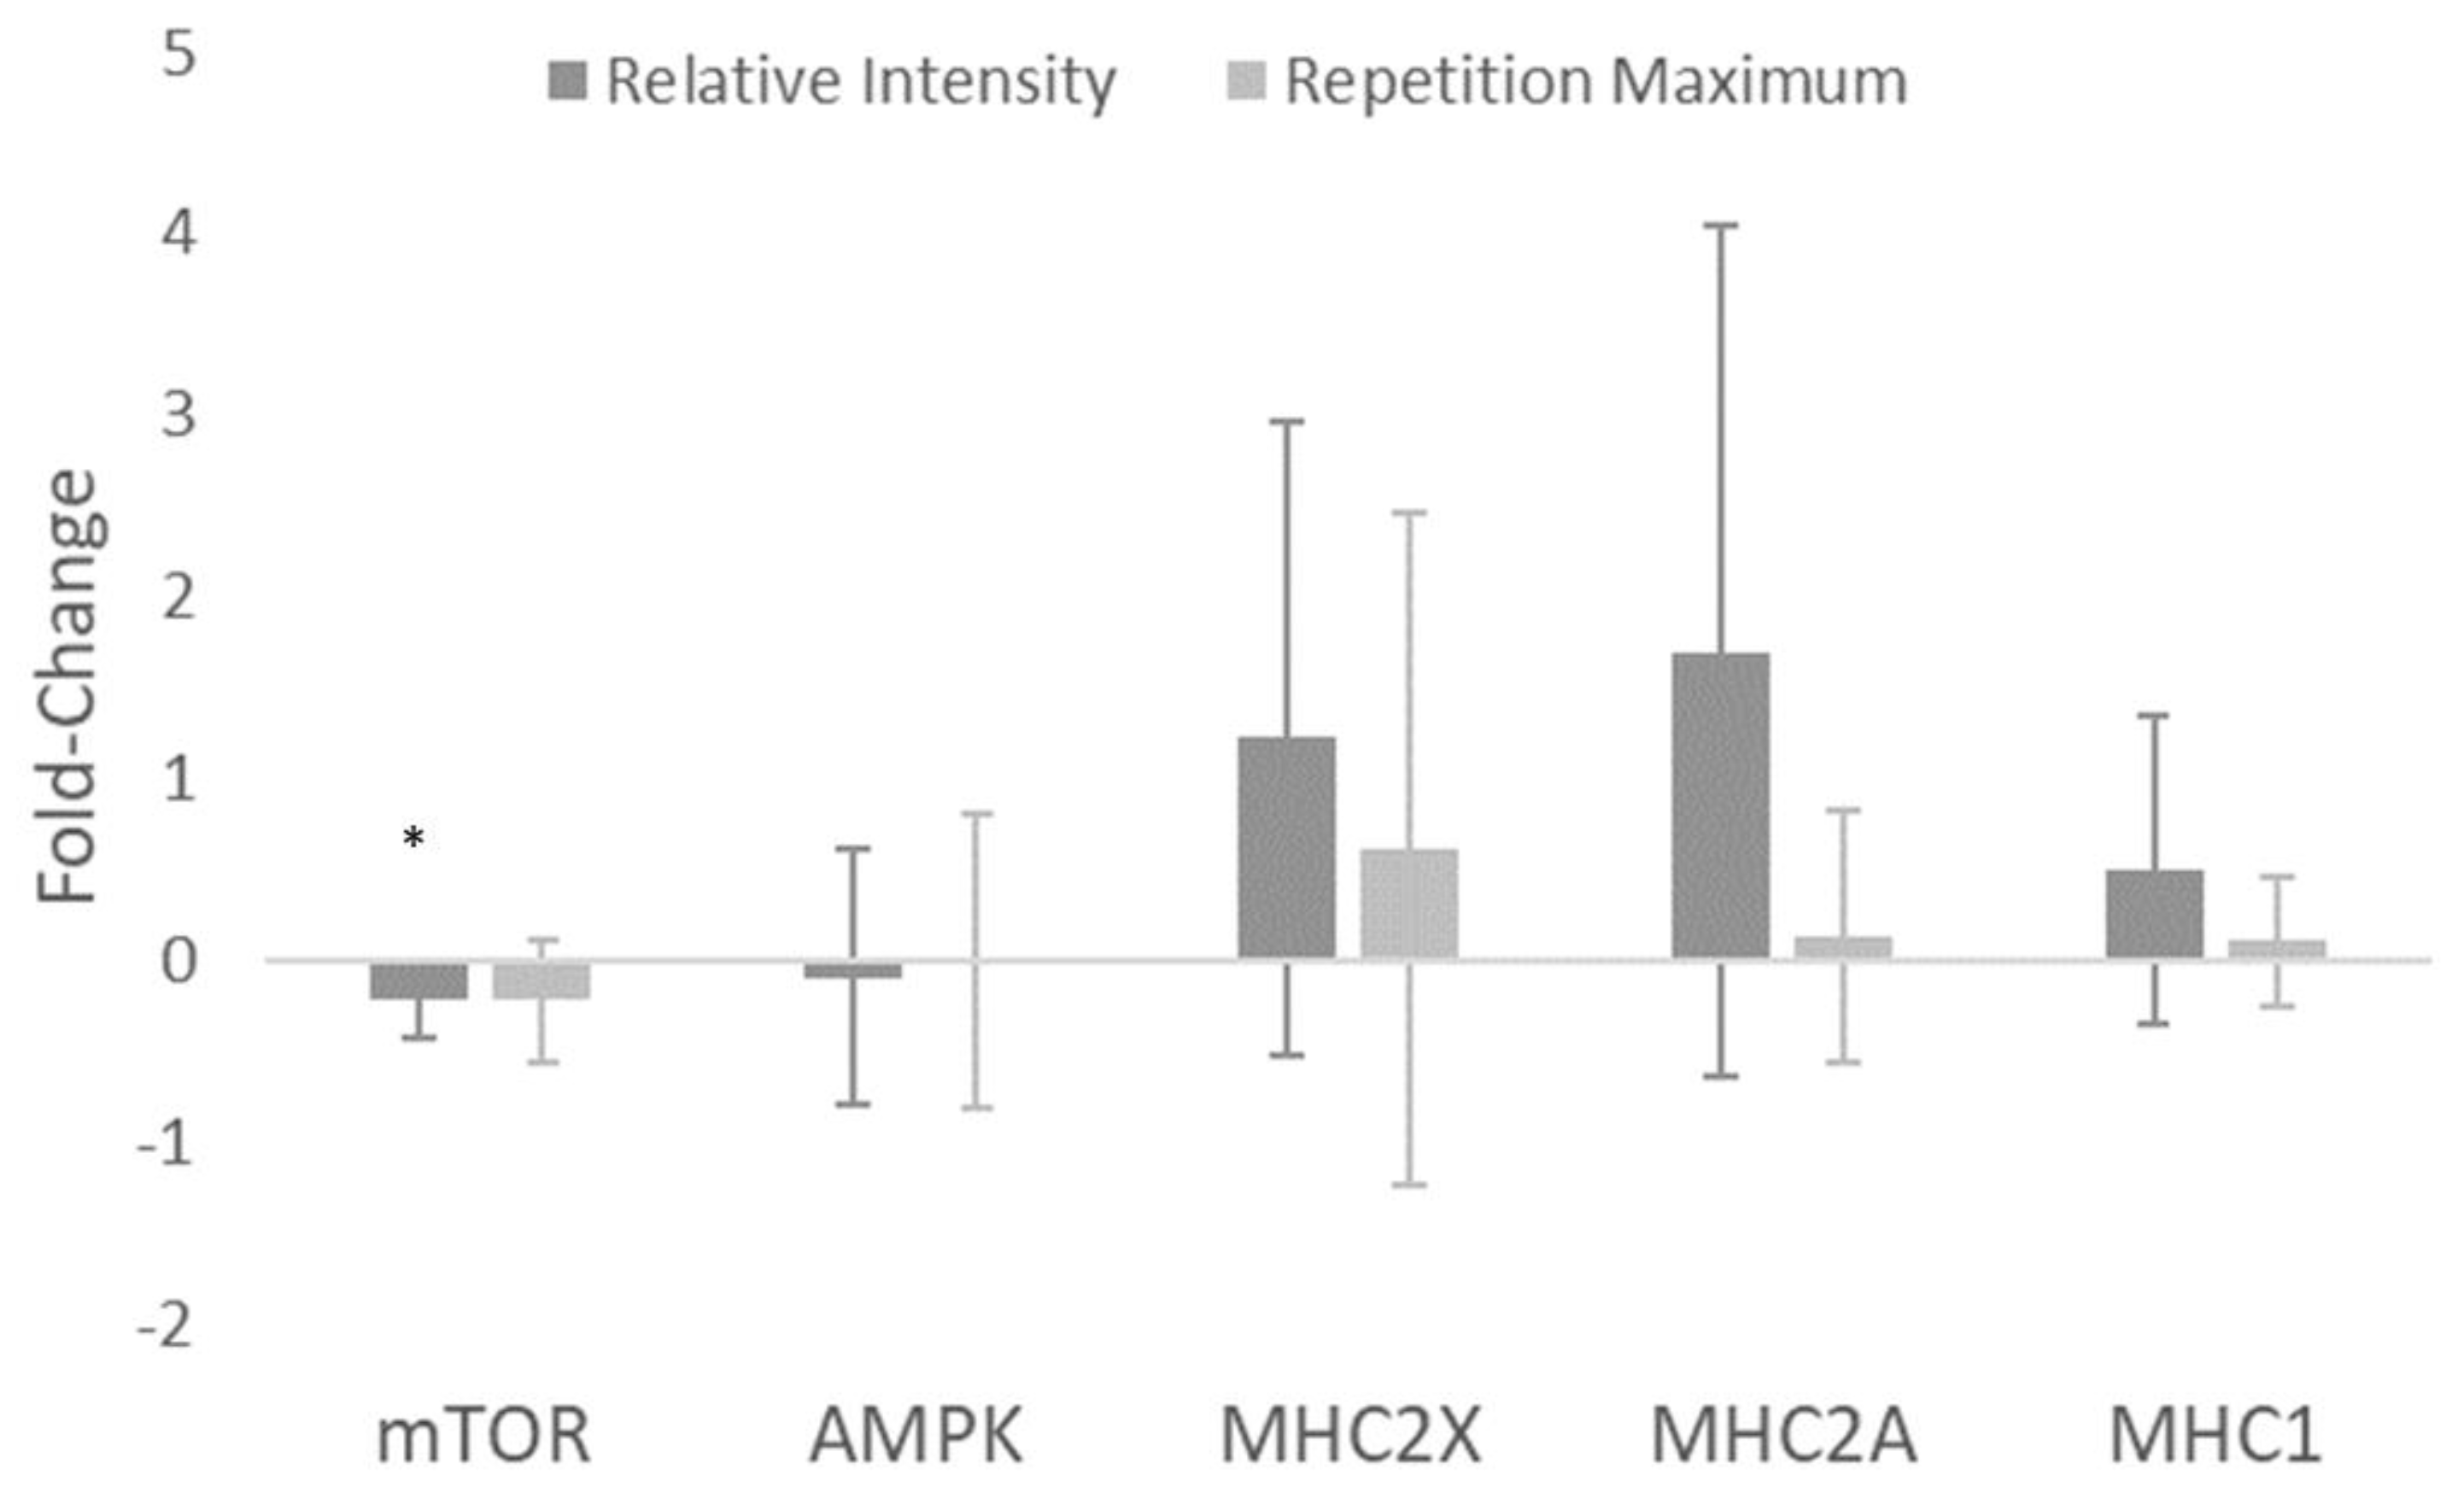
| mTOR (AU) | −1.40 (−2.38–−0.43) | −0.22 ± 0.21 | −0.97 (−1.86–−0.07) | −0.23 ± 0.33 | 0.02 (−0.80–0.85) |
| AMPK (AU) | −0.19 (−1.16–0.78) | −0.10 ± 0.70 | −0.01 (−0.90–0.88) | −0.01 ± 0.81 | −0.11 (−0.94–0.72) |
| MHC2X (AU) | 0.93 (−0.04–1.90) | 1.22 ± 1.74 | 0.44 (−0.46–1.33) | 0.61 ± 1.85 | 0.31 (−0.52–1.14) |
| MHC2A (AU) | 0.96 (−0.01–1.93) | 1.70 ± 2.34 | 0.24 (−0.66–1.14) | 0.13 ± 0.70 | 0.87 (0.02–1.73) |
| MHC1 (AU) | 0.78 (−0.19–1.75) | 0.50 ± 0.85 | 0.37 (−0.52–1.27) | 0.10 ± 0.36 | 0.59 (−0.27–1.44) |
© 2019 by the authors. Licensee MDPI, Basel, Switzerland. This article is an open access article distributed under the terms and conditions of the Creative Commons Attribution (CC BY) license (http://creativecommons.org/licenses/by/4.0/).
Share and Cite
Carroll, K.M.; Bazyler, C.D.; Bernards, J.R.; Taber, C.B.; Stuart, C.A.; DeWeese, B.H.; Sato, K.; Stone, M.H. Skeletal Muscle Fiber Adaptations Following Resistance Training Using Repetition Maximums or Relative Intensity. Sports 2019, 7, 169. https://doi.org/10.3390/sports7070169
Carroll KM, Bazyler CD, Bernards JR, Taber CB, Stuart CA, DeWeese BH, Sato K, Stone MH. Skeletal Muscle Fiber Adaptations Following Resistance Training Using Repetition Maximums or Relative Intensity. Sports. 2019; 7(7):169. https://doi.org/10.3390/sports7070169
Chicago/Turabian StyleCarroll, Kevin M., Caleb D. Bazyler, Jake R. Bernards, Christopher B. Taber, Charles A. Stuart, Brad H. DeWeese, Kimitake Sato, and Michael H. Stone. 2019. "Skeletal Muscle Fiber Adaptations Following Resistance Training Using Repetition Maximums or Relative Intensity" Sports 7, no. 7: 169. https://doi.org/10.3390/sports7070169
APA StyleCarroll, K. M., Bazyler, C. D., Bernards, J. R., Taber, C. B., Stuart, C. A., DeWeese, B. H., Sato, K., & Stone, M. H. (2019). Skeletal Muscle Fiber Adaptations Following Resistance Training Using Repetition Maximums or Relative Intensity. Sports, 7(7), 169. https://doi.org/10.3390/sports7070169