Development of Physical Fitness among the Top 10 Boys and Girls in Sport Schools: A 10-Year Cohort Analysis

 ,
,
Abstract
1. Introduction
2. Materials and Methods
2.1. Study Sample and Design
2.2. Measures
2.2.1. Physical Fitness
2.2.2. Body Mass Index (BMI)
2.2.3. Talent Diagnostics
2.2.4. Statistical Analysis
3. Results
3.1. Descriptive Results
3.2. Development of Physical Fitness
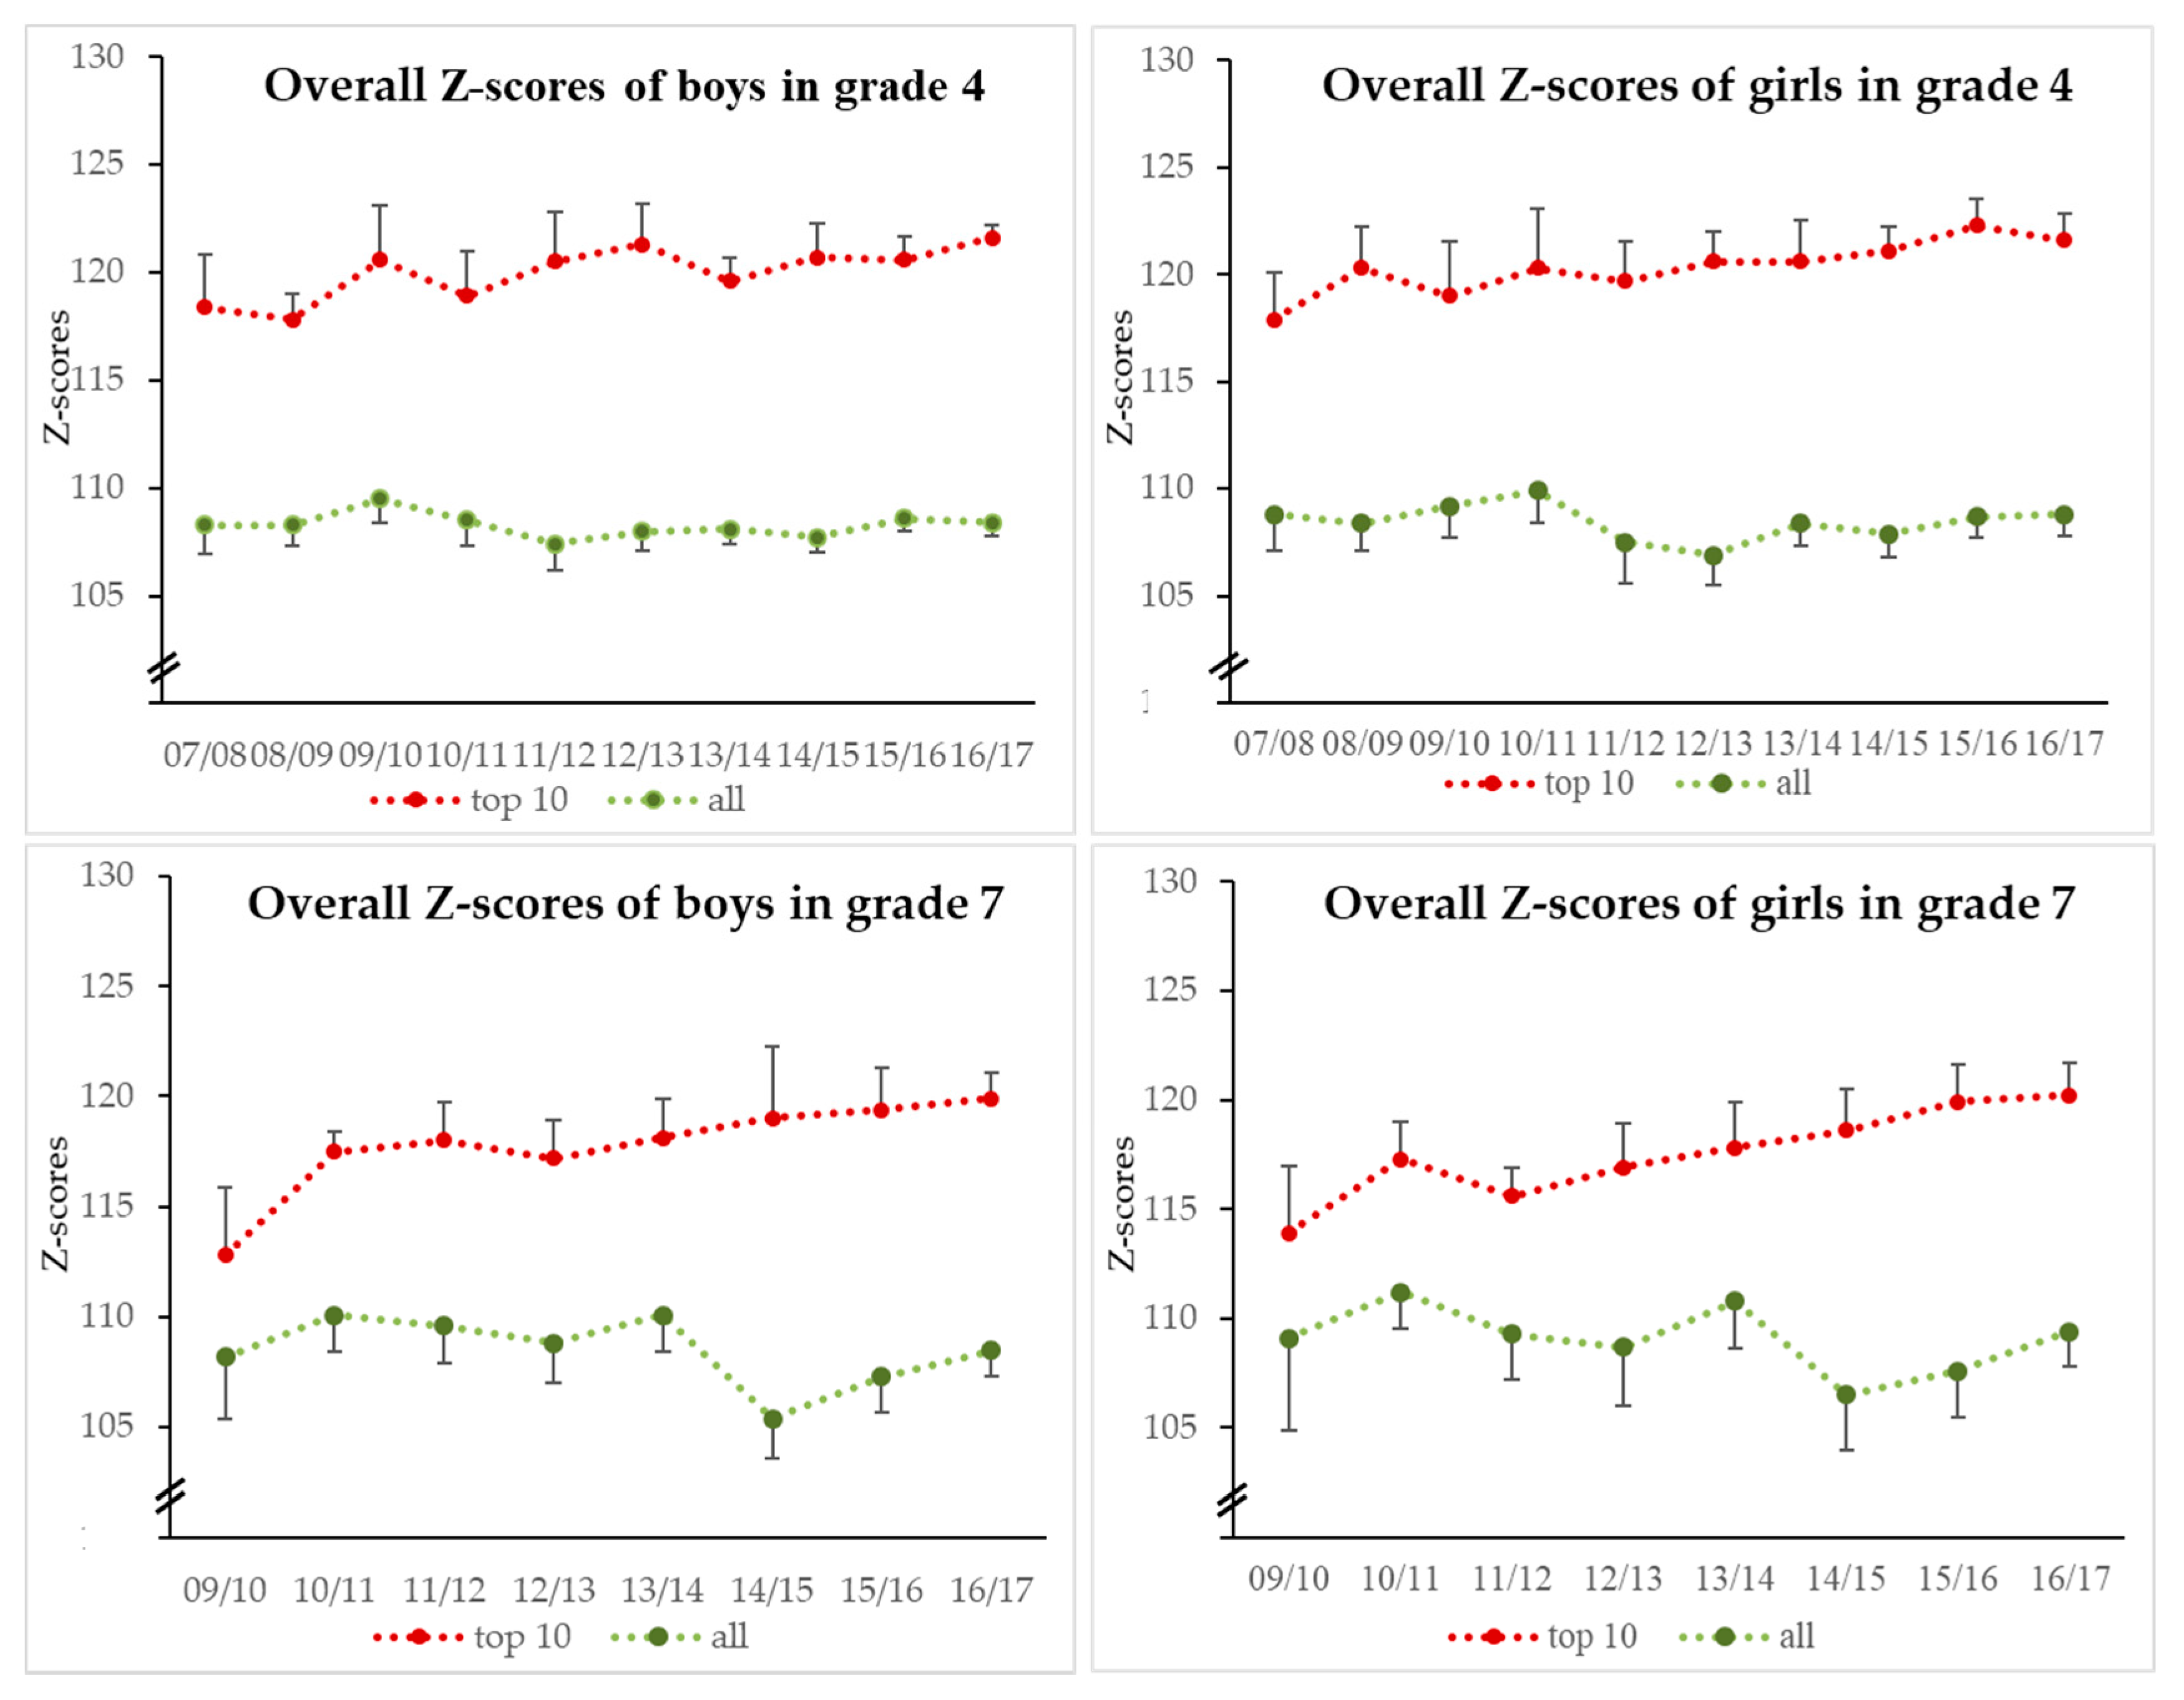
3.3. Development of Physical Fitness of Top 10 Boys and Girls
4. Discussion
4.1. PF Talents
4.2. Strength and Limitations of the Study
5. Conclusions
Author Contributions
Funding
Acknowledgments
Conflicts of Interest
Appendix A

| Cohort | Task | 20 m | Long Jump | Balancing | Sit-Ups | Push-ups | Jumping | Stand + Reach | 6 min Run |
|---|---|---|---|---|---|---|---|---|---|
| mean Z ± SD | mean Z ± SD | mean Z ± SD | mean Z ± SD | mean Z ± SD | mean Z ± SD | mean Z ± SD | mean Z ± SD | ||
| 07/08 | male (N = 10) | 120.1 ± 5.3 | 118.4 ± 6.2 | 116.6 ± 3.1 | 118.6 ± 5.8 | 119.1 ± 10.6 | 122.8 ± 8.4 | 111.6 ± 5.8 | 119.7 ± 7.0 |
| female(N = 10) | 118.4 ± 4.3 | 115.9 ± 7.3 | 114.4 ± 3.8 | 116.9 ± 5.0 | 123.0 ± 5.8 | 125.2 ± 5.7 | 110.0 ± 10.9 | 119.5 ± 5.6 | |
| ∑ (N = 20) | 119.3 ± 4.8 | 117.2 ± 6.7 | 115.5 ± 3.6 | 117.8 ± 5.3 | 121.1 ± 8.6 | 124.0 ± 7.1 | 110.8 ± 8.5 | 119.6 ± 6.2 | |
| 08/09 | male (N = 10) | 116.6 ± 5.0 | 113.9 ± 8.4 | 117.9 ± 6.0 | 115.5 ± 7.6 | 121.1 ± 8.9 | 125.6 ± 5.6 | 113.4 ± 7.6 | 118.6 ± 3.6 |
| female (N = 10) | 119.7 ± 5.7 | 120.7 ± 6.8 | 116.5 ± 2.8 | 119.3 ± 7.4 | 122.1 ± 8.0 | 127.2 ± 6.1 | 116.8 ± 6.7 | 119.9 ± 5.9 | |
| ∑ (N = 20) | 118.2 ± 5.5 | 117.3 ± 8.2 | 117.2 ± 4.7 | 117.4 ± 7.6 | 121.6 ± 8.3 | 126.4 ± 5.7 | 115.1 ± 7.2 | 119.3 ± 4.8 | |
| 09/10 | male (N = 10) | 119.5 ± 4.8 | 122.2 ± 6.4 | 116.7 ± 3.5 | 117.3 ± 7.2 | 125.4 ± 5.0 | 124.9 ± 5.7 | 116.3 ± 6.1 | 122.2 ± 5.8 |
| female (N = 10) | 118.1 ± 5.3 | 118.4 ± 6.3 | 115.0 ± 4.7 | 116.6 ± 6.6 | 123.8 ± 7.5 | 125.4 ± 7.2 | 115.4 ± 7.5 | 119.6 ± 5.1 | |
| ∑ (N = 20) | 118.8 ± 5.0 | 120.3 ± 6.5 | 115.9 ± 4.1 | 117.0 ± 6.7 | 124.6 ± 6.3 | 125.2 ± 5.9 | 115.9 ± 6.7 | 120.9 ± 5.5 | |
| 10/11 | male (N = 10) | 119.9 ± 5.8 | 119.4 ± 4.4 | 114.8 ± 4.8 | 115.4 ± 4.9 | 124.4 ± 7.7 | 125.8 ± 3.8 | 110.1 ± 4.7 | 121.1 ± 6.6 |
| female (N = 10) | 114.5 ± 4.8 | 121.3 ± 6.0 | 115.4 ± 3.0 | 116.4 ± 5.8 | 127.7 ± 3.3 | 127.5 ± 3.0 | 116.5 ± 6.2 | 123.3 ± 5.4 | |
| ∑ (N = 20) | 117.2 ± 5.9 | 120.4 ± 5.2 | 115.1 ± 3.9 | 115.9 ± 5.3 | 126.1 ± 6.0 | 126.7 ± 3.4 | 113.3 ± 6.3 | 122.2 ± 6.0 | |
| 11/12 | male (N = 10) | 119.2 ± 4.2 | 115.4 ± 3.8 | 116.7 ± 5.6 | 121.1 ± 4.9 | 127.0 ± 6.9 | 127.4 ± 2.8 | 116.8 ± 6.2 | 120.1 ± 5.2 |
| female (N = 10) | 116.2 ± 8.8 | 119.9 ± 5.0 | 115.2 ± 4.5 | 116.1 ± 6.0 | 125.4 ± 4.8 | 128.3 ± 3.2 | 115.2 ± 8.2 | 121.0 ± 3.6 | |
| ∑ (N = 20) | 117.7 ± 6.9 | 117.7 ± 4.9 | 116.0 ± 5.0 | 118.6 ± 5.9 | 126.2 ± 5.9 | 127.9 ± 3.0 | 116.0 ± 7.1 | 120.6 ± 4.4 | |
| 12/13 | male (N = 10) | 120.8 ± 3.8 | 117.3 ± 3.3 | 119.0 ± 3.5 | 122.7 ± 4.4 | 126.2 ± 4.5 | 129.1 ± 1.9 | 113.8 ± 7.5 | 121.8 ± 5.8 |
| female (N = 10) | 120.2 ± 3.2 | 116.7 ± 4.0 | 116.8 ± 1.9 | 121.0 ± 8.8 | 124.2 ± 4.2 | 129.0 ± 1.9 | 114.4 ± 8.8 | 122.3 ± 4.3 | |
| ∑ (N = 20) | 120.5 ± 3.5 | 117.0 ± 3.6 | 117.9 ± 3.0 | 121.9 ± 6.8 | 125.2 ± 4.4 | 129.1 ± 1.9 | 114.1 ± 8.0 | 122.1 ± 5.0 | |
| 13/14 | male (N = 10) | 113.6 ± 4.0 | 118.2 ± 5.8 | 116.5 ± 4.2 | 122.0 ± 7.1 | 128.9 ± 2.0 | 126.2 ± 3.8 | 114.8 ± 9.3 | 116.9 ± 4.4 |
| female (N = 10) | 116.0 ± 5.8 | 122.8 ± 3.3 | 114.4 ± 3.1 | 118.4 ± 7.8 | 122.1 ± 7.0 | 126.6 ± 4.8 | 118.7 ± 6.3 | 125.9 ± 4.7 | |
| ∑ (N = 20) | 114.8 ± 5.0 | 120.5 ± 5.2 | 115.5 ± 3.8 | 120.2 ± 7.5 | 125.5 ± 6.1 | 126.4 ± 4.2 | 116.8 ± 8.0 | 121.4 ± 6.4 | |
| 14/15 | male (N = 10) | 115.3 ± 4.7 | 118.1 ± 3.1 | 118.5 ± 3.4 | 122.5 ± 7.4 | 128.5 ± 2.9 | 126.4 ± 5.6 | 117.0 ± 6.1 | 119.4 ± 5.7 |
| female (N = 10) | 118.0 ± 6.3 | 119.5 ± 5.9 | 118.0 ± 6.3 | 122.7 ± 7.6 | 122.4 ± 7.6 | 128.6 ± 3.1 | 118.7 ± 6.7 | 121.2 ± 5.5 | |
| ∑ (N = 20) | 116.7 ± 5.6 | 118.8 ± 4.6 | 118.3 ± 3.0 | 122.6 ± 7.3 | 125.5 ± 6.4 | 127.5 ± 4.6 | 117.9 ± 6.3 | 120.3 ± 5.5 | |
| 15/16 | male (N = 10) | 115.3 ± 4.4 | 117.1 ± 7.8 | 117.2 ± 5.3 | 122.2 ± 3.9 | 125.0 ± 5.0 | 129.0 ± 1.4 | 114.8 ± 5.4 | 124.4 ± 6.3 |
| female (N = 10) | 118.1 ± 5.5 | 123.4 ± 5.2 | 116.6 ± 2.6 | 121.9 ± 6.0 | 125.3 ± 4.7 | 129.5 ± 1.6 | 119.0 ± 7.8 | 124.5 ± 2.6 | |
| ∑ (N = 20) | 116.7 ± 5.1 | 120.3 ± 7.2 | 116.9 ± 4.1 | 122.1 ± 5.0 | 125.2 ± 4.7 | 129.3 ± 1.5 | 116.9 ± 6.9 | 124.5 ± 4.7 | |
| 16/17 | male (N = 10) | 115.5 ± 3.6 | 120.1 ± 4.6 | 120.6 ± 0.8 | 120.1 ± 7.7 | 127.0 ± 2.8 | 128.8 ± 2.5 | 119.2 ± 4.8 | 121.7 ± 6.4 |
| female (N = 10) | 114.4 ± 5.6 | 122.0 ± 6.5 | 116.3 ± 1.7 | 122.0 ± 5.0 | 128.6 ± 2.1 | 127.7 ± 4.4 | 117.5 ± 8.3 | 124.4 ± 4.2 | |
| ∑ (N = 20) | 115.0 ± 4.6 | 121.1 ± 5.5 | 118.5 ± 2.6 | 121.1 ± 6.4 | 127.8 ± 2.6 | 128.3 ± 3.5 | 118.4 ± 6.7 | 123.1 ± 5.4 | |
| Rate of change (β = Z × year−1) | male (N = 100) | −0.54 ** | 0.09 | 0.29 | 0.65 ** | 0.77 ** | 0.54 ** | 0.56 * | 0.20 |
| female (N = 100) | −0.24 | 0.49 * | 0.19 | 0.64 ** | 0.29 | 0.32 * | 0.64 * | 0.57 | |
| ∑ (N = 200) | −0.39 ** | 0.29 * | 0.24 * | 0.65 ** | 0.53 ** | 0.43 ** | 0.60 ** | 0.39 ** |
| Cohort | Task | 20 m | Long Jump | Balancing | Sit-Ups | Push-Ups | Jumping | Stand + Reach | 6 min Run |
|---|---|---|---|---|---|---|---|---|---|
| mean Z ± SD | mean Z ± SD | mean Z ± SD | mean Z ± SD | mean Z ± SD | mean Z ± SD | mean Z ± SD | mean Z ± SD | ||
| 09/10 | male (N = 10) | 108.4 ± 3.4 | 113.0 ± 7.5 | 111.9 ± 5.2 | 115.2 ± 6.0 | 114.5 ± 9.3 | 122.7 ± 7.8 | 104.8 ± 9.5 | 111.5 ± 5.0 |
| female (N = 10) | 106.5 ± 5.5 | 113.6 ± 6.4 | 112.8 ± 3.1 | 112.9 ± 4.8 | 110.7 ± 10.6 | 122.5 ± 7.1 | 115.4 ± 10.1 | 116.5 ± 4.2 | |
| ∑ (N = 20) | 107.5 ± 4.6 | 113.3 ± 6.8 | 112.4 ± 4.2 | 114.1 ± 5.4 | 112.6 ± 9.9 | 122.6 ± 7.2 | 110.1 ± 11.0 | 114.0 ± 5.2 | |
| 10/11 | male (N = 10) | 122.1 ± 5.4 | 121.7 ± 5.4 | 116.0 ± 2.4 | 119.6 ± 7.8 | 113.1 ± 5.1 | 124.9 ± 5.2 | 109.4 ± 7.3 | 113.0 ± 3.9 |
| female (N = 10) | 115.7 ± 6.1 | 119.8 ± 5.3 | 114.0 ± 1.9 | 113.7 ± 5.4 | 115.2 ± 3.2 | 127.5 ± 3.2 | 111.4 ± 10.8 | 121.3 ± 4.4 | |
| ∑ (N = 20) | 118.9 ± 6.5 | 120.8 ± 5.3 | 115.0 ± 2.4 | 116.7 ± 7.2 | 114.2 ± 4.3 | 126.2 ± 4.4 | 110.4 ± 9.0 | 117.2 ± 5.9 | |
| 11/12 | male (N = 10) | 118.4 ± 3.6 | 118.9 ± 7.0 | 115.1 ± 3.1 | 116.6 ± 7.9 | 122.8 ± 5.9 | 128.1 ± 2.6 | 109.5 ± 7.2 | 114.9 ± 4.3 |
| female (N = 10) | 114.0 ± 7.0 | 119.3 ± 6.0 | 112.9 ± 4.7 | 114.0 ± 5.4 | 109.5 ± 5.3 | 128.3 ± 2.9 | 111.5 ± 8.9 | 115.0 ± 7.2 | |
| ∑ (N = 20) | 116.2 ± 5.9 | 119.1 ± 6.4 | 114.0 ± 4.0 | 115.3 ± 6.7 | 116.2 ± 8.7 | 128.2 ± 2.6 | 110.5 ± 8.0 | 115.0 ± 5.8 | |
| 12/13 | male (N = 10) | 112.8 ± 4.5 | 122.6 ± 6.4 | 114.6 ± 3.8 | 117.6 ± 7.3 | 119.5 ± 6.1 | 125.5 ± 4.5 | 114.0 ± 7.2 | 110.6 ± 5.1 |
| female (N = 10) | 113.7 ± 2.7 | 120.6 ± 4.7 | 113.0 ± 4.3 | 118.6 ± 2.4 | 114.1 ± 11.7 | 125.0 ± 3.6 | 115.2 ± 7.8 | 115.0 ± 5.2 | |
| ∑ (N = 20) | 113.3 ± 3.6 | 121.6 ± 5.6 | 113.8 ± 4.0 | 118.1 ± 5.3 | 116.8 ± 9.5 | 125.3 ± 3.9 | 114.6 ± 7.3 | 112.8 ± 5.5 | |
| 13/14 | male (N = 10) | 119.0 ± 8.7 | 119.8 ± 5.3 | 116.4 ± 1.7 | 118.5 ± 5.1 | 120.7 ± 5.3 | 129.0 ± 1.6 | 107.2 ± 8.3 | 113.9 ± 5.6 |
| female (N = 10) | 117.4 ± 6.3 | 121.7 ± 3.9 | 113.5 ± 2.3 | 119.5 ± 6.7 | 113.9 ± 7.4 | 128.6 ± 2.1 | 109.7 ± 10.5 | 118.3 ± 4.9 | |
| ∑ (N = 20) | 118.2 ± 7.4 | 120.8 ± 4.6 | 115.0 ± 2.5 | 119.0 ± 5.8 | 117.3 ± 7.2 | 128.8 ± 1.8 | 108.5 ± 9.3 | 116.1 ± 5.6 | |
| 14/15 | male (N = 10) | 121.7 ± 5.8 | 119.4 ± 7.7 | 116.6 ± 2.2 | 121.8 ± 6.2 | 118.5 ± 9.3 | 128.7 ± 3.1 | 111.4 ± 8.1 | 113.8 ± 3.2 |
| female (N = 10) | 112.5 ± 6.5 | 122.8 ± 6.0 | 112.0 ± 5.6 | 120.9 ± 4.3 | 114.0 ± 8.4 | 128.7 ± 2.8 | 120.6 ± 6.1 | 116.9 ± 6.0 | |
| ∑ (N = 20) | 117.1 ± 7.6 | 121.1 ± 6.9 | 114.3 ± 4.8 | 121.4 ± 5.2 | 116.3 ± 8.9 | 128.7 ± 2.9 | 116.0 ± 8.4 | 115.4 ± 4.9 | |
| 15/16 | male (N = 10) | 119.3 ± 5.6 | 120.2 ± 6.4 | 114.2 ± 3.9 | 122.4 ± 6.6 | 123.9 ± 7.7 | 125.8 ± 5.4 | 112.1 ± 3.7 | 117.6 ± 4.7 |
| female (N = 10) | 112.0 ± 4.4 | 118.5 ± 2.3 | 114.8 ± 0.4 | 125.2 ± 5.4 | 121.6 ± 9.3 | 129.2 ± 2.2 | 122.2 ± 7.0 | 115.5 ± 5.1 | |
| ∑ (N = 20) | 115.7 ± 6.2 | 119.4 ± 4.8 | 114.5 ± 2.7 | 123.8 ± 6.0 | 122.8 ± 8.4 | 127.5 ± 4.4 | 117.2 ± 7.5 | 116.6 ± 4.9 | |
| 16/17 | male (N = 10) | 114.2 ± 3.7 | 118.0 ± 7.8 | 116.2 ± 2.3 | 124.5 ± 5.7 | 127.7 ± 2.7 | 127.9 ± 4.0 | 116.6 ± 6.3 | 114.3 ± 7.4 |
| female (N = 10) | 109.8 ± 3.7 | 119.9 ± 5.3 | 113.8 ± 2.4 | 124.7 ± 5.4 | 126.7 ± 4.9 | 126.8 ± 4.2 | 118.1 ± 5.4 | 121.5 ± 2.7 | |
| ∑ (N = 20) | 112.0 ± 4.2 | 119.0 ± 6.6 | 115.0 ± 2.6 | 124.6 ± 5.4 | 127.1 ± 3.8 | 127.4 ± 4.0 | 117.4 ± 5.8 | 117.9 ± 6.5 | |
| Rate of change (β = Z × year−1) | male (N = 80) | 0.51 | 0.32 | 0.33 | +1.14 ** | +1.58 ** | 0.55 * | +1.13 ** | 0.51 * |
| female (N = 80) | 0.05 | 0.59 | 0.11 | +1.93 ** | +1.87 ** | 0.52 * | +1.13 * | 0.18 | |
| ∑ (N = 160) | 0.28 | 0.45 * | 0.22 | +1.53 ** | +1.73 ** | 0.53 ** | +1.13 ** | 0.34 |
| Cohort | Task | 20 m | Long Jump | Balancing | Sit-Ups | Push-Ups | Jumping | Stand + Reach | 6 min Run |
|---|---|---|---|---|---|---|---|---|---|
| mean Z ± SD | mean Z ± SD | mean Z ± SD | mean Z ± SD | mean Z ± SD | mean Z ± SD | mean Z ± SD | mean Z ± SD | ||
| 07/08 | male (N = 226) | 111.3 ± 6.7 | 106.2 ± 7.6 | 107.8 ± 8.9 | 104.9 ± 9.0 | 105.4 ± 9.5 | 115.3 ± 8.8 | 105.1 ± 8.1 | 110.6 ± 7.6 |
| female (N = 136) | 109.7 ± 7.7 | 108.2 ± 7.9 | 108.1 ± 7.4 | 104.4 ± 9.9 | 106.9 ± 9.6 | 116.2 ± 9.5 | 104.4 ± 7.9 | 112.1 ± 7.8 | |
| ∑ (N = 362) | 110.7 ± 7.1 | 106.9 ± 7.7 | 107.9 ± 8.4 | 104.7 ± 9.3 | 105.9 ± 9.5 | 115.6 ± 9.0 | 104.9 ± 8.0 | 111.2 ± 7.7 | |
| 08/09 | male (N = 408) | 109.6 ± 7.2 | 105.1 ± 7.8 | 108.1 ± 8.8 | 106.5 ± 8.5 | 109.6 ± 11.1 | 113.3 ± 9.9 | 104.1 ± 9.0 | 109.6 ± 7.3 |
| female (N = 276) | 108.4 ± 7.7 | 107.6 ± 8.1 | 108.5 ± 7.9 | 105.3 ± 8.9 | 107.9 ± 11.4 | 114.7 ± 10.2 | 104.2 ± 8.8 | 110.7 ± 7.9 | |
| ∑ (N = 684) | 109.1 ± 7.5 | 106.1 ± 8.0 | 108.3 ± 8.5 | 106.0 ± 8.7 | 108.9 ± 11.2 | 113.9 ± 10.0 | 104.1 ± 8.9 | 110.1 ± 7.6 | |
| 09/10 | male (N = 360) | 110.6 ± 7.3 | 107.3 ± 8.2 | 108.3 ± 8.6 | 105.7 ± 7.6 | 111.0 ± 10.0 | 116.2 ± 9.5 | 105.1 ± 8.5 | 112.3 ± 7.3 |
| female (N = 207) | 108.8 ± 7.9 | 107.2 ± 8.9 | 108.7 ± 7.5 | 104.7 ± 8.4 | 108.5 ± 12.0 | 118.8 ± 9.7 | 104.7 ± 9.5 | 112.3 ± 8.7 | |
| ∑ (N = 567) | 109.9 ± 7.5 | 107.3 ± 8.5 | 108.4 ± 8.2 | 105.4 ± 7.9 | 110.1 ± 10.8 | 117.1 ± 9.7 | 105.0 ± 8.9 | 112.3 ± 7.9 | |
| 10/11 | male (N = 335) | 109.4 ± 7.4 | 105.7 ± 7.9 | 108.9 ± 8.6 | 105.0 ± 7.4 | 109.7 ± 10.4 | 113.4 ± 10.4 | 104.7 ± 8.8 | 111.1 ± 8.0 |
| female (N = 199) | 108.1 ± 7.0 | 107.9 ± 8.6 | 109.2 ± 7.6 | 105.3 ± 7.6 | 111.7 ± 11.4 | 117.0 ± 10.5 | 106.4 ± 8.4 | 113.6 ± 7.9 | |
| ∑ (N = 534) | 108.9 ± 7.3 | 106.6 ± 8.2 | 109.0 ± 8.2 | 105.1 ± 7.5 | 110.5 ± 10.8 | 114.7 ± 10.6 | 105.3 ± 8.7 | 112.0 ± 8.0 | |
| 11/12 | male (N = 529) | 109.4 ± 9.1 | 104.3 ± 9.3 | 108.6 ± 9.1 | 106.7 ± 9.2 | 107.5 ± 12.8 | 111.0 ± 11.2 | 103.1 ± 9.4 | 108.5 ± 9.6 |
| female (N = 266) | 106.2 ± 9.8 | 105.4 ± 9.8 | 108.2 ± 8.2 | 107.2 ± 10.2 | 107.6 ± 14.9 | 113.1 ± 12.2 | 103.3 ± 9.9 | 109.4 ± 10.4 | |
| ∑ (N = 795) | 108.3 ± 9.5 | 104.7 ± 9.5 | 108.5 ± 8.8 | 106.9 ± 9.5 | 107.5 ± 13.5 | 111.7 ± 11.5 | 103.2 ± 9.6 | 108.8 ± 9.9 | |
| 12/13 | male (N = 773) | 109.0 ± 8.6 | 104.4 ± 8.8 | 107.5 ± 8.9 | 106.3 ± 9.6 | 111.5 ± 10.8 | 112.8 ± 10.3 | 103.2 ± 9.3 | 109.5 ± 8.6 |
| female (N = 425) | 105.7 ± 9.1 | 104.2 ± 9.9 | 107.3 ± 8.5 | 103.9 ± 10.0 | 109.3 ± 11.3 | 112.5 ± 12.0 | 103.0 ± 10.0 | 109.6 ± 9.4 | |
| ∑ (N = 1198) | 107.8 ± 8.9 | 104.3 ± 9.2 | 107.4 ± 8.8 | 105.5 ± 9.8 | 110.7 ± 11.0 | 112.7 ± 10.9 | 103.2 ± 9.5 | 109.5 ± 8.9 | |
| 13/14 | male (N = 997) | 106.5 ± 7.8 | 104.9 ± 8.5 | 109.3 ± 8.7 | 105.7 ± 8.6 | 108.6 ± 13.0 | 115.1 ± 10.1 | 103.8 ± 9.3 | 110.6 ± 8.1 |
| female (N = 515) | 105.2 ± 8.7 | 106.9 ± 9.5 | 109.5 ± 8.3 | 105.9 ± 9.1 | 107.3 ± 12.3 | 116.4 ± 10.8 | 104.1 ± 10.0 | 112.0 ± 9.3 | |
| ∑ (N = 1512) | 106.1 ± 8.2 | 105.6 ± 8.9 | 109.3 ± 8.6 | 105.7 ± 8.8 | 108.1 ± 12.8 | 115.5 ± 10.3 | 103.9 ± 9.5 | 111.1 ± 8.5 | |
| 14/15 | male (N = 1176) | 106.9 ± 7.6 | 104.4 ± 8.7 | 108.6 ± 8.9 | 105.5 ± 9.2 | 107.2 ± 12.6 | 113.9 ± 10.8 | 104.6 ± 8.7 | 110.1 ± 8.2 |
| female (N = 609) | 105.3 ± 9.0 | 105.1 ± 10.2 | 108.7 ± 8.9 | 105.4 ± 9.7 | 108.2 ± 12.6 | 115.2 ± 11.3 | 104.5 ± 10.2 | 110.5 ± 9.6 | |
| ∑ (N = 1785) | 106.4 ± 8.2 | 104.7 ± 9.2 | 108.6 ± 8.9 | 105.4 ± 9.3 | 107.5 ± 12.6 | 114.3 ± 11.0 | 104.6 ± 9.2 | 110.2 ± 8.7 | |
| 15/16 | male (N = 1385) | 107.7 ± 8.7 | 105.3 ± 8.1 | 108.3 ± 9.0 | 106.3 ± 8.4 | 109.0 ± 11.8 | 116.4 ± 9.6 | 105.0 ± 9.1 | 110.9 ± 8.2 |
| female (N = 705) | 106.4 ± 7.9 | 106.7 ± 9.6 | 108.4 ± 8.5 | 105.5 ± 9.7 | 107.6 ± 12.8 | 116.7 ± 10.3 | 105.9 ± 10.2 | 112.5 ± 9.4 | |
| ∑ (N = 2090) | 107.2 ± 7.2 | 105.8 ± 8.6 | 108.3 ± 8.8 | 106.0 ± 8.9 | 108.5 ± 12.1 | 116.5 ± 9.9 | 105.3 ± 9.5 | 111.5 ± 8.6 | |
| 16/17 | male (N = 1252) | 106.8 ± 7.1 | 104.8 ± 8.6 | 108.7 ± 9.0 | 106.8 ± 9.0 | 106.9 ± 13.0 | 116.6 ± 10.7 | 105.2 ± 9.0 | 111.4 ± 8.6 |
| female (N = 619) | 105.6 ± 7.7 | 106.9 ± 9.7 | 109.2 ± 7.8 | 106.4 ± 10.0 | 106.8 ± 13.6 | 117.2 ± 10.9 | 105.9 ± 9.4 | 112.2 ± 9.8 | |
| ∑ (N = 1871) | 106.4 ± 7.3 | 105.5 ± 9.0 | 108.8 ± 8.6 | 106.7 ± 9.4 | 106.8 ± 13.2 | 116.8 ± 10.8 | 105.4 ± 9.1 | 111.7 ± 9.0 | |
| Rate of change (β = Z × year−1) | male N = 7441) | −0.46 ** | −0.11 ** | 0.05 | 0.08 * | −0.22 ** | 0.37 ** | 0.11 ** | 0.12 ** |
| female (N = 3957) | −0.38 ** | −0.09 | 0.06 | 0.12 * | −0.17 * | 0.16 * | 0.19 ** | 0.10 | |
| ∑ (N = 11,398) | −0.42 ** | −0.11 ** | 0.06 | 0.10 ** | −0.20 ** | 0.29 ** | 0.14 ** | 0.10 ** |
| Cohort | Task | 20 m | Long Jump | Balancing | Sit-Ups | Push-Ups | Jumping | Stand + Reach | 6 min Run |
|---|---|---|---|---|---|---|---|---|---|
| mean Z ± SD | mean Z ± SD | mean Z ± SD | mean Z ± SD | mean Z ± SD | mean Z ± SD | mean Z ± SD | mean Z ± SD | ||
| 09/10 | male (N = 30) | 103.5 ± 7.6 | 107.2 ± 9.2 | 108.6 ± 7.2 | 111.2 ± 7.7 | 108.5 ± 9.0 | 119.3 ± 6.6 | 100.2 ± 10.3 | 107.3 ± 5.4 |
| female (N = 24) | 101.9 ± 7.7 | 110.2 ± 6.9 | 107.4 ± 8.4 | 110.0 ± 6.7 | 105.8 ± 12.3 | 118.0 ± 8.8 | 108.9 ± 11.5 | 110.9 ± 6.6 | |
| ∑ (N = 54) | 102.8 ± 7.6 | 108.5 ± 8.3 | 108.1 ± 7.7 | 110.6 ± 7.2 | 107.3 ± 10.6 | 118.7 ± 7.6 | 104.1 ± 11.6 | 108.9 ± 6.2 | |
| 10/11 | male (N = 108) | 113.2 ± 7.3 | 110.6 ± 9.3 | 110.6 ± 6.7 | 106.6 ± 8.4 | 107.4 ± 8.3 | 119.0 ± 7.3 | 105.9 ± 8.7 | 108.0 ± 6.3 |
| female (N = 75) | 109.7 ± 6.3 | 112.2 ± 6.7 | 109.4 ± 6.3 | 109.1 ± 6.4 | 106.7 ± 7.8 | 120.8 ± 6.7 | 108.0 ± 7.5 | 114.0 ± 6.5 | |
| ∑ (N = 183) | 111.7 ± 7.1 | 111.2 ± 8.4 | 110.1 ± 6.6 | 107.6 ± 7.7 | 107.1 ± 8.0 | 119.7 ± 7.1 | 106.7 ± 8.2 | 110.4 ± 7.0 | |
| 11/12 | male (N = 132) | 112.1 ± 6.6 | 109.5 ± 8.3 | 110.9 ± 6.5 | 109.2 ± 9.0 | 107.3 ± 12.0 | 119.8 ± 8.1 | 101.7 ± 9.8 | 106.1 ± 6.9 |
| female (N = 78) | 103.5 ± 7.5 | 112.3 ± 7.7 | 109.1 ± 6.7 | 107.4 ± 7.6 | 100.3 ± 10.8 | 121.8 ± 7.6 | 104.7 ± 9.9 | 111.0 ± 6.4 | |
| ∑ (N = 210) | 110.5 ± 7.0 | 110.6 ± 8.2 | 110.2 ± 6.6 | 108.5 ± 8.5 | 104.6 ± 12.0 | 120.6 ± 8.0 | 102.8 ± 9.9 | 107.9 ± 7.1 | |
| 12/13 | male (N = 131) | 108.6 ± 6.7 | 108.3 ± 9.7 | 110.8 ± 6.8 | 109.1 ± 7.2 | 102.8 ± 14.1 | 120.2 ± 7.1 | 103.7 ± 8.6 | 106.2 ± 7.8 |
| female (N = 78) | 103.5 ± 7.5 | 110.8 ± 8.7 | 108.7 ± 6.5 | 110.0 ± 8.1 | 96.0 ± 15.6 | 121.1 ± 6.8 | 108.1 ± 9.4 | 110.4 ± 6.2 | |
| ∑ (N = 209) | 106.7 ± 7.4 | 109.3 ± 9.4 | 110.0 ± 6.8 | 109.4 ± 7.5 | 100.2 ± 15.0 | 120.6 ± 7.0 | 105.4 ± 9.1 | 107.8 ± 7.5 | |
| 13/14 | male (N = 114) | 114.8 ± 7.0 | 108.9 ± 8.3 | 109.8 ± 8.0 | 109.9 ± 9.9 | 105.3 ± 11.0 | 120.8 ± 7.4 | 103.4 ± 8.0 | 107.3 ± 6.0 |
| female (N = 82) | 109.7 ± 7.8 | 112.1 ± 7.4 | 109.2 ± 7.0 | 111.7 ± 8.9 | 101.7 ± 11.2 | 122.3 ± 7.6 | 108.4 ± 10.2 | 111.3 ± 6.9 | |
| ∑ (N = 196) | 112.7 ± 7.8 | 110.3 ± 8.1 | 109.6 ± 7.6 | 110.7 ± 9.5 | 103.8 ± 11.2 | 121.4 ± 7.5 | 105.5 ± 9.3 | 109.0 ± 6.7 | |
| 14/15 | male (N = 273) | 109.5 ± 8.8 | 104.5 ± 12.2 | 108.3 ± 9.2 | 103.1 ± 10.8 | 97.7 ± 13.0 | 116.7 ± 11.5 | 100.0 ± 10.0 | 103.7 ± 10.2 |
| female (N = 163) | 102.9 ± 9.3 | 106.6 ± 11.8 | 108.8 ± 7.0 | 106.1 ± 11.8 | 95.1 ± 13.5 | 117.3 ± 12.2 | 107.1 ± 10.7 | 107.9 ± 10.9 | |
| ∑ (N = 436) | 107.1 ± 9.5 | 105.3 ± 12.1 | 108.5 ± 8.4 | 104.2 ± 11.3 | 96.7 ± 13.2 | 116.9 ± 11.8 | 102.6 ± 10.8 | 105.3 ± 10.7 | |
| 15/16 | male (N = 310) | 107.1 ± 8.7 | 104.7 ± 11.3 | 109.1 ± 8.4 | 105.9 ± 11.2 | 106.2 ± 15.8 | 118.0 ± 11.0 | 102.9 ± 9.6 | 104.7 ± 10.2 |
| female (N = 221) | 102.0 ± 10.9 | 106.9 ± 11.1 | 108.7 ± 6.9 | 106.6 ± 11.2 | 102.4 ± 14.3 | 118.5 ± 12.0 | 107.6 ± 11.0 | 107.8 ± 11.1 | |
| ∑ (N = 531) | 105.0 ± 10.0 | 105.6 ± 11.3 | 108.9 ± 7.8 | 106.2 ± 11.2 | 104.6 ± 15.3 | 118.2 ± 11.4 | 104.9 ± 10.4 | 106.0 ± 10.7 | |
| 16/17 | male (N = 444) | 106.0 ± 7.7 | 105.3 ± 10.8 | 109.4 ± 8.1 | 107.4 ± 9.8 | 112.2 ± 11.5 | 119.3 ± 9.4 | 102.5 ± 9.9 | 105.5 ± 9.6 |
| female (N = 270) | 103.1 ± 8.2 | 108.4 ± 10.7 | 107.1 ± 8.7 | 109.0 ± 9.8 | 110.5 ± 11.4 | 119.1 ± 9.7 | 108.4 ± 10.1 | 108.8 ± 11.4 | |
| ∑ (N = 714) | 104.9 ± 8.0 | 106.5 ± 10.9 | 108.5 ± 8.4 | 108.0 ± 9.8 | 111.6 ± 11.5 | 119.3 ± 9.5 | 104.8 ± 10.4 | 106.8 ± 10.5 | |
| Rate of change (β = Z × year−1) | male (N = 1542) | −0.95 ** | −0.86 ** | −0.24 * | −0.35 ** | 0.80 ** | −0.15 | −0.17 | −0.35 ** |
| female (N = 991) | −0.86 ** | −0.76 ** | −0.27 * | −0.17 | +1.10 ** | −0.39 * | 0.17 | −0.69 ** | |
| ∑ (N = 2553) | −0.91 ** | −0.82 ** | −0.25 ** | −0.28 ** | 0.91 ** | −0.25 * | −0.04 | −0.49 ** |
References
- Buekers, M.; Borry, P.; Rowe, P. Talent in sports. Some reflections about the search for future champions. Mov. Sport Sci. Sci. Mot. 2015, 88, 3–12. [Google Scholar] [CrossRef]
- Pearson, D.T.; Naughton, G.A.; Torode, M. Predictability of physiological testing and the role of maturation in talent identification for adolescent team sports. J. Sci. Med. Sport 2006, 9, 277–287. [Google Scholar] [CrossRef] [PubMed]
- Homann, A.; Seidel, I. Scientific aspects of talent development. Int. J. Phys. Educ. 2003, 40, 9–20. [Google Scholar]
- Bös, K.; Schlenker, L.; Albrecht, C.; Büsch, D.; Lämmle, L.; Müller, H.; Oberger, J.; Seidel, I.; Tittlbach, S.; Woll, A. German Motor Test 6-18, 2nd ed.; Czwalina: Hamburg, Germany, 2016. [Google Scholar]
- Johnston, K.; Wattie, N.; Schorer, J.; Baker, J. Talent Identification in Sport: A Systematic Review. Sports Med. 2018, 48, 97–109. [Google Scholar] [CrossRef] [PubMed]
- Tomkinson, G.R.; Olds, T.S. Secular changes in pediatric aerobic fitness test performance: The global picture. Med. Sport Sci. 2007, 50, 46–66. [Google Scholar] [CrossRef] [PubMed]
- Tomkinson, G.R. Global changes in anaerobic fitness test performance of children and adolescents (1958–2003). Scand. J. Med. Sci. Sports 2007, 17, 497–507. [Google Scholar] [CrossRef] [PubMed]
- Tomkinson, G.R.; Lang, J.J.; Tremblay, M.S. Temporal trends in the cardiorespiratory fitness of children and adolescents representing 19 high-income and upper middle-income countries between 1981 and 2014. Br. J. Sports Med. 2017, 53, 1–10. [Google Scholar] [CrossRef] [PubMed]
- Bös, K. Physical Fitness of children and adolescents. In The First German Children’s and Youth Sports Report; Schmidt, W., Hartmann-Tews, I., Brettschneider, W.-D., Eds.; Hofmann: Schorndorf, Germany, 2003; pp. 85–107. [Google Scholar]
- Bös, K.; Oberger, J.; Lämmle, L.; Opper, E.; Romahn, N.; Tittlbach, S.; Wagner, M.; Woll, A.; Worth, A. Physical Fitness of children. In The Second German Children’s and Youth Sports Report: Focus Childhood; Schmidt, W., Zimmer, R., Eds.; Hofmann: Schorndorf, Germany, 2008; pp. 136–157. [Google Scholar]
- Albrecht, C.; Hanssen-Doose, A.; Bös, K.; Schlenker, L.; Schmidt, S.; Wagner, M.; Will, N.; Worth, A. Physical Fitness of children and adolescents in Germany. Sportwiss 2016, 46, 294–304. [Google Scholar] [CrossRef]
- Seidel, I.; Grüneberg, C.; Engel, F.; Kurz, A.-K.; Hientsch, A.-K.; Moll, C.; Bös, K. Motor Test 2 for Sport Schools of North Rhine-Westphalia. Test Instruction MT2-A, MT2-B for 17 Sport Disciplines (Badminton, Basketball, Ice Hockey, Fencing, Soccer, Handball, Hockey, Judo, Canoe, Track and Field, Wrestling, Rowing, Swimming, Taekwondo, Tennis, Table tennis, Volleyball, Sport Psychological Questionnaires); MFKJKS: Düsseldorf, Germany, 2014. [Google Scholar]
- Bös, K. Handbook Motor Tests; Hogrefe: Göttingen, Germany, 1987. [Google Scholar]
- Gagné, F. Building Gifts into Talents: Brief Overview of the DMGT 2.0. Gifted 2008, 152, 5–9. [Google Scholar]
- Musch, J.; Grondin, S. Unequal Competition as an Impediment to Personal Development: A Review of the Relative Age Effect in Sport. Dev. Rev. 2001, 21, 147–167. [Google Scholar] [CrossRef]
- Roth, A.; Schmidt, S.C.E.; Seidel, I.; Woll, A.; Bös, K. Tracking of Physical Fitness of Primary School Children in Trier: A 4-Year Longitudinal Study. BioMed Res. Int. 2018, 2018, 1–9. [Google Scholar] [CrossRef]
- Mirwald, R.L.; Baxter-Jones, A.D.G.; Bailey, D.A.; Beunen, G.P. An assessment of maturity from athropometric measurements. Med. Sci. Sports Exerc. 2002, 34, 689–694. [Google Scholar]
- Vaeyens, R.; Lenoir, M.; Williams, A.M.; Philippaerts, R.M. Talent identification and development programmes in sport: Current models and future directions. Sports Med. 2008, 38, 703–714. [Google Scholar] [CrossRef] [PubMed]
- Allen, S.V.; Hopkins, W.G. Age of Peak Competitive Performance of Elite Athletes: A Systematic Review. Sports Med. 2015, 45, 1431–1441. [Google Scholar] [CrossRef] [PubMed]
- Wendeborn, T.; Drewicke, E.; Hummel, A. Combined system school—Elite sports in the Federal Republic of Germany: An overview. Sportunterricht 2018, 67, 435–439. [Google Scholar]

| Cohort | Grade 4 | All | Top 10 | Grade 7 | All | Top 10 |
|---|---|---|---|---|---|---|
| mean Z ± SD | mean Z ± SD | mean Z ± SD | mean Z ± SD | |||
| 07/08 | male (N = 226) | 108.3 ± 5.1 | 118.4 ± 1.7 | |||
| female (N = 136) | 108.8 ± 5.2 | 117.9 ± 1.6 | ||||
| ∑ (N = 362) | 108.5 ± 5.2 | 118.1 ± 1.6 | ||||
| 08/09 | male (N = 408) | 108.3 ± 5.3 | 117.8 ± 0.8 | |||
| female (N = 276) | 108.4 ± 5.5 | 120.3 ± 1.3 | ||||
| ∑ (N = 684) | 108.3 ± 5.3 | 119.1 ± 1.7 | ||||
| 09/10 | male (N = 360) | 109.5 ± 5.1 | 120.6 ± 1.7 | m (N = 30) | 108.2 ± 3.8 | 112.8 ± 2.2 |
| female (N = 207) | 109.2 ± 5.5 | 119.0 ± 1.8 | f (N = 24) | 109.1 ± 4.9 | 113.9 ± 2.1 | |
| ∑ (N = 567) | 109.4 ± 5.2 | 119.8 ± 1.9 | ∑ (N = 54) | 108.6 ± 4.3 | 113.3 ± 2.2 | |
| 10/11 | male (N = 335) | 108.5 ± 5.3 | 118.9 ± 1.4 | m (N = 108) | 110.1 ± 4.3 | 117.5 ± 0.6 |
| female (N = 199) | 109.9 ± 5.4 | 120.3 ± 2.0 | f (N = 75) | 111.2 ± 3.7 | 117.3 ± 1.2 | |
| ∑ (N = 534) | 109.0 ± 5.4 | 119.6 ± 1.8 | ∑ (N = 183) | 110.6 ± 4.1 | 117.4 ± 0.9 | |
| 11/12 | male (N = 529) | 107.4 ± 6.9 | 120.5 ± 1.6 | m (N = 132) | 109.6 ± 5.0 | 118.0 ± 1.2 |
| female (N = 266) | 107.5 ± 7.6 | 119.7 ± 1.2 | f (N = 78) | 109.3 ± 4.6 | 115.6 ± 0.9 | |
| ∑ (N = 795) | 107.4 ± 7.2 | 120.1 ± 1.5 | ∑ (N = 210) | 109.5 ± 4.8 | 116.8 ± 1.7 | |
| 12/13 | male (N = 773) | 108.0 ± 6.3 | 121.3 ± 1.3 | m (N = 131) | 108.8 ± 5.1 | 117.2 ± 1.2 |
| female (N = 425) | 106.9 ± 6.9 | 120.6 ± 1.0 | f (N = 78) | 108.7 ± 5.8 | 116.9 ± 1.4 | |
| ∑ (N = 1198) | 107.6 ± 6.5 | 121.0 ± 1.2 | ∑ (N = 209) | 108.8 ± 5.4 | 117.0 ± 1.3 | |
| 13/14 | male (N = 997) | 108.1 ± 5.5 | 119.6 ± 0.8 | m (N = 114) | 110.1 ± 4.6 | 118.1 ± 1.3 |
| female (N = 515) | 108.4 ± 6.2 | 120.6 ± 1.3 | f (N = 82) | 110.8 ± 5.0 | 117.8 ± 1.5 | |
| ∑ (N = 1512) | 108.2 ± 5.8 | 120.1 ± 1.2 | ∑ (N = 196) | 110.4 ± 4.8 | 117.9 ± 1.4 | |
| 14/15 | male (N = 1176) | 107.7 ± 5.8 | 120.7 ± 1.2 | m (N = 273) | 105.4 ± 7.7 | 119.0 ± 2.3 |
| female (N = 609) | 107.9 ± 6.9 | 121.1 ± 0.8 | f (N = 163) | 106.5 ± 8.2 | 118.6 ± 1.3 | |
| ∑ (N = 1785) | 107.7 ± 6.2 | 120.9 ± 1.0 | ∑ (N = 436) | 105.8 ± 7.9 | 118.8 ± 1.8 | |
| 15/16 | male (N = 1385) | 108.6 ± 5.4 | 120.6 ± 0.8 | m (N = 310) | 107.3 ± 7.5 | 119.4 ± 1.3 |
| female (N = 705) | 108.7 ± 6.5 | 122.3 ± 0.8 | f (N = 221) | 107.6 ± 8.1 | 119.9 ± 1.2 | |
| ∑ (N = 2090) | 108.7 ± 5.8 | 121.5 ± 1.1 | ∑ (N = 531) | 107.4 ± 7.7 | 119.7 ± 1.2 | |
| 16/17 | male (N = 1252) | 108.4 ± 6.0 | 121.6 ± 0.5 | m (N = 444) | 108.5 ± 6.2 | 119.9 ± 0.9 |
| female (N = 619) | 108.8 ± 6.6 | 121.6 ± 0.8 | f (N = 270) | 109.4 ± 6.8 | 120.2 ± 1.1 | |
| ∑ (N = 1871) | 108.5 ± 6.2 | 121.6 ± 0.7 | ∑ (N = 714) | 108.8 ± 6.5 | 120.0 ± 1.0 | |
| Rate of change (β = Z × year−1) | male N = 7441) | −0.01 | 0.32 ** | m (N = 1542) | −0.29 ** | 0.76 ** |
| female (N = 3957) | 0.00 | 0.36 ** | f (N = 991) | −0.24 * | 0.80 ** | |
| ∑ (N = 11,398) | 0.00 | 0.34 ** | ∑ (N = 2553) | −0.27 ** | 0.78 ** | |
| ANCOVA: Effect of cohort (controlled for N) Variance explained (p.Eta2) | male: F = | 5.71 (6.42) | 10.52 (6.84) | m: F = | 12.40 (13.05) | 22.44 (10.08) |
| p = | <0.01 (<0.01) | <0.01 (<0.01) | p = | <0.01 (<0.01) | <0.01 (<0.01) | |
| p.Eta2 = | 0.007 (0.007) | 0.513 (0.378) | p.Eta2 = | 0.054 (0.049) | 0.054 (0.049) | |
| female: F = | 5.51 (6.19) | 9.02 (2.08) | f: F = | 6.29 (6.81) | 23.33 (5.10) | |
| p = | <0.01 (<0.01) | <0.01 (0.046) | p = | <0.01 (<0.01) | <0.01 (<0.01) | |
| p.Eta2 = | 0.012 (0.012) | 0.474 (0.156) | p.Eta2 = | 0.043 (0.040) | 0.694 (0.298) |
© 2019 by the authors. Licensee MDPI, Basel, Switzerland. This article is an open access article distributed under the terms and conditions of the Creative Commons Attribution (CC BY) license (http://creativecommons.org/licenses/by/4.0/).
Share and Cite
Roth, A.; Schmidt, S.C.E.; Hartmann, S.; Seidel, I.; Scharenberg, S.; Bös, K. Development of Physical Fitness among the Top 10 Boys and Girls in Sport Schools: A 10-Year Cohort Analysis. Sports 2019, 7, 222. https://doi.org/10.3390/sports7100222
Roth A, Schmidt SCE, Hartmann S, Seidel I, Scharenberg S, Bös K. Development of Physical Fitness among the Top 10 Boys and Girls in Sport Schools: A 10-Year Cohort Analysis. Sports. 2019; 7(10):222. https://doi.org/10.3390/sports7100222
Chicago/Turabian StyleRoth, Andreas, Steffen C. E. Schmidt, Sina Hartmann, Ilka Seidel, Swantje Scharenberg, and Klaus Bös. 2019. "Development of Physical Fitness among the Top 10 Boys and Girls in Sport Schools: A 10-Year Cohort Analysis" Sports 7, no. 10: 222. https://doi.org/10.3390/sports7100222
APA StyleRoth, A., Schmidt, S. C. E., Hartmann, S., Seidel, I., Scharenberg, S., & Bös, K. (2019). Development of Physical Fitness among the Top 10 Boys and Girls in Sport Schools: A 10-Year Cohort Analysis. Sports, 7(10), 222. https://doi.org/10.3390/sports7100222