Surfing the Waves of the CMJ; Are There between-Sport Differences in the Waveform Data?


Abstract
1. Introduction
2. Materials and Methods
2.1. Participants
2.2. Design
2.3. Data Collection
2.4. Data Analysis
2.5. Statistical Analysis
3. Results
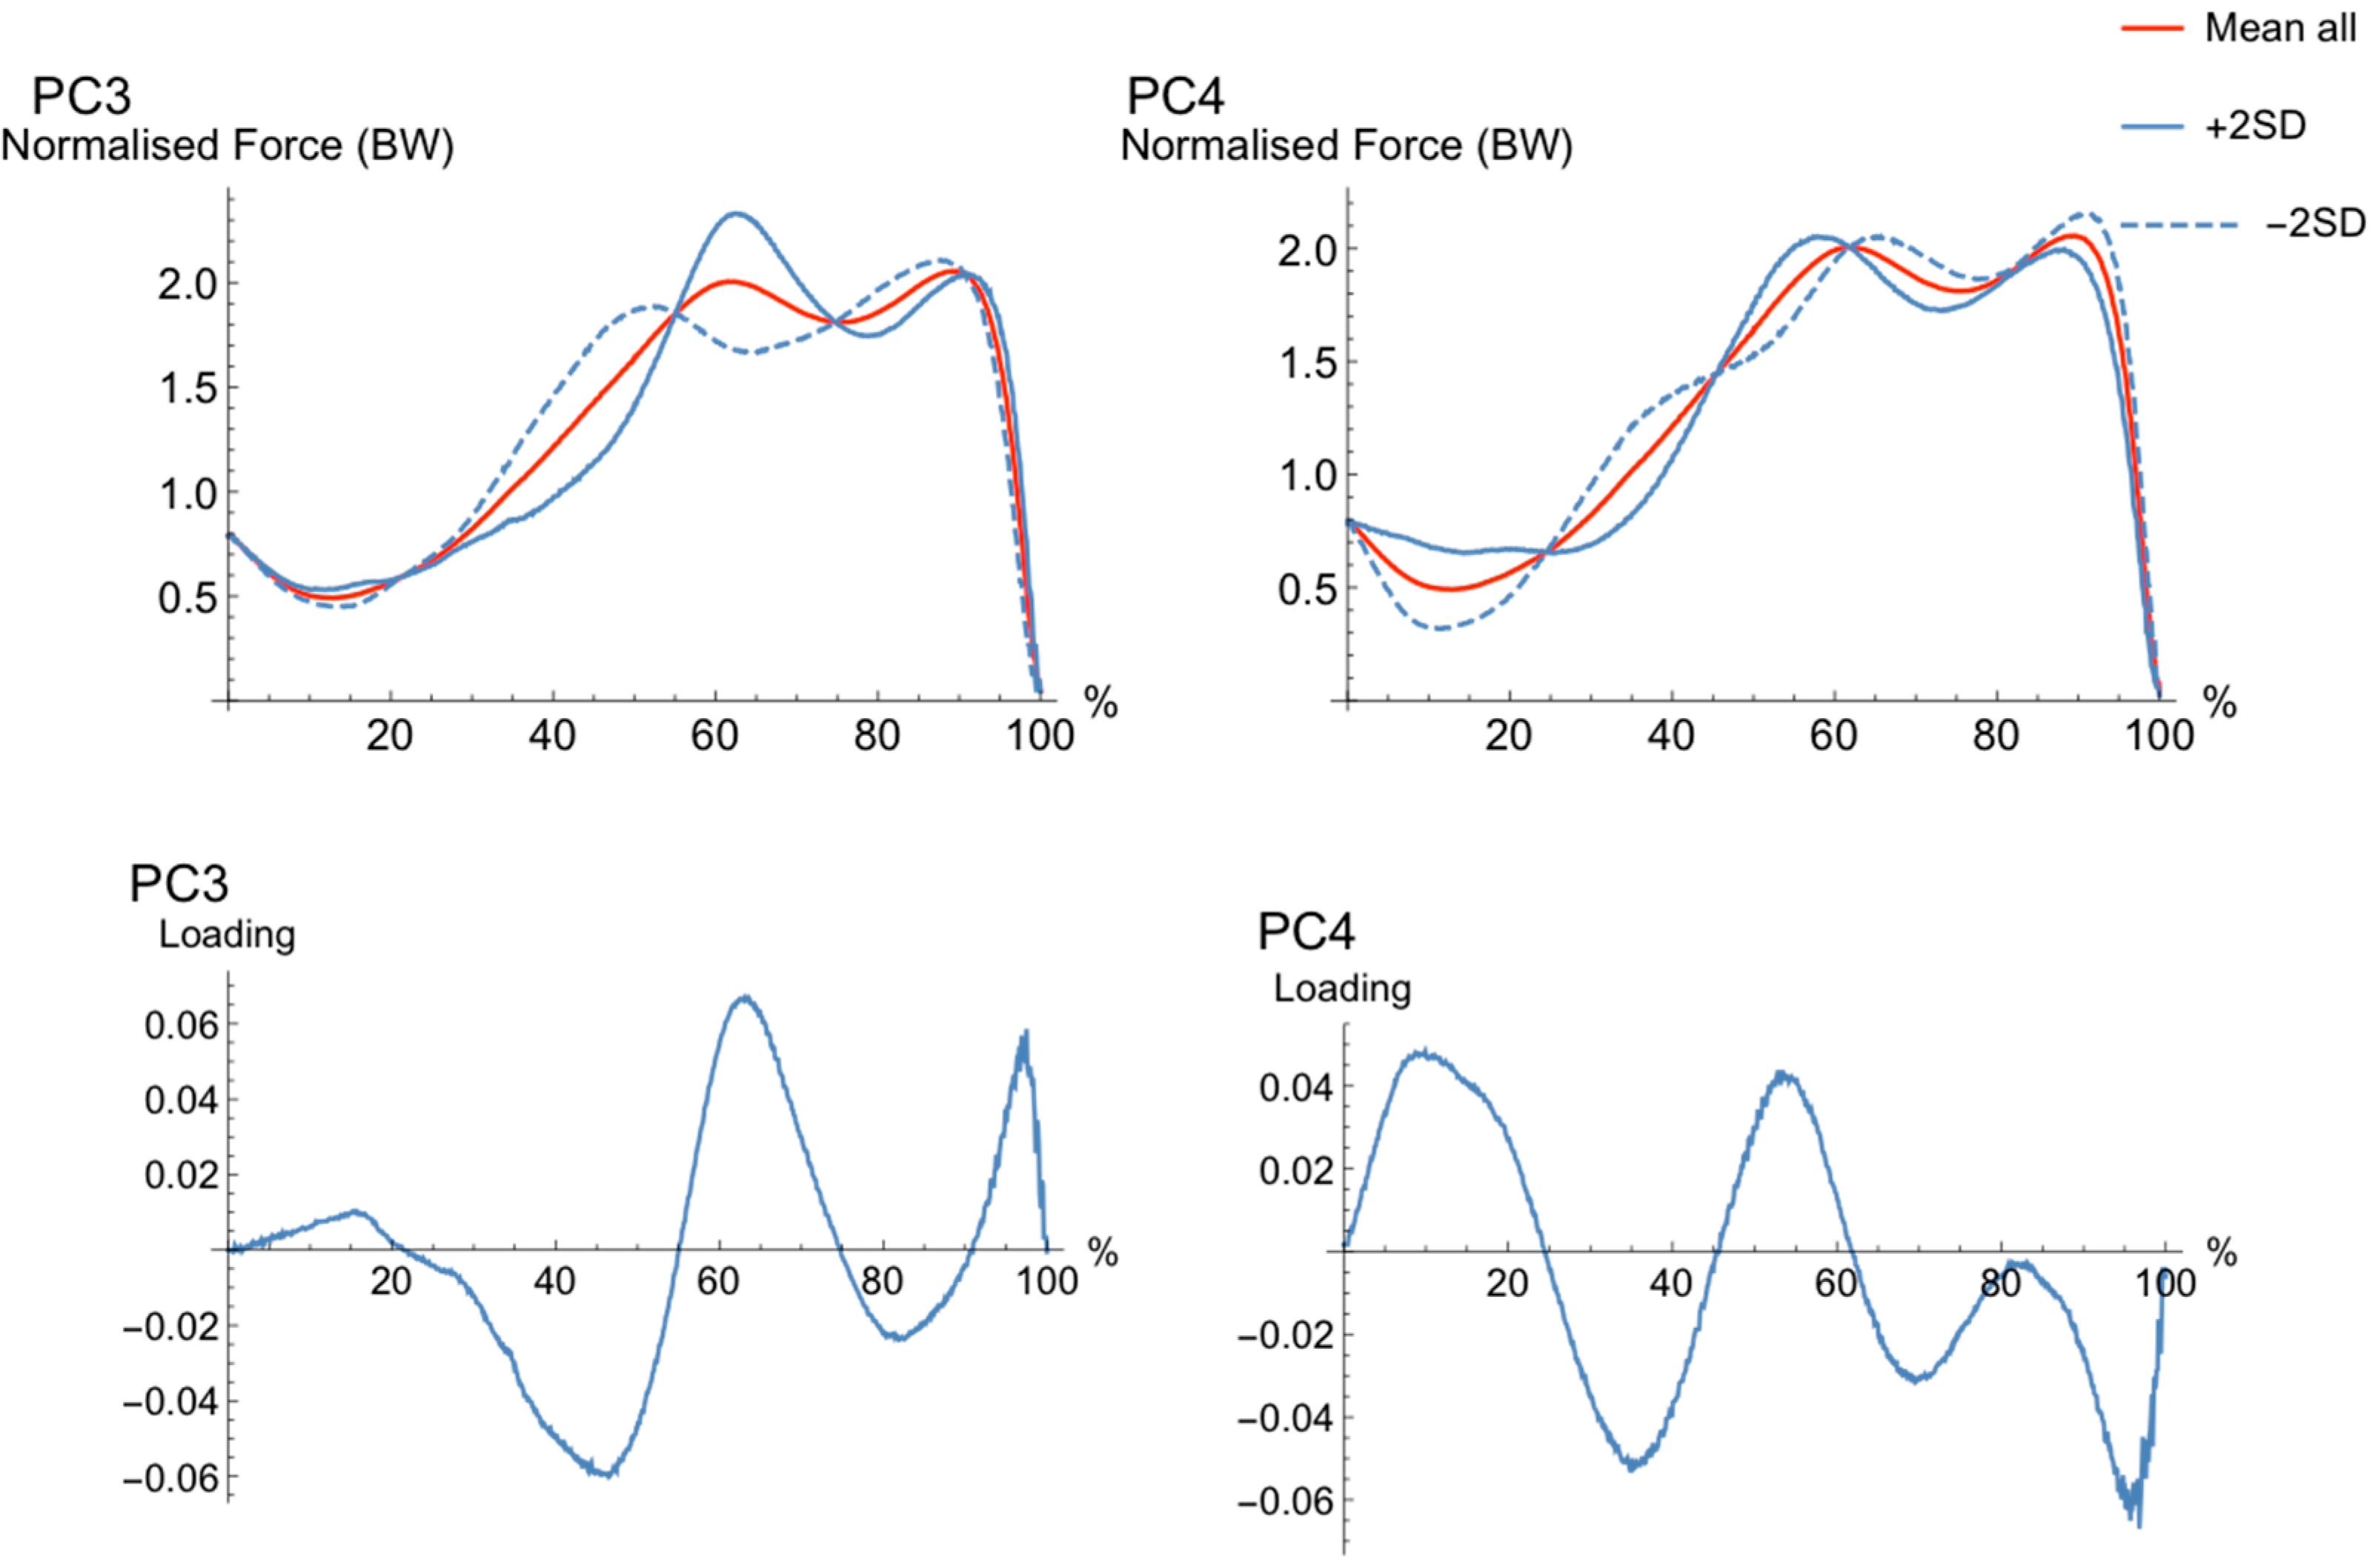
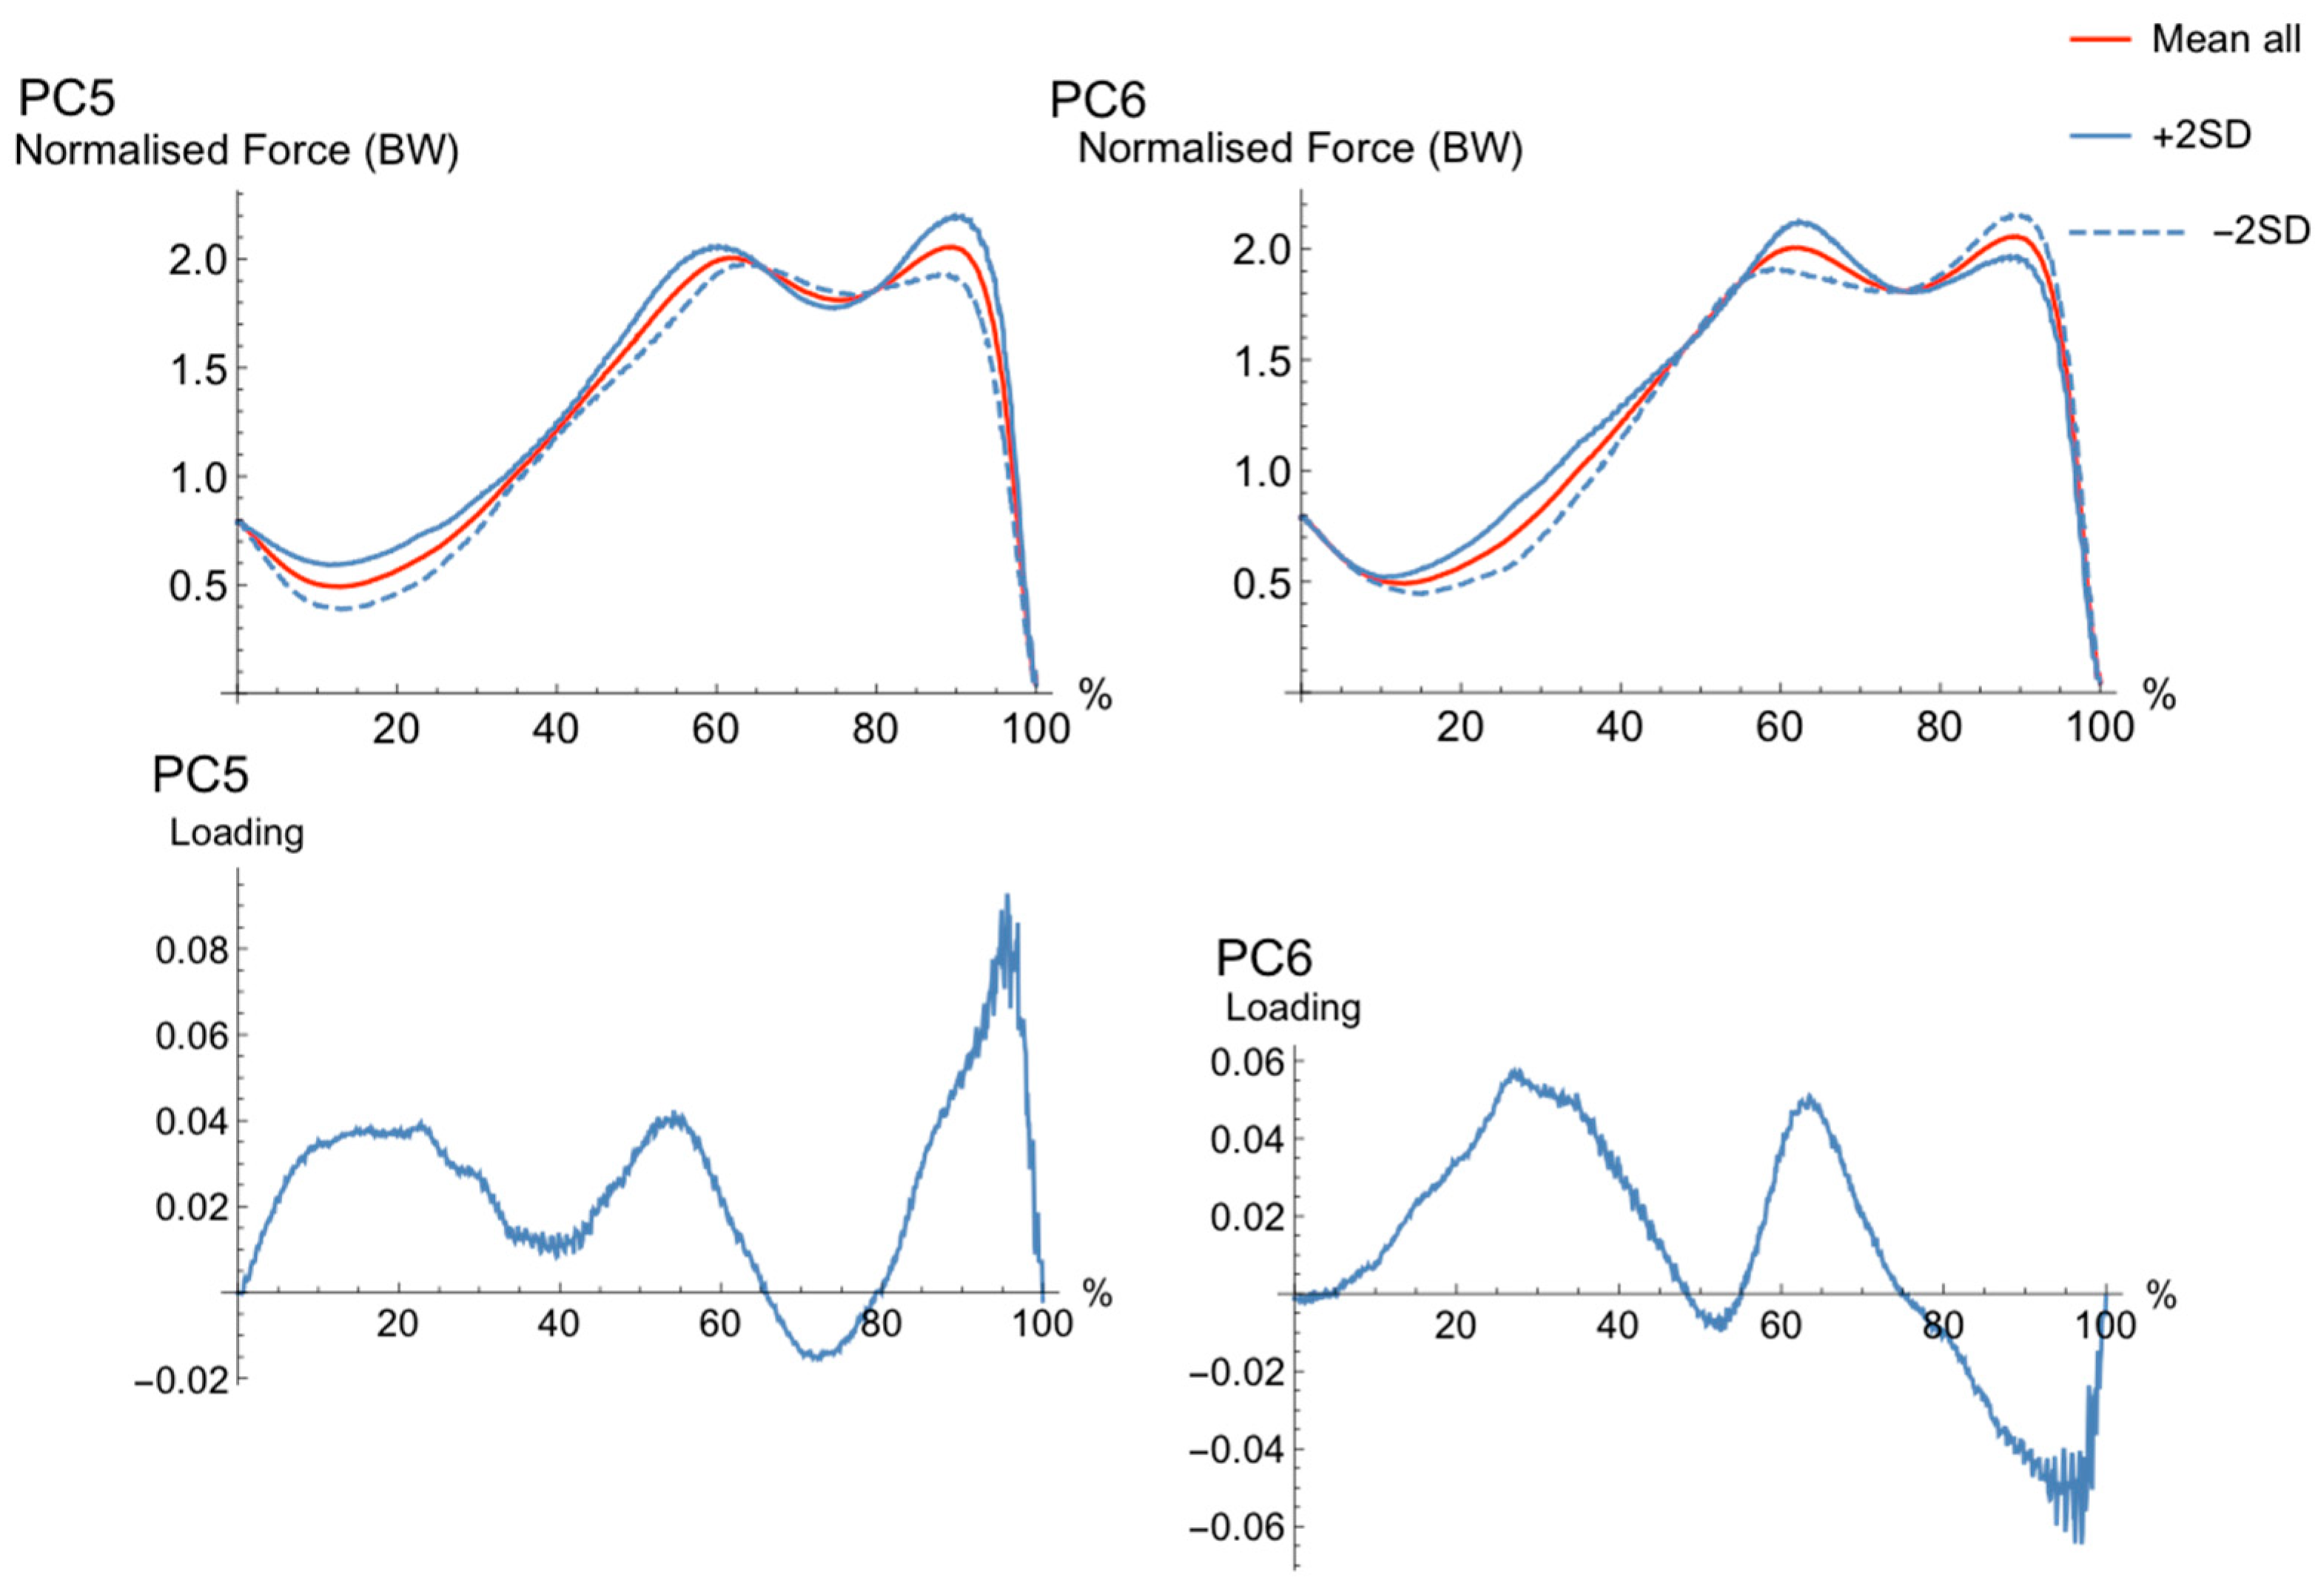
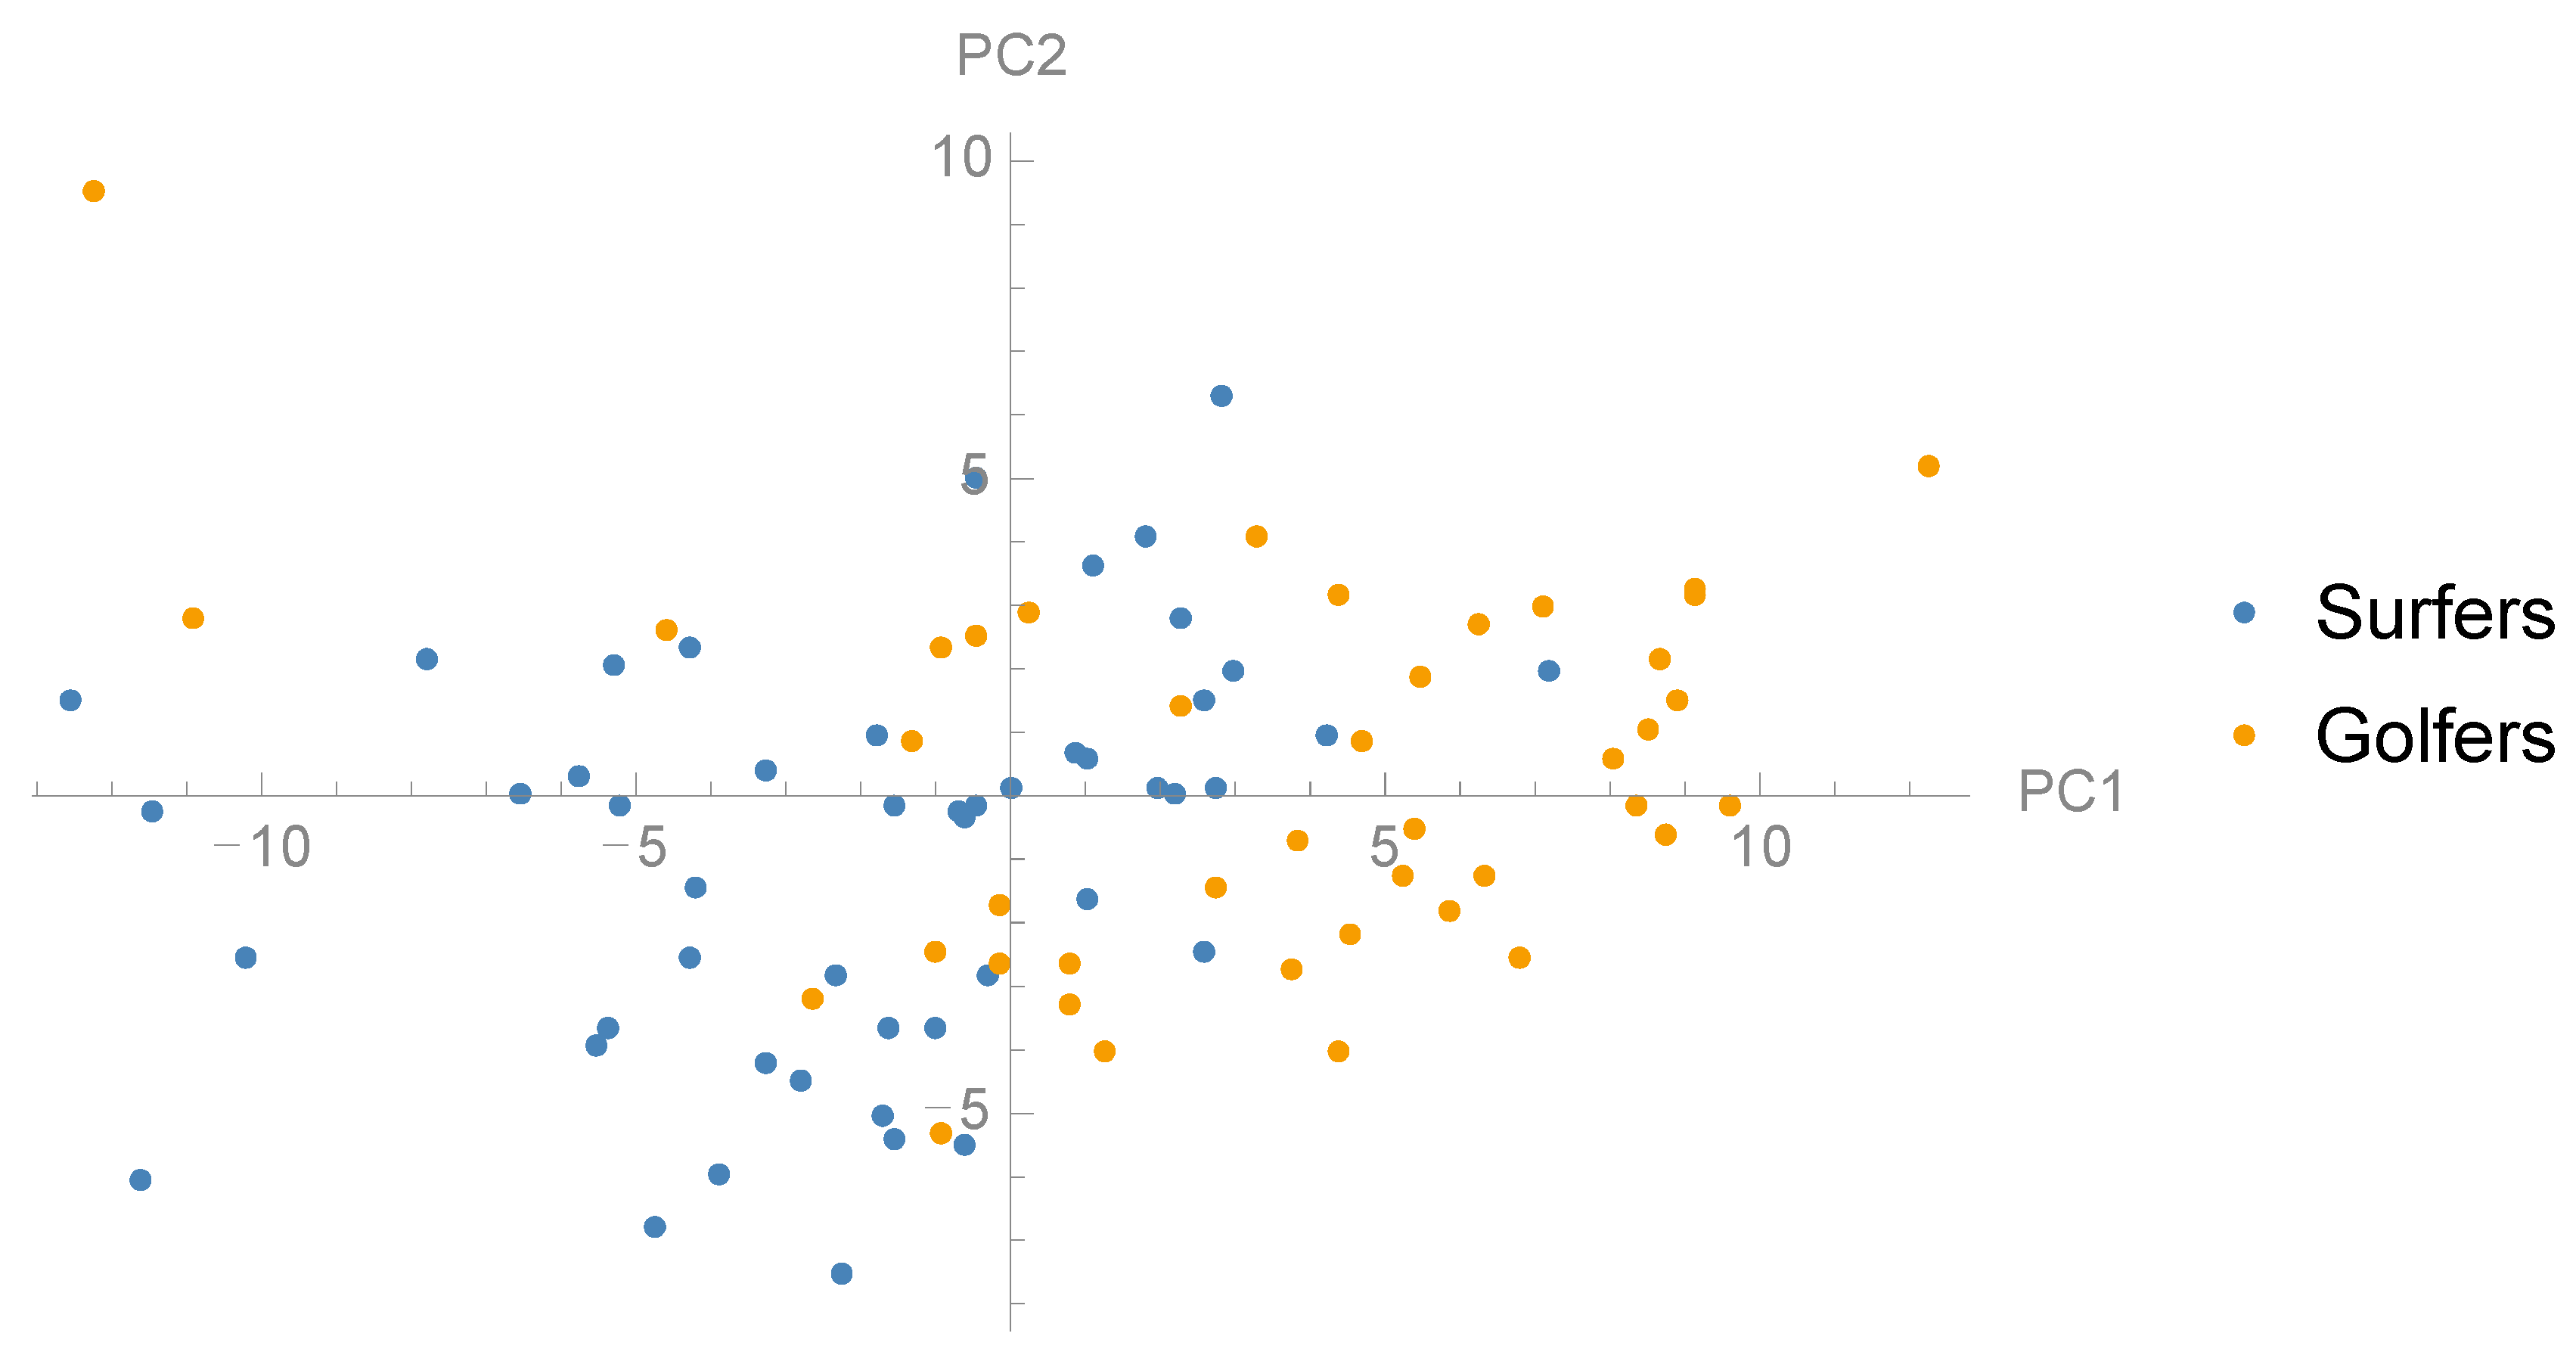
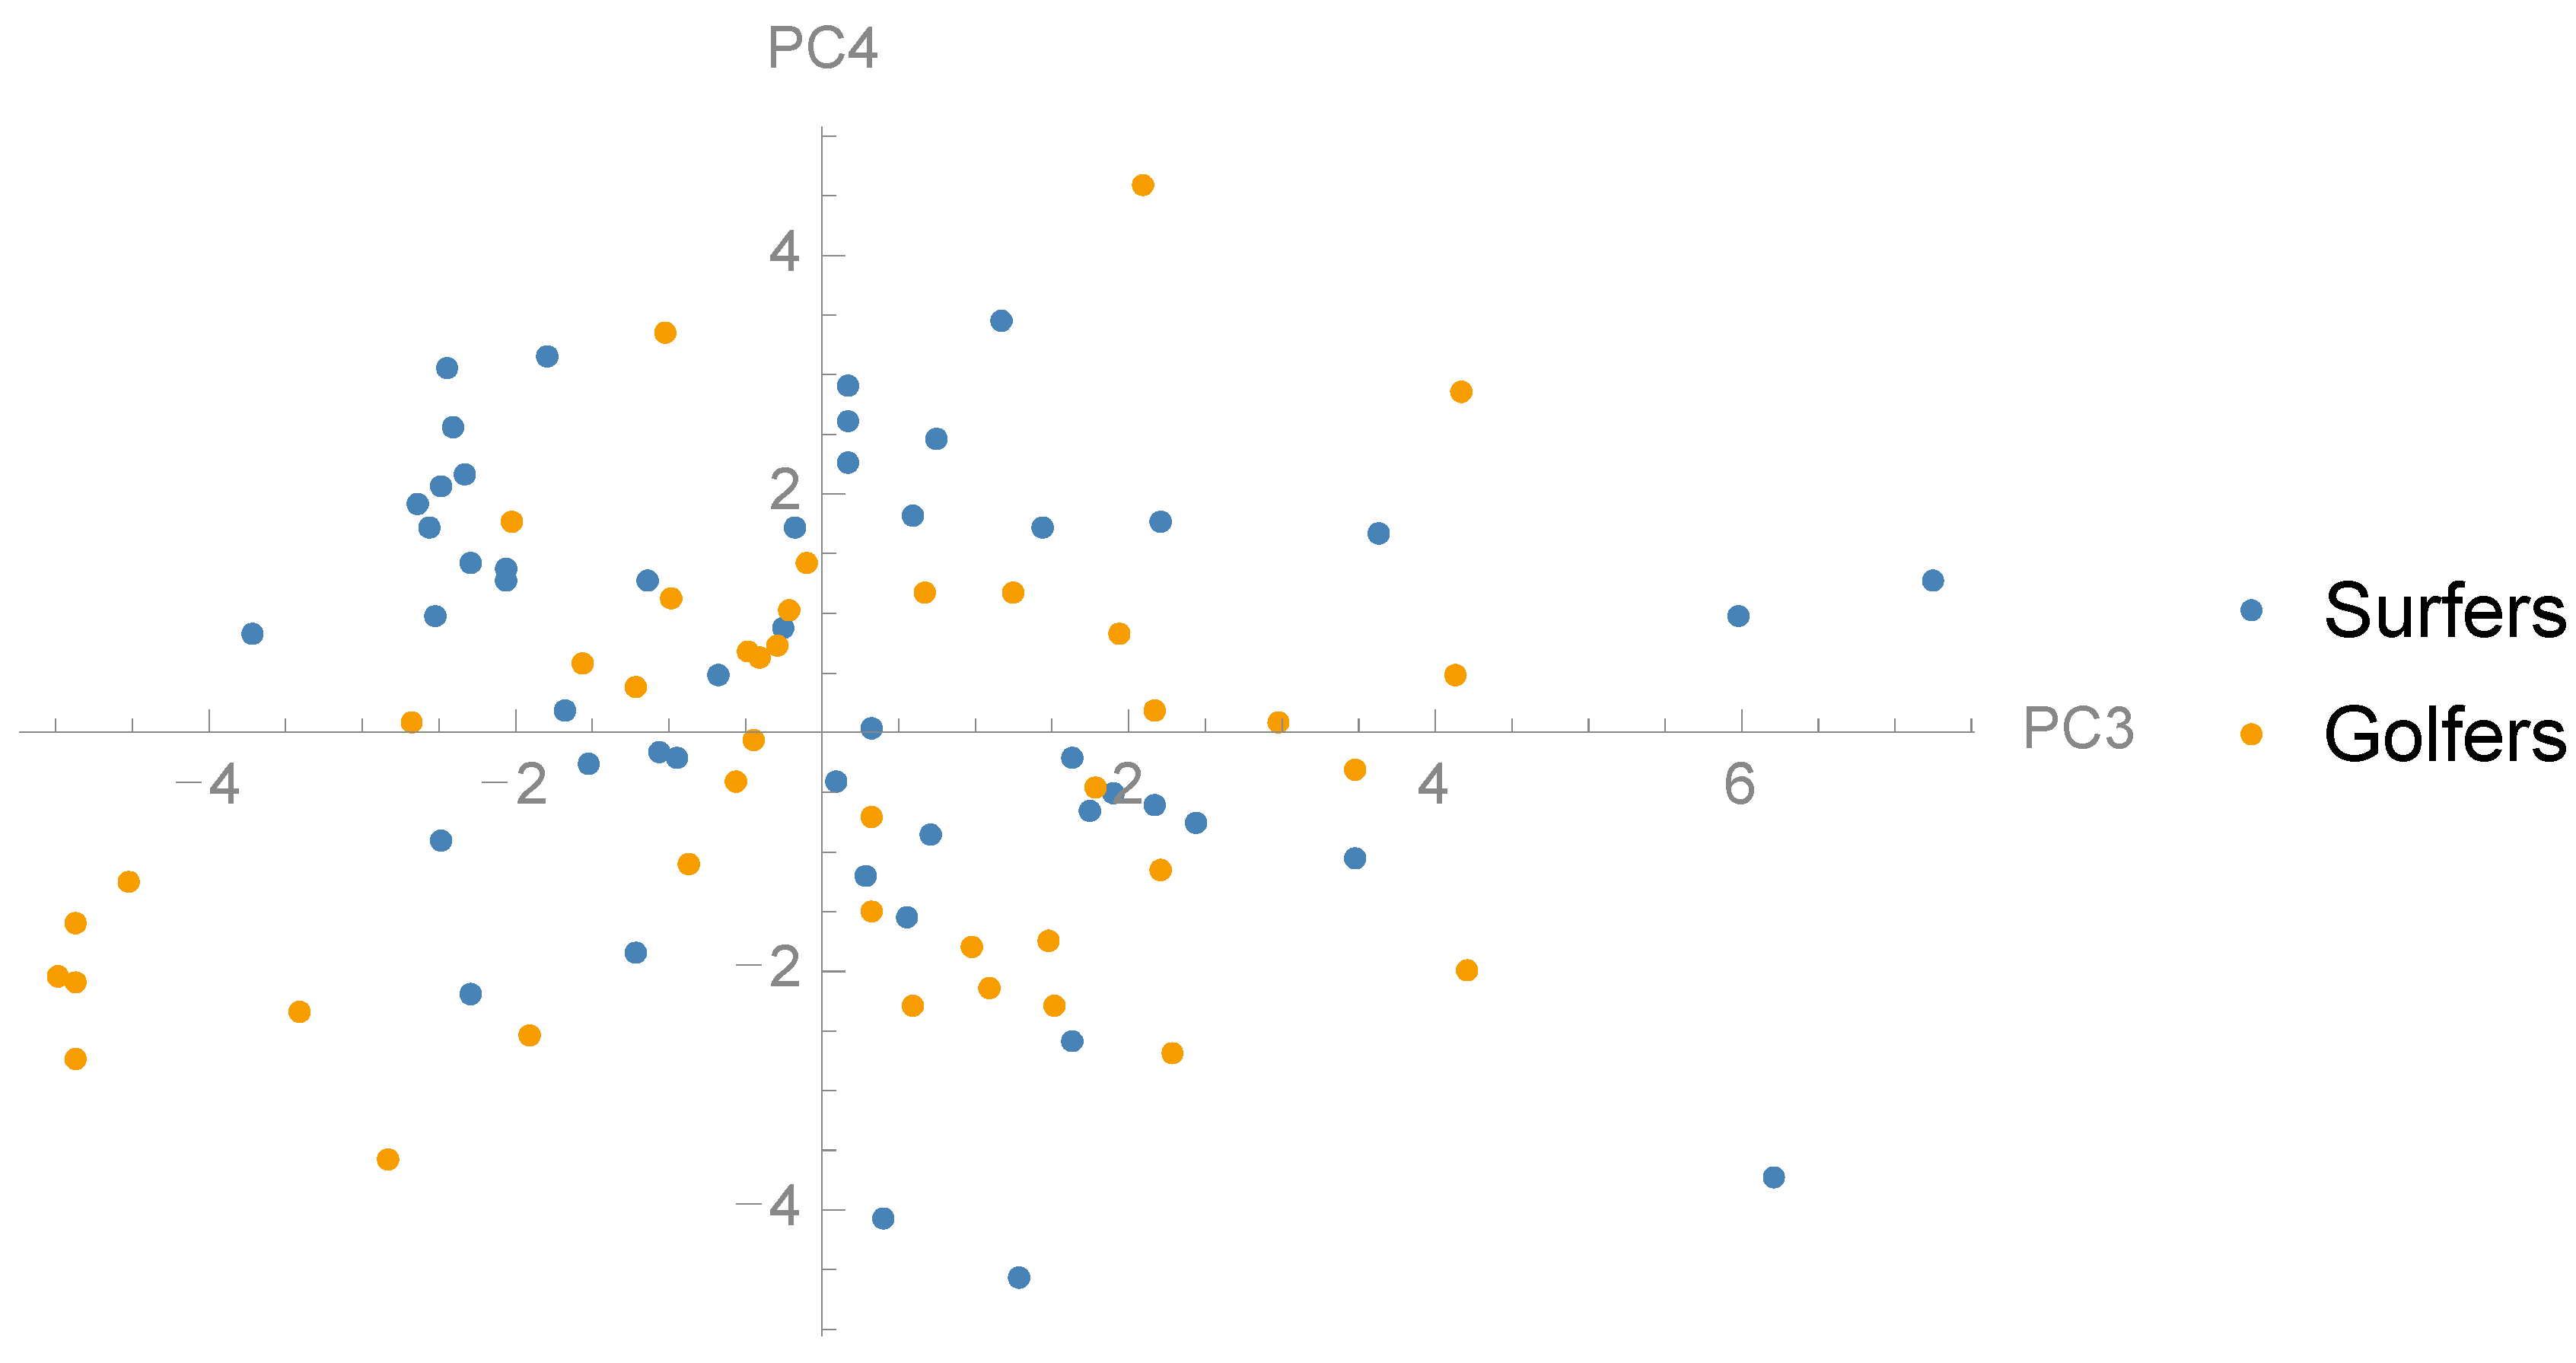
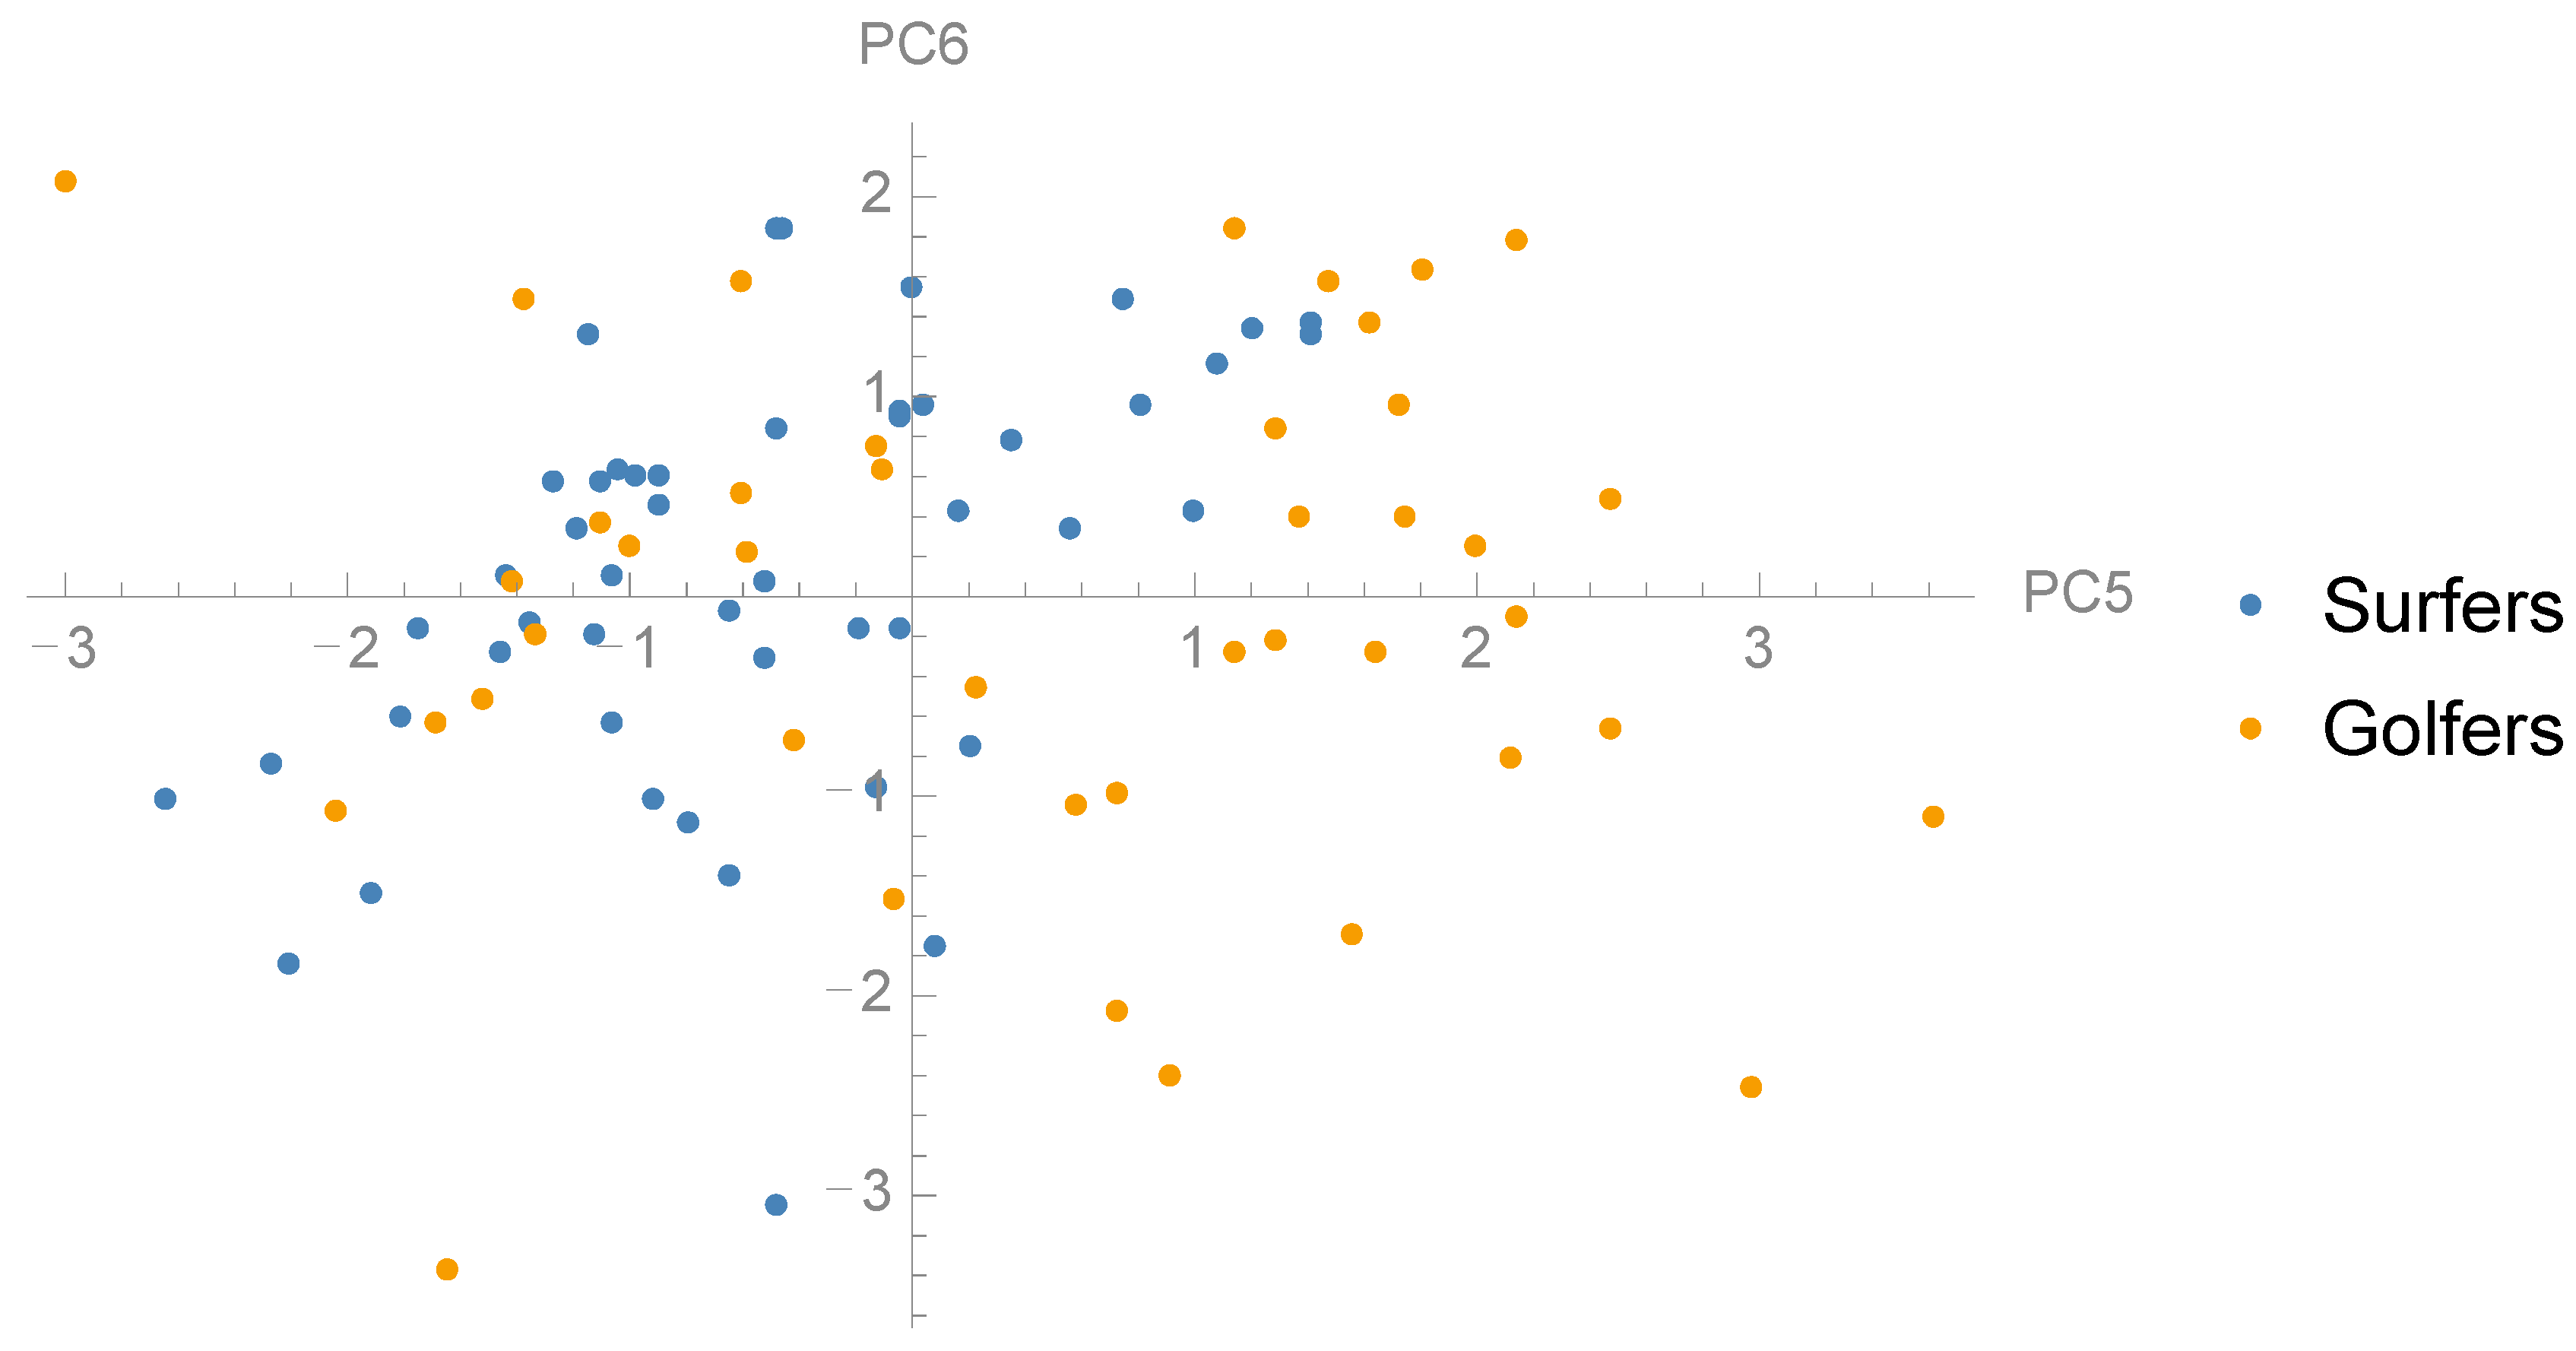
3.1. Principal Component Analysis
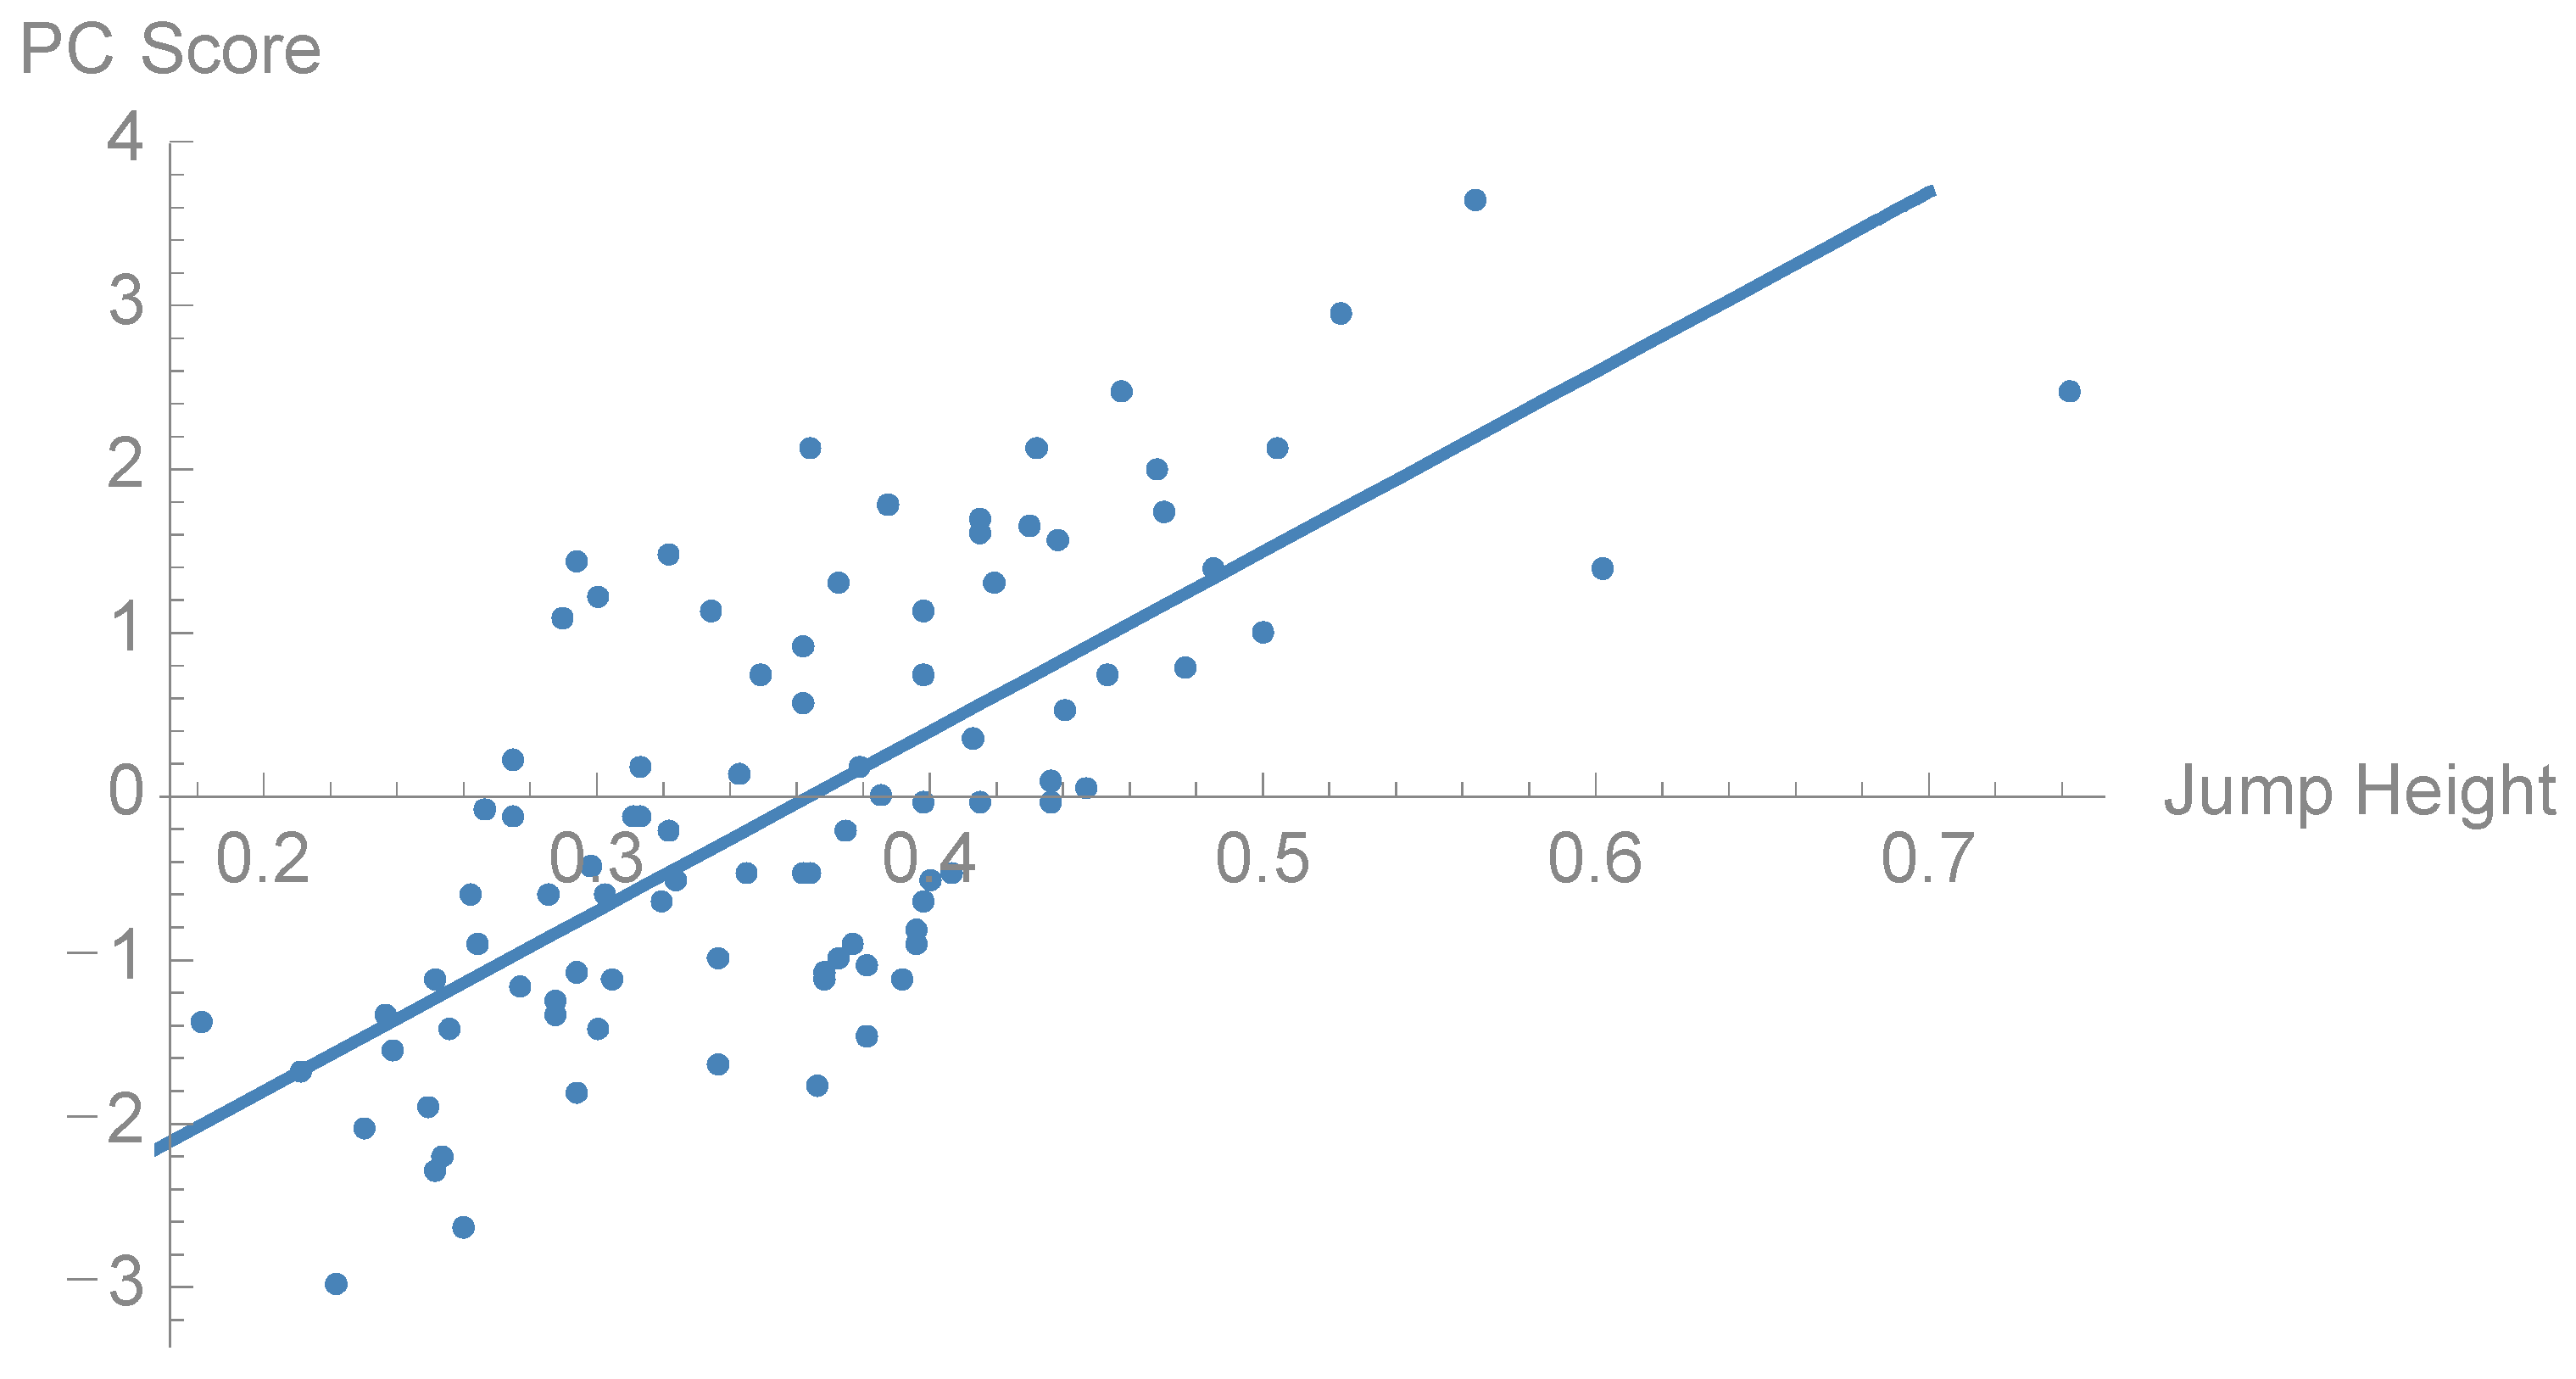
3.2. Comparison between Groups and Correlation with Jump Height
4. Discussion
5. Conclusions
Author Contributions
Funding
Acknowledgments
Conflicts of Interest
References
- Secomb, J.L.; Farley, O.R.; Lundgren, L.; Tran, T.T.; King, A.; Nimphius, S.; Sheppard, J.M. Associations between the performance of scoring manoeuvres and lower-body strength and power in elite surfers. Int. J. Sports Sci. Coach. 2015, 10, 911–918. [Google Scholar] [CrossRef]
- Tran, T.T.; Lundgren, L.; Secomb, J.; Farley, O.R.; Haff, G.G.; Seitz, L.B.; Sheppard, J.M. Comparison of physical capacities between nonselected and selected elite male competitive surfers for the National Junior Team. Int. J. Sports Physiol. Perform. 2015, 10, 178–182. [Google Scholar] [CrossRef] [PubMed]
- Torres-Ronda, L.; Sánchez-Medina, L.; González-Badillo, J.J. Muscle strength and golf performance: A critical review. J Sports Sci. Med. 2011, 10, 9–18. [Google Scholar] [PubMed]
- Hellström, J. The Relation between Physical Tests, Measures, and Clubhead Speed in Elite Golfers. Int. J. Sports Sci. Coach. 2008, 3, 85–92. [Google Scholar] [CrossRef]
- Read, P.J.; Lloyd, R.S.; De Ste Croix, M.; Oliver, J.L. Relationships between field-based measures of strength and power and golf club head speed. J. Strength Cond. Res. 2013, 27, 2708–2713. [Google Scholar] [CrossRef] [PubMed]
- Wells, J.E.; Mitchell, A.C.; Charalambous, L.H.; Fletcher, I.M. Relationships between highly skilled golfers’ clubhead velocity and force producing capabilities during vertical jumps and an isometric mid-thigh pull. J. Sports Sci. 2018, 36, 1–5. [Google Scholar] [CrossRef] [PubMed]
- Driggers, A.R.; Sato, K. The effects of vertically oriented resistance training on golf drive performance in collegiate golfers. Int. J. Sports Sci. Coach. 2017, 13, 598–606. [Google Scholar] [CrossRef]
- Read, P.J.; Miller, S.C.; Turner, A.N. The effects of postactivation potentiation on golf club head speed. J. Strength Cond. Res. 2013, 27, 1579–1582. [Google Scholar] [CrossRef]
- Parker, J.; Lagerhem, C.; Hellström, J.; Olsson, M.C. Effects of nine weeks isokinetic training on power, golf kinematics, and driver performance in pre-elite golfers. BMC Sports Sci. Med. Rehabil. 2017, 9, 21. [Google Scholar] [CrossRef]
- Wells, G.D.; Elmi, M.; Thomas, S. Physiological Correlates of Golf Performance. J. Strength Cond. Res. 2009, 23, 741–750. [Google Scholar] [CrossRef]
- McMahon, J.J.; Suchomel, T.J.; Lake, J.P.; Comfort, P. Understanding the key phases of the countermovement jump force-time curve. Strength Cond. J. 2018, 40, 96–106. [Google Scholar] [CrossRef]
- Leary, B.K.; Statler, J.; Hopkins, B.; Fitzwater, R.; Kesling, T.; Lyon, J.; Haff, G. The relationship between isometric force-time curve characteristics and club head speed in recreational golfers. J. Strength Cond. Res. 2012, 26, 2685–2697. [Google Scholar] [CrossRef] [PubMed]
- Warmenhoven, J.; Harrison, A.; Robinson, M.A.; Vanrenterghem, J.; Bargary, N.; Smith, R.; Pataky, T. A force profile analysis comparison between functional data analysis, statistical parametric mapping and statistical non-parametric mapping in on-water single sculling. J. Sci. Med. Sport 2018, 18, 1100–1105. [Google Scholar] [CrossRef] [PubMed]
- O’connor, K.M.; Bottum, M.C. Differences in cutting knee mechanics based on principal components analysis. Med. Sci. Sports Exerc. 2009, 41, 867–878. [Google Scholar] [CrossRef]
- McMahon, J.J.; Rej, S.J.; Comfort, P. Sex differences in countermovement jump phase characteristics. Sports 2017, 5, 8. [Google Scholar] [CrossRef] [PubMed]
- Colyer, S.L.; Nagahara, R.; Salo, A.I. Kinetic demands of sprinting shift across the acceleration phase: Novel analysis of entire force waveforms. Scand. J. Med. Sci. Sports 2018, 28, 1784–1792. [Google Scholar] [CrossRef] [PubMed]
- McMahon, J.J.; Murphy, S.; Rej, S.J.; Comfort, P. Countermovement-jump-phase characteristics of senior and academy rugby league players. Int. J. Sports Physiol. Perf. 2017, 12, 803–811. [Google Scholar] [CrossRef]
- Nimphius, S.; McGuigan, M.R.; Suchomel, T.J.; Newton, R.U. Variability of a “force signature” during windmill softball pitching and relationship between discrete force variables and pitch velocity. Hum. Mov. Sci. 2016, 47, 151–158. [Google Scholar] [CrossRef]
- Brandon, S.C.; Graham, R.B.; Almosnino, S.; Sadler, E.M.; Stevenson, J.M.; Deluzio, K.J. Interpreting principal components in biomechanics: Representative extremes and single component reconstruction. J. Electromyogr. Kinesiol. 2013, 23, 1304–1310. [Google Scholar] [CrossRef]
- Deluzio, K.J.; Astephen, J.L. Biomechanical features of gait waveform data associated with knee osteoarthritis: An application of principal component analysis. Gait Posture 2007, 25, 86–93. [Google Scholar] [CrossRef]
- Linthorne, N.P. Analysis of standing vertical jumps using a force platform. Am. J. Phys. 2001, 69, 1198–1204. [Google Scholar] [CrossRef]
- Cohen, J. Statistical Power Analysis for the Behavioral Sciences, 2nd ed.; Erlbaum: Hilllsdale, NJ, USA, 1988. [Google Scholar]
- Mizuguchi, S.; Sands, W.A.; Wassinger, C.A.; Lamont, H.S.; Stone, M.H. A new approach to determining net impulse and identification of its characteristics in countermovement jumping: Reliability and validity. Sports Biomech. 2015, 14, 258–272. [Google Scholar] [CrossRef] [PubMed]
- Cormie, P.; McBride, J.M.; McCaulley, G.O. Power-time, force-time, and velocity-time curve analysis of the countermovement jump: Impact of training. J. Strength Cond. Res. 2009, 23, 177–186. [Google Scholar] [CrossRef] [PubMed]
- Cormie, P.; McGuigan, M.R.; Newton, R.U. Changes in the eccentric phase contribute to improved stretch-shorten cycle performance after training. Med. Sci. Sports Exerc. 2010, 42, 1731–1744. [Google Scholar] [CrossRef] [PubMed]
- Kibele, A. Possibilities and limitations in the biomechanical analysis of countermovement jumps: A methodological study. J. Appl. Biomech. 1998, 14, 105–117. [Google Scholar] [CrossRef]
- Kennedy, R.A.; Drake, D. Is a Bimodal Force-Time Curve Related to Countermovement Jump Performance? Sports 2018, 6, 36. [Google Scholar] [CrossRef] [PubMed]


| PC | Explained Variance (%) | R2 to Jump Height | Mean (±SD) Surfers | Mean (±SD) Golfers | p-Value |
|---|---|---|---|---|---|
| 1 | 10.4 | 0.04 | −1.99 (±4.23) | 2.06 (±6.54) | 0.001 |
| 2 | 10.4 | 0.01 | −0.89 (±3.18) | 0.81 (±3.43) | 0.014 |
| 3 | 3.7 | 0.02 | 0.12 (±2.43) | 0.01 (±2.49) | 0.830 |
| 4 | 3.7 | 0.10 ** | 0.45 (±1.89) | −0.40 (±1.80) | 0.027 |
| 5 | 3.7 | 0.52 ** | −0.53 (±0.97) | 0.57 (±1.61) | 0.001 |
| 6 | 2.7 | 0.01 | 0.12 (±1.05) | −0.16 (±1.31) | 0.247 |
© 2018 by the authors. Licensee MDPI, Basel, Switzerland. This article is an open access article distributed under the terms and conditions of the Creative Commons Attribution (CC BY) license (http://creativecommons.org/licenses/by/4.0/).
Share and Cite
Parker, J.; Lundgren, L.E. Surfing the Waves of the CMJ; Are There between-Sport Differences in the Waveform Data? Sports 2018, 6, 168. https://doi.org/10.3390/sports6040168
Parker J, Lundgren LE. Surfing the Waves of the CMJ; Are There between-Sport Differences in the Waveform Data? Sports. 2018; 6(4):168. https://doi.org/10.3390/sports6040168
Chicago/Turabian StyleParker, James, and Lina E. Lundgren. 2018. "Surfing the Waves of the CMJ; Are There between-Sport Differences in the Waveform Data?" Sports 6, no. 4: 168. https://doi.org/10.3390/sports6040168
APA StyleParker, J., & Lundgren, L. E. (2018). Surfing the Waves of the CMJ; Are There between-Sport Differences in the Waveform Data? Sports, 6(4), 168. https://doi.org/10.3390/sports6040168