Article

Individual Responses for Muscle Activation, Repetitions, and Volume during Three Sets to Failure of High- (80% 1RM) versus Low-Load (30% 1RM) Forearm Flexion Resistance Exercise

1
Department of Nutrition and Health Sciences, 211 Ruth Leverton Hall, University of Nebraska-Lincoln, Lincoln, NE 68583, USA
2
Department of Health, Exercise Science, and Recreation Management, University of Mississippi, Oxford, MS 38677, USA
3
Department of Kinesiology and Health Promotion, University of Kentucky, Lexington, KY 40506-0219, USA
*
Author to whom correspondence should be addressed.
Sports 2015, 3(4), 269-280; https://doi.org/10.3390/sports3040269
Submission received: 18 August 2015 / Accepted: 22 September 2015 / Published: 25 September 2015
(This article belongs to the Special Issue Strength and Conditioning)

Abstract

:
This study compared electromyographic (EMG) amplitude, the number of repetitions completed, and exercise volume during three sets to failure of high- (80% 1RM) versus low-load (30% 1RM) forearm flexion resistance exercise on a subject-by-subject basis. Fifteen men were familiarized, completed forearm flexion 1RM testing. Forty-eight to 72 h later, the subjects completed three sets to failure of dumbbell forearm flexion resistance exercise with 80% (n = 8) or 30% (n = 7) 1RM. EMG amplitude was calculated for every repetition, and the number of repetitions performed and exercise volume were recorded. During sets 1, 2, and 3, one of eight subjects in the 80% 1RM group demonstrated a significant linear relationship for EMG amplitude versus repetition. For the 30% 1RM group, seven, five, and four of seven subjects demonstrated significant linear relationships during sets 1, 2, and 3, respectively. The mean EMG amplitude responses show that the fatigue-induced increases in EMG amplitude for the 30% 1RM group and no change in EMG amplitude for the 80% 1RM group resulted in similar levels of muscle activation in both groups. The numbers of repetitions completed were comparatively greater, while exercise volumes were similar in the 30% versus 80% 1RM group. Our results, in conjunction with those of previous studies in the leg extensors, suggest that there may be muscle specific differences in the responses to high- versus low-load exercise.

1. Introduction

The current American College of Sports Medicine [1] and National Strength and Conditioning Association [2] guidelines recommend the utilization of resistance exercise loads corresponding to 60%–80% and 67%–85% of one repetition maximum (1RM), respectively, to maximize muscle hypertrophy. However, recent studies have challenged these recommendations [3,4,5]. For example, Burd et al. [3] demonstrated that acute resistance exercise performed to failure at 30% 1RM resulted in similar magnitudes of muscle protein synthesis and anabolic signaling as resistance exercise at 90% 1RM. In a follow-up study, Mitchell et al. [4] demonstrated that 10 weeks of leg extension resistance training to failure at 80% 1RM versus 30% 1RM resulted in comparable muscle hypertrophy. Similarly, Ogasawara et al. [5] showed that six weeks of bench press resistance training at 80% 1RM caused muscle hypertrophy equivalent to that observed after training at 30% 1RM. Therefore, the disparity between current resistance training recommendations and recent experimental results [3,4,5] has sparked a debate [6,7] regarding the most effective loads to prescribe to enhance muscle size with resistance training.
It has been suggested [8] that the recommendation of high-load resistance training (i.e., ≥60% 1RM) to maximize muscle strength and hypertrophy is based on Henneman’s size principle [9], which states that the recruitment of high-threshold motor units is dependent on the intensity of the stimulus [9]. Theoretically, therefore, motor unit recruitment is greater during resistance exercise at 80% 1RM than at 30% 1RM. While this may hold true for a single repetition in unfatigued muscle, the performance of submaximal contractions to volitional exhaustion may evoke the recruitment of additional motor units [10]. Accordingly, Burd et al. hypothesized that the similar acute increases in muscle protein synthesis and similar chronic muscle hypertrophy following low-load resistance training may be due to achieving “a similar degree of muscle fiber activation to that of high-intensity resistance exercise regimes.” [11] (pp. 552–553). Burd et al. also suggested that the volume of exercise is “related to the degree of (muscle) fiber activation.” [3] (pp. 7–8). However, while studies have examined muscle activation [12,13,14,15] and exercise volume [12] during high- versus low-load leg extension resistance exercise, we are unaware of previous studies that have compared muscle activation or exercise volume during high- versus low-load forearm flexion (i.e., biceps curl) resistance exercise. Therefore, the purpose of this study was to compare electromyographic (EMG) amplitude, the number of repetitions completed, and exercise volume during three sets to failure of high- (80% 1RM) versus low-load (30% 1RM) forearm flexion resistance exercise on a subject-by-subject basis.

2. Materials and Methods

2.1. Subjects

Fifteen men (mean ± SD; age = 21.7 ± 2.4 years; height = 181.6 ± 7.5 cm; weight = 84.7 ± 23.5 kg) completed this study. Prior to any data collection, all subjects signed an informed consent form and completed a health history questionnaire. To be eligible, each participant must have been between the ages of 19 and 29, free from any current or ongoing musculoskeletal injuries or neuromuscular disorders involving the shoulders, elbows, or wrists, and could not have completed any regular or formal resistance training for at least six months prior to the start of the study. This study was approved by the university’s Institutional Review Board for the protection of human subjects (IRB Approval #: 20140314046FB).

2.2. Experimental Design

A between-subjects design was utilized for this study, which consisted of three visits to the laboratory. During visits 1 and 2, subjects were familiarized with the exercises and procedures and forearm flexion (i.e., biceps curl) 1RM was determined. The subjects were then randomized to either a high-load (80% 1RM; n = 8) or a low-load (30% 1RM; n = 7) resistance exercise group before returning to the laboratory 48 to 72 h later. During visit 3, subjects completed three sets to failure of bilateral dumbbell forearm flexion (e.g., biceps curl) resistance exercise with their assigned load. Each laboratory visit occurred at the same time of day (±2 h).

2.3. One Repetition Maximum

1RM testing was carried out according to the guidelines established by the National Strength and Conditioning Association [2]. Specifically, the subjects performed a light warm-up set with 5–10 repetitions at 50% of estimated 1RM, followed by 2–3 heavier warm-up sets of 2–5 repetitions with loads increasing by 10%–20% at each set. Subjects then began completing trials of 1 repetition with increasing loads (10%–20%) until they were no longer able to complete a single repetition. The highest load (kg) successfully lifted through the entire range of motion with the right arm with proper technique was denoted as the 1RM, which was determined in ≤4 trials for all subjects. Two to four min of rest were allowed between successive warm-up sets and 1RM trials. EMG and electrogoniometer signals were recorded from the right arm during the 1RM attempts.

2.4. Resistance Exercise

Subjects completed 3 sets of dumbbell forearm flexion resistance exercise to failure with loads corresponding (to the nearest 1.1 kg) to either 80% or 30% of 1RM. The subjects stood with their backs against a wall and their elbows supported by a brace (Bicep Bomber, Body Solid, Inc., Forest Park, IL, USA) to eliminate swinging of the torso or arms. Subjects were instructed to perform all repetitions through a complete range of motion. A metronome (Pro Metronome, EUMLab, Berlin, Germany) was set to 1 Hz, and participants were instructed to perform the concentric and eccentric phases corresponding with each tick of the metronome so that the concentric and eccentric phases were approximately 1 s. Verbal instruction and encouragement were provided during each set. Failure was defined as the inability to complete another concentric muscle action through the full range of motion. Two minutes of rest was provided between all sets for both groups. EMG and electrogoniometer signals were recorded from the right arm during all sets. In addition, the number of repetitions completed during each set was recorded and exercise volume was calculated as the product of the load (kg) and the number of repetitions completed during each set, summed across sets.

2.5. Electromyography

Pre-gelled bipolar surface electrodes (Ag/AgCl, AccuSensor, Lynn Medical, Wixom, MI, USA) were placed on the biceps brachii (BB) muscle of the right arm with an inter-electrode distance of 30 mm. The center of the bipolar electrode pair was placed at 33% of the distance between the fossa cubit and the medial acromion process [16]. A single pre-gelled surface electrode (Ag/AgCl, AccuSensor, Lynn Medical, Wixom, MI, USA) was placed on the lateral epicondyle of the humerus to serve as the reference electrode. To reduce inter-electrode impedance and increase the signal-to-noise ratio [17], local areas of the skin were shaved, abraded, and cleaned with isopropyl alcohol prior to the placement of the electrodes. Interelectrode impedance was kept below 2000 Ω [17].

2.6. Signal Processing

The EMG and goniometer signals were sampled at 2 kHz (MP150WSW, Biopac Systems, Inc., Santa Barbara, CA, USA), recorded on a personal computer, and processed off-line with custom software (Labview 12.0, National Instruments, Austin, TX, USA). The EMG signals were amplified (gain 1000) using a differential amplifier (EMG 100, Biopac Systems, Inc., Santa Barbara, CA, USA, bandwidth 1–5000 Hz) with a common mode rejection ratio of 110 dB min and an impedance of 2M Ω, digitally filtered (zero-phase shift 4th-order Butterworth filter) with a band-pass of 10–499 Hz, and rectified. The electrogoniometer signals were low-pass filtered (zero-phase shift 4th-order Butterworth filter) with a 15 Hz cutoff. The EMG amplitude was calculated as the time-averaged, integrated amplitude value (µV·s−1). EMG amplitude was quantified during the same 70° concentric portion of each repetition during each set, and then normalized to 1RM (expressed % 1RM). In addition, we compared EMG amplitude during the final common repetitions of sets 1, 2, and 3 for the 80% and 30% 1RM groups. The number of repetitions analyzed at the end of each set was established by the minimum number of repetitions achieved by any one subject within each group during sets 1, 2, and 3 (Table 1).

2.7. Statistics

Simple linear regression analyses were used to determine whether the slope coefficients for the individual EMG amplitude versus repetition relationships during sets 1, 2, and 3 were significantly different from zero. A type-I error rate of 5% was considered statistically significant for the linear regression analyses. Where applicable, 95% confidence intervals were calculated using the studentized t-distribution.
Table 1. The number of repetitions completed during sets 1, 2, and 3 and the volume (reps × load) completed across all sets, for each subject, as well as the mean (±95% confidence interval) volume completed for each group.
GroupSubjectRepetitions CompletedIndividual VolumeMean Volume
Set 1Set 2Set 3All sets
80% 1RM11196339.7350.8 ± 72.8
51286294.8
6776344.7
91074190.5
101062367.4
1312118492.2
1415108411.6
181283365.1
30% 1RM2582426269.4382.8 ± 101.4
3372414323.2
4392020308.2
7471615398.0
11541414390.5
12372020384.2
15512820606.2

3. Results

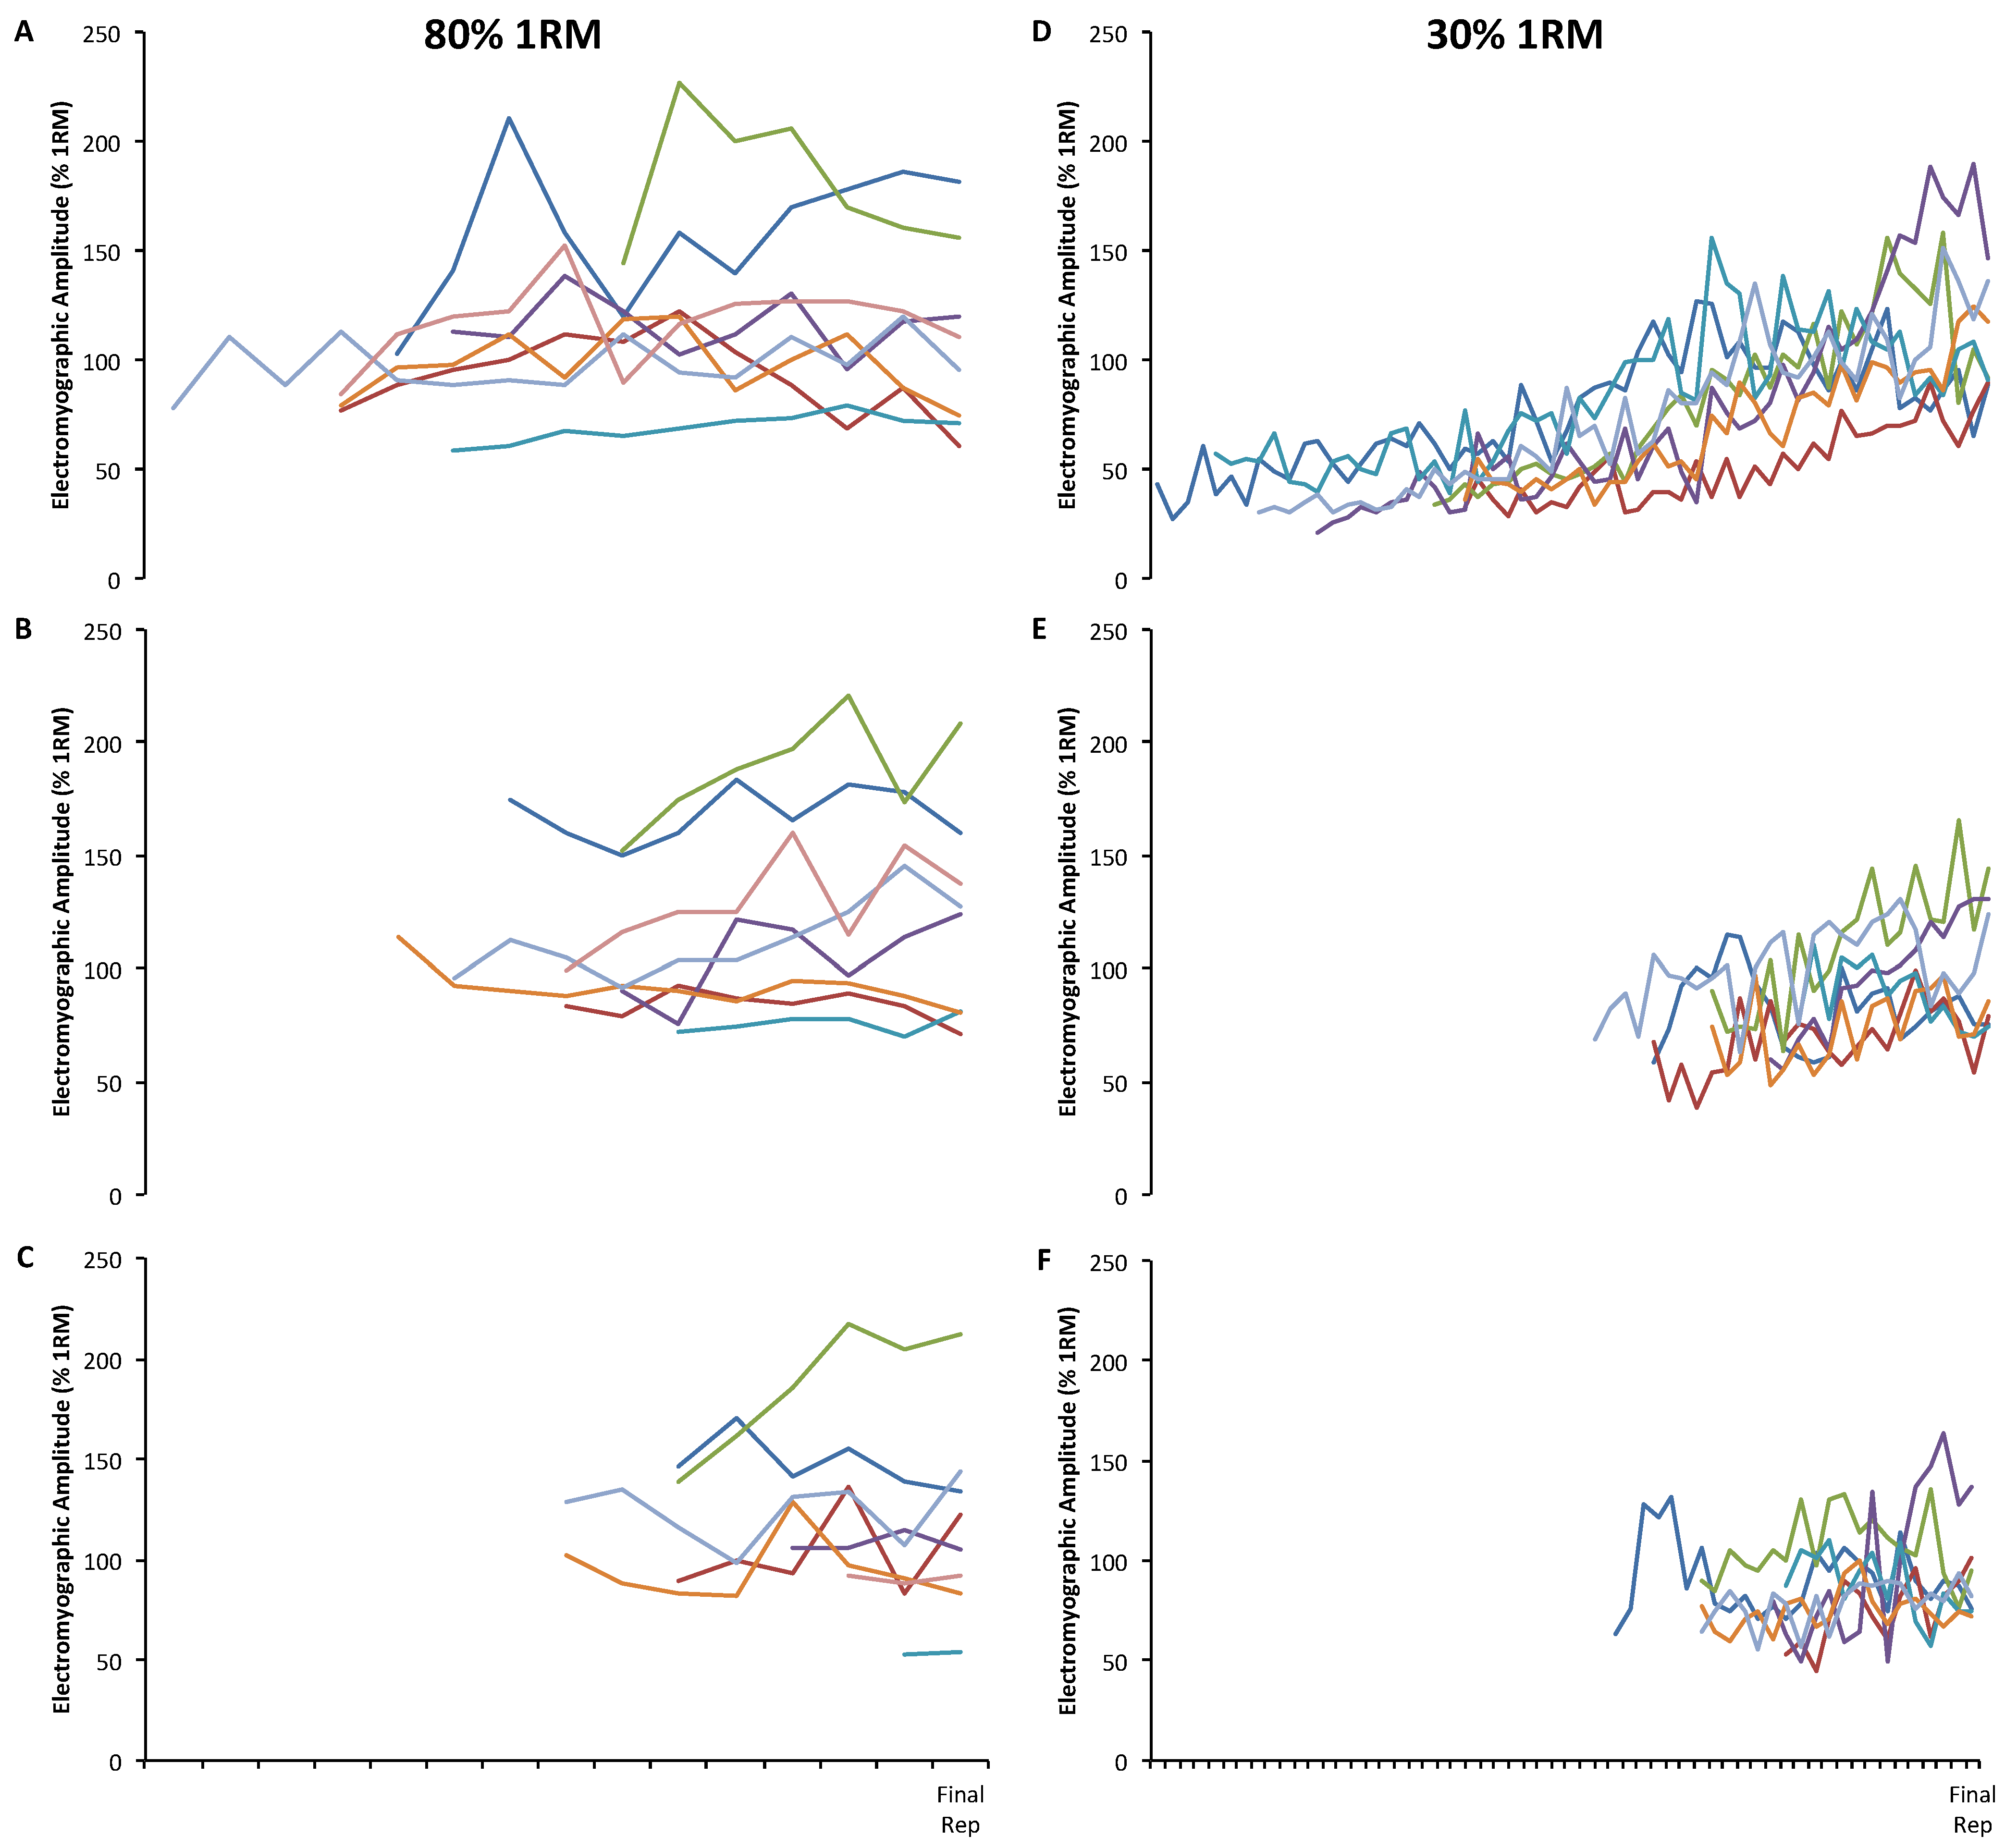
Table 1 displays the number of repetitions completed for each subject during each set, the total volume completed by each subject, and the mean (±95% confidence interval) volume completed by the 80% and 30% 1RM groups. The individual EMG amplitude versus repetition relationships for each subject during sets 1, 2, and 3 are depicted in Figure 1.
The results from the individual simple linear regression analyses for the EMG amplitude versus repetition relationships during sets 1, 2, 3 are depicted in Table 2. During sets 1, 2, and 3, one of eight subjects in the 80% 1RM group demonstrated a significant linear relationship. However, for the 30% 1RM group, seven of seven, five of seven, and four of seven subjects demonstrated significant linear relationships.
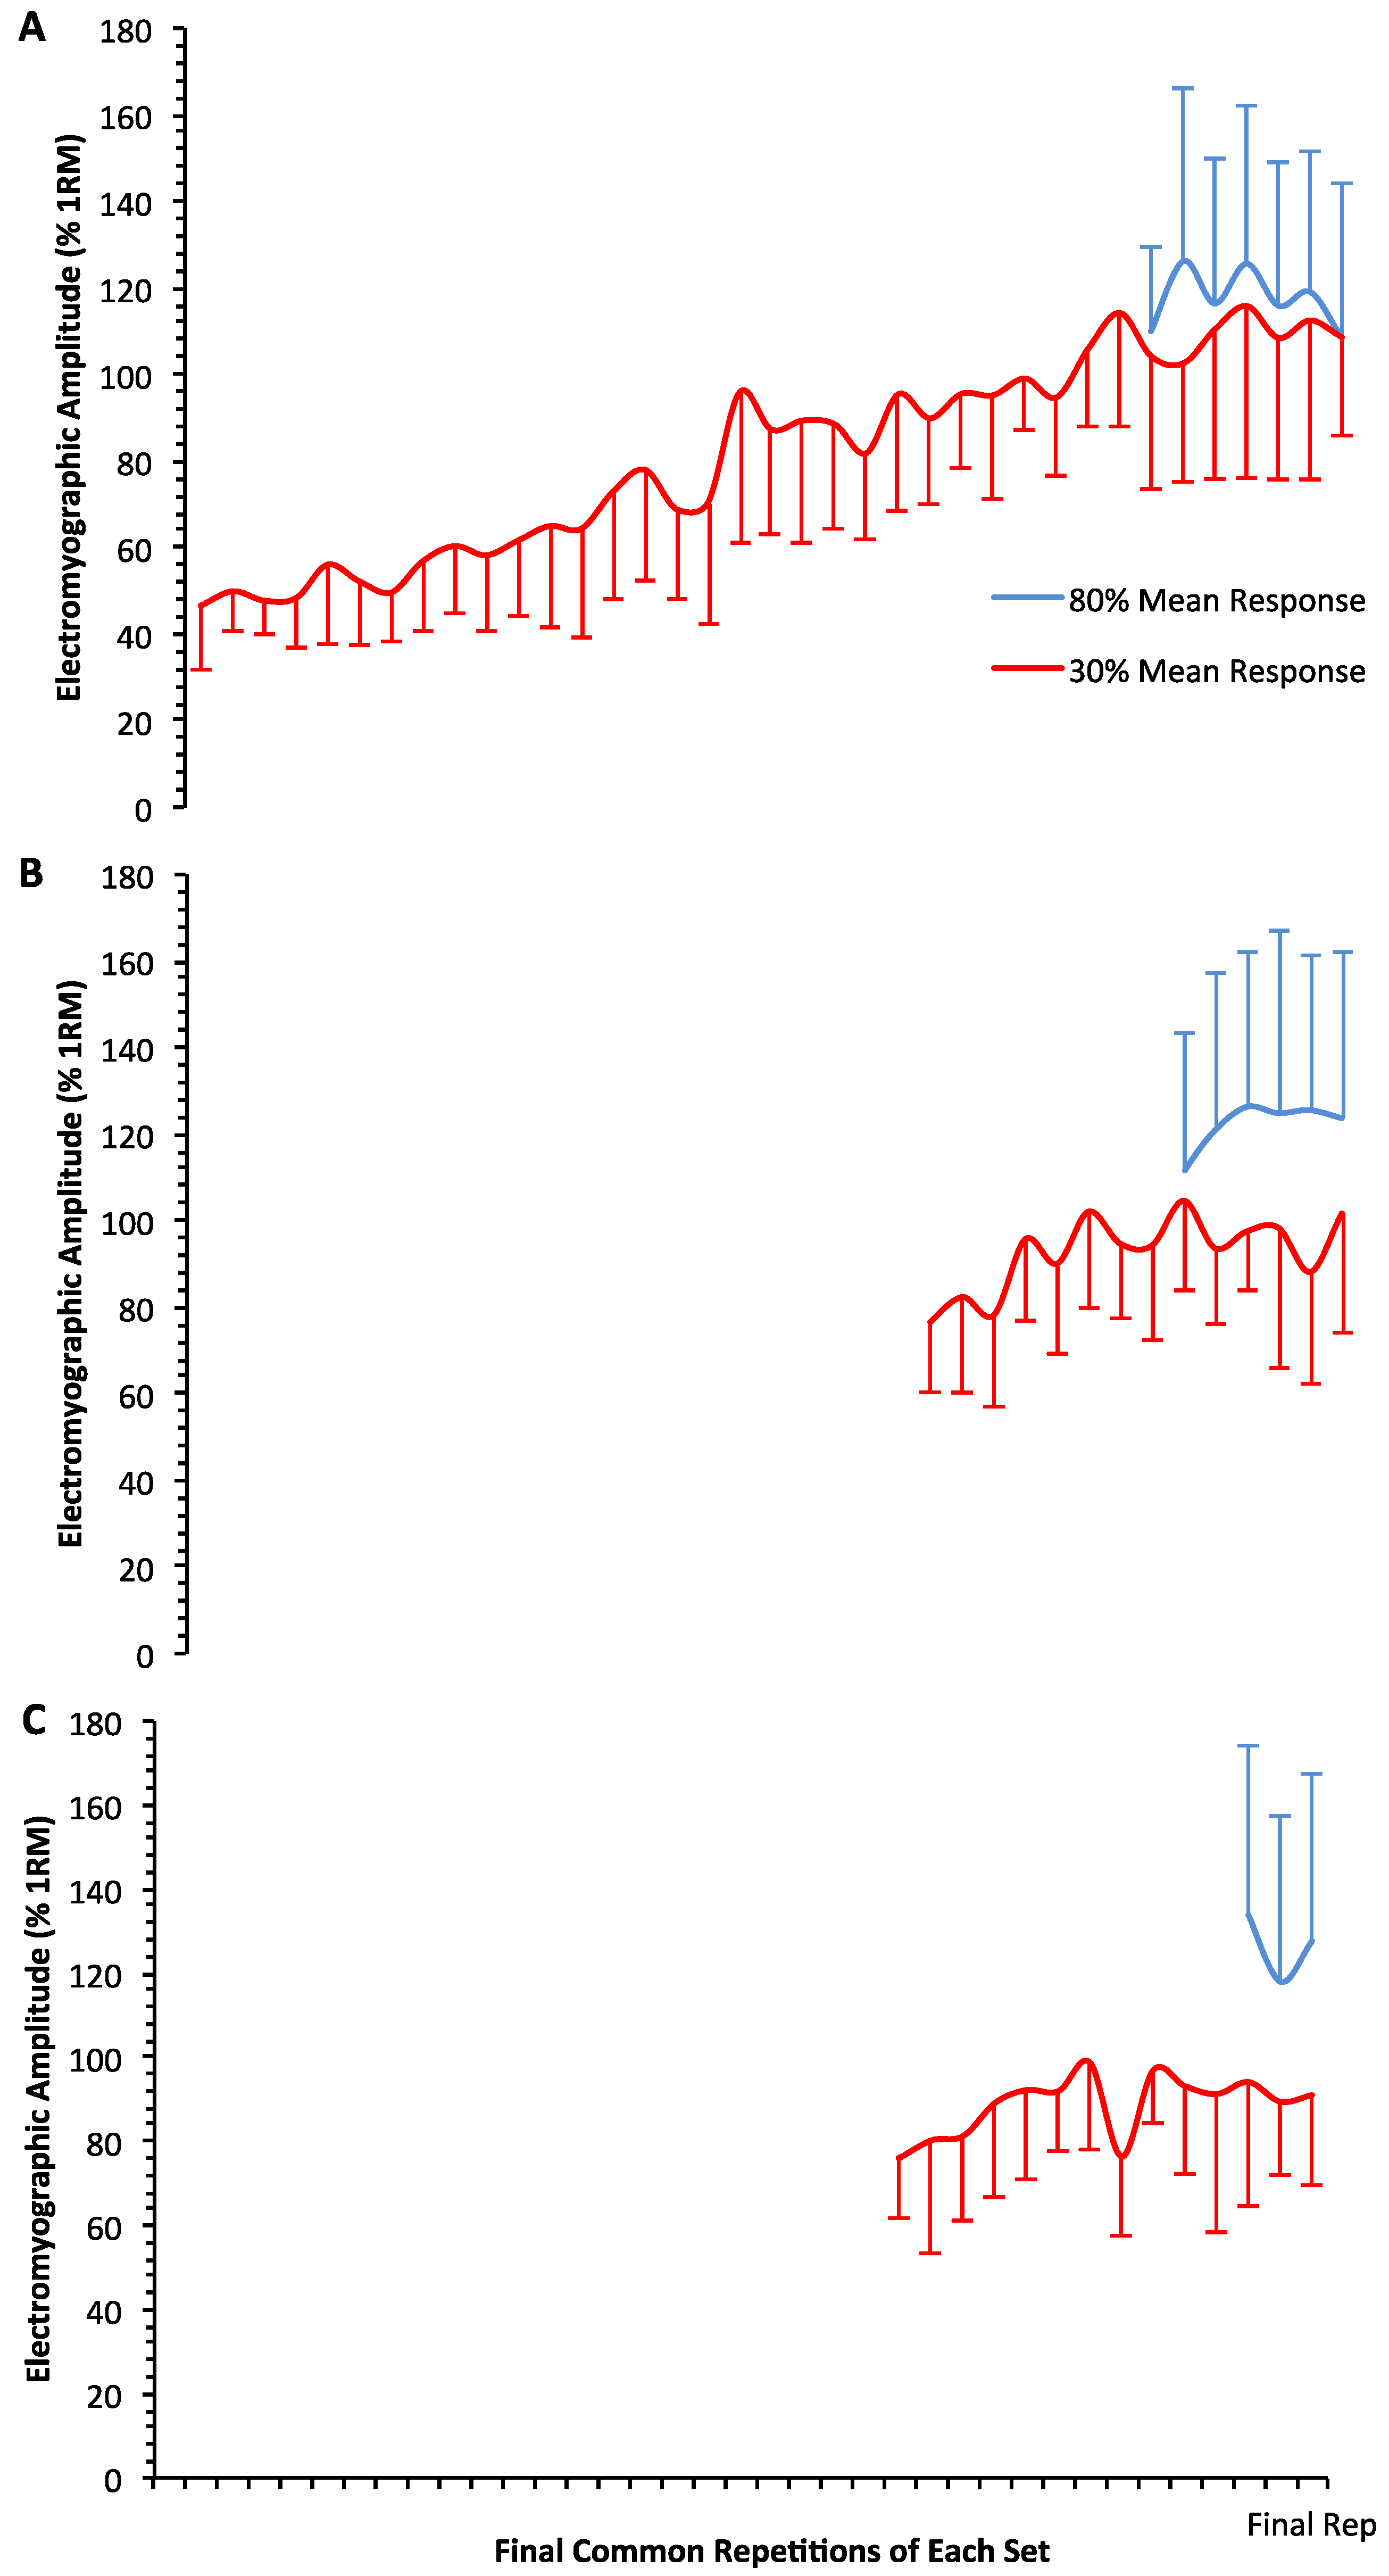
Figure 2 displays the EMG amplitude during the final common repetitions of sets 1, 2, and 3 for the 80% and 30% 1RM groups.
Figure 1. Individual electromyographic amplitude responses to resistance exercise at 80% one repetition maximum (1RM) during (A) set 1; (B) set 2; and (C) set 3 and at 30% 1RM during (D) set 1; (E) set 2; and (F) set 3.
Sports 03 00269 g001
Table 2. The individual simple linear regression analyses for the electromyographic (EMG) amplitude versus repetition relationships during sets 1, 2, and 3.
GroupSubjectSet 1Set 2Set 3
rr2SEEp-valuerr2SEEp-valuerr2SEEp-value
80% 1RM10.500.2528.360.110.240.0612.110.540.580.3412.130.23
50.310.1018.100.320.340.126.600.410.410.1721.360.42
60.320.1031.900.480.660.4419.080.110.900.8214.950.01 *
90.100.0113.040.790.660.4315.290.110.160.035.310.84
100.840.713.56<0.01 *0.400.164.580.441.00---
130.080.0115.800.800.590.356.950.050.07<0.0116.810.88
140.330.1111.800.230.770.5911.09<0.01 *0.110.0116.860.79
180.280.0817.900.370.660.4316.710.080.06<0.013.180.96
30% 1RM20.760.5816.70<0.01 *0.180.0316.180.390.130.0218.760.52
30.850.739.12<0.01 *0.520.2712.89<0.01 *0.660.4413.350.01 *
40.880.7716.84<0.01 *0.800.6416.91<0.01 *0.120.0217.090.60
70.900.8021.50<0.01 *0.980.955.85<0.01 *0.770.5926.43<0.01 *
110.760.5819.26<0.01 *0.530.2812.490.050.610.3713.420.02 *
120.920.8410.26<0.01 *0.480.2314.220.03 *0.220.059.900.35
150.930.8612.91<0.01 *0.510.2616.01<0.01 *0.500.259.720.03 *
r = correlation coefficient; r2 = coefficient of determination; SEE = standard error of the estimate; * Indicates a significant relationship.
Figure 2. A comparison of the mean (±95% confidence interval) electromyographic amplitude responses during the final common repetitions for the 80% versus 30% 1RM groups during (A) set 1; (B) set 2; and (C) set 3. The number of repetitions analyzed for each set was based on the minimum number of repetitions achieved by any one subject in each group during sets 1, 2, and 3. For set 3, subject 10 was not included because he only completed two repetitions (see Table 1 for the repetitions completed by each subject during sets 1, 2, and 3).
Sports 03 00269 g002

4. Discussion

Mitchell et al. hypothesized that, “as lighter loads are repeated, the point of failure/fatigue ultimately necessitates near maximal motor unit recruitment to sustain muscle tension. Thus, relatively lighter loads lifted to the point of failure would result in a similar amount of muscle fiber activation compared with heavier loads lifted to failure” [4] (p. 75). Interestingly, our results supported this hypothesis [4]. The individual EMG amplitude versus repetition responses in our study indicated that muscle activation increased linearly for all subjects in the 30% 1RM group during set 1. Subsequently, however, EMG amplitude increased for five of seven and four of seven subjects during sets 2 and 3, respectively. In contrast, only one of eight subjects demonstrated an increase in EMG amplitude during the 80% 1RM group during sets 1, 2, and 3, which suggested that muscle activation started and remained at or near the same level across all repetitions and sets at 80% 1RM. Furthermore, the mean EMG amplitude responses (Figure 2) show that the fatigue-induced increases in EMG amplitude for the 30% 1RM group and no change in EMG amplitude for the 80% 1RM group resulted in similar levels of muscle activation in both groups. These results are in contrast to our recent study [12] and others [13,15,18] showing that muscle activation was higher during high- versus low-load leg extension resistance exercise to failure. The primary difference between the present study and those previous studies [12,13,15,18] is the muscle group studied. Factors such as location (i.e., upper- versus lower-body), blood flow [19], architecture (i.e., pennate versus fusiform), or fiber type composition [20,21] of the muscle may influence the activation responses to high- versus low-load resistance exercise. Therefore, the muscle activation achieved during high- compared to low-load resistance exercise to failure may be muscle specific.
The information provided by the amplitude of the surface EMG signal is considered a global measure of muscle activation [22]. Because traditional surface EMG is unable to isolate individual motor units, EMG amplitude is related to net motor unit activity, which is a function of both motor unit recruitment and motor unit firing rate [17,22]. Furthermore, EMG amplitude is influenced by peripheral (i.e., fiber membranes properties, action potential shapes, etc.) factors [17,22]. Therefore, it is not possible to distinguish between alterations in motor unit recruitment and firing rate in the present study with EMG amplitude alone. However, the amplitude and frequency content of the surface mechanomyogram (MMG) are thought to reflect motor unit recruitment and global motor unit firing rate, respectively [23,24]. Therefore, future studies should examine the surface MMG signal in conjunction with surface EMG during high- versus low-load resistance exercise to failure to provide more specific information regarding changes in motor unit recruitment versus motor unit firing rate.
In the present study, the numbers of repetitions completed by the subjects in the 30% 1RM group were comparatively greater than the numbers completed by those in the 80% 1RM group (Table 1). This supports data presented by Jenkins et al. [12] who reported that the mean ± standard deviation for the numbers of repetitions completed during leg extension resistance training at 80% and 30% 1RM during sets 1, 2, and 3 were 8.9 ± 2.7 and 45.6 ± 14.3, 6.7 ± 1.9 and 26.8 ± 8.3, and 6.2 ± 1.7 and 22.2 ± 8.6 repetitions, respectively. Unexpectedly, however, the exercise volumes for the 80% and 30% 1RM groups were similar in the present study (Table 1). Previously, Jenkins et al. [12] showed that exercise volume during three sets of 30% 1RM leg extension resistance exercise was 58% greater than during three sets at 80% 1RM. Therefore, the volume of exercise performed during high- versus low-load training may be also be dependent on the muscle group studied, such that the exercise volume may be similar for high- and low-load exercise for the forearm flexors, but greater during low-load exercise for the leg extensors.

5. Conclusions

Overall, the results of the present study indicated that forearm flexion resistance exercise to failure at 30% 1RM caused fatigue-induced increases in EMG amplitude, whereas during 80% 1RM, EMG amplitude remained relatively constant (Figure 1). This load-dependent interaction for EMG amplitude led to similar levels of muscle activation during the final common repetitions at 80% and 30% 1RM (Figure 2). In addition, the numbers of repetitions achieved were comparatively greater for the 30% 1RM than the 80% 1RM group during sets 1, 2, and 3, while total exercise volume was similar between groups (Table 1). Thus, our results conflict with several previous studies [12,13,15,18] showing that muscle activation is greater, but exercise volume is lower [12], during 80% versus 30% 1RM resistance exercise in the leg-extensors. Future studies are needed with simultaneous examinations of EMG and MMG amplitude to better understand the interactions between motor unit recruitment and motor unit firing rate during these loading schemes. Based on the results of the present study, in conjunction with those of previous studies [12,13,15,18], the muscle activation responses and exercise volume completed during low-load training may be dependent on the location, blood flow, architecture, or fiber type composition of the muscle group studied.

Acknowledgments

The authors would like to thank Noelle M. Yeo and Jessie M. Miller for their help with data collection. This study was supported in part by the University of Nebraska Agricultural Research Division with funds provided through the Hatch Act (Agency: United States Department of Agriculture, National Institute of Food and Agriculture; Accession No: 1000080; Project No: NEB-36-078).

Author Contributions

Nathaniel D. M. Jenkins was the primary manuscript writer, and carried out data acquisition, data analysis, and data interpretation. Samuel L. Buckner, Haley C. Bergstrom, Kristen C. Cochrane, Cory M. Smith and Ethan C. Hill were significant contributors to data acquisition, read and approved the final manuscript, and were manuscript reviewers/revisers. Terry J. Housh and Richard J. Schmidt were significant manuscript reviewers/revisers. Joel T. Cramer was the primary manuscript reviewer/reviser, a substantial contributor to concept and design, and contributed to data analysis and interpretation.

Conflicts of Interest

The authors declare no conflict of interest.

References

  1. Garber, C.E.; Blissmer, B.; Deschenes, M.R.; Franklin, B.A.; Lamonte, M.J.; Lee, I.M.; Nieman, D.C.; Swain, D.P. American college of sports medicine position stand. Quantity and quality of exercise for developing and maintaining cardiorespiratory, musculoskeletal, and neuromotor fitness in apparently healthy adults: Guidance for prescribing exercise. Med. Sci. Sports Exerc. 2011, 43, 1334–1359. [Google Scholar] [CrossRef] [PubMed]
  2. National Strength and Conditioning Association. Essentials of Strength Training and Conditioning, 3rd ed.; Human Kinetics: Champaign, IL, USA, 2008. [Google Scholar]
  3. Burd, N.A.; West, D.W.; Staples, A.W.; Atherton, P.J.; Baker, J.M.; Moore, D.R.; Holwerda, A.M.; Parise, G.; Rennie, M.J.; Baker, S.K.; et al. Low-load high volume resistance exercise stimulates muscle protein synthesis more than high-load low volume resistance exercise in young men. PLoS ONE 2010, 5. [Google Scholar] [CrossRef] [PubMed]
  4. Mitchell, C.J.; Churchward-Venne, T.A.; West, D.W.; Burd, N.A.; Breen, L.; Baker, S.K.; Phillips, S.M. Resistance exercise load does not determine training-mediated hypertrophic gains in young men. J. Appl. Physiol. 2012, 113, 71–77. [Google Scholar] [CrossRef] [PubMed]
  5. Ogasawara, R.; Loenneke, J.P.; Thiebaud, R.S.; Abe, T. Low-load bench press training to fatigue results in muscle hypertrophy similar to high-load bench press training. Int. J. Clin. Med. 2013, 4, 114–121. [Google Scholar] [CrossRef]
  6. Burd, N.A.; Moore, D.R.; Mitchell, C.J.; Phillips, S.M. Big claims for big weights but with little evidence. Eur. J. Appl. Physiol. 2013, 113, 267–268. [Google Scholar] [CrossRef] [PubMed]
  7. Schuenke, M.D.; Herman, J.; Staron, R.S. Preponderance of evidence proves “big” weights optimize hypertrophic and strength adaptations. Eur. J. Appl. Physiol. 2013, 113, 269–271. [Google Scholar] [CrossRef] [PubMed]
  8. Carpinelli, R.N. The size principle and a critical analysis of the unsubstantiated heavier-is-better recommendation for resistance training. J. Exerc. Sci. Fit. 2008, 6, 67–86. [Google Scholar]
  9. Henneman, E.; Somjen, G.; Carpenter, D.O. Functional significance of cell size in spinal motoneurons. J. Neurophysiol. 1965, 28, 560–580. [Google Scholar] [PubMed]
  10. Conwit, R.A.; Stashuk, D.; Suzuki, H.; Lynch, N.; Schrager, M.; Metter, E.J. Fatigue effects on motor unit activity during submaximal contractions. Arch. Phys. Med. Rehabil. 2000, 81, 1211–1216. [Google Scholar] [CrossRef] [PubMed]
  11. Burd, N.A.; Mitchell, C.J.; Churchward-Venne, T.A.; Phillips, S.M. Bigger weights may not beget bigger muscles: Evidence from acute muscle protein synthetic responses after resistance exercise. Appl. Physiol. Nutr. Metab. 2012, 37, 551–554. [Google Scholar] [CrossRef] [PubMed]
  12. Jenkins, N.D.; Housh, T.J.; Bergstrom, H.C.; Cochrane, K.C.; Hill, E.C.; Smith, C.M.; Johnson, G.O.; Schmidt, R.J.; Cramer, J.T. Muscle activation during three sets to failure at 80% vs. 30% 1rm resistance exercise. Eur. J. Appl. Physiol. 2015, in press. [Google Scholar] [CrossRef] [PubMed]
  13. Akima, H.; Saito, A. Activation of quadriceps femoris including vastus intermedius during fatiguing dynamic knee extensions. Eur. J. Appl. Physiol. 2013, 113, 2829–2840. [Google Scholar] [CrossRef] [PubMed]
  14. Schoenfeld, B.J. Potential mechanisms for a role of metabolic stress in hypertrophic adaptations to resistance training. Sports Med. 2013, 43, 179–194. [Google Scholar] [CrossRef] [PubMed]
  15. Cook, S.B.; Murphy, B.G.; Labarbera, K.E. Neuromuscular function after a bout of low-load blood flow-restricted exercise. Med. Sci. Sports Exerc. 2013, 45, 67–74. [Google Scholar] [CrossRef] [PubMed]
  16. Hermens, H.J.; Freriks, B.; Merletti, R.; Stegeman, D.; Blok, J.; Rau, G.; Disselhorst-Klug, C.; Hagg, G. Seniam 8: European Recommendations for Surface Electromyography; Roessngh Research and Development: Enschede, The Netherlands, 1999. [Google Scholar]
  17. Beck, T.W.; Housh, T.J. Use of electromyography in studying human movement. In Routledge Handbook of Biomechanics and Human Movement; Hong, Y., Bartlett, R., Eds.; Routledge: New York, NY, USA, 2008; pp. 214–230. [Google Scholar]
  18. Schoenfeld, B.J.; Contreras, B.; Willardson, J.M.; Fontana, F.; Tiryaki-Sonmez, G. Muscle activation during low- versus high-load resistance training in well-trained men. Eur. J. Appl. Physiol. 2014, 114, 2491–2497. [Google Scholar] [CrossRef] [PubMed]
  19. Samanek, M.; Goetzova, J.; Fiserova, J.; Skovranek, J. Differences in muscle blood flow in upper and lower extremities of patients after correction of coarctation of the aorta. Circulation 1976, 54, 377–381. [Google Scholar] [CrossRef] [PubMed]
  20. Ali, A.; Sundaraj, K.; Badlishah Ahmad, R.; Ahamed, N.U.; Islam, A.; Sundaraj, S. Muscle fatigue in the three heads of the triceps brachii during a controlled forceful hand grip task with full elbow extension using surface electromyography. J. Hum. Kinet. 2015, 46, 69–76. [Google Scholar] [CrossRef] [PubMed]
  21. Harwood, B.; Dalton, B.H.; Power, G.A.; Rice, C.L. Motor unit properties from three synergistic muscles during ramp isometric elbow extensions. Exp. Brain Res. 2013, 231, 501–510. [Google Scholar] [CrossRef] [PubMed]
  22. Farina, D.; Merletti, R.; Enoka, R.M. The extraction of neural strategies from the surface emg. J. Appl. Physiol. 2004, 96, 1486–1495. [Google Scholar] [CrossRef] [PubMed]
  23. Beck, T.W.; Housh, T.J.; Cramer, J.T.; Weir, J.P.; Johnson, G.O.; Coburn, J.W.; Malek, M.H.; Mielke, M. Mechanomyographic amplitude and frequency responses during dynamic muscle actions: A comprehensive review. Biomed. Eng. Online 2005, 4. [Google Scholar] [CrossRef] [PubMed]
  24. Gordon, G.; Holbourn, A.H. The sounds from single motor units in a contracting muscle. J. Physiol. 1948, 107, 456–464. [Google Scholar] [CrossRef] [PubMed]