

Comparison of Hormonal, Inflammatory, Muscle Damage and Oxidative Stress Biomarkers Changes in Response to High-Intensity Interval, Circuit and Concurrent Exercise Bouts

 ,
,  ,
,  , and
, and 
Abstract
1. Introduction
2. Material and Methods
2.1. Study Design
2.2. Participants
2.3. Procedures
2.4. Medical Examination
2.5. Blood Samples
2.6. Incremental Test
2.7. Acute Exercise Training Protocols
2.8. Muscle Damage, Hormones, Inflammatory and Oxidative Stress Biomarkers
2.8.1. Creatine Kinase (CK)
2.8.2. Hormones
2.8.3. Inflammatory and Myostatin (IL-6, TNF-α and MYO)
2.8.4. Protein Carbonylation and Thiobarbituric Acid Measurements
2.9. Statistical Analysis
3. Results
4. Discussion
4.1. Testosterone
4.2. Growth Hormone
4.3. Myostatin
4.4. Inflammatory Response
4.5. Oxidative Stress
5. Conclusions
Author Contributions
Funding
Institutional Review Board Statement
Informed Consent Statement
Data Availability Statement
Acknowledgments
Conflicts of Interest
Abbreviations
| Akt 4/5 | Activin receptor-like kinase 4/5 |
| ANOVA | Analysis of variance |
| AR | Androgen receptor |
| BMI | Body mass index |
| C | Cortisol |
| CK | Creatine kinase |
| CT | Concurrent training |
| EDTA | Ethylenediaminetetraacetic acid |
| GH | Growth hormone |
| GLUT4 | Glucose transporter type 4 |
| HIIT | High-intensity interval training |
| HR | Heart rate |
| HRC | High-intensity resistance circuit training |
| IGF-1 | Insulin-like growth factor-1 |
| IL-6 | Interleukin-6 |
| IRS1 | Insulin receptor substrate 1 |
| IRS2 | Insulin receptor substrate 2 |
| LDH | lactate dehydrogenase |
| MCT1 | Monocarboxylate transporter 1 |
| MCT4 | Monocarboxylate transporter 4 |
| MDA | Malondialdehyde |
| mTOR | Mammalian target of rapamycin |
| mTORC1 | Rapamycin-sensitive mTOR complex 1 |
| MYO | Myostatin |
| PET | Polyethylene terephthalate |
| ROS | Reactive oxygen species |
| T | Testosterone |
| TBARS | Thiobarbituric acid-reactive substances |
| TNF-α | Tumor necrosis factor α |
| VO2MAX | Maximal oxygen uptake |
References
- Hackney, A.C.; Lane, A.R. Exercise and the regulation of endocrine hormones. Prog. Mol. Biol. Transl. Sci. 2015, 135, 293–311. [Google Scholar] [PubMed]
- Wilke, J.; Mohr, L. Chronic effects of high-intensity functional training on motor function: A systematic review with multilevel meta-analysis. Sci. Rep. 2020, 10, 21680. [Google Scholar] [CrossRef]
- Lanfranco, F.; Strasburger, C.J. Sports Endocrinology; Karger Medical and Scientific Publishers: Basel, Switzerland, 2016. [Google Scholar]
- Gharahdaghi, N.; Phillips, B.E.; Szewczyk, N.J.; Smith, K.; Wilkinson, D.J.; Atherton, P.J. Links between testosterone, oestrogen, and the growth hormone/insulin-like growth factor axis and resistance exercise muscle adaptations. Front. Physiol. 2021, 11, 621226. [Google Scholar] [CrossRef] [PubMed]
- Kraemer, W.J.; Ratamess, N.A. Hormonal responses and adaptations to resistance exercise and training. Sports Med. 2005, 35, 339–361. [Google Scholar] [CrossRef] [PubMed]
- Allen, R.G.; Tresini, M. Oxidative stress and gene regulation. Free Radic. Biol. Med. 2000, 28, 463–499. [Google Scholar] [CrossRef]
- Radak, Z.; Rattan, S.I.S. Exercise, hormesis and ageing: A new section in Biogerontology. Biogerontology 2024, 26, 26. [Google Scholar] [CrossRef]
- Radak, Z.; Zhao, Z.; Koltai, E.; Ohno, H.; Atalay, M. Oxygen consumption and usage during physical exercise: The balance between oxidative stress and ROS-dependent adaptive signaling. Antioxid. Redox Signal. 2013, 18, 1208–1246. [Google Scholar] [CrossRef]
- Ristow, M. Unraveling the truth about antioxidants: Mitohormesis explains ROS-induced health benefits. Nat. Med. 2014, 20, 709–711. [Google Scholar] [CrossRef]
- Varamenti, E.; Tod, D.; Pullinger, S.A. Redox Homeostasis and Inflammation Responses to Training in Adolescent Athletes: A Systematic Review and Meta-analysis. Sports Med. Open 2020, 6, 34. [Google Scholar] [CrossRef]
- Scheele, C.; Nielsen, S.; Pedersen, B.K. ROS and myokines promote muscle adaptation to exercise. Trends Endocrinol. Metab. 2009, 20, 95–99. [Google Scholar] [CrossRef]
- Peake, J.M.; Neubauer, O.; Della Gatta, P.A.; Nosaka, K. Muscle damage and inflammation during recovery from exercise. J. Appl. Physiol. 2017, 122, 559–570. [Google Scholar] [CrossRef]
- Chazaud, B. Inflammation during skeletal muscle regeneration and tissue remodeling: Application to exercise-induced muscle damage management. Immunol. Cell Biol. 2016, 94, 140–145. [Google Scholar] [CrossRef] [PubMed]
- Ost, M.; Coleman, V.; Kasch, J.; Klaus, S. Regulation of myokine expression: Role of exercise and cellular stress. Free Radic. Biol. Med. 2016, 98, 78–89. [Google Scholar] [CrossRef] [PubMed]
- Martínez-Noguera, F.J.; Marín-Pagán, C.; Carlos-Vivas, J.; Alcaraz, P.E. 8-Week Supplementation of 2S-Hesperidin Modulates Antioxidant and Inflammatory Status after Exercise until Exhaustion in Amateur Cyclists. Antioxidants 2021, 10, 432. [Google Scholar] [CrossRef] [PubMed]
- Petersen, A.M.; Pedersen, B.K. The anti-inflammatory effect of exercise. J. Appl. Physiol. 2005, 98, 1154–1162. [Google Scholar] [CrossRef]
- Bartolomei, S.; Sadres, E.; Church, D.D.; Arroyo, E.; Gordon, J.A., III; Varanoske, A.N.; Wang, R.; Beyer, K.S.; Oliveira, L.P.; Stout, J.R.; et al. Comparison of the recovery response from high-intensity and high-volume resistance exercise in trained men. Eur. J. Appl. Physiol. 2017, 117, 1287–1298. [Google Scholar] [CrossRef]
- Kim, J.; Park, K.; Lee, J. Myostatin A55T Genotype is Associated with Strength Recovery Following Exercise-Induced Muscle Damage. Int. J. Environ. Res. Public Health 2020, 17, 4900. [Google Scholar] [CrossRef]
- Cipryan, L. IL-6, Antioxidant Capacity and Muscle Damage Markers Following High-Intensity Interval Training Protocols. J. Hum. Kinet. 2017, 56, 139–148. [Google Scholar] [CrossRef]
- Callegari, G.A.; Novaes, J.S.; Neto, G.R.; Dias, I.; Garrido, N.D.; Dani, C. Creatine Kinase and Lactate Dehydrogenase Responses after Different Resistance and Aerobic Exercise Protocols. J. Hum. Kinet. 2017, 58, 65–72. [Google Scholar] [CrossRef]
- Leveritt, M.; Abernethy, P.J.; Barry, B.K.; Logan, P.A. Concurrent Strength and Endurance Training. Sports Med. 1999, 28, 413–427. [Google Scholar] [CrossRef]
- Buchheit, M.; Laursen, P.B. High-intensity interval training, solutions to the programming puzzle: Part I: Cardiopulmonary emphasis. Sports Med. 2013, 43, 313–338. [Google Scholar] [CrossRef] [PubMed]
- Campbell, W.W.; Kraus, W.E.; Powell, K.E.; Haskell, W.L.; Janz, K.F.; Jakicic, J.M.; Troiano, R.P.; Sprow, K.; Torres, A.; Piercy, K.L.; et al. High-Intensity Interval Training for Cardiometabolic Disease Prevention. Med. Sci. Sports Exerc. 2019, 51, 1220–1226. [Google Scholar] [CrossRef] [PubMed]
- Vasconcelos, B.B.; Protzen, G.V.; Galliano, L.M.; Kirk, C.; Del Vecchio, F.B. Effects of High-Intensity Interval Training in Combat Sports: A Systematic Review with Meta-Analysis. J. Strength Cond. Res. 2020, 34, 888–900. [Google Scholar] [CrossRef] [PubMed]
- Marín-Pagán, C.; Blazevich, A.J.; Chung, L.H.; Romero-Arenas, S.; Freitas, T.T.; Alcaraz, P.E. Acute Physiological Responses to High-Intensity Resistance Circuit Training vs. Traditional Strength Training in Soccer Players. Biology 2020, 9, 383. [Google Scholar] [CrossRef]
- Alcaraz, P.E.; Perez-Gomez, J.; Chavarrias, M.; Blazevich, A.J. Similarity in adaptations to high-resistance circuit vs. traditional strength training in resistance-trained men. J. Strength Cond. Res. 2011, 25, 2519–2527. [Google Scholar] [CrossRef]
- Alcaraz, P.E.; Sánchez-Lorente, J.; Blazevich, A.J. Physical performance and cardiovascular responses to an acute bout of heavy resistance circuit training versus traditional strength training. J. Strength Cond. Res. 2008, 22, 667–671. [Google Scholar] [CrossRef]
- Kraemer, W.J.; Ratamess, N.A.; Nindl, B.C. Recovery responses of testosterone, growth hormone, and IGF-1 after resistance exercise. J. Appl. Physiol. 2017, 122, 549–558. [Google Scholar] [CrossRef]
- Urbaniak, G.; Plous, S. Research Randomizer, version 4.0; Computer Software; Social Psychology Network: Middletown, OH, USA, 2013. [Google Scholar]
- General Assembly of the World Medical Association. World Medical Association Declaration of Helsinki: Ethical principles for medical research involving human subjects. J. Am. Coll. Dent. 2014, 81, 14–18. [Google Scholar]
- Larson, R.; Cantrell, G.; Ade, C.; Farrell, J.W., III; Lantis, D.; Barton, M.; Laron, D. Physiologic responses to two distinct maximal cardiorespiratory exercise protocols. Int. J. Sports Exerc. Med. 2015, 1, 013. [Google Scholar] [CrossRef]
- Edvardsen, E.; Hem, E.; Anderssen, S.A. End criteria for reaching maximal oxygen uptake must be strict and adjusted to sex and age: A cross-sectional study. PLoS ONE 2014, 9, e85276. [Google Scholar] [CrossRef]
- Cohen, J. Statistical Power Analysis for the Behavioral Sciences; Routledge: New York, NY, USA, 2013. [Google Scholar]
- Kraemer, W.J.; Marchitelli, L.; Gordon, S.E.; Harman, E.; Dziados, J.E.; Mello, R.; Frykman, P.; McCurry, D.; Fleck, S.J. Hormonal and growth factor responses to heavy resistance exercise protocols. J. Appl. Physiol. 1990, 69, 1442–1450. [Google Scholar] [CrossRef] [PubMed]
- Raastad, T.; Bjøro, T.; Hallén, J. Hormonal responses to high- and moderate-intensity strength exercise. Eur. J. Appl. Physiol. 2000, 82, 121–128. [Google Scholar] [CrossRef] [PubMed]
- Ratamess, N.A.; Kraemer, W.J.; Volek, J.S.; Maresh, C.M.; Vanheest, J.L.; Sharman, M.J.; Rubin, M.R.; French, D.N.; Vescovi, J.D.; Silvestre, R.; et al. Androgen receptor content following heavy resistance exercise in men. J. Steroid Biochem. Mol. Biol. 2005, 93, 35–42. [Google Scholar] [CrossRef]
- Migiano, M.J.; Vingren, J.L.; Volek, J.S.; Maresh, C.M.; Fragala, M.S.; Ho, J.Y.; Thomas, G.A.; Hatfield, D.L.; Häkkinen, K.; Ahtiainen, J.; et al. Endocrine response patterns to acute unilateral and bilateral resistance exercise in men. J. Strength Cond. Res. 2010, 24, 128–134. [Google Scholar] [CrossRef] [PubMed]
- Kraemer, W.J.; Häkkinen, K.; Newton, R.U.; McCormick, M.; Nindl, B.C.; Volek, J.S.; Gotshalk, L.A.; Fleck, S.J.; Campbell, W.W.; Gordon, S.E.; et al. Acute hormonal responses to heavy resistance exercise in younger and older men. Eur. J. Appl. Physiol. Occup. Physiol. 1998, 77, 206–211. [Google Scholar] [CrossRef]
- Kraemer, W.J.; Fry, A.C.; Warren, B.J.; Stone, M.H.; Fleck, S.J.; Kearney, J.T.; Conroy, B.P.; Maresh, C.M.; Weseman, C.A.; Triplett, N.T.; et al. Acute hormonal responses in elite junior weightlifters. Int. J. Sports Med. 1992, 13, 103–109. [Google Scholar] [CrossRef]
- Hansen, S.; Kvorning, T.; Kjaer, M.; Sjøgaard, G. The effect of short-term strength training on human skeletal muscle: The importance of physiologically elevated hormone levels. Scand. J. Med. Sci. Sports 2001, 11, 347–354. [Google Scholar] [CrossRef]
- Reeves, G.V.; Kraemer, R.R.; Hollander, D.B.; Clavier, J.; Thomas, C.; Francois, M.; Castracane, V.D. Comparison of hormone responses following light resistance exercise with partial vascular occlusion and moderately difficult resistance exercise without occlusion. J. Appl. Physiol. 2006, 101, 1616–1622. [Google Scholar] [CrossRef]
- Ratamess, N.A.; Falvo, M.J.; Mangine, G.T.; Hoffman, J.R.; Faigenbaum, A.D.; Kang, J. The effect of rest interval length on metabolic responses to the bench press exercise. Eur. J. Appl. Physiol. 2007, 100, 1–17. [Google Scholar] [CrossRef]
- Van Every, D.W.; D’Souza, A.C.; Phillips, S.M. Hormones, Hypertrophy, and Hype: An Evidence-Guided Primer on Endogenous Endocrine Influences on Exercise-Induced Muscle Hypertrophy. Exerc. Sport Sci. Rev. 2024, 52, 117–125. [Google Scholar] [CrossRef]
- Hooper, D.R.; Kraemer, W.J.; Focht, B.C.; Volek, J.S.; DuPont, W.H.; Caldwell, L.K.; Maresh, C.M. Endocrinological roles for testosterone in resistance exercise responses and adaptations. Sports Med. 2017, 47, 1709–1720. [Google Scholar] [CrossRef] [PubMed]
- Vingren, J.L.; Kraemer, W.J.; Ratamess, N.A.; Anderson, J.M.; Volek, J.S.; Maresh, C.M. Testosterone Physiology in Resistance Exercise and Training. Sports Med. 2010, 40, 1037–1053. [Google Scholar] [CrossRef]
- Gobinet, J.; Poujol, N.; Sultan, C. Molecular action of androgens. Mol. Cell. Endocrinol. 2002, 198, 15–24. [Google Scholar] [CrossRef] [PubMed]
- Mayer, M.; Rosen, F. Interaction of glucocorticoids and androgens with skeletal muscle. Metabolism 1977, 26, 937–962. [Google Scholar] [CrossRef]
- Mauras, N.; Hayes, V.; Welch, S.; Rini, A.; Helgeson, K.; Dokler, M.; Veldhuis, J.D.; Urban, R.J. Testosterone deficiency in young men: Marked alterations in whole body protein kinetics, strength, and adiposity. J. Clin. Endocrinol. Metab. 1998, 83, 1886–1892. [Google Scholar] [CrossRef]
- Baulieu, E.; Robel, P. Catabolism of testosterone and androstenedione. In The Androgens of the Testis; Marcel Dekker: New York, NY, USA, 1970; pp. 50–70. [Google Scholar]
- Ferrando, A.A.; Sheffield-Moore, M.; Yeckel, C.W.; Gilkison, C.; Jiang, J.; Achacosa, A.; Lieberman, S.A.; Tipton, K.; Wolfe, R.R.; Urban, R.J. Testosterone administration to older men improves muscle function: Molecular and physiological mechanisms. Am. J. Physiol. Endocrinol. Metab. 2002, 282, E601–E607. [Google Scholar] [CrossRef]
- Kelly, D.M.; Jones, T.H. Testosterone: A metabolic hormone in health and disease. J. Endocrinol. 2013, 217, R25–R45. [Google Scholar] [CrossRef] [PubMed]
- Enoki, T.; Yoshida, Y.; Lally, J.; Hatta, H.; Bonen, A. Testosterone increases lactate transport, monocarboxylate transporter (MCT) 1 and MCT4 in rat skeletal muscle. J. Physiol. 2006, 577, 433–443. [Google Scholar] [CrossRef]
- Braga, M.; Bhasin, S.; Jasuja, R.; Pervin, S.; Singh, R. Testosterone inhibits transforming growth factor-β signaling during myogenic differentiation and proliferation of mouse satellite cells: Potential role of follistatin in mediating testosterone action. Mol. Cell. Endocrinol. 2012, 350, 39–52. [Google Scholar] [CrossRef]
- Kvorning, T.; Andersen, M.; Brixen, K.; Schjerling, P.; Suetta, C.; Madsen, K. Suppression of testosterone does not blunt mRNA expression of myoD, myogenin, IGF, myostatin or androgen receptor post strength training in humans. J. Physiol. 2007, 578, 579–593. [Google Scholar] [CrossRef]
- White, J.P.; Gao, S.; Puppa, M.J.; Sato, S.; Welle, S.L.; Carson, J.A. Testosterone regulation of Akt/mTORC1/FoxO3a signaling in skeletal muscle. Mol. Cell. Endocrinol. 2013, 365, 174–186. [Google Scholar] [CrossRef] [PubMed]
- Duval, A.P.; Jeanneret, C.; Santoro, T.; Dormond, O. mTOR and Tumor Cachexia. Int. J. Mol. Sci. 2018, 19, 2225. [Google Scholar] [CrossRef]
- Gordon, S.E.; Kraemer, W.J.; Vos, N.H.; Lynch, J.M.; Knuttgen, H.G. Effect of acid-base balance on the growth hormone response to acute high-intensity cycle exercise. J. Appl. Physiol. 1994, 76, 821–829. [Google Scholar] [CrossRef]
- Kraemer, W.J.; Fleck, S.J.; Dziados, J.E.; Harman, E.A.; Marchitelli, L.J.; Gordon, S.E.; Mello, R.; Frykman, P.N.; Koziris, L.P.; Triplett, N.T. Changes in hormonal concentrations after different heavy-resistance exercise protocols in women. J. Appl. Physiol. 1993, 75, 594–604. [Google Scholar] [CrossRef] [PubMed]
- Mauras, N.; Rini, A.; Welch, S.; Sager, B.; Murphy, S.P. Synergistic effects of testosterone and growth hormone on protein metabolism and body composition in prepubertal boys. Metabolism 2003, 52, 964–969. [Google Scholar] [CrossRef]
- Hayashi, A.A.; Proud, C.G. The rapid activation of protein synthesis by growth hormone requires signaling through mTOR. Am. J. Physiol.-Endocrinol. Metab. 2007, 292, E1647–E1655. [Google Scholar] [CrossRef]
- Rodriguez, J.; Vernus, B.; Chelh, I.; Cassar-Malek, I.; Gabillard, J.C.; Hadj Sassi, A.; Seiliez, I.; Picard, B.; Bonnieu, A. Myostatin and the skeletal muscle atrophy and hypertrophy signaling pathways. Cell. Mol. Life Sci. 2014, 71, 4361–4371. [Google Scholar] [CrossRef]
- Raue, U.; Slivka, D.; Jemiolo, B.; Hollon, C.; Trappe, S. Myogenic gene expression at rest and after a bout of resistance exercise in young (18–30 yr) and old (80–89 yr) women. J. Appl. Physiol. 2006, 101, 53–59. [Google Scholar] [CrossRef] [PubMed]
- Kim, J.S.; Cross, J.M.; Bamman, M.M. Impact of resistance loading on myostatin expression and cell cycle regulation in young and older men and women. Am. J. Physiol. Endocrinol. Metab. 2005, 288, E1110-9. [Google Scholar] [CrossRef]
- Willoughby, D.S. Effects of heavy resistance training on myostatin mRNA and protein expression. Med. Sci. Sports Exerc. 2004, 36, 574–582. [Google Scholar] [CrossRef]
- Kim, J.S.; Petrella, J.K.; Cross, J.M.; Bamman, M.M. Load-mediated downregulation of myostatin mRNA is not sufficient to promote myofiber hypertrophy in humans: A cluster analysis. J. Appl. Physiol. 2007, 103, 1488–1495. [Google Scholar] [CrossRef] [PubMed]
- Trendelenburg, A.U.; Meyer, A.; Rohner, D.; Boyle, J.; Hatakeyama, S.; Glass, D.J. Myostatin reduces Akt/TORC1/p70S6K signaling, inhibiting myoblast differentiation and myotube size. Am. J. Physiol.-Cell Physiol. 2009, 296, C1258–C1270. [Google Scholar] [CrossRef] [PubMed]
- Kramerova, I.; Marinov, M.; Owens, J.; Lee, S.J.; Becerra, D.; Spencer, M.J. Myostatin inhibition promotes fast fibre hypertrophy but causes loss of AMP-activated protein kinase signalling and poor exercise tolerance in a model of limb-girdle muscular dystrophy R1/2A. J. Physiol. 2020, 598, 3927–3939. [Google Scholar] [CrossRef] [PubMed]
- Serrano, A.L.; Baeza-Raja, B.; Perdiguero, E.; Jardí, M.; Muñoz-Cánoves, P. Interleukin-6 is an essential regulator of satellite cell-mediated skeletal muscle hypertrophy. Cell Metab. 2008, 7, 33–44. [Google Scholar] [CrossRef]
- Fischer, C.P. Interleukin-6 in acute exercise and training: What is the biological relevance? Exerc. Immunol. Rev. 2006, 12, 6–33. [Google Scholar]
- Deminice, R.; Sicchieri, T.; Mialich, M.S.; Milani, F.; Ovidio, P.P.; Jordao, A.A. Oxidative Stress Biomarker Responses to an Acute Session of Hypertrophy-Resistance Traditional Interval Training and Circuit Training. J. Strength Cond. Res. 2011, 25, 798–804. [Google Scholar] [CrossRef] [PubMed]
- McBride, J.M.; Kraemer, W.J.; Triplett-McBride, T.; Sebastianelli, W. Effect of resistance exercise on free radical production. Med. Sci. Sports Exerc. 1998, 30, 67–72. [Google Scholar] [CrossRef]
- Bloomer, R.J.; Falvo, M.J.; Fry, A.C.; Schilling, B.K.; Smith, W.A.; Moore, C.A. Oxidative stress response in trained men following repeated squats or sprints. Med. Sci. Sports Exerc. 2006, 38, 1436–1442. [Google Scholar] [CrossRef]
- Hoffman, J.R.; Im, J.; Kang, J.; Maresh, C.M.; Kraemer, W.J.; French, D.; Nioka, S.; Kime, R.; Rundell, K.W.; Ratamess, N.A.; et al. Comparison of low- and high-intensity resistance exercise on lipid peroxidation: Role of muscle oxygenation. J. Strength Cond. Res. 2007, 21, 118–122. [Google Scholar] [CrossRef]
- Veskoukis, A.S.; Nikolaidis, M.G.; Kyparos, A.; Kouretas, D. Blood reflects tissue oxidative stress depending on biomarker and tissue studied. Free Radic. Biol. Med. 2009, 47, 1371–1374. [Google Scholar] [CrossRef]
- Reichhold, S.; Neubauer, O.; Bulmer, A.C.; Knasmüller, S.; Wagner, K.H. Endurance exercise and DNA stability: Is there a link to duration and intensity? Mutat. Res. 2009, 682, 28–38. [Google Scholar] [CrossRef] [PubMed]
- Uchiyama, S.; Tsukamoto, H.; Yoshimura, S.; Tamaki, T. Relationship between oxidative stress in muscle tissue and weight-lifting-induced muscle damage. Pflug. Arch. 2006, 452, 109–116. [Google Scholar] [CrossRef] [PubMed]
- Alessio, H.M.; Goldfarb, A.H.; Cutler, R.G. MDA content increases in fast- and slow-twitch skeletal muscle with intensity of exercise in a rat. Am. J. Physiol. 1988, 255, C874–C877. [Google Scholar] [CrossRef] [PubMed]
- Zhu, L.; Bai, C.; Wang, X.; Wei, Z.; Gu, M.; Zhou, X.; Su, G.; Liu, X.; Yang, L.; Li, G. Myostatin Knockout Limits Exercise-Induced Reduction in Bovine Erythrocyte Oxidative Stress by Enhancing the Efficiency of the Pentose Phosphate Pathway. Animals 2022, 12, 927. [Google Scholar] [CrossRef]

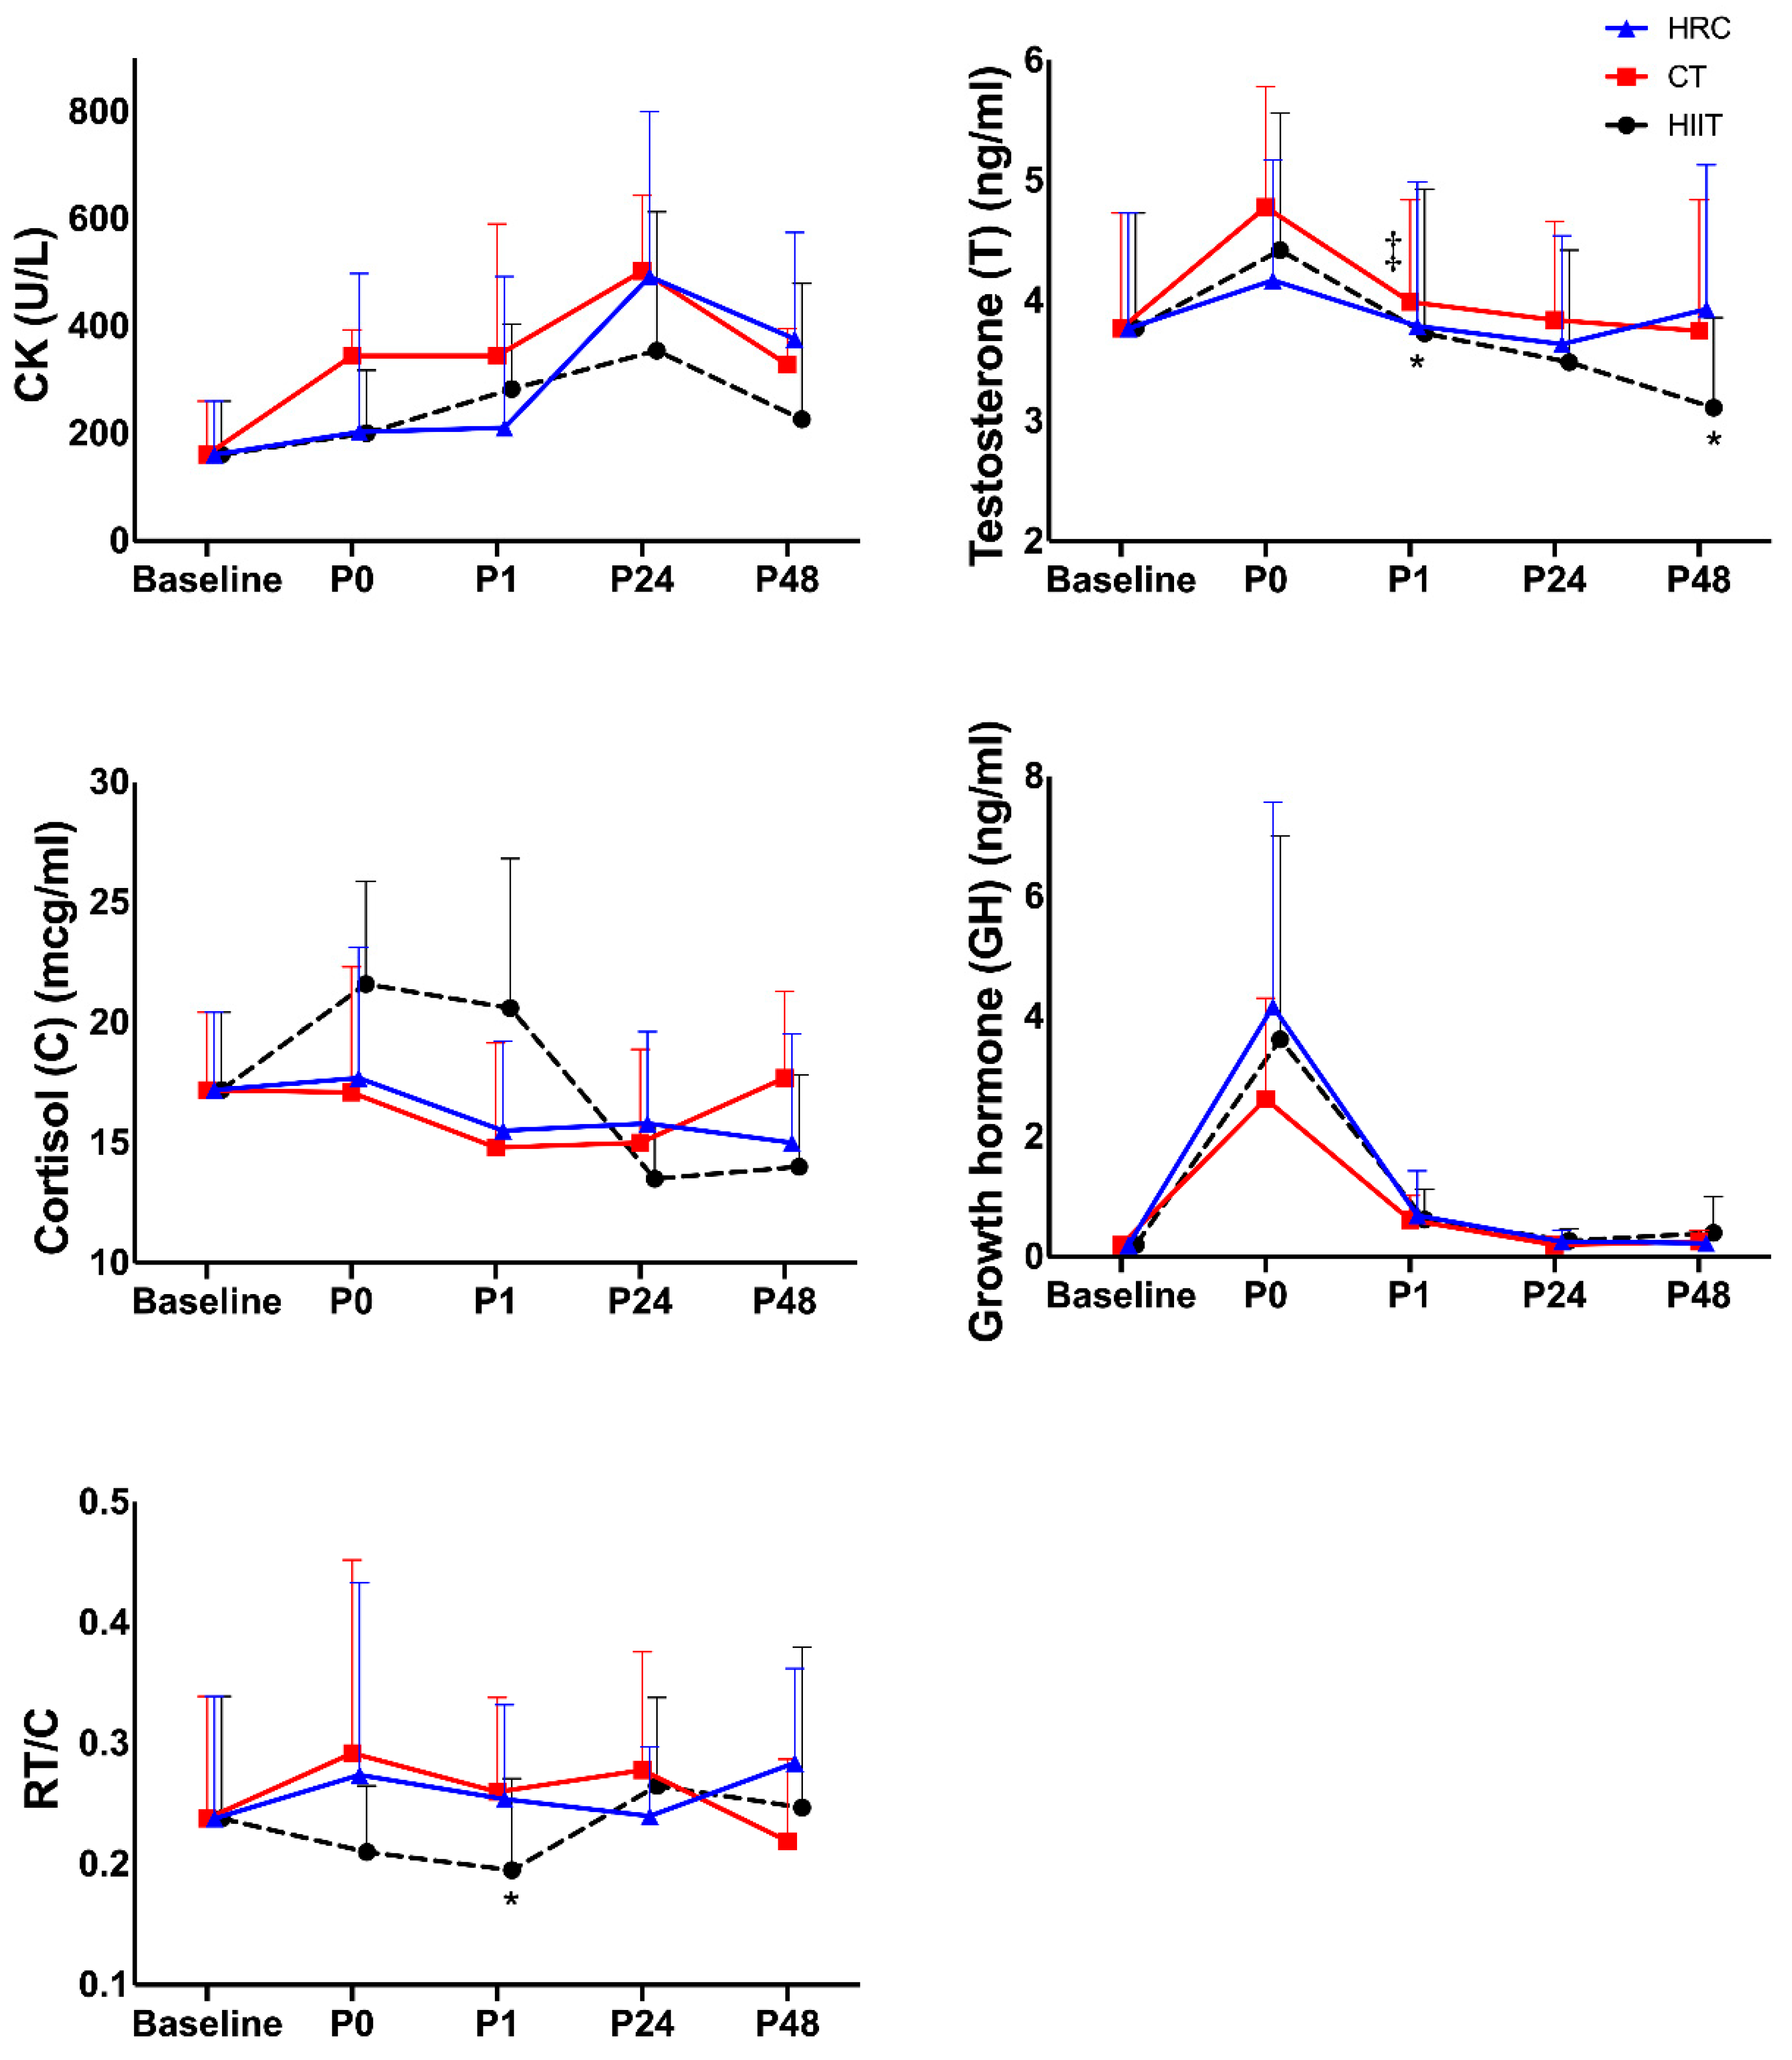
| Baseline | P0 | P1 | P24 | P48 | Time p-Value | Group p-Value | Interaction Time × Group p-Value | ||
|---|---|---|---|---|---|---|---|---|---|
| CK (UI/L) | HIIT | 161 (99.4) | 203 (117.0) | 211 (121.0) | 493 (258) | 377 (253.0) | 0.001 | 0.435 | 0.021 |
| CT | 161 (99.4) | 201 (48.5) | 283 (246.0) | 355 (1410) | 227 (67.1) | ||||
| HRC | 161 (99.4) | 251 (203.0) | 345 (282.0) | 394 (241.0) | 329 (198.0) | ||||
| η2 | 0.572 | 0.153 | 0.343 |
| Correlations | r | p-Value |
|---|---|---|
| ∆B-P0_CT_CK vs. B-P0_CT_TNF-α | 0.770 | 0.006 |
| ∆B-P0_HRC_CK vs. B-P0_HRC_C | 0.626 | 0.039 |
| ∆B-P0_CT_T vs. B-P0_CT_RT/C | 0.818 | 0.004 |
| ∆B-P0_CT_T vs. B-P0_CT_MYO | 0.998 | 0.035 |
| ∆B-P0_HRC_T vs. B-P0_HRC_GH | 0.570 | 0.067 |
| ∆B-P0_HIIT_C vs. B-P0_HIIT_IL-6 | 0.767 | 0.016 |
| ∆B-P0_CT_C vs. B-P0_CT_RT/C | −0.782 | 0.008 |
| ∆B-P0_HRC_C vs. B-P0_HRC_RT/C | −0.741 | 0.014 |
| ∆B-P1_HIIT_CK vs. B-P1_HIIT_TBARS | −0.664 | 0.051 |
| ∆B-P1_CT_CK vs. B-P1_CT_IL-6 | −0.722 | 0.028 |
| ∆B-P1_CT_T vs. B-P1_CT_C | −0.814 | 0.004 |
| ∆B-P1_CT_T vs. B-P1_CT_RT/C | 0.682 | 0.043 |
| ∆B-P1_HIIT_C vs. B-P1_HIIT_RT/C | −0.667 | 0.035 |
| ∆B-P1_HIIT_C vs. B-P1_HIIT_IL-6 | −0.683 | 0.029 |
| ∆B-P1_HIIT_C vs. B-P1_HIIT_TNF-α | 0.702 | 0.035 |
| ∆B-P1_HIIT_C vs. B-P1_HIIT_MYO | −0.679 | 0.044 |
| ∆B-P1_CT_C vs. B-P1_CT_RT/C | −0.957 | <0.001 |
| ∆B-P1_HRC_C vs. B-P1_HRC_GH | 0.583 | 0.060 |
| ∆B-P1_HRC_C vs. B-P1_HRC_RT/C | −0.742 | 0.014 |
| ∆B-P1_HRC_C vs. B-P1_HRC_MYO | −0.727 | 0.011 |
| ∆B-P24_HIIT_CK vs. B-P24_HIIT_C | −0.781 | 0.013 |
| ∆B-P24_HIIT_T vs. B-P24_HIIT_RT/C | 0.885 | 0.002 |
| ∆B-P24_HIIT_C vs. B-P24_HIIT_GH | −0.787 | 0.012 |
| ∆B-P24_HIIT_C vs. B-P24_HIIT_RT/C | −0.754 | 0.019 |
| ∆B-P24_HIIT_C vs. B-P24_HIIT_TNF-α | 0.834 | 0.010 |
| ∆B-P24_HRC_C vs. B-P24_HRC_GH | −0.599 | 0.052 |
| ∆B-P24_HRC_C vs. B-P24_HRC_RT/C | −0.911 | <0.01 |
| ∆B-P24_HRC_C vs. B-P24_HRC_TNF-α | 0.694 | 0.018 |
| ∆B-P24_HRC_C vs. B-P24_HRC_MYO | −0.566 | 0.076 |
| ∆B-P24_HRC_GH vs. B-P24_HRC_TNF | −0.648 | 0.031 |
| ∆B-P48_HIIT_C vs. B-P48_HIIT_RT/C | −0.980 | 0.001 |
| ∆B-P48_CT_C vs. B-P48_CT_GH | −0.614 | 0.045 |
| ∆B-P48_CT_C vs. B-P48_CT_RT/C | −0.896 | <0.01 |
| ∆B-P48_HRC_C vs. B-P48_HRC_RT/C | −0.930 | <0.01 |
| Baseline | P0 | P1 | P24 | P48 | Time p-Value | Group p-Value | Interaction Time × Group p-Value | ||
|---|---|---|---|---|---|---|---|---|---|
| T (ng/mL) | HIIT | 3.77 (0.96) | 4.42 (1.14) | 3.73 (1.20) | 3.49 (0.93) | 3.11 (0.75) | 0.004 | ||
| CT | 3.77 (0.96) | 4.78 (1.00) | 3.99 ‡ (0.85) | 3.84 (0.82) | 3.75 (1.09) | ||||
| HRC | 3.77 (0.96) | 4.17 (1.02) | 3.79 (1.25) * | 3.64 (0.92) | 3.93 (1.19) * | ||||
| η2 | |||||||||
| C (mcg/dL) | HIIT | 17.2 (3.22) | 21.6 (4.27) | 20.6 (6.23) | 13.5 (2.24) | 14.0 (3.83) | 0.016 | 0.429 | 0.034 |
| CT | 17.2 (3.22) | 17.1 (5.22) | 14.8 (4.35) | 15.0 (3.88) | 17.7 (3.60) | ||||
| HRC | 17.2 (3.22) | 17.7 (5.44) | 15.5 (3.72) | 15.8 (3.82) | 15.0 (4.53) | ||||
| η2 | 0.443 | 0.156 | 0.322 | ||||||
| GH (ng/mL) | HIIT | 0.20 (0.00) | 3.62 (3.38) | 0.62 (0.50) | 0.27 (0.20) | 0.40 (0.60) | <0.001 | ||
| CT | 0.20 (0.00) | 2.63 (1.68) | 0.61 (0.41) | 0.20 (0.00) | 0.26 (0.18) | ||||
| HRC | 0.20 (0.00) | 4.16 (3.41) | 0.69 (0.74) | 0.26 (0.18) | 0.23 (0.09) | ||||
| η2 | |||||||||
| RT/C | HIIT | 0.237 (0.10) | 0.210 (0.06) | 0.195 (0.08) | 0.267 (0.07) | 0.247 (0.13) | 0.188 | ||
| CT | 0.237 (0.10) | 0.292 (0.16) | 0.260 (0.08) | 0.279 (0.10) | 0.219 (0.07) | ||||
| HRC | 0.237 (0.10) | 0.274 (0.16) | 0.254 (0.08) * | 0.239 (0.06) | 0.284 (0.08) | ||||
| η2 |
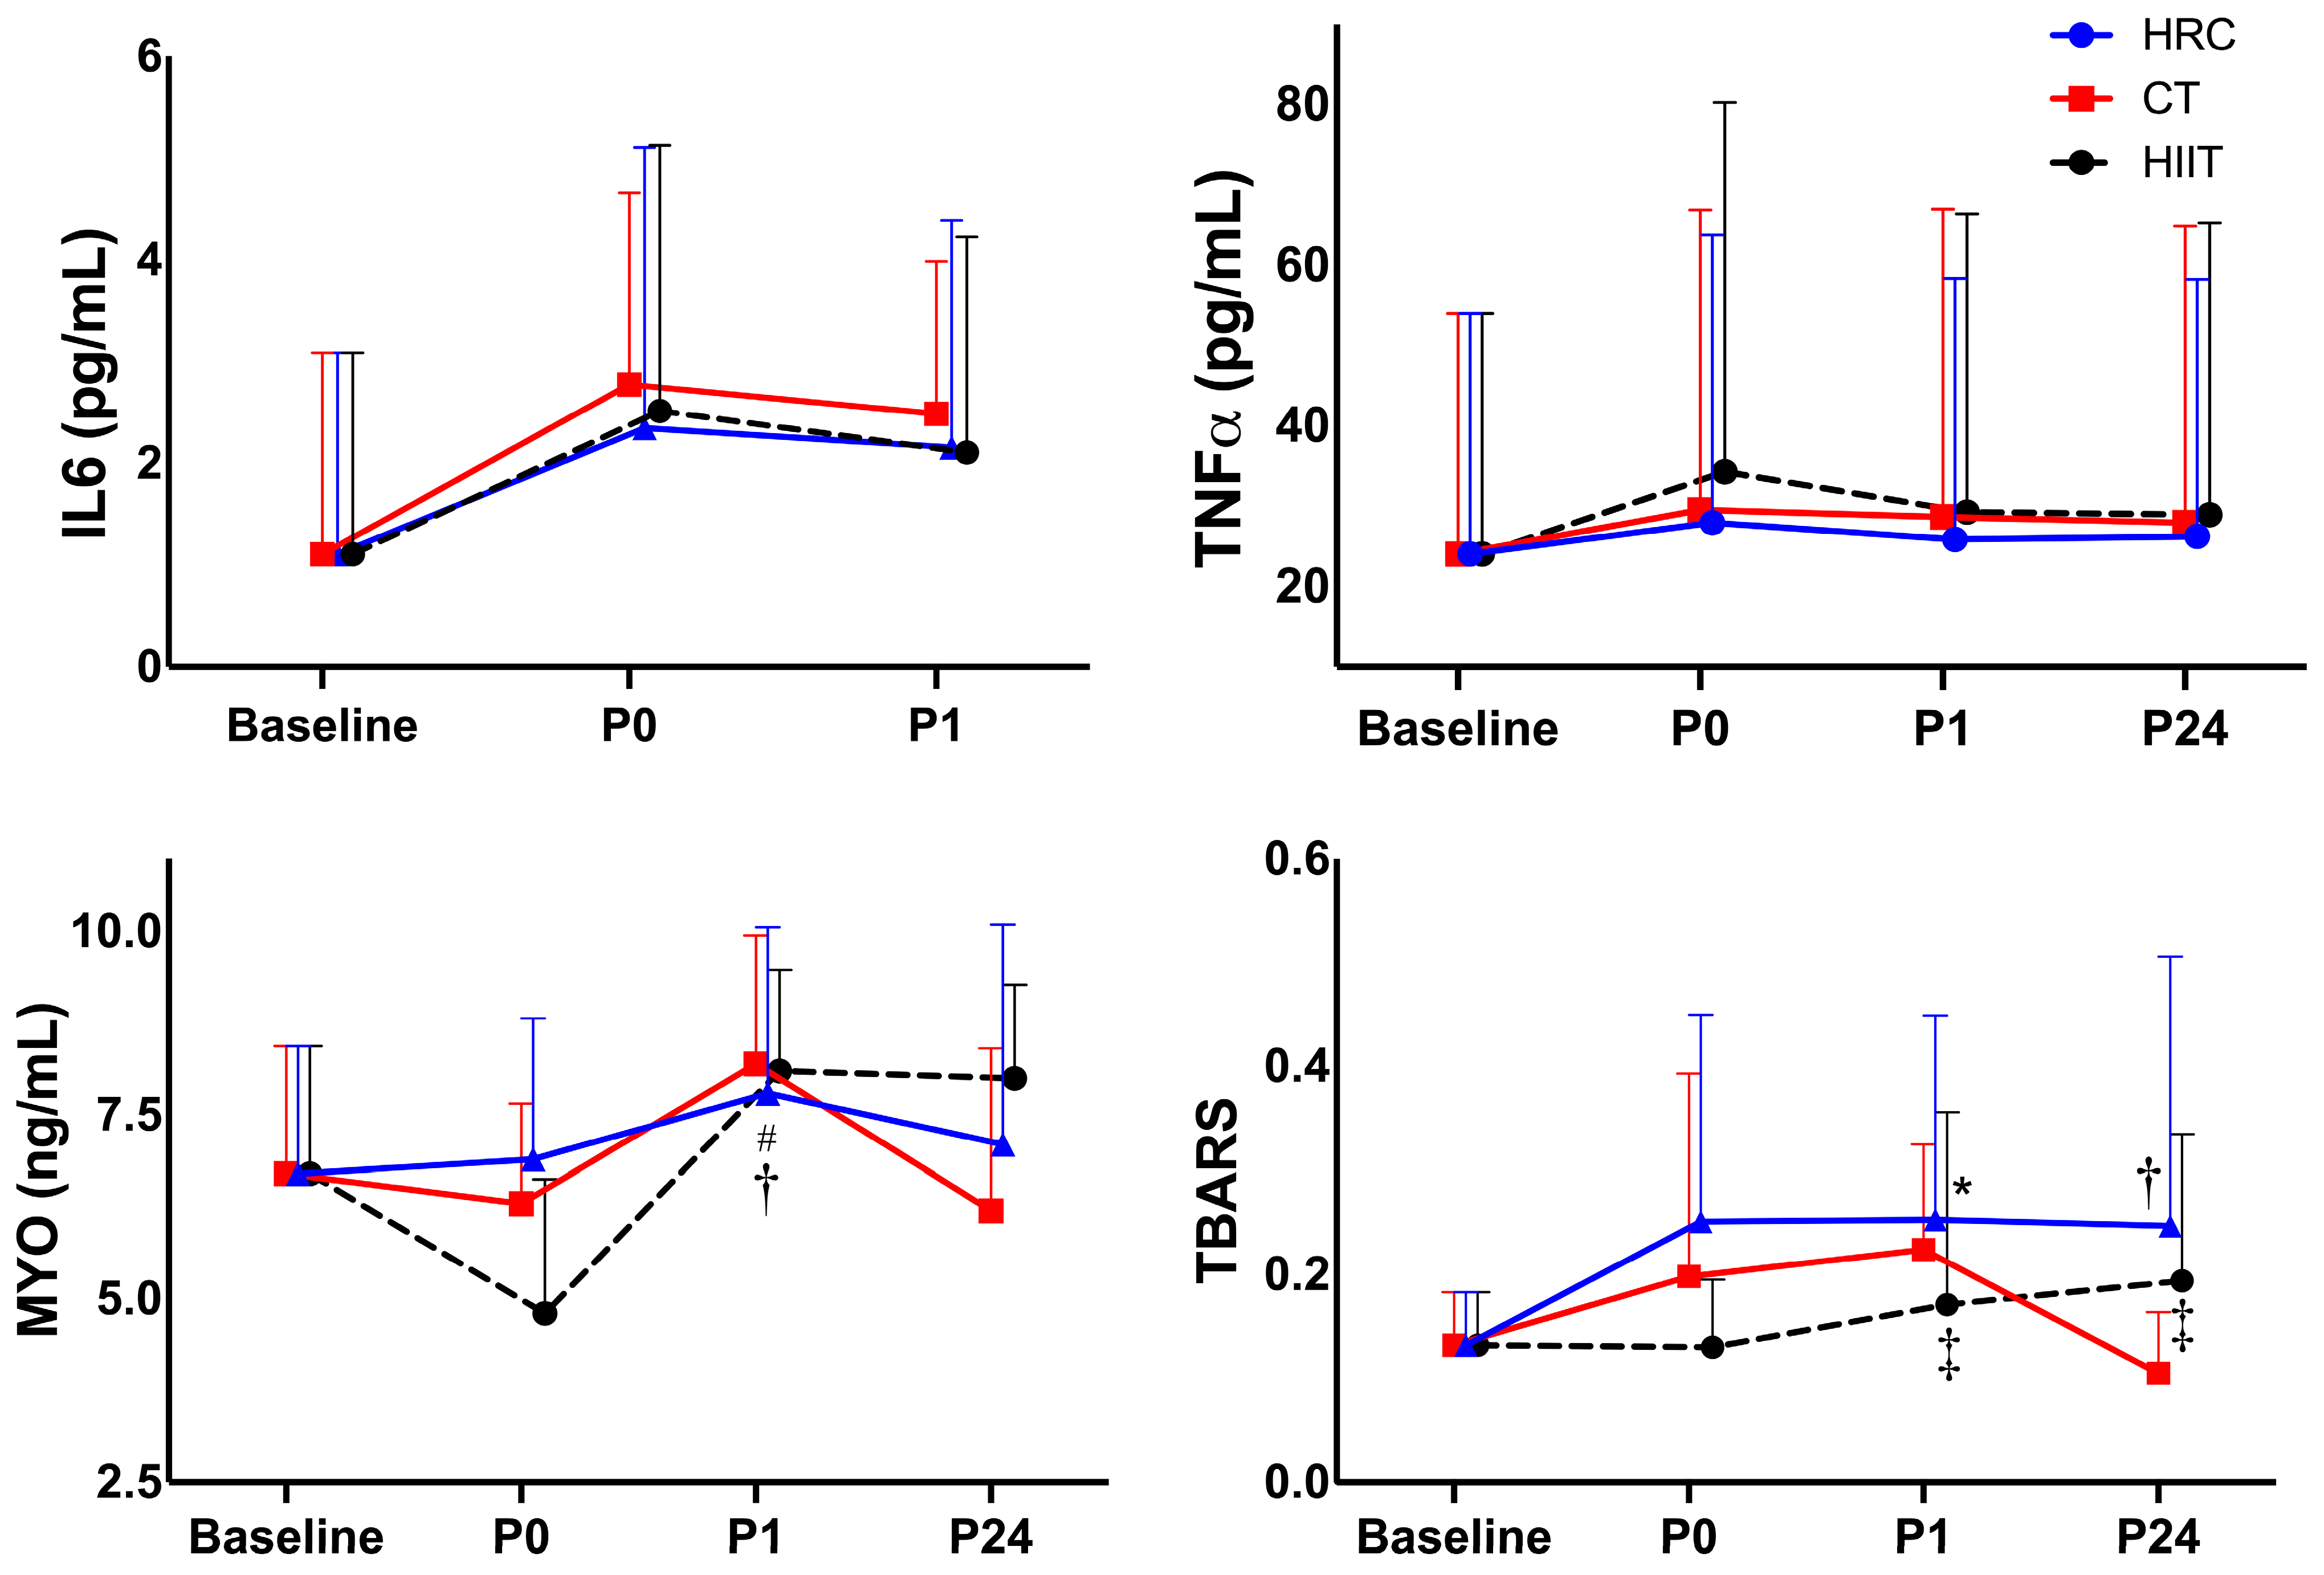
| Baseline | P0 | P1 | P24 | Time p-Value | Group p-Value | Interaction Time × Group p-Value | ||
|---|---|---|---|---|---|---|---|---|
| hs-IL-6 (pg/mL) | HIIT | 1.11 (1.98) | 2.52 (2.61) | 2.10 (2.12) | <0.001 | |||
| CT | 1.11 (1.98) | 2.78 (2.19) | 2.49 (1.50) | |||||
| HRC | 1.11 (1.98) | 2.35 (2.76) | 2.16 (2.23) | |||||
| η2 | ||||||||
| TNF-α (pg/mL) | HIIT | 24.1 (29.9) | 34.3 (46.0) | 29.3 (37.1) | 29.0 (36.3) | 0.158 | ||
| CT | 24.1 (29.9) | 29.6 (37.3) | 25.9 (32.5) | 28.0 (36.9) | ||||
| HRC | 24.1 (29.9) | 28.0 (35.8) | 25.9 (32.5) | 26.3 (32.0) | ||||
| η2 | ||||||||
| MYO (ng/mL) | HIIT | 6.66 (1.74) | 4.81 (1.83) | 8.13 (1.38) | 8.03 (1.28) | 0.056 | ||
| CT | 6.66 (1.74) | 6.29 (1.36) | 8.25 (1.75) | 6.17 (2.21) | ||||
| HRC | 6.66 (1.74) | 6.93 (1.92) | 7.83 (2.26) †# | 7.06 (3.00) | ||||
| η2 | ||||||||
| TBARS (µM) | HIIT | 0.132 (0.05) | 0.130 (0.07) ‡ | 0.171 (0.19) ‡ | 0.194 (0.14) | <0.001 | ||
| CT | 0.132 (0.05) | 0.198 (0.20) | 0.224 (0.10) | 0.105 (0.06) | ||||
| HRC | 0.132 (0.05) | 0.251 (0.20) * | 0.253 (0.20) † | 0.247 (0.26) | ||||
| η2 |
Disclaimer/Publisher’s Note: The statements, opinions and data contained in all publications are solely those of the individual author(s) and contributor(s) and not of MDPI and/or the editor(s). MDPI and/or the editor(s) disclaim responsibility for any injury to people or property resulting from any ideas, methods, instructions or products referred to in the content. |
© 2025 by the authors. Licensee MDPI, Basel, Switzerland. This article is an open access article distributed under the terms and conditions of the Creative Commons Attribution (CC BY) license (https://creativecommons.org/licenses/by/4.0/).
Share and Cite
Martínez-Noguera, F.J.; Chung, L.H.; Guadalupe-Grau, A.; Montoro-García, S.; Alcaraz, P.E. Comparison of Hormonal, Inflammatory, Muscle Damage and Oxidative Stress Biomarkers Changes in Response to High-Intensity Interval, Circuit and Concurrent Exercise Bouts. Sports 2025, 13, 184. https://doi.org/10.3390/sports13060184
Martínez-Noguera FJ, Chung LH, Guadalupe-Grau A, Montoro-García S, Alcaraz PE. Comparison of Hormonal, Inflammatory, Muscle Damage and Oxidative Stress Biomarkers Changes in Response to High-Intensity Interval, Circuit and Concurrent Exercise Bouts. Sports. 2025; 13(6):184. https://doi.org/10.3390/sports13060184
Chicago/Turabian StyleMartínez-Noguera, Francisco Javier, Linda H. Chung, Amelia Guadalupe-Grau, Silvia Montoro-García, and Pedro E. Alcaraz. 2025. "Comparison of Hormonal, Inflammatory, Muscle Damage and Oxidative Stress Biomarkers Changes in Response to High-Intensity Interval, Circuit and Concurrent Exercise Bouts" Sports 13, no. 6: 184. https://doi.org/10.3390/sports13060184
APA StyleMartínez-Noguera, F. J., Chung, L. H., Guadalupe-Grau, A., Montoro-García, S., & Alcaraz, P. E. (2025). Comparison of Hormonal, Inflammatory, Muscle Damage and Oxidative Stress Biomarkers Changes in Response to High-Intensity Interval, Circuit and Concurrent Exercise Bouts. Sports, 13(6), 184. https://doi.org/10.3390/sports13060184