Workout Duration Alters the Importance of Predictive Traits on High-Intensity Functional Training Workout Performance

 ,
, 
 , ,
, ,
Abstract
1. Introduction
2. Materials and Methods
2.1. Participants
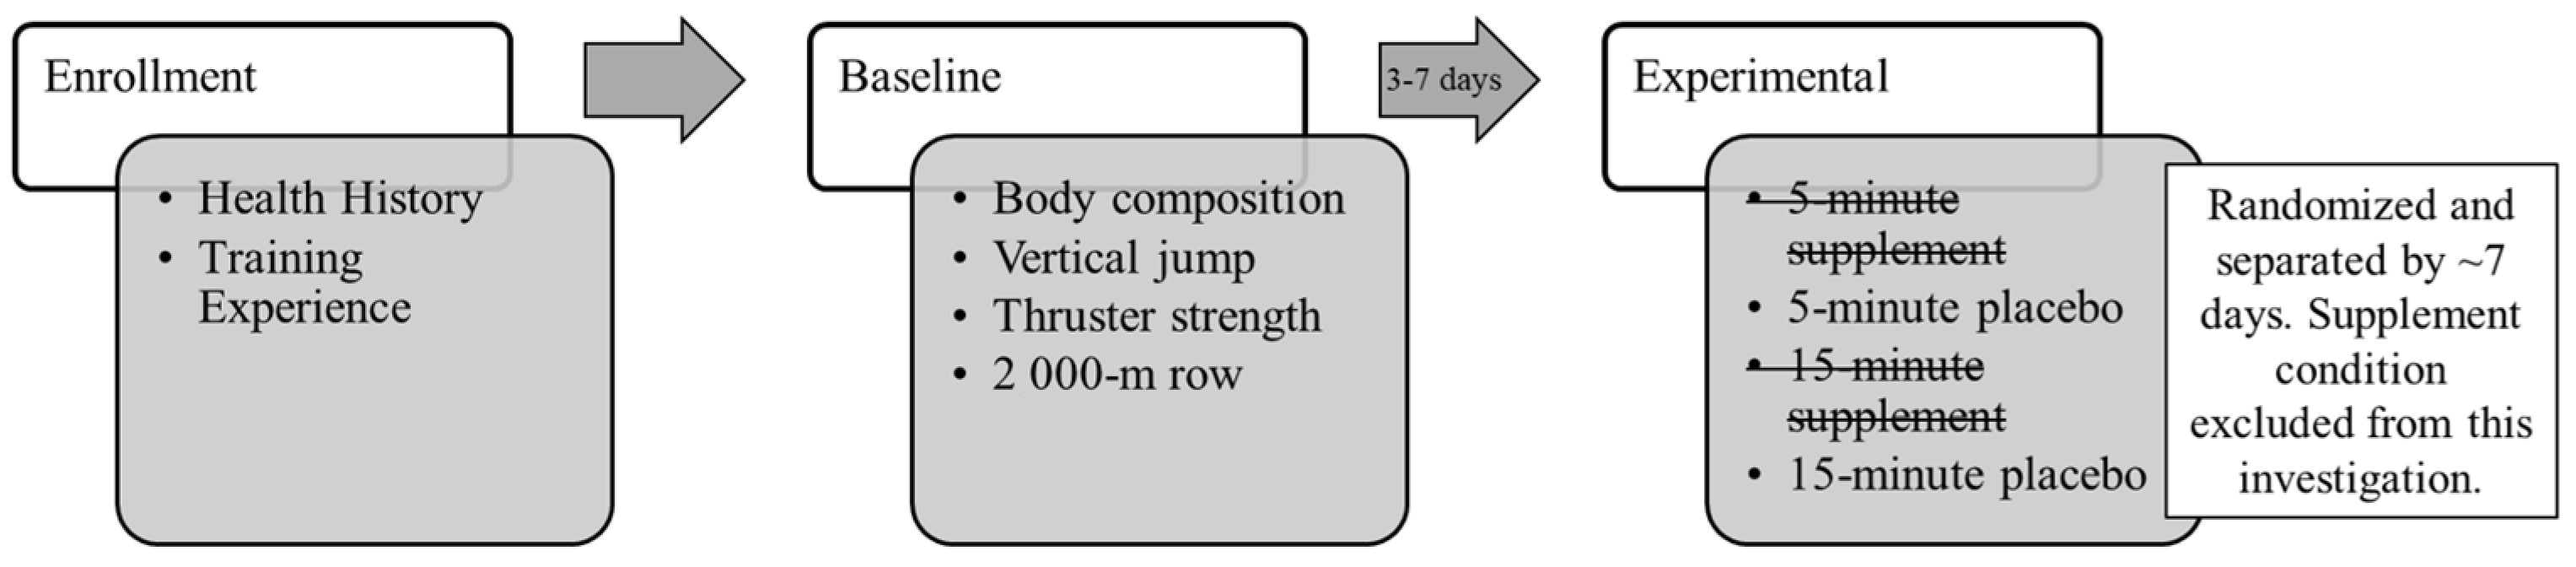
2.2. Study Design
2.3. Baseline Testing
2.4. Workout Protocol and Kinetics Assessments
2.5. Statistical Analysis
3. Results
3.1. Age and Training Experience
3.2. Body Composition
3.3. Performance Measures
4. Discussion
5. Conclusions
Author Contributions
Funding
Institutional Review Board Statement
Informed Consent Statement
Data Availability Statement
Conflicts of Interest
Abbreviations
| AMRAP | As many repetitions as possible |
| BF% | Body fat percentage |
| CSCS | Certified strength and conditioning specialist |
| CV | Coefficient of variation |
| HIFT | High-intensity functional training |
| RFD | Rate of force development |
| RM | Repetition maximum |
References
- Haff, G.G. Periodization. In Essentials of Strength Training and Conditioning, 4th ed.; Haff, G.G., Triplett, N.T., Eds.; Human Kinetics, Inc.: Champaign, IL, USA, 2015; pp. 583–604. [Google Scholar]
- Reuter, B.; Dawes, J.J. Program Design and Technique for Aerobic Endurance Training. In Essentials of Strength Training and Conditioning; Haff, G., Triplett, N., Eds.; Human Kinetics: Champaign, IL, USA, 2016; pp. 559–582. [Google Scholar]
- Sheppard, J.M.; Triplett, N.T. Program Design for Resistance Training. In Essentials of Strength Training and Conditioning, 4th ed.; Haff, G.G., Triplett, N.T., Eds.; Human Kinetics: Champaign, IL, USA, 2015; pp. 439–469. [Google Scholar]
- Suchomel, T.J.; Nimphius, S.; Stone, M.H. The importance of muscular strength in athletic performance. Sports Med. 2016, 46, 1419–1449. [Google Scholar] [CrossRef]
- Feito, Y.; Heinrich, K.; Butcher, S.; Poston, W. High-Intensity Functional Training (HIFT): Definition and Research Implications for Improved Fitness. Sports 2018, 6, 76. [Google Scholar] [CrossRef] [PubMed]
- McDougle, J.M.; Mangine, G.T.; Townsend, J.R.; Jajtner, A.R.; Feito, Y. Acute physiological outcomes of high-intensity functional training: A scoping review. PeerJ 2023, 11, e14493. [Google Scholar] [CrossRef]
- Mangine, G.T.; Seay, T.R. Quantifying CrossFit®: Potential solutions for monitoring multimodal workloads and identifying training targets. Front. Sports Act. Living 2022, 4, 949429. [Google Scholar] [CrossRef]
- Mangine, G.T.; Tankersley, J.E.; McDougle, J.M.; Velazquez, N.; Roberts, M.D.; Esmat, T.A.; VanDusseldorp, T.A.; Feito, Y. Predictors of CrossFit Open performance. Sports 2020, 8, 102. [Google Scholar] [CrossRef] [PubMed]
- Meier, N.; Schlie, J.; Schmidt, A. CrossFit®:‘Unknowable’or Predictable?—A Systematic Review on Predictors of CrossFit® Performance. Sports 2023, 11, 112. [Google Scholar] [CrossRef] [PubMed]
- Serafini, P.R.; Feito, Y.; Mangine, G.T. Self-reported measures of strength and sport-specific skills distinguish ranking in an international online fitness competition. J. Strength Cond. Res. 2018, 32, 3474–3484. [Google Scholar] [CrossRef]
- Butcher, S.J.; Neyedly, T.J.; Horvey, K.J.; Benko, C.R. Do physiological measures predict selected CrossFit® benchmark performance? Open Access J. Sports Med. 2015, 6, 241. [Google Scholar] [CrossRef]
- Dexheimer, J.D.; Schroeder, E.T.; Sawyer, B.J.; Pettitt, R.W.; Torrence, W.A. Total Body Strength Predicts Workout Performance in a Competitive Fitness Weightlifting Workout. J. Exerc. Physiol. Online 2020, 23, 95–104. [Google Scholar]
- Mangine, G.T.; McDougle, J.M. CrossFit® open performance is affected by the nature of past competition experiences. BMC Sports Sci. Med. Rehabil. 2022, 14, 46. [Google Scholar] [CrossRef]
- Mangine, G.T.; Mcdougle, J.M.; Feito, Y. Relationships Between Body Composition and” Fran” Performance are Modulated by Competition Class and Skill. Front. Physiol. 2022, 3, 893771. [Google Scholar]
- Martínez-Gómez, R.; Valenzuela, P.L.; Alejo, L.B.; Gil-Cabrera, J.; Montalvo-Pérez, A.; Talavera, E.; Lucia, A.; Moral-González, S.; Barranco-Gil, D. Physiological Predictors of Competition Performance in CrossFit Athletes. Int. J. Environ. Res. Public Health 2020, 17, 3699. [Google Scholar] [CrossRef]
- Zeitz, E.K.; Cook, L.F.; Dexheimer, J.D.; Lemez, S.; Leyva, W.D.; Terbio, I.Y.; Tran, J.R.; Jo, E. The relationship between Crossfit® performance and laboratory-based measurements of fitness. Sports 2020, 8, 112. [Google Scholar] [CrossRef]
- Dexheimer, J.D.; Schroeder, E.T.; Sawyer, B.J.; Pettitt, R.W.; Aguinaldo, A.L.; Torrence, W.A. Physiological Performance Measures as Indicators of CrossFit® Performance. Sports 2019, 7, 93. [Google Scholar] [CrossRef]
- Martinho, D.V.; Rebelo, A.; Gouveia, É.R.; Field, A.; Costa, R.; Ribeiro, A.S.; Casonatto, J.; Amorim, C.; Sarmento, H. The physical demands and physiological responses to CrossFit®: A scoping review with evidence gap map and meta-correlation. BMC Sports Sci. Med. Rehabil. 2024, 16, 196. [Google Scholar] [CrossRef]
- Toledo, R.; Dias, M.R.; Toledo, R.; Erotides, R.; Pinto, D.S.; Reis, V.M.; Novaes, J.S.; Vianna, J.M.; Heinrich, K.M. Comparison of Physiological Responses and Training Load between Different CrossFit® Workouts with Equalized Volume in Men and Women. Life 2021, 11, 586. [Google Scholar] [CrossRef]
- King, W.; Staples, C.; Fanno, J.; Hines, A.; Henley, J.; Chaves, W.; Grazer, J.; Esmat, T.; McLester, J. Acute Metabolic and Perceptive Responses to a Multi-Ingredient Pre-Workout Supplement and CrossFit®-Style Exercise. 2024. Available online: https://www.researchgate.net/publication/391839229_ACUTE_METABOLIC_AND_PERCEPTIVE_RESPONSES_TO_A_MULTI-_INGREDIENT_PRE-WORKOUT_SUPPLEMENT_AND_CROSSFITR-_STYLE_EXERCISE?channel=doi&linkId=6828d43bdf0e3f544f5509f6&showFulltext=true (accessed on 7 March 2025).
- Wang, Z.; Deurenberg, P.; Guo, S.S.; Pietrobelli, A.; Wang, J.; Pierson, R., Jr.; Heymsfield, S.B. Six-compartment body composition model: Inter-method comparisons of total body fat measurement. Int. J. Obes. 1998, 22, 329. [Google Scholar] [CrossRef]
- Mangine, G.T.; VanDusseldorp, T.A.; Hester, G.M.; Julian, J.M.; Feito, Y. The addition of β-Hydroxy β-Methylbutyrate (HMB) to creatine monohydrate supplementation does not improve anthropometric and performance maintenance across a collegiate rugby season. J. Int. Soc. Sports Nutr. 2020, 17, 28. [Google Scholar] [CrossRef]
- Harman, E.A.; Rosenstein, M.T.; Frykman, P.N.; Rosenstein, R.M.; Kraemer, W.J. Estimation of human power output from vertical jump. J. Strength Cond. Res. 1991, 5, 116–120. [Google Scholar]
- CrossFit. Open Workouts. In CrossFit Games; CrossFit: Santa Cruz, CA, USA, 2021. [Google Scholar]
- Brzycki, M. Strength testing—Predicting a one-rep max from reps-to-fatigue. J. Phys. Educ. Recreat. Danc. 1993, 64, 88–90. [Google Scholar] [CrossRef]
- Mangine, G.T.; Cebulla, B.; Feito, Y. Normative values for self-reported benchmark workout scores in CrossFit® practitioners. Sports Med.-Open 2018, 4, 39. [Google Scholar] [CrossRef] [PubMed]
- Mangine, G.T.; Grundlingh, N.; Feito, Y. Normative Scores for CrossFit® Open Workouts: 2011–2022. Sports 2023, 11, 24. [Google Scholar] [CrossRef] [PubMed]
- Mangine, G.T.; Hines, A.; Grazer, J.; Esmat, T.A.; McLester, J. Can Video Annotation Software With Minimal Standardization Be Used as a Back-Up for a Marker-Free Motion Tracking System when Monitoring Barbell Thruster Velocity During a Repeated Circuit? J. Strength Cond. Res. 2022, 39, 147–155. [Google Scholar]
- Mangine, G.T.; Feito, Y.; Tankersley, J.E.; McDougle, J.M.; Kliszczewicz, B.M. Workout Pacing Predictors of Crossfit Open Performance: A Pilot Study. J. Hum. Kinet. 2021, 78, 89–100. [Google Scholar] [CrossRef]
- Mangine, G.T.; Zeitz, E.K.; Dexheimer, J.D.; Hines, A.; Lively, B.; Kliszczewicz, B.M. Pacing Strategies Differ by Sex and Rank in 2020 CrossFit®Open Tests. Sports 2023, 11, 199. [Google Scholar] [CrossRef]
- Mangine, G.T.; Zeitz, E.K.; Dexheimer, J.D.; Hines, A.; Lively, B.; Kliszczewicz, B.M. The influence of sex-division, experience, and pacing strategy on performance in the 2020 CrossFit® Open. Front. Sports Act. Living 2024, 6, 1344036. [Google Scholar] [CrossRef]
- Hopkins, W.; Marshall, S.; Batterham, A.; Hanin, J. Progressive statistics for studies in sports medicine and exercise science. Med. Sci. Sports Exerc. 2009, 41, 3. [Google Scholar] [CrossRef]
- Meng, X.-L.; Rosenthal, R.; Rubin, D.B. Comparing correlated correlation coefficients. Psychol. Bull. 1992, 111, 172. [Google Scholar] [CrossRef]
- Leitão, L.; Dias, M.; Campos, Y.; Vieira, J.G.; Sant’Ana, L.; Telles, L.G.; Tavares, C.; Mazini, M.; Novaes, J.; Vianna, J. Physical and Physiological Predictors of FRAN CrossFit(®) WOD Athlete’s Performance. Int. J. Environ. Res. Public Health 2021, 18, 4070. [Google Scholar] [CrossRef]
- Herda, T.; Cramer, J. Bioenergetics of Exercise and Training. In Essentials of Strength Training and Conditioning; Haff, G., Triplett, N., Eds.; Human Kinetics: Champaign, IL, USA, 2016; pp. 43–64. [Google Scholar]
- Feito, Y.; Giardina, M.J.; Butcher, S.; Mangine, G.T. Repeated anaerobic tests predict performance among a group of advanced CrossFit-trained athletes. Appl. Physiol. Nutr. Metab. 2018, 44, 727–735. [Google Scholar] [CrossRef]
- Bellar, D.; Hatchett, A.; Judge, L.; Breaux, M.; Marcus, L. The relationship of aerobic capacity, anaerobic peak power and experience to performance in CrossFit exercise. Biol. Sport 2015, 32, 315–320. [Google Scholar] [CrossRef] [PubMed]
- Ingham, S.; Whyte, G.; Jones, K.; Nevill, A. Determinants of 2000 m rowing ergometer performance in elite rowers. Eur. J. Appl. Physiol. 2002, 88, 243–246. [Google Scholar] [PubMed]
- Rauter, G.; Sigrist, R.; Koch, C.; Crivelli, F.; van Raai, M.; Riener, R.; Wolf, P. Transfer of complex skill learning from virtual to real rowing. PLoS ONE 2013, 8, e82145. [Google Scholar] [CrossRef] [PubMed]
- Taber, C.B.; Vigotsky, A.; Nuckols, G.; Haun, C.T. Exercise-induced myofibrillar hypertrophy is a contributory cause of gains in muscle strength. Sports Med. 2019, 49, 993–997. [Google Scholar] [CrossRef]
- Leaderboard. Available online: http://games.crossfit.com/leaderboard (accessed on 7 March 2025).
- Moeskops, S.; Oliver, J.L.; Read, P.J.; Cronin, J.B.; Myer, G.D.; Lloyd, R.S. The physiological demands of youth artistic gymnastics: Applications to strength and conditioning. Strength Cond. J. 2019, 41, 1–13. [Google Scholar] [CrossRef]


| Mean ± SD | (Range) | |
|---|---|---|
| Experience (years) | ||
| Age | 29.3 ± 7.1 | (18.4–42.9) |
| Resistance training | 11.1 ± 5.8 | (5.0–30.0) |
| Gymnastics | 1.6 ± 2.5 | (0.0–7.0) |
| High-intensity functional training | 5.9 ± 2.8 | (2.0–12.0) |
| Body composition | ||
| Height (m) | 171 ± 7 | (159–191) |
| Body mass (kg) | 80.5 ± 15.6 | (53.2–108.3) |
| Fat mass (kg) | 14.6 ± 6.3 | (5.1–27.7) |
| Fat-free mass (kg) | 65.9 ± 13.5 | (44.0–92.2) |
| Body fat percentage (%) | 18.1 ± 6.5 | (5.6–28.5) |
| Vertical jump performance | ||
| Height (m) | 0.49 ± 0.15 | (0.28–0.73) |
| Estimated average power (Watts) | 1564 ± 479 | (669–2292) |
| Estimated barbell thruster strength | ||
| Absolute (kg) | 75.1 ± 21.9 | (43.2–123.6) |
| Relative (kg body mass−1) | 0.93 ± 0.17 | (0.66–1.23) |
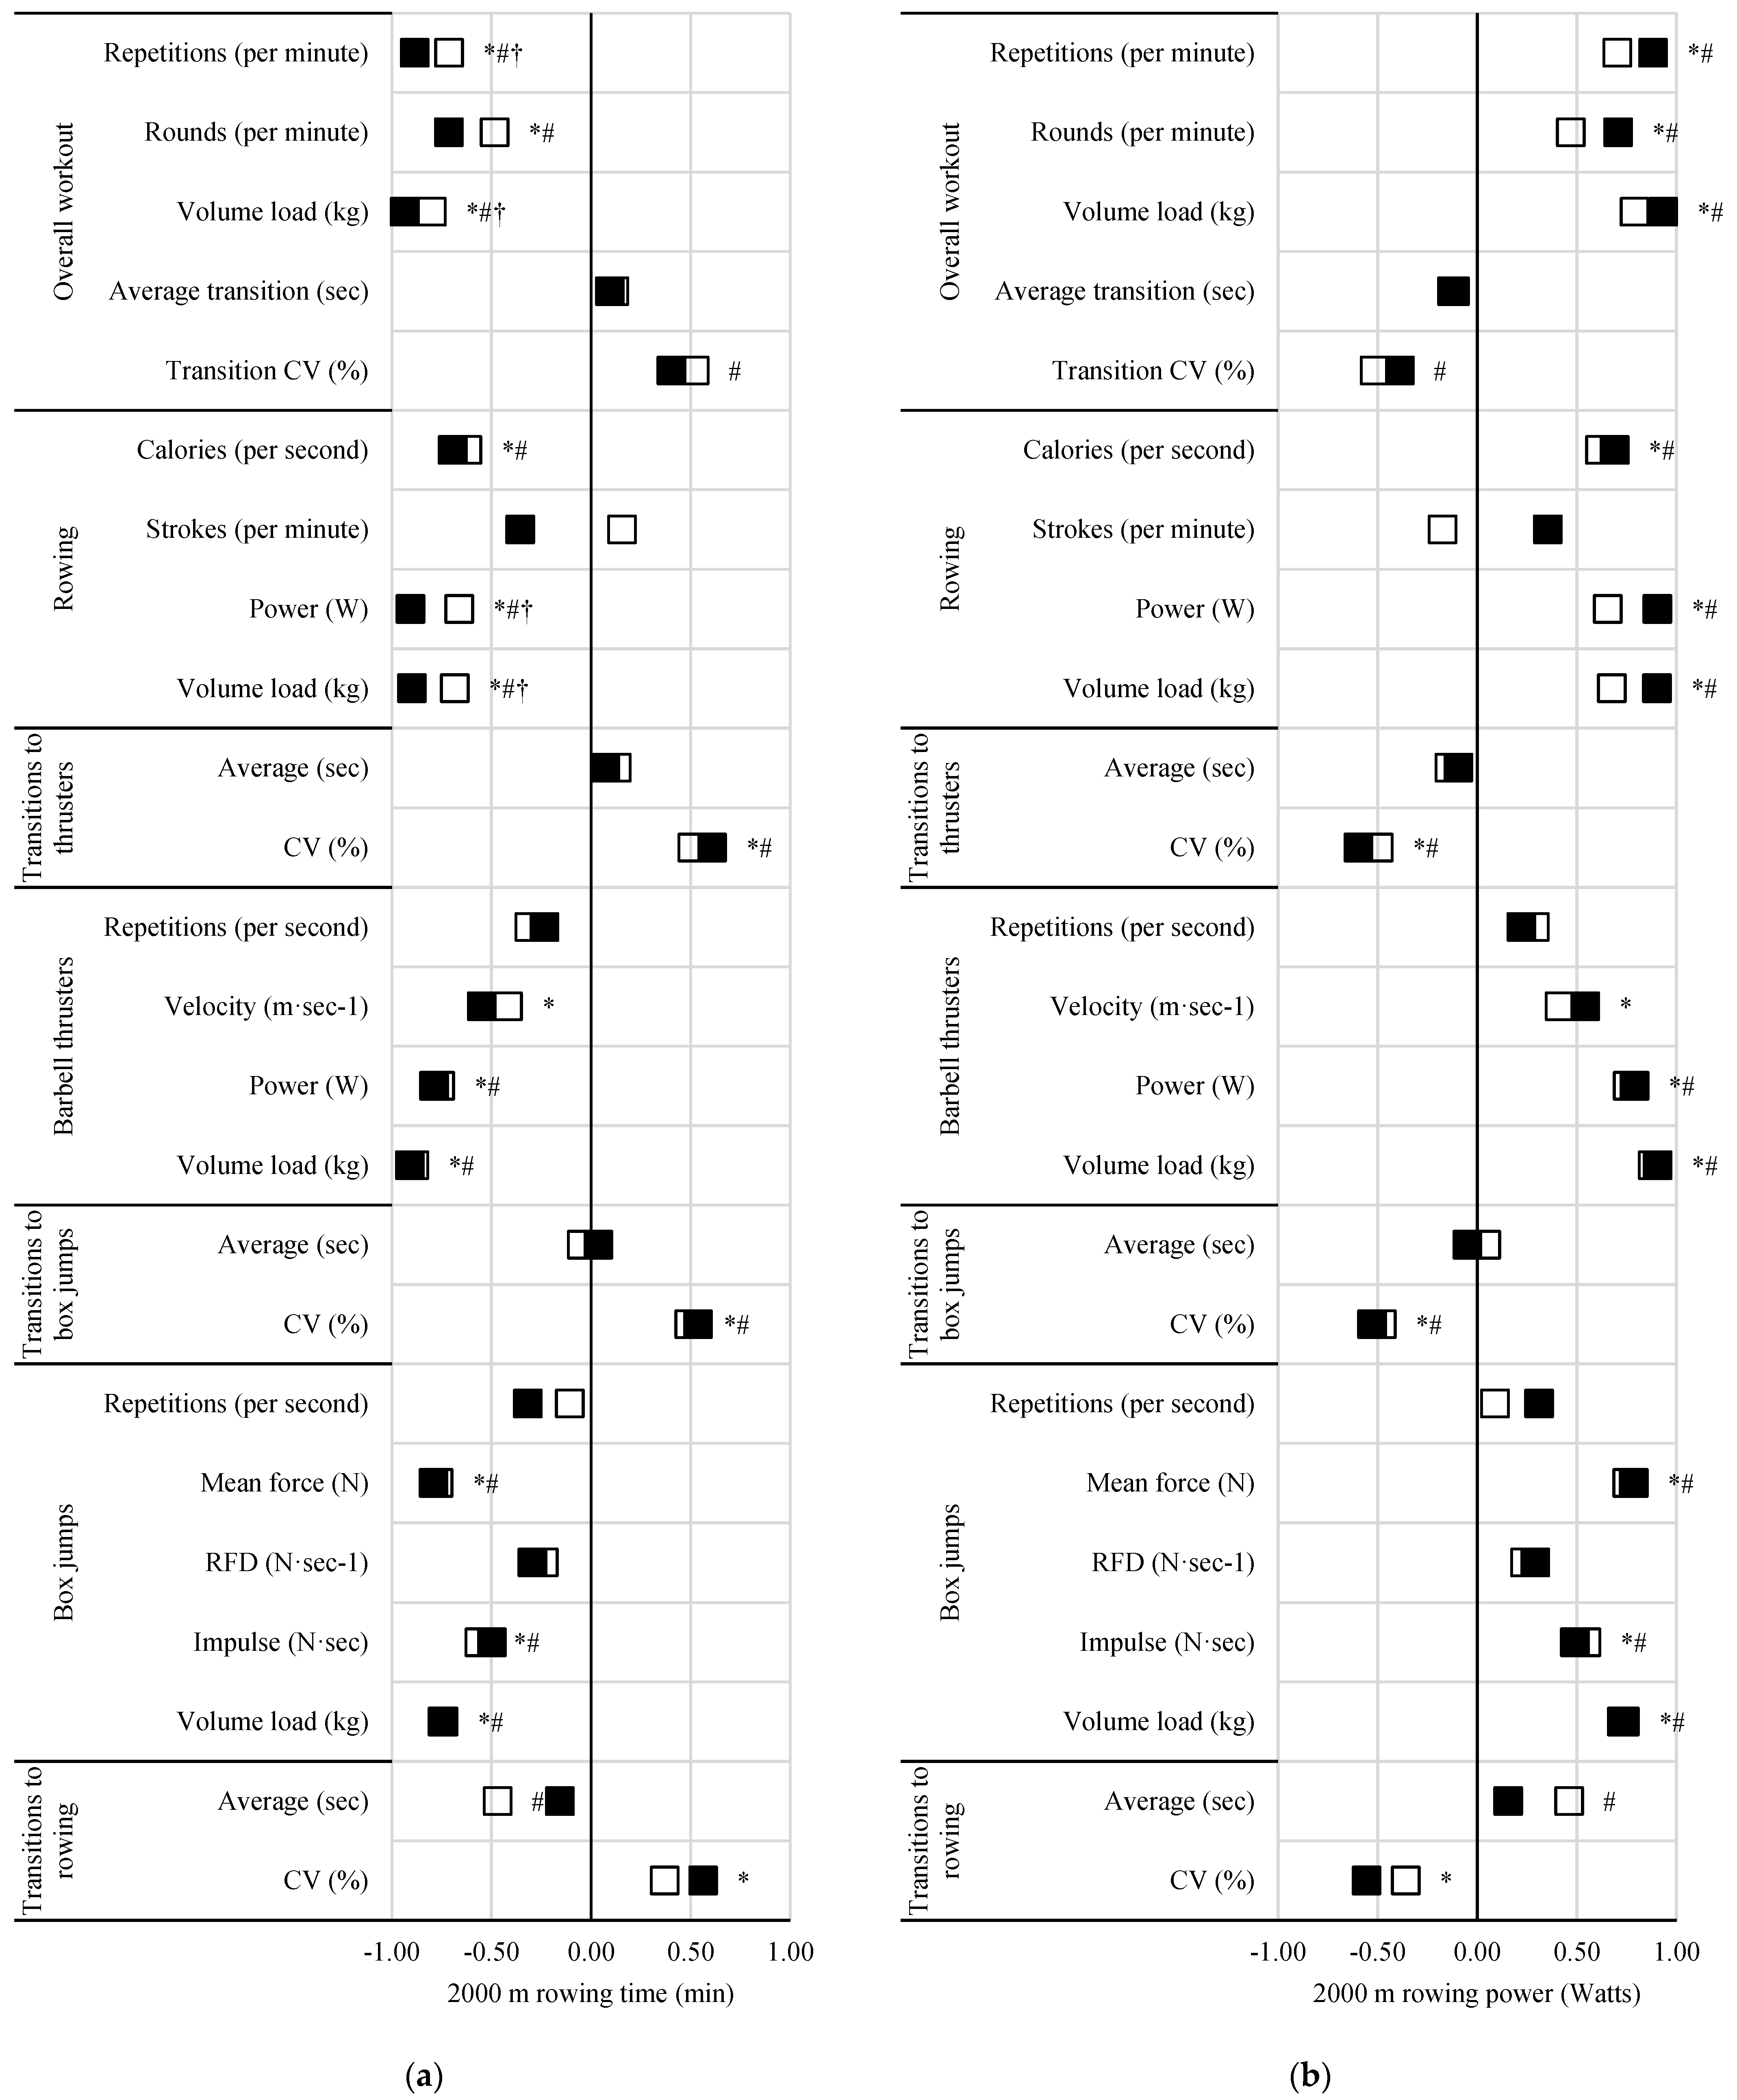
| 2000 m rowing performance | ||
| Completion time (minutes) | 7.95 ± 0.71 | (6.73–9.26) |
| Average power (Watts) | 216 ± 56 | (131–340) |
| 5 min | 15 min | |||
|---|---|---|---|---|
| Mean ± SD | (Range) | Mean ± SD | (Range) | |
| Overall performance | ||||
| Repetitions (per minute) | 15.5 ± 2.5 | (11.0–21.6) | 12.4 ± 2 | (8.9–17.1) |
| Rounds (per minute) | 0.91 ± 0.12 | (0.69–1.20) | 0.72 ± 0.11 | (0.54–0.95) |
| Volume load (kg) | 5970 ± 1514 | (3396–9389) | 13,032 ± 3253 | (7285–21,235) |
| Average transition time (seconds) | 19.06 ± 2.53 | (13.80–24.60) | 22.13 ± 3.32 | (17.33–29.40) |
| Transition time coefficient of variation (%) | 0.13 ± 0.06 | (0.02–0.26) | 0.22 ± 0.05 | (0.08–0.28) |
| Rowing performance | ||||
| Calories (per second) | 0.38 ± 0.07 | (0.23–0.47) | 0.26 ± 0.05 | (0.15–0.36) |
| Strokes (per minute) | 31.4 ± 4.3 | (23.2–40.6) | 26.1 ± 4.1 | (13.5–34.6) |
| Average power (Watts) | 270 ± 75 | (157–409) | 183 ± 54 | (65–287) |
| Volume load (kg) | 3181 ± 757 | (1958–4521) | 6226 ± 1845 | (2200–10,503) |
| Transitions to barbell thrusters | ||||
| Average time (seconds) | 8.26 ± 1.30 | (6.60–11.40) | 9.22 ± 1.40 | (7.00–12.80) |
| Coefficient of variation (%) | 0.31 ± 0.19 | (0.05–0.83) | 0.59 ± 0.19 | (0.16–0.98) |
| Barbell thrusters performance | ||||
| Repetitions (per second) | 0.46 ± 0.08 | (0.28–0.63) | 0.43 ± 0.07 | (0.30–0.55) |
| Average velocity (m·sec−1) | 1.18 ± 0.18 | (0.73–1.58) | 1.18 ± 0.17 | (0.74–1.48) |
| Average power (Watts) | 434 ± 124 | (211–666) | 430 ± 117 | (213–624) |
| Volume load (kg) | 988 ± 276 | (531–1551) | 2372 ± 557 | (1415–3620) |
| Transitions to box jumps | ||||
| Average time (seconds) | 4.14 ± 0.94 | (2.20–7.20) | 5.22 ± 1.76 | (3.20–10.13) |
| Coefficient of variation (%) | 0.42 ± 0.21 | (0.14–0.82) | 0.65 ± 0.19 | (0.20–0.99) |
| Box jumps performance | ||||
| Repetitions (per second) | 0.45 ± 0.06 | (0.31–0.58) | 0.41 ± 0.07 | (0.26–0.54) |
| Mean force (N) | 1380 ± 257 | (842–1807) | 1352 ± 261 | (869–1777) |
| Average RFD (N·sec−1) | 10,928 ± 4419 | (3924–20,396) | 10,897 ± 4669 | (4693–22,377) |
| Average impulse (N·sec) | 304 ± 118 | (162–599) | 303 ± 124 | (89–576) |
| Volume load (kg) | 1801 ± 590 | (773–3316) | 4435 ± 1374 | (2471–7112) |
| Transitions to rowing | ||||
| Average time (seconds) | 6.50 ± 1.19 | (4.80–10.00) | 7.32 ± 1.17 | (5.27–10.60) |
| Coefficient of variation (%) | 0.44 ± 0.23 | (0.06–0.83) | 0.63 ± 0.18 | (0.20–0.96) |
| Experience (Years) | ||||||||
|---|---|---|---|---|---|---|---|---|
| Age (years) | Resistance Training | Gymnastics | HIFT | |||||
| 5 min | 15 min | 5 min | 15 min | 5 min | 15 min | 5 min | 15 min | |
| Overall workout | ||||||||
| Repetitions (per minute) | −0.24 | −0.27 | 0.05 | −0.14 | 0.01 | 0.33 † | −0.25 | 0.17 † |
| Rounds (per minute) | −0.22 | −0.25 | −0.05 | −0.17 | 0.07 | 0.30 | −0.05 | 0.44 † |
| Volume load (kg) | −0.28 | −0.18 | 0.04 | 0.00 | −0.06 | 0.08 | −0.21 | −0.01 |
| Average transition (sec) | 0.05 | 0.19 | 0.04 | −0.04 | −0.12 | −0.50 # | 0.49 * | 0.01 † |
| Transition CV (%) | 0.09 | 0.33 | 0.05 | 0.28 | −0.12 | 0.03 | −0.16 | −0.11 |
| Rowing | ||||||||
| Calories (per second) | −0.26 | −0.23 | 0.11 | 0.04 | −0.16 | −0.28 | −0.21 | −0.30 |
| Strokes (per minute) | −0.10 | 0.27 | 0.26 | 0.12 | 0.29 | 0.04 | −0.13 | 0.34 |
| Power (W) | −0.23 | −0.17 | 0.07 | 0.10 | −0.13 | −0.14 | −0.18 | −0.07 |
| Volume load (kg) | −0.27 | −0.19 | 0.12 | 0.10 | −0.02 | 0.06 | −0.30 | −0.08 |
| Transitions to thrusters | ||||||||
| Average (sec) | −0.21 | 0.04 | −0.18 | −0.27 | −0.18 | −0.32 | 0.39 | −0.10 † |
| CV (%) | 0.23 | 0.49 # | 0.14 | 0.21 | 0.02 | −0.46 #† | −0.01 | −0.22 |
| Barbell thrusters | ||||||||
| Repetitions (per second) | 0.13 | 0.12 | 0.27 | 0.13 | −0.05 | −0.08 | 0.45 * | 0.38 |
| Velocity (m·sec−1) | −0.01 | 0.01 | 0.16 | 0.20 | −0.29 | −0.33 | 0.11 | 0.23 |
| Power (W) | −0.18 | −0.19 | 0.16 | 0.15 | −0.20 | −0.22 | −0.23 | −0.15 |
| Volume load (kg) | −0.32 | −0.33 | 0.11 | 0.00 | −0.06 | 0.17 † | −0.26 | −0.11 |
| Transitions to box jumps | ||||||||
| Average (sec) | 0.40 | 0.26 | 0.41 | 0.08 | −0.18 | −0.48 # | 0.20 | −0.05 |
| CV (%) | 0.01 | 0.36 | −0.05 | 0.14 | 0.10 | −0.29 | 0.01 | −0.45 # |
| Box jumps | ||||||||
| Repetitions (per second) | −0.20 | −0.21 | −0.24 | −0.13 | 0.27 | 0.50 # | 0.06 | 0.37 |
| Mean force (N) | −0.07 | −0.13 | 0.11 | 0.01 | −0.22 | −0.11 | 0.13 | 0.15 |
| RFD (N·sec−1) | −0.14 | −0.11 | −0.26 | −0.21 | −0.26 | −0.14 | −0.03 | −0.09 |
| Impulse (N·sec) | 0.03 | −0.03 | 0.35 | 0.24 | 0.01 | −0.13 † | 0.05 | 0.12 |
| Volume load (kg) | −0.12 | −0.24 | 0.07 | −0.14 | −0.13 | 0.01 | −0.01 | 0.22 |
| Transitions to rowing | ||||||||
| Average (sec) | 0.11 | −0.16 | 0.23 | 0.23 | 0.25 | −0.08 | 0.57 * | 0.11 † |
| CV (%) | 0.22 | 0.36 | 0.10 | 0.16 | 0.12 | −0.35 † | −0.13 | −0.38 |
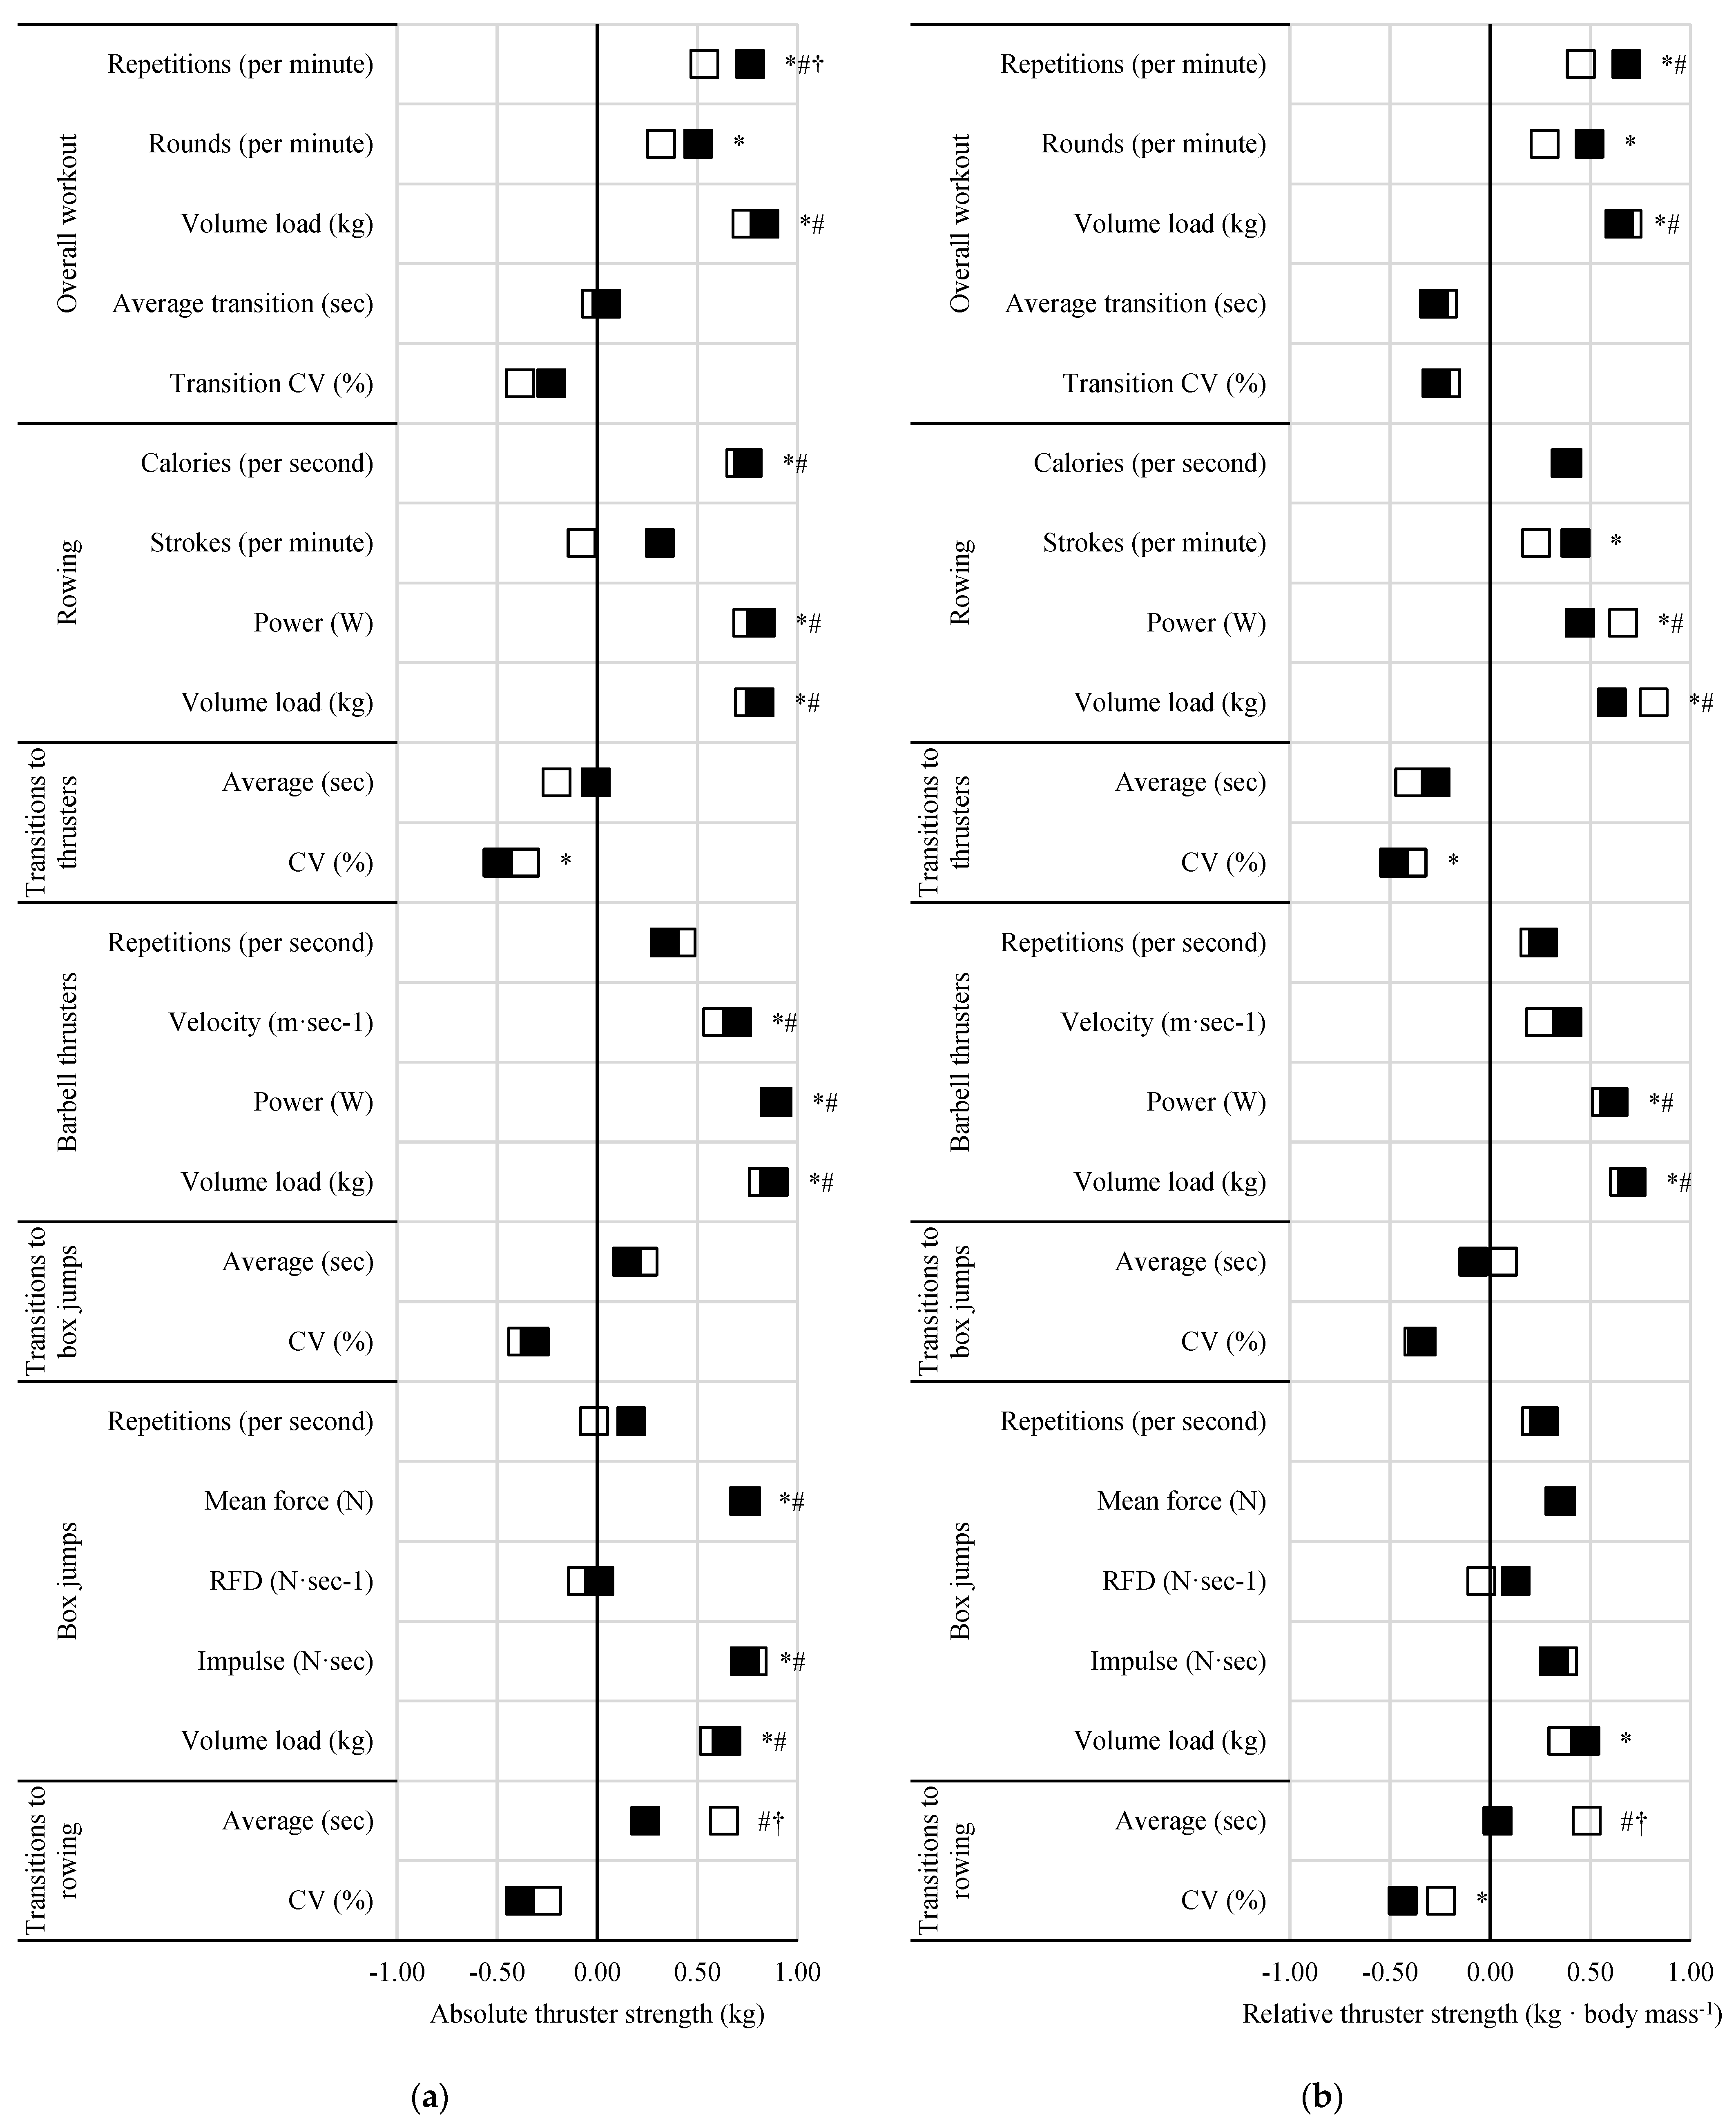
| Height (m) | Body Mass (kg) | Fat Mass (kg) | Fat-Free Mass (kg) | Body Fat (%) | ||||||
|---|---|---|---|---|---|---|---|---|---|---|
| 5 min | 15 min | 5 min | 15 min | 5 min | 15 min | 5 min | 15 min | 5 min | 15 min | |
| Overall workout | ||||||||||
| Repetitions (per minute) | 0.51 * | 0.43 # | 0.55 * | 0.46 # | −0.06 | −0.05 | 0.64 * | 0.52 # | −0.37 | −0.29 |
| Rounds (per minute) | 0.35 | 0.37 | 0.37 | 0.32 | −0.08 | 0.01 | 0.45 * | 0.34 | −0.31 | −0.15 |
| Volume load (kg) | 0.64 * | 0.49 # | 0.68 * | 0.58 # | −0.01 | 0.00 | 0.78 * | 0.63 # | −0.37 | −0.26 |
| Average transition (sec) | 0.33 | 0.22 | 0.38 | 0.20 | 0.33 | 0.10 | 0.27 | 0.18 | 0.24 | 0.03 |
| Transition CV (%) | −0.19 | −0.40 | −0.14 | −0.47 # | 0.08 | −0.02 | −0.22 | −0.50 # | 0.22 | 0.17 |
| Rowing | ||||||||||
| Calories (per second) | 0.67 * | 0.66 # | 0.72 * | 0.67 # | 0.05 | 0.03 | 0.84 * | 0.78 # | −0.27 | −0.28 |
| Strokes (per minute) | 0.09 | −0.38 | 0.06 | −0.22 | −0.18 | −0.18 | 0.21 | −0.20 | −0.34 | −0.04 |
| Power (W) | 0.79 * | 0.53 #† | 0.82 * | 0.56 #† | 0.10 | −0.04 | 0.88 * | 0.64 #† | −0.29 | −0.23 |
| Volume load (kg) | 0.63 * | 0.39 | 0.65 * | 0.43 # | 0.00 | −0.14 | 0.75 * | 0.54 # | −0.37 | −0.33 |
| Transitions to thrusters | ||||||||||
| Average (sec) | 0.39 | 0.12 | 0.24 | 0.06 | 0.22 | −0.03 | 0.20 | 0.06 | 0.12 | −0.07 |
| CV (%) | −0.34 | −0.33 | −0.31 | −0.23 | 0.03 | 0.22 | −0.41 | −0.37 | 0.23 | 0.42 |
| Barbell thrusters | ||||||||||
| Repetitions (per second) | 0.30 | 0.37 | 0.41 | 0.54 # | 0.21 | 0.25 | 0.32 | 0.48 # | 0.03 | 0.02 |
| Velocity (m·sec−1) | 0.70 * | 0.72 # | 0.67 * | 0.67 # | −0.02 | 0.04 | 0.74 * | 0.68 # | −0.32 | −0.22 |
| Power (W) | 0.70 * | 0.77 #† | 0.75 * | 0.77 # | −0.07 | −0.02 | 0.87 * | 0.87 # | −0.43 | −0.39 |
| Volume load (kg) | 0.63 * | 0.60 # | 0.66 * | 0.65 # | −0.03 | −0.06 | 0.79 * | 0.76 # | −0.40 | −0.41 |
| Transitions to box jumps | ||||||||||
| Average (sec) | 0.17 | 0.24 | 0.31 | 0.32 | 0.14 | −0.02 | 0.28 | 0.35 | 0.03 | −0.12 |
| CV (%) | −0.26 | −0.36 | −0.23 | −0.28 | −0.01 | 0.08 | −0.23 | −0.38 | 0.12 | 0.24 |
| Box jumps | ||||||||||
| Repetitions (per second). | 0.03 | −0.11 | 0.09 | −0.22 | −0.29 | −0.54 # | 0.19 | −0.03 | −0.41 | −0.53 # |
| Mean force (N) | 0.75 * | 0.75 # | 0.85 * | 0.88 # | 0.22 | 0.31 | 0.84 * | 0.85 # | −0.11 | −0.06 |
| RFD (N·sec−1) | −0.04 | −0.01 | −0.03 | −0.02 | −0.04 | 0.03 | −0.03 | −0.05 | −0.04 | 0.04 |
| Impulse (N·sec) | 0.71 * | 0.74 # | 0.83 * | 0.85 # | 0.28 | 0.28 | 0.79 * | 0.83 # | −0.06 | −0.07 |
| Volume load (kg) | 0.50 * | 0.59 # | 0.63 * | 0.67 # | 0.08 | 0.18 | 0.64 * | 0.65 # | −0.18 | −0.13 |
| Transitions to rowing | ||||||||||
| Average (sec) | 0.31 | 0.61 # | 0.44 * | 0.51 # | −0.01 | −0.18 | 0.41 | 0.62 # | −0.11 | −0.39 |
| CV (%) | −0.28 | −0.28 | −0.27 | −0.19 | 0.08 | 0.21 | −0.32 | −0.31 | 0.23 | 0.32 |
Disclaimer/Publisher’s Note: The statements, opinions and data contained in all publications are solely those of the individual author(s) and contributor(s) and not of MDPI and/or the editor(s). MDPI and/or the editor(s) disclaim responsibility for any injury to people or property resulting from any ideas, methods, instructions or products referred to in the content. |
© 2025 by the authors. Licensee MDPI, Basel, Switzerland. This article is an open access article distributed under the terms and conditions of the Creative Commons Attribution (CC BY) license (https://creativecommons.org/licenses/by/4.0/).
Share and Cite
Mangine, G.T.; McGeehan, K.C.; King, W.; Hines, A.; Henley, J.W.; Grazer, J.L.; Esmat, T.A.; McLester, J.R. Workout Duration Alters the Importance of Predictive Traits on High-Intensity Functional Training Workout Performance. Sports 2025, 13, 156. https://doi.org/10.3390/sports13060156
Mangine GT, McGeehan KC, King W, Hines A, Henley JW, Grazer JL, Esmat TA, McLester JR. Workout Duration Alters the Importance of Predictive Traits on High-Intensity Functional Training Workout Performance. Sports. 2025; 13(6):156. https://doi.org/10.3390/sports13060156
Chicago/Turabian StyleMangine, Gerald T., Kristyn C. McGeehan, Wil King, Ashley Hines, James W. Henley, Jacob L. Grazer, Tiffany A. Esmat, and John R. McLester. 2025. "Workout Duration Alters the Importance of Predictive Traits on High-Intensity Functional Training Workout Performance" Sports 13, no. 6: 156. https://doi.org/10.3390/sports13060156
APA StyleMangine, G. T., McGeehan, K. C., King, W., Hines, A., Henley, J. W., Grazer, J. L., Esmat, T. A., & McLester, J. R. (2025). Workout Duration Alters the Importance of Predictive Traits on High-Intensity Functional Training Workout Performance. Sports, 13(6), 156. https://doi.org/10.3390/sports13060156