
Comparison of External and Internal Training Loads in Elite Junior Male Tennis Players During Offensive vs. Defensive Strategy Conditions: A Pilot Study

 , , , , , , and
Abstract
1. Introduction
2. Materials and Methods
2.1. Experimental Approach
2.2. Participants
2.3. Procedures
2.4. Variables
2.4.1. External Training Load
2.4.2. Internal Training Load
2.5. Statistical Analyses
3. Results
4. Discussion
4.1. Practical Applications
4.2. Limitations and Advantages of This Study
5. Conclusions
Author Contributions
Funding
Institutional Review Board Statement
Informed Consent Statement
Data Availability Statement
Acknowledgments
Conflicts of Interest
Abbreviations
| ACWR | Acute/Chronic Workload Ratio |
| ATP | Association of Tennis Professionals |
| CoD | Change of direction |
| GPS | Global positioning system |
| HR | Heart rate |
| IMA | Inertial movement analysis |
| IMU | Inertial measurement unit |
| ITF | International Tennis Federation |
| RPE | Rating of perceived exertion |
References
- Kovacs, M.S. Applied Physiology of Tennis Performance. Br. J. Sports Med. 2006, 40, 381–386. [Google Scholar] [CrossRef] [PubMed]
- Torres-Luque, G.; Cabello-Manrique, D.; Hernández-García, R.; Garatachea, N. An analysis of competition in young tennis players. Eur. J. Sport Sci. 2011, 11, 39–43. [Google Scholar] [CrossRef]
- Fernandez-Fernandez, J.; Sanz-Rivas, D.; Mendez-Villanueva, A. A review of the activity profile and physiological demands of tennis match play. Strength Cond. J. 2009, 31, 15–26. [Google Scholar] [CrossRef]
- Smekal, G.; Von Duvillard, S.P.; Rihacek, C.; Pokan, R.; Hofmann, P.; Baron, R.; Tschan, H.; Bachl, N. A physiological profile of tennis match play. Med. Sci. Sports Exerc. 2001, 33, 999–1005. [Google Scholar] [CrossRef]
- Kovacs, M.S. A comparison of work/rest intervals in men’s professional tennis. Med. Sci. Tennis 2004, 9, 10–11. [Google Scholar]
- Ferrauti, A.; Weber, K.; Wright, P. Endurance. In Strength and Conditioning for Tennis; Reid, M., Quinn, A., Crespo, M., Eds.; International Tennis Federation: London, UK, 2003; pp. 93–111. [Google Scholar]
- Over, S.; O’Donoghue, P. What is the Point-Tennis Analysis and Why. ITF Coach. Sport Sci. Rev. 2008, 16, 45. [Google Scholar]
- Kovalchik, S.A.; Reid, M. Comparing matchplay characteristics and physical demands of junior and professional tennis athletes in the era of big data. J. Sports Sci. Med. 2017, 16, 489. [Google Scholar]
- Pieper, S.; Exler, T.; Weber, K. Running speed loads on clay and hard courts in world-class tennis. J. Med. Sci. Tennis 2007, 12, 14–17. [Google Scholar]
- Bradley, P.; Ade, J.D. Are current physical match performance metrics in elite soccer fit for purpose or is the adoption of an integrated approach needed? Int. J. Sports Physiol. Perform. 2018, 13, 656–664. [Google Scholar] [CrossRef]
- Schuth, G.; Carr, G.; Barnes, C.; Carling, C.; Bradley, P.S. Positional interchanges influence the physical and technical match performance variables of elite soccer players. J. Sports Sci. 2016, 34, 501–508. [Google Scholar] [CrossRef]
- Hoppe, M.W.; Hotfiel, T.; Stückradt, A.; Grim, C.; Ueberschär, O.; Freiwald, J.; Baumgart, C. Effects of passive, active, and mixed playing strategies on external and internal loads in female tennis players. PLoS ONE 2020, 15, e0239463. [Google Scholar] [CrossRef]
- Bernardi, M.; De Vito, G.; Falvo, M.E.; Marino, S.; Montellanico, F. Cardiorespiratory adjustment in middle-level tennis players: Are long-term cardiovascular adjustments possible? In Science and Racket Sports II; Lees, A., Maynard, I., Hughes, M., Reilly, T., Eds.; E & FN Spon: London, UK, 1998; pp. 20–26. [Google Scholar] [CrossRef]
- Brody, H. Unforced errors and error reduction in tennis. Br. J. Sports Med. 2006, 40, 397–400. [Google Scholar] [CrossRef] [PubMed]
- Kilit, B.; Arslan, E. Physiological responses and time-motion characteristics of young tennis players: Comparison of serve vs. return games and winners vs. losers matches. Int. J. Perform. Anal. Sport 2017, 17, 684–694. [Google Scholar] [CrossRef]
- Ojala, T.; Häkkinen, K. Effects of the tennis tournament on players’ physical performance, hormonal responses, muscle damage and recovery. J. Sports Sci. Med. 2013, 12, 240. [Google Scholar]
- Reid, M.; Duffield, R.; Dawson, B.; Baker, J.; Crespo, M. Quantification of the physiological and performance characteristics of on-court tennis drills. Br. J. Sports Med. 2008, 42, 146–151. [Google Scholar] [CrossRef]
- Kilit, B.; Şenel, Ö.; Arslan, E.; Can, S. Physiological responses and match characteristics in professional tennis players during a one-hour simulated tennis match. J. Hum. Kinet. 2016, 51, 83. [Google Scholar] [CrossRef]
- Borg, G. Perceived exertion as an indicator of somatic stress. Scand. J. Rehabil. Med. 1970, 2, 92–98. [Google Scholar]
- Eston, R.G.; Williams, J.G. Exercise intensity and perceived exertion in adolescent boys. Br. J. Sports Med. 1986, 20, 27–30. [Google Scholar] [CrossRef]
- Mendez-Villanueva, A.; Fernandez-Fernandez, J.; Bishop, D.; Fernandez-Garcia, B.; Terrados, N. Activity patterns, blood lactate concentrations and ratings of perceived exertion during a professional singles tennis tournament. Br. J. Sports Med. 2007, 41, 296–300. [Google Scholar] [CrossRef]
- Gomes, R.V.; Coutts, A.J.; Viveiros, L.; Aoki, M.S. Physiological demands of match-play in elite tennis: A case study. Eur. J. Sport Sci. 2011, 11, 105–109. [Google Scholar] [CrossRef]
- Galé-Ansodi, C.; Castellano, J.; Usabiaga, O. Effects of different surfaces in time-motion characteristics in youth elite tennis players. Int. J. Perform. Anal. Sport 2016, 16, 860–870. [Google Scholar] [CrossRef]
- Fernandez-Fernandez, J.; Sanz-Rivas, D.; Sanchez-Muñoz, C.; Pluim, B.M.; Tiemessen, I.; Mendez-Villanueva, A. A comparison of the activity profile and physiological demands between advanced and recreational veteran tennis players. J. Strength Cond. Res. 2009, 23, 604–610. [Google Scholar] [CrossRef] [PubMed]
- Ferrauti, A.; Bergeron, M.F.; Pluim, B.M.; Weber, K. Physiological responses in tennis and running with similar oxygen uptake. Eur. J. Appl. Physiol. 2001, 85, 27–33. [Google Scholar] [CrossRef] [PubMed]
- Cayetano, A.R.; Martín, Ó.M.; Merchán, F.H.; Muñoz, S.P. Carga interna y externa en el tenis de competición: Comparación de tres tipos de entrenamiento. Retos Nuevas Tend. Educ. Física Deporte Recreación 2022, 44, 534–541. [Google Scholar]
- Hoppe, M.W.; Baumgart, C.; Stückradt, A.; Hoffmann, N.; Engelhardt, M.; Freiwald, J.; Grim, C. Effects of playing strategies on match activities and physiological responses in well-trained female tennis players derived by an alternative statistical approach. Sports Orthop. Traumatol. 2019, 35, 31–39. [Google Scholar] [CrossRef]
- Milioni, F.; Leite, J.V.D.M.; Beneke, R.; De Poli, R.A.B.; Papoti, M.; Zagatto, A.M. Table tennis playing styles require specific energy systems demands. PLoS ONE 2018, 13, e0199985. [Google Scholar] [CrossRef]
- Gabbett, T.J. The training-injury prevention paradox: Should athletes be training smarter and harder? Br. J. Sports Med. 2016, 50, 273–280. [Google Scholar] [CrossRef]
- Gabbett, T.J.; Hulin, B.T.; Blanch, P.; Whiteley, R. High training workloads alone do not cause sports injuries: How you get there is the real issue. Br. J. Sports Med. 2016, 50, 444–445. [Google Scholar] [CrossRef]
- Blanch, P.; Gabbett, T.J. Has the athlete trained enough to return to play safely? The acute:chronic workload ratio permits clinicians to quantify a player’s risk of subsequent injury. Br. J. Sports Med. 2016, 50, 471–475. [Google Scholar] [CrossRef]
- Castellano, J.; Casamichana, D.; Calleja-González, J.; San Román, J.; Ostojic, S. Reliability and accuracy of 10 Hz GPS devices for short-distance exercise. J. Sports Sci. Med. 2011, 63, 233–234. [Google Scholar]
- Rampinini, E.; Coutts, A.J.; Castagna, C.; Sassi, R.; Impellizzeri, F.M. Variation in top-level soccer match performance. Int. J. Sports Med. 2007, 28, 1018–1024. [Google Scholar] [CrossRef]
- Galé-Ansodi, C.; Langarika-Rocafort, A.; Usabiaga, O.; Castellano, J. New variables and new agreements between 10 Hz global positioning system devices in tennis drills. J. Sports Eng. Technol. 2016, 230, 121–123. [Google Scholar] [CrossRef]
- Tóth, P.J.; Sáfár, S.; Dobos, K.; Horváth, D.; Győri, T.; Ökrös, C. Investigation of the relationship between high-intensity micromovements and impact accuracy using the ‘PlayerLoad’ and ‘IMA’ mechanical indicators in age group tennis players. Phys. Educ. Sport Sci. 2021, 6, 14–22. [Google Scholar]
- Catapult. Sprint Help; Catapult-Sports: Melbourne, Australia, 2013. [Google Scholar]
- Boyd, L.J.; Ball, K.; Aughey, R.J. The reliability of MinimaxX accelerometers for measuring physical activity in Australian football. Int. J. Sports Physiol. Perform. 2011, 6, 311–321. [Google Scholar] [CrossRef] [PubMed]
- Keaney, E.M.; Reid, M. Quantifying hitting activity in tennis with racket sensors: New dawn or false dawn? Sports Biomech. 2018, 1, 1–9. [Google Scholar] [CrossRef]
- Fernández-García, A.; Torres-Luque, G. Intelligent devices for tennis rackets. ITF Coach. Sport Sci. Rev. 2018, 26, 5–7. [Google Scholar]
- Giménez-Egido, J.M.; Ortega, E.; Verdu-Conesa, I.; Cejudo, A.; Torres-Luque, G. Using smart sensors to monitor physical activity and technical-tactical actions in junior tennis players. Int. J. Environ. Res. Public Health 2020, 17, 1068. [Google Scholar] [CrossRef]
- Scherr, J.; Wolfarth, B.; Christle, J.W.; Pressler, A.; Wagenpfeil, S.; Halle, M. Associations between Borg’s rating of perceived exertion and physiological measures of exercise intensity. Eur. J. Appl. Physiol. 2013, 113, 147–155. [Google Scholar] [CrossRef]
- Murphy, A.P.; Duffield, R.; Kellett, A.; Reid, M. A descriptive analysis of internal and external loads for elite-level tennis drills. Int. J. Sports Physiol. Perform. 2014, 9, 863–870. [Google Scholar] [CrossRef]
- Cohen, J. Statistical power analysis. Curr. Dir. Psychol. Sci. 1992, 1, 98–101. [Google Scholar] [CrossRef]
- Ju, W. The Contextualisation of Match Running Performance in Elite Football. Ph.D. Thesis, Liverpool John Moores University, Liverpool, UK, 2022. [Google Scholar] [CrossRef]
- Andrzejewski, M.; Pluta, B.; Konefał, M.; Chmura, P.; Chmura, J. Analysis of the motor activities of professional Polish soccer players. Pol. J. Sport Tour. 2016, 23, 196–201. [Google Scholar] [CrossRef]
- Carling, C.; Bradley, P.; McCall, A.; Dupont, G. Match-to-match variability in high-speed running activity in a professional soccer team. J. Sports Sci. 2016, 34, 2215–2223. [Google Scholar] [CrossRef]
- Ade, J.; Fitzpatrick, J.; Bradley, P.S. High-intensity efforts in elite soccer matches and associated movement patterns, technical skills and tactical actions. Information for position-specific training drills. J. Sports Sci. 2016, 34, 2205–2214. [Google Scholar] [CrossRef] [PubMed]
- Dellal, A.; Chamari, K.; Wong, D.P.; Ahmaidi, S.; Keller, D.; Barros, R.; Bisciotti, G.N.; Carling, C. Comparison of physical and technical performance in European soccer match-play: FA Premier League and La Liga. Eur. J. Sport Sci. 2011, 11, 51–59. [Google Scholar] [CrossRef]
- Scott, D.; Haigh, J.; Lovell, R. Physical characteristics and match performances in women’s international versus domestic-level football players: A 2-year, league-wide study. Sci. Med. Football 2020, 4, 211–215. [Google Scholar] [CrossRef]
- Murias, J.M.; Lanatta, D.; Arcuri, C.R.; Laino, F.A. Metabolic and functional responses playing tennis on different surfaces. J. Strength Cond. Res. 2007, 21, 112–117. [Google Scholar]
- Reid, M.; Duffield, R.; Minett, G.M.; Sibte, N.; Murphy, A.P.; Baker, J. Physiological, perceptual, and technical responses to on-court tennis training on hard and clay courts. J. Strength Cond. Res. 2013, 27, 1487–1495. [Google Scholar] [CrossRef]
- Murphy, A.P.; Duffield, R.; Kellett, A.; Reid, M. A comparison of the perceptual and technical demands of tennis training, simulated match play, and competitive tournaments. Int. J. Sports Physiol. Perform. 2016, 11, 40–47. [Google Scholar] [CrossRef]
- Martínez-Gallego, R.; Guzmán, J.F.; James, N.; Pers, J.; Ramón-Llin, J.; Vuckovic, G. Movement characteristics of elite tennis players on hard courts with respect to the direction of ground strokes. J. Sports Sci. Med. 2013, 12, 275. [Google Scholar]
- Roetert, E.P.; Kovacs, M. Tennis Anatomy, 2nd ed.; Human Kinetics: Champaign, IL, USA, 2019; pp. 4–8. [Google Scholar]
- Hattler, J.; Parkes, J.; Eisenmann, J.C. Application of the Anaerobic Speed Reserve to game style in junior tennis players: A preliminary report. Sports Perform. Sci. Rep. 2022, 1, 179. [Google Scholar]
- Sandford, G.N.; Allen, S.V.; Kilding, A.E.; Ross, A.; Laursen, P.B. Anaerobic speed reserve: A key component of elite male 800-m running. Int. J. Sports Physiol. Perform. 2019, 14, 501–508. [Google Scholar] [PubMed]
- Balyi, I.; Hamilton, A. Long-term athlete development: Trainability in childhood and adolescence. Olympic Coach 2004, 16, 4–9. [Google Scholar]
- Wang, C.; Vargas, J.T.; Stokes, T.; Steele, R.; Shrier, I. Analyzing activity and injury: Lessons learned from the acute:chronic workload ratio. Sports Med. 2020, 50, 1243–1254. [Google Scholar] [CrossRef] [PubMed]


| Variables | Offensive | Defensive | ||||||
|---|---|---|---|---|---|---|---|---|
| Mean ± SD | 95% CI | Mean ± SD | 95% CI | T | Z | p | r | |
| Running activities | ||||||||
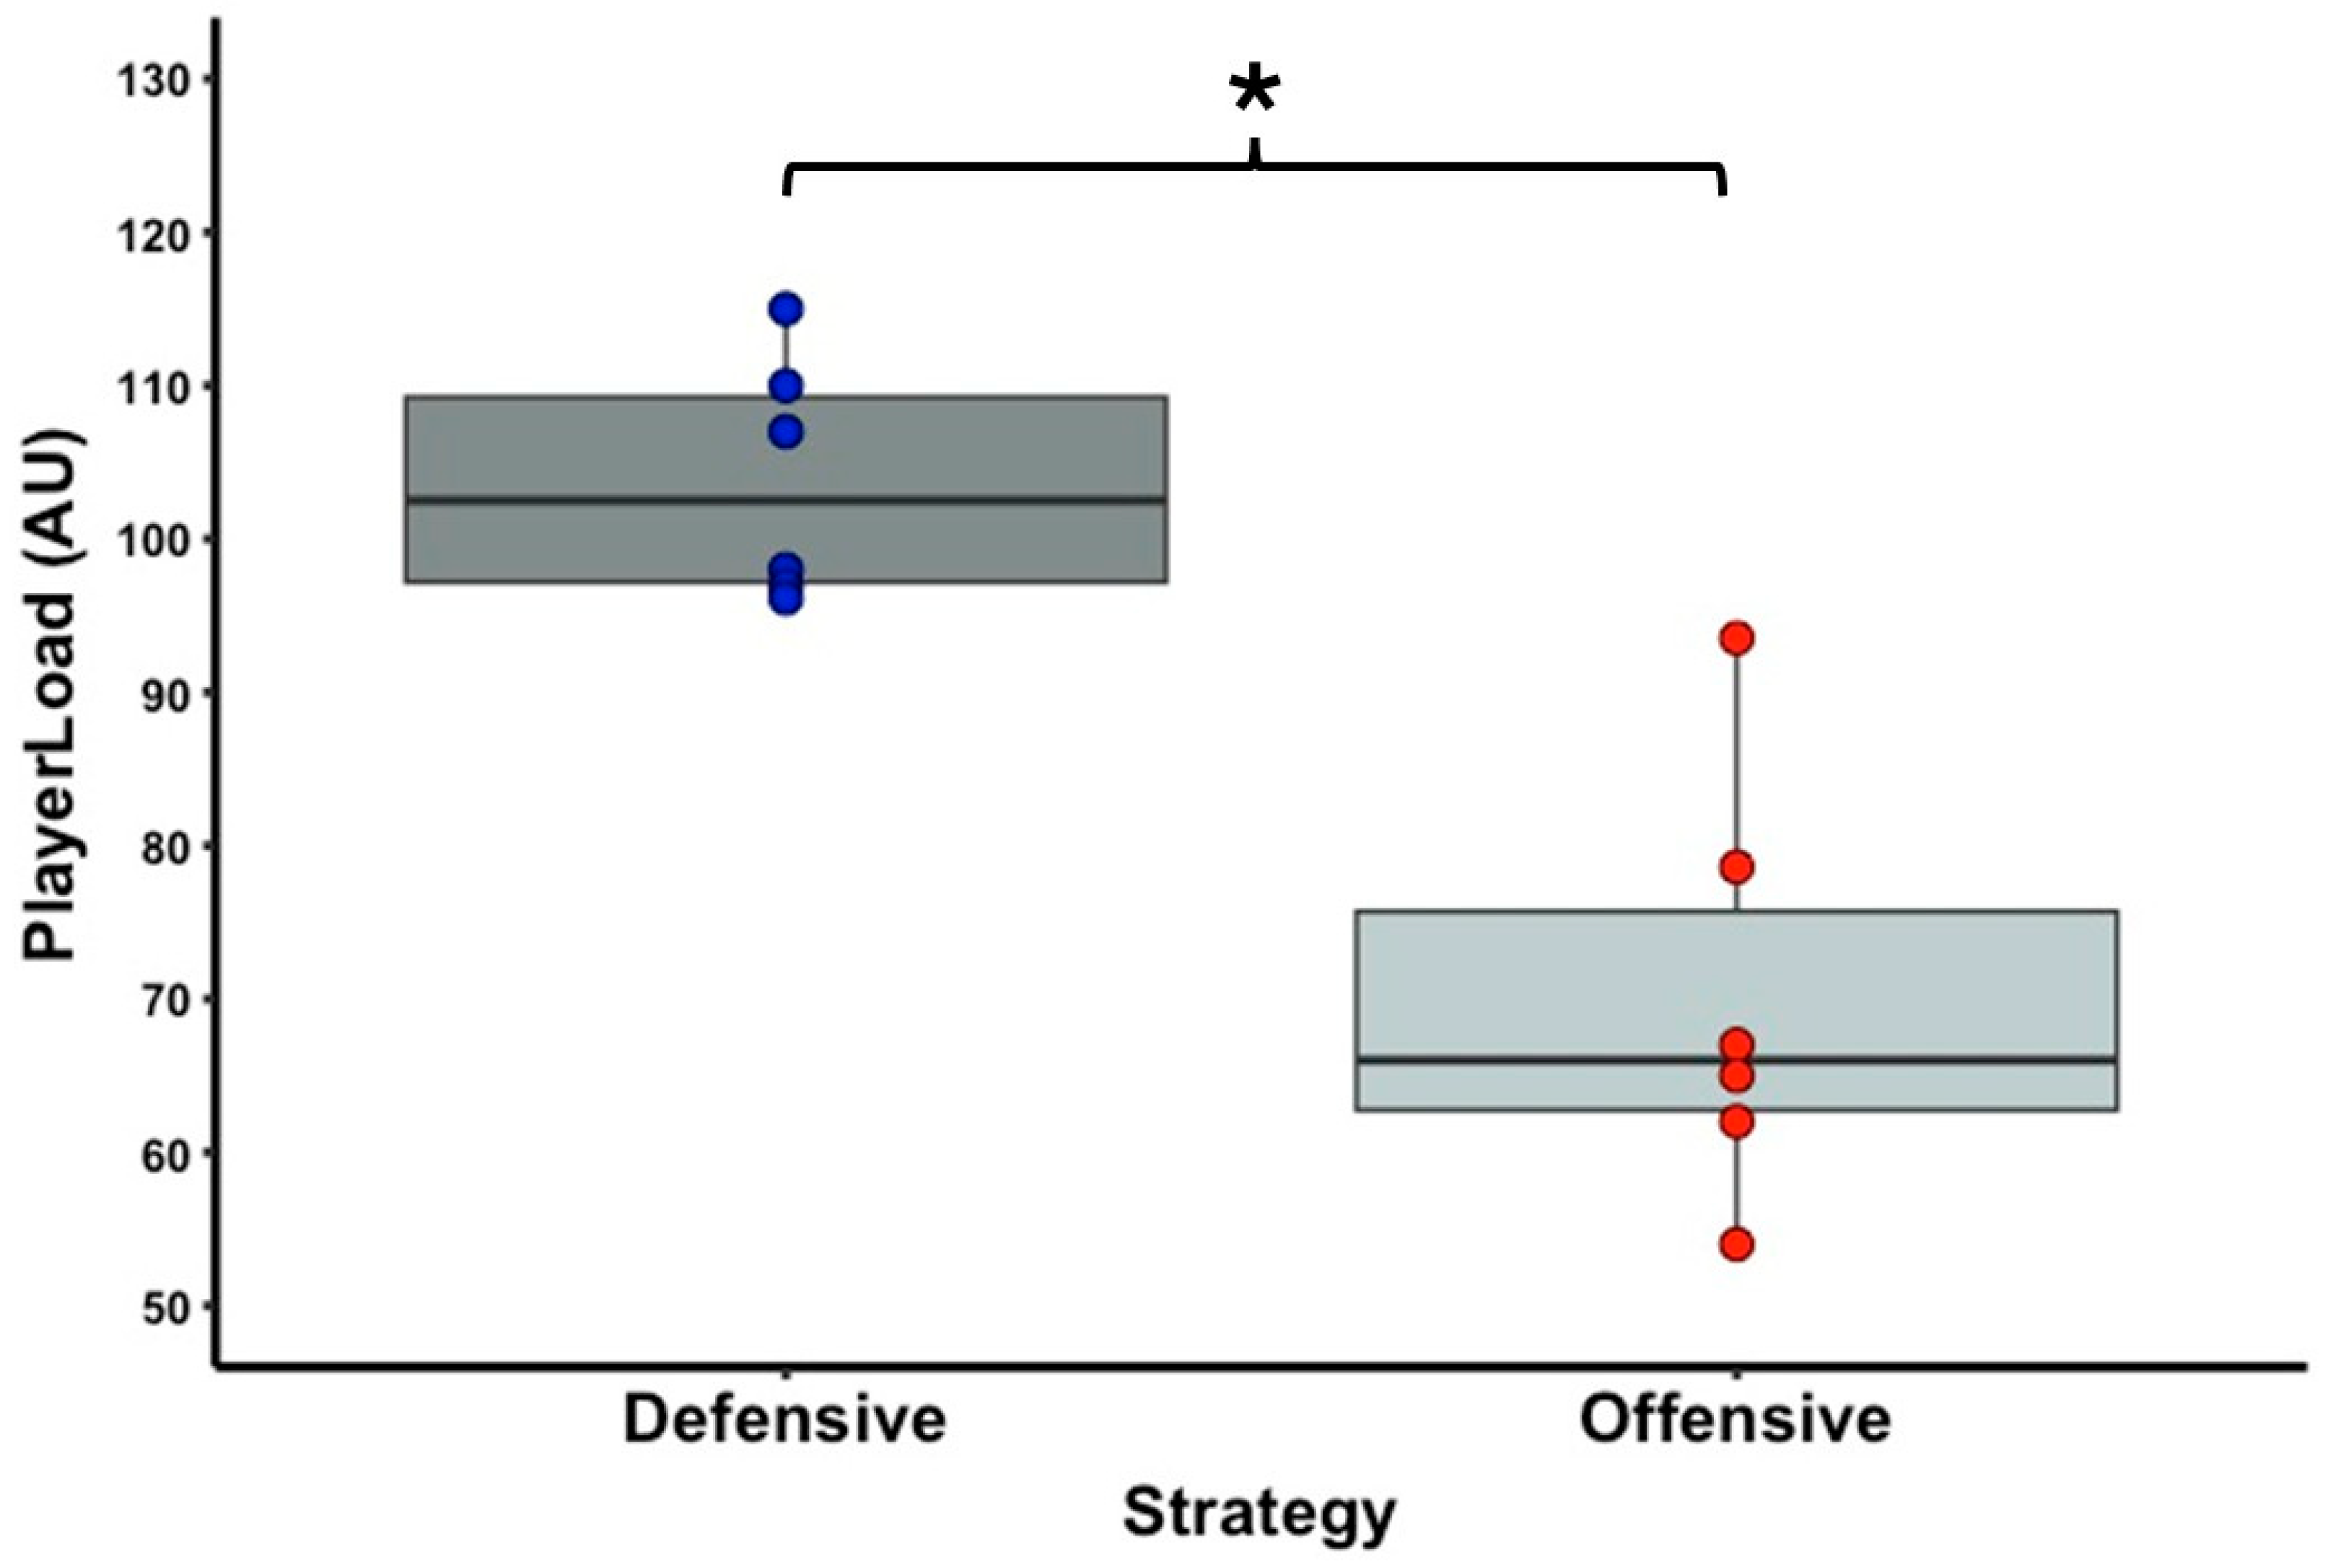
| PlayerLoad (AU) | 70.0 ± 14.0 | 55.32–84.73 | 103.8 ± 7.9 | 95.51–112.16 | 0.0 | 2.201 | 0.031 * | 0.90 |
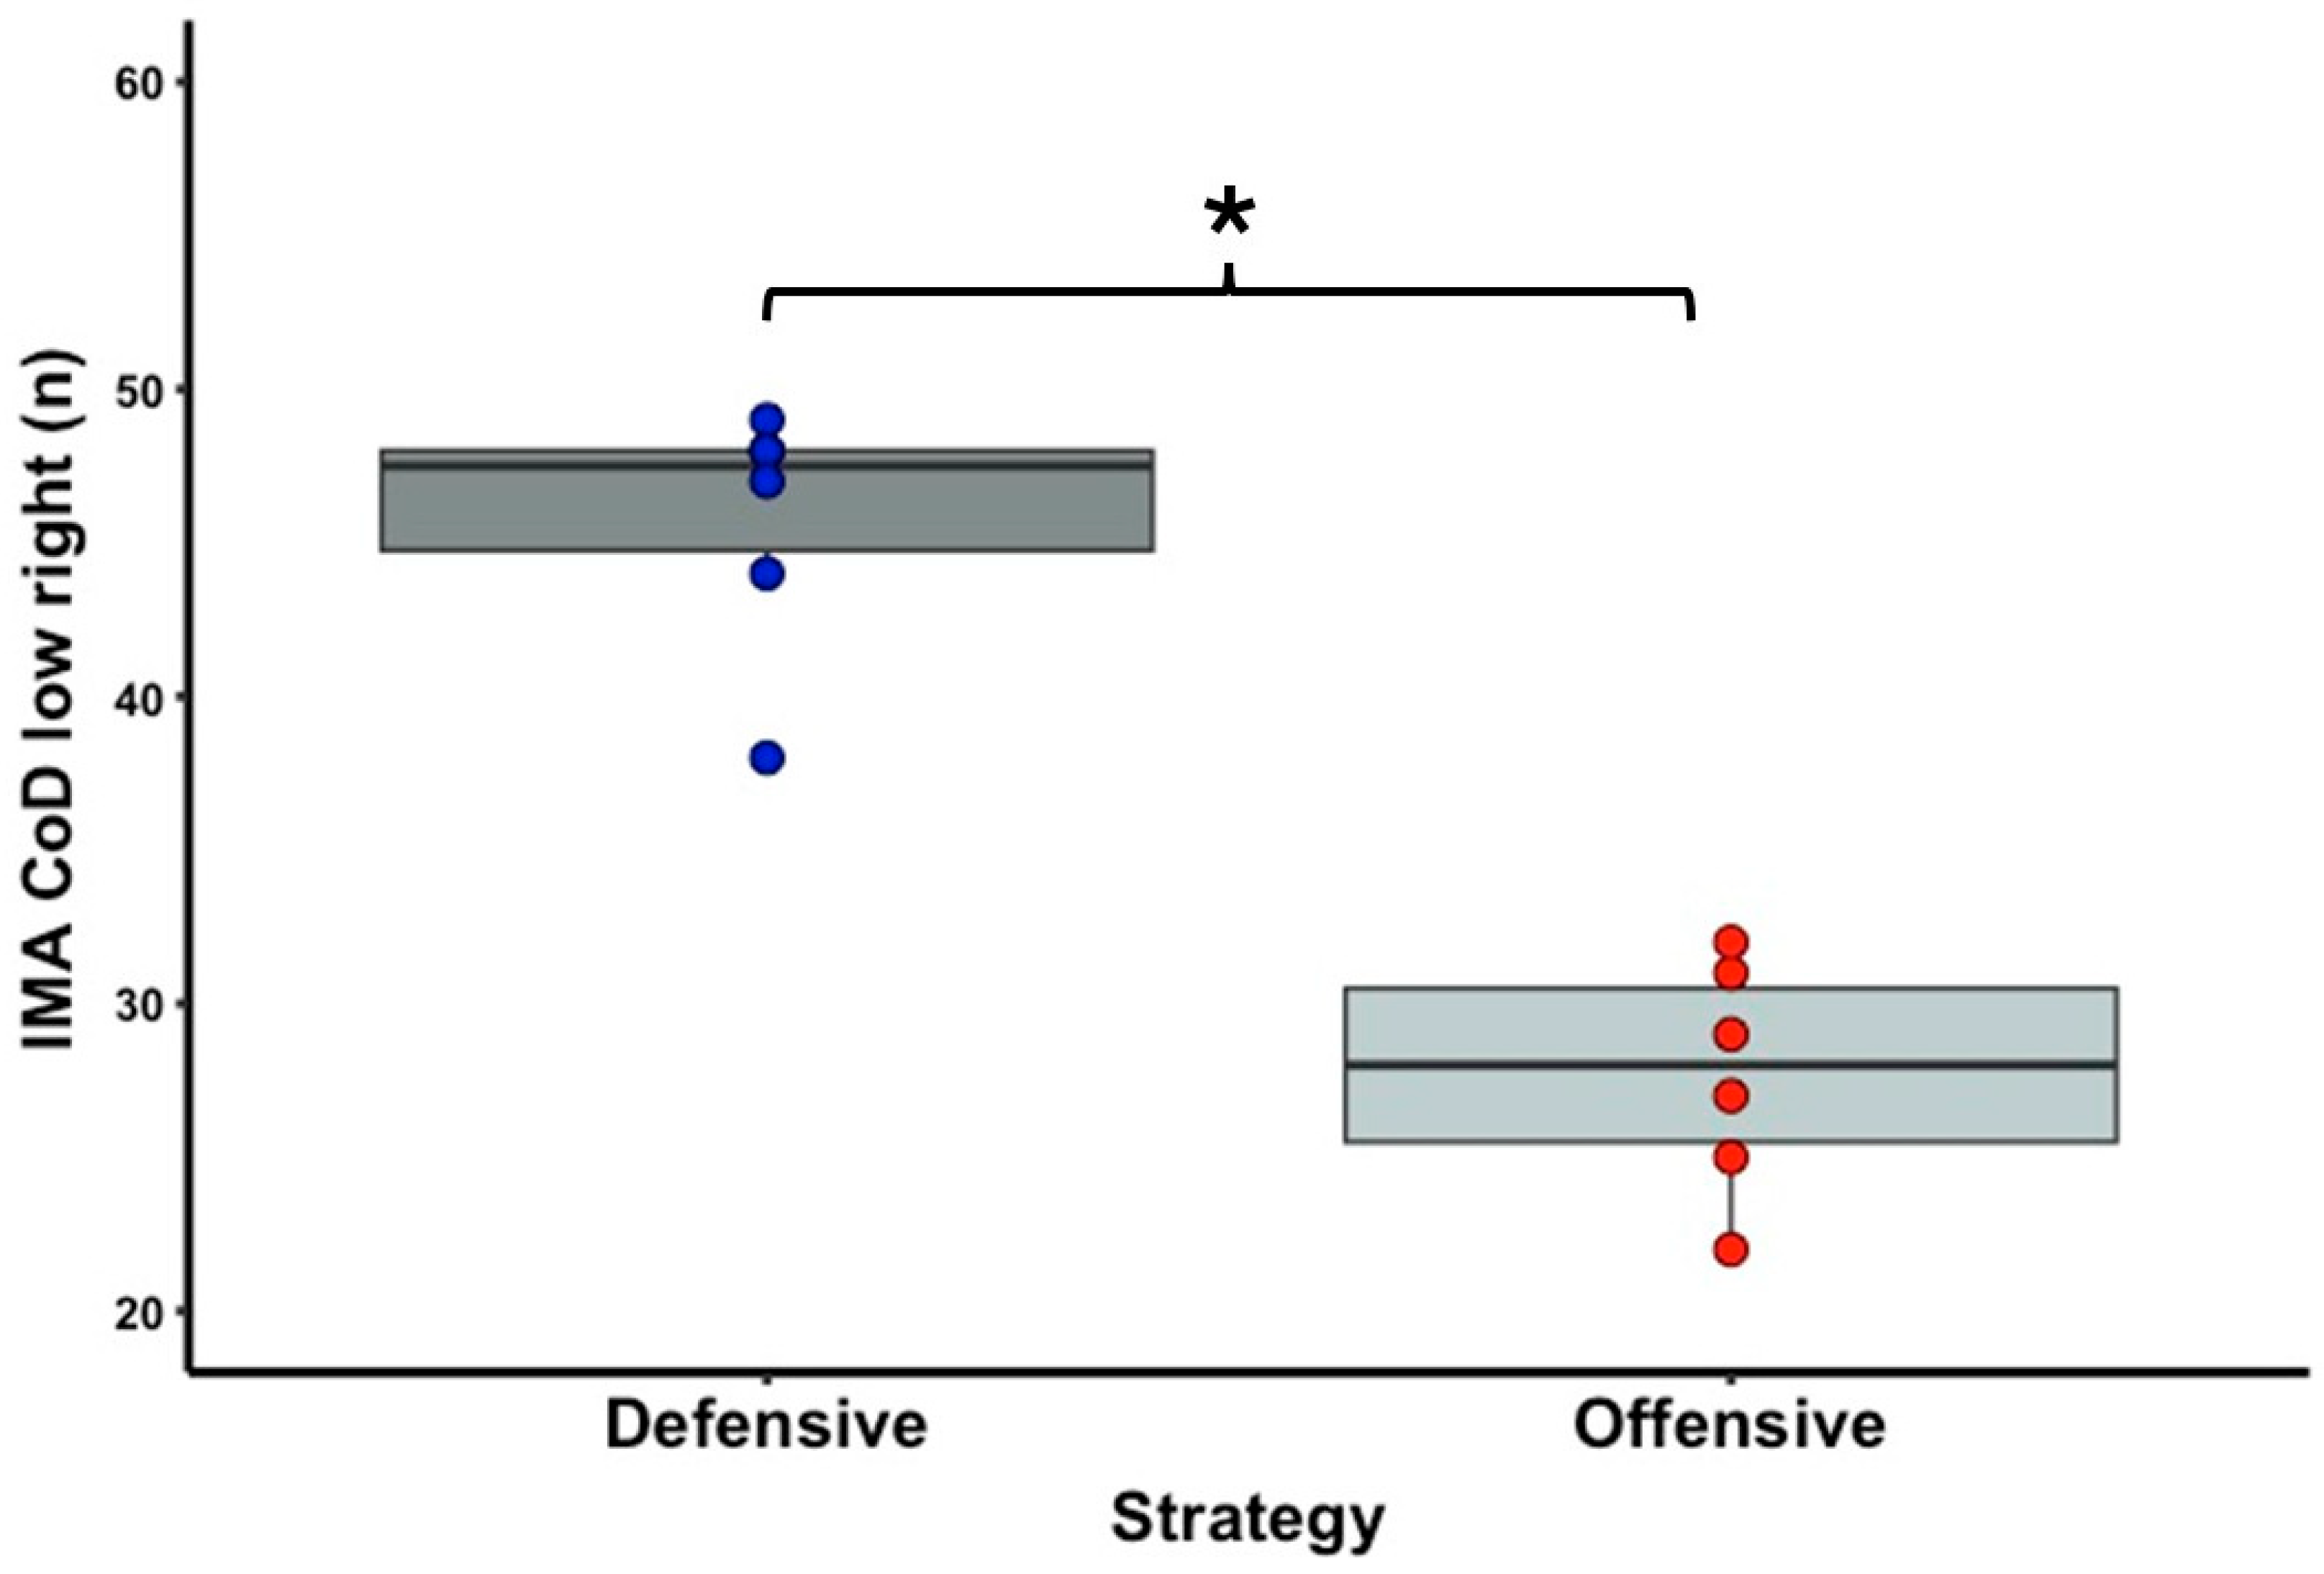
| IMA CoD low right (n) | 27.7 ± 3.8 | 23.70–31.63 | 45.7 ± 4.1 | 41.33–50.00 | 0.0 | 2.201 | 0.031 * | 0.90 |
| IMA CoD low left (n) | 43.7 ± 8.5 | 34.77–52.56 | 58.9 ± 9.0 | 49.41–68.25 | 2.0 | 1.782 | 0.090 | 0.73 |
| IMA CoD high right (n) | 1.3 ± 0.8 | 0.48–2.19 | 4.1 ± 4.9 | 0.95–9.28 | 3.0 | 1.572 | 0.140 | 0.64 |
| IMA CoD high left (n) | 6.7 ± 2.0 | 4.60–8.73 | 5.3 ± 1.0 | 4.25–6.42 | 12.0 | 1.214 | 0.279 | 0.50 |
| Shot activities | ||||||||
| Forehand velocity (km·h−1) | 100.2 ± 2.2 | 97.83–102.51 | 99.8 ± 3.0 | 96.69–102.98 | 6.0 | 0.365 | 0.855 | 0.15 |
| Backhand velocity (km·h−1) | 98.0 ± 4.9 | 92.86–103.14 | 93.5 ± 3.9 | 90.27–96.73 | 16.0 | 1.153 | 0.313 | 0.47 |
| Forehand spin (rpm) | 1383.0 ± 138.7 | 1237.51–1528.49 | 1665.5 ± 105.5 | 1554.78–1776.22 | 0.0 | 2.201 | 0.031 * | 0.90 |
| Backhand spin (rpm) | 1256.5 ± 112.7 | 1138.19–1374.81 | 1550.0 ± 140.1 | 1403.01–1696.99 | 0.0 | 2.201 | 0.031 * | 0.90 |
| Internal load | ||||||||
| RPE (AU) | 5.3 ± 0.8 | 4.48–6.19 | 6.7 ± 1.4 | 5.23–8.10 | 1.5 | 1.633 | 0.102 | 0.67 |
Disclaimer/Publisher’s Note: The statements, opinions and data contained in all publications are solely those of the individual author(s) and contributor(s) and not of MDPI and/or the editor(s). MDPI and/or the editor(s) disclaim responsibility for any injury to people or property resulting from any ideas, methods, instructions or products referred to in the content. |
© 2025 by the authors. Licensee MDPI, Basel, Switzerland. This article is an open access article distributed under the terms and conditions of the Creative Commons Attribution (CC BY) license (https://creativecommons.org/licenses/by/4.0/).
Share and Cite
Tóth, P.J.; Trzaskoma-Bicsérdy, G.; Trzaskoma, Ł.; Négyesi, J.; Dobos, K.; Havanecz, K.; Sáfár, S.; Ökrös, C. Comparison of External and Internal Training Loads in Elite Junior Male Tennis Players During Offensive vs. Defensive Strategy Conditions: A Pilot Study. Sports 2025, 13, 101. https://doi.org/10.3390/sports13040101
Tóth PJ, Trzaskoma-Bicsérdy G, Trzaskoma Ł, Négyesi J, Dobos K, Havanecz K, Sáfár S, Ökrös C. Comparison of External and Internal Training Loads in Elite Junior Male Tennis Players During Offensive vs. Defensive Strategy Conditions: A Pilot Study. Sports. 2025; 13(4):101. https://doi.org/10.3390/sports13040101
Chicago/Turabian StyleTóth, Péter János, Gabriella Trzaskoma-Bicsérdy, Łukasz Trzaskoma, János Négyesi, Károly Dobos, Krisztián Havanecz, Sándor Sáfár, and Csaba Ökrös. 2025. "Comparison of External and Internal Training Loads in Elite Junior Male Tennis Players During Offensive vs. Defensive Strategy Conditions: A Pilot Study" Sports 13, no. 4: 101. https://doi.org/10.3390/sports13040101
APA StyleTóth, P. J., Trzaskoma-Bicsérdy, G., Trzaskoma, Ł., Négyesi, J., Dobos, K., Havanecz, K., Sáfár, S., & Ökrös, C. (2025). Comparison of External and Internal Training Loads in Elite Junior Male Tennis Players During Offensive vs. Defensive Strategy Conditions: A Pilot Study. Sports, 13(4), 101. https://doi.org/10.3390/sports13040101