
The Impact of COVID-19-Related Mitigation Measures on the Health and Fitness Status of Primary School Children in Austria: A Longitudinal Study with Data from 708 Children Measured before and during the Ongoing COVID-19 Pandemic


Abstract
1. Introduction
2. Materials and Methods
2.1. Design
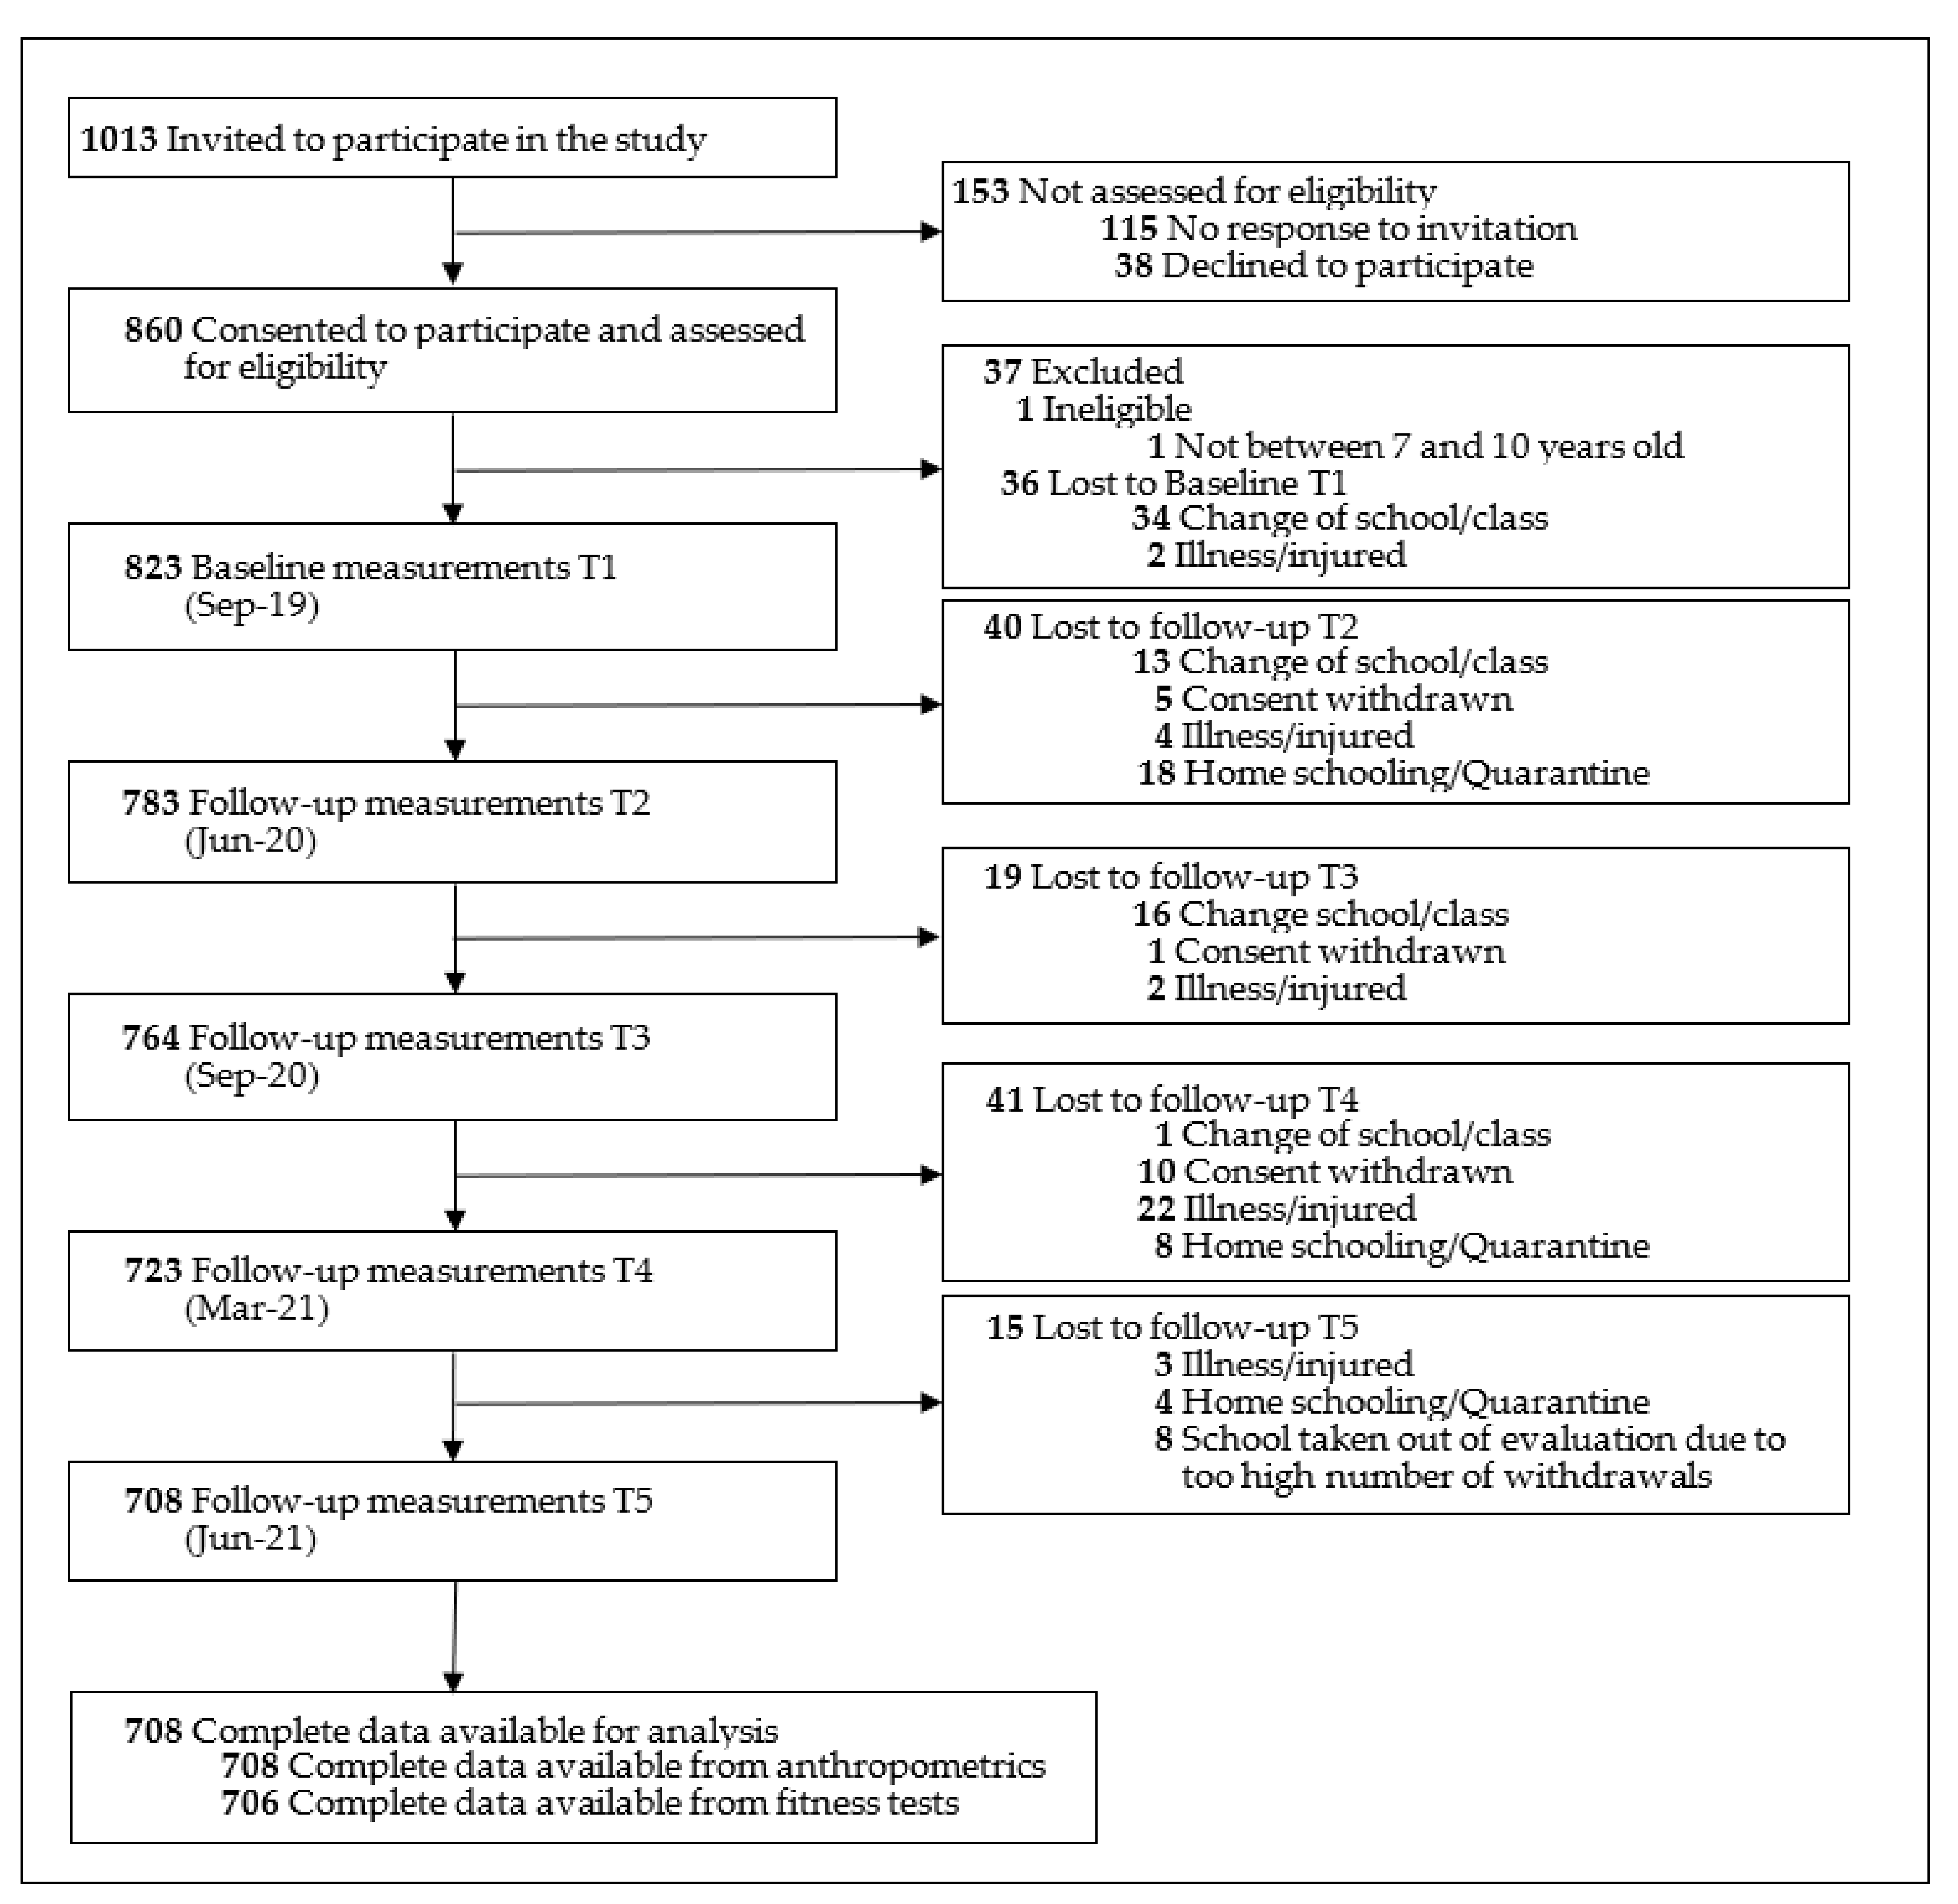
2.2. Selection of Schools and Participants
2.3. Procedures
2.4. Outcomes
2.4.1. Anthropometrics Data
2.4.2. Physical Fitness
2.5. Standardization and Classification
2.5.1. Anthropometric Data
2.5.2. Physical Fitness
2.5.3. Changes over Time
3. Results
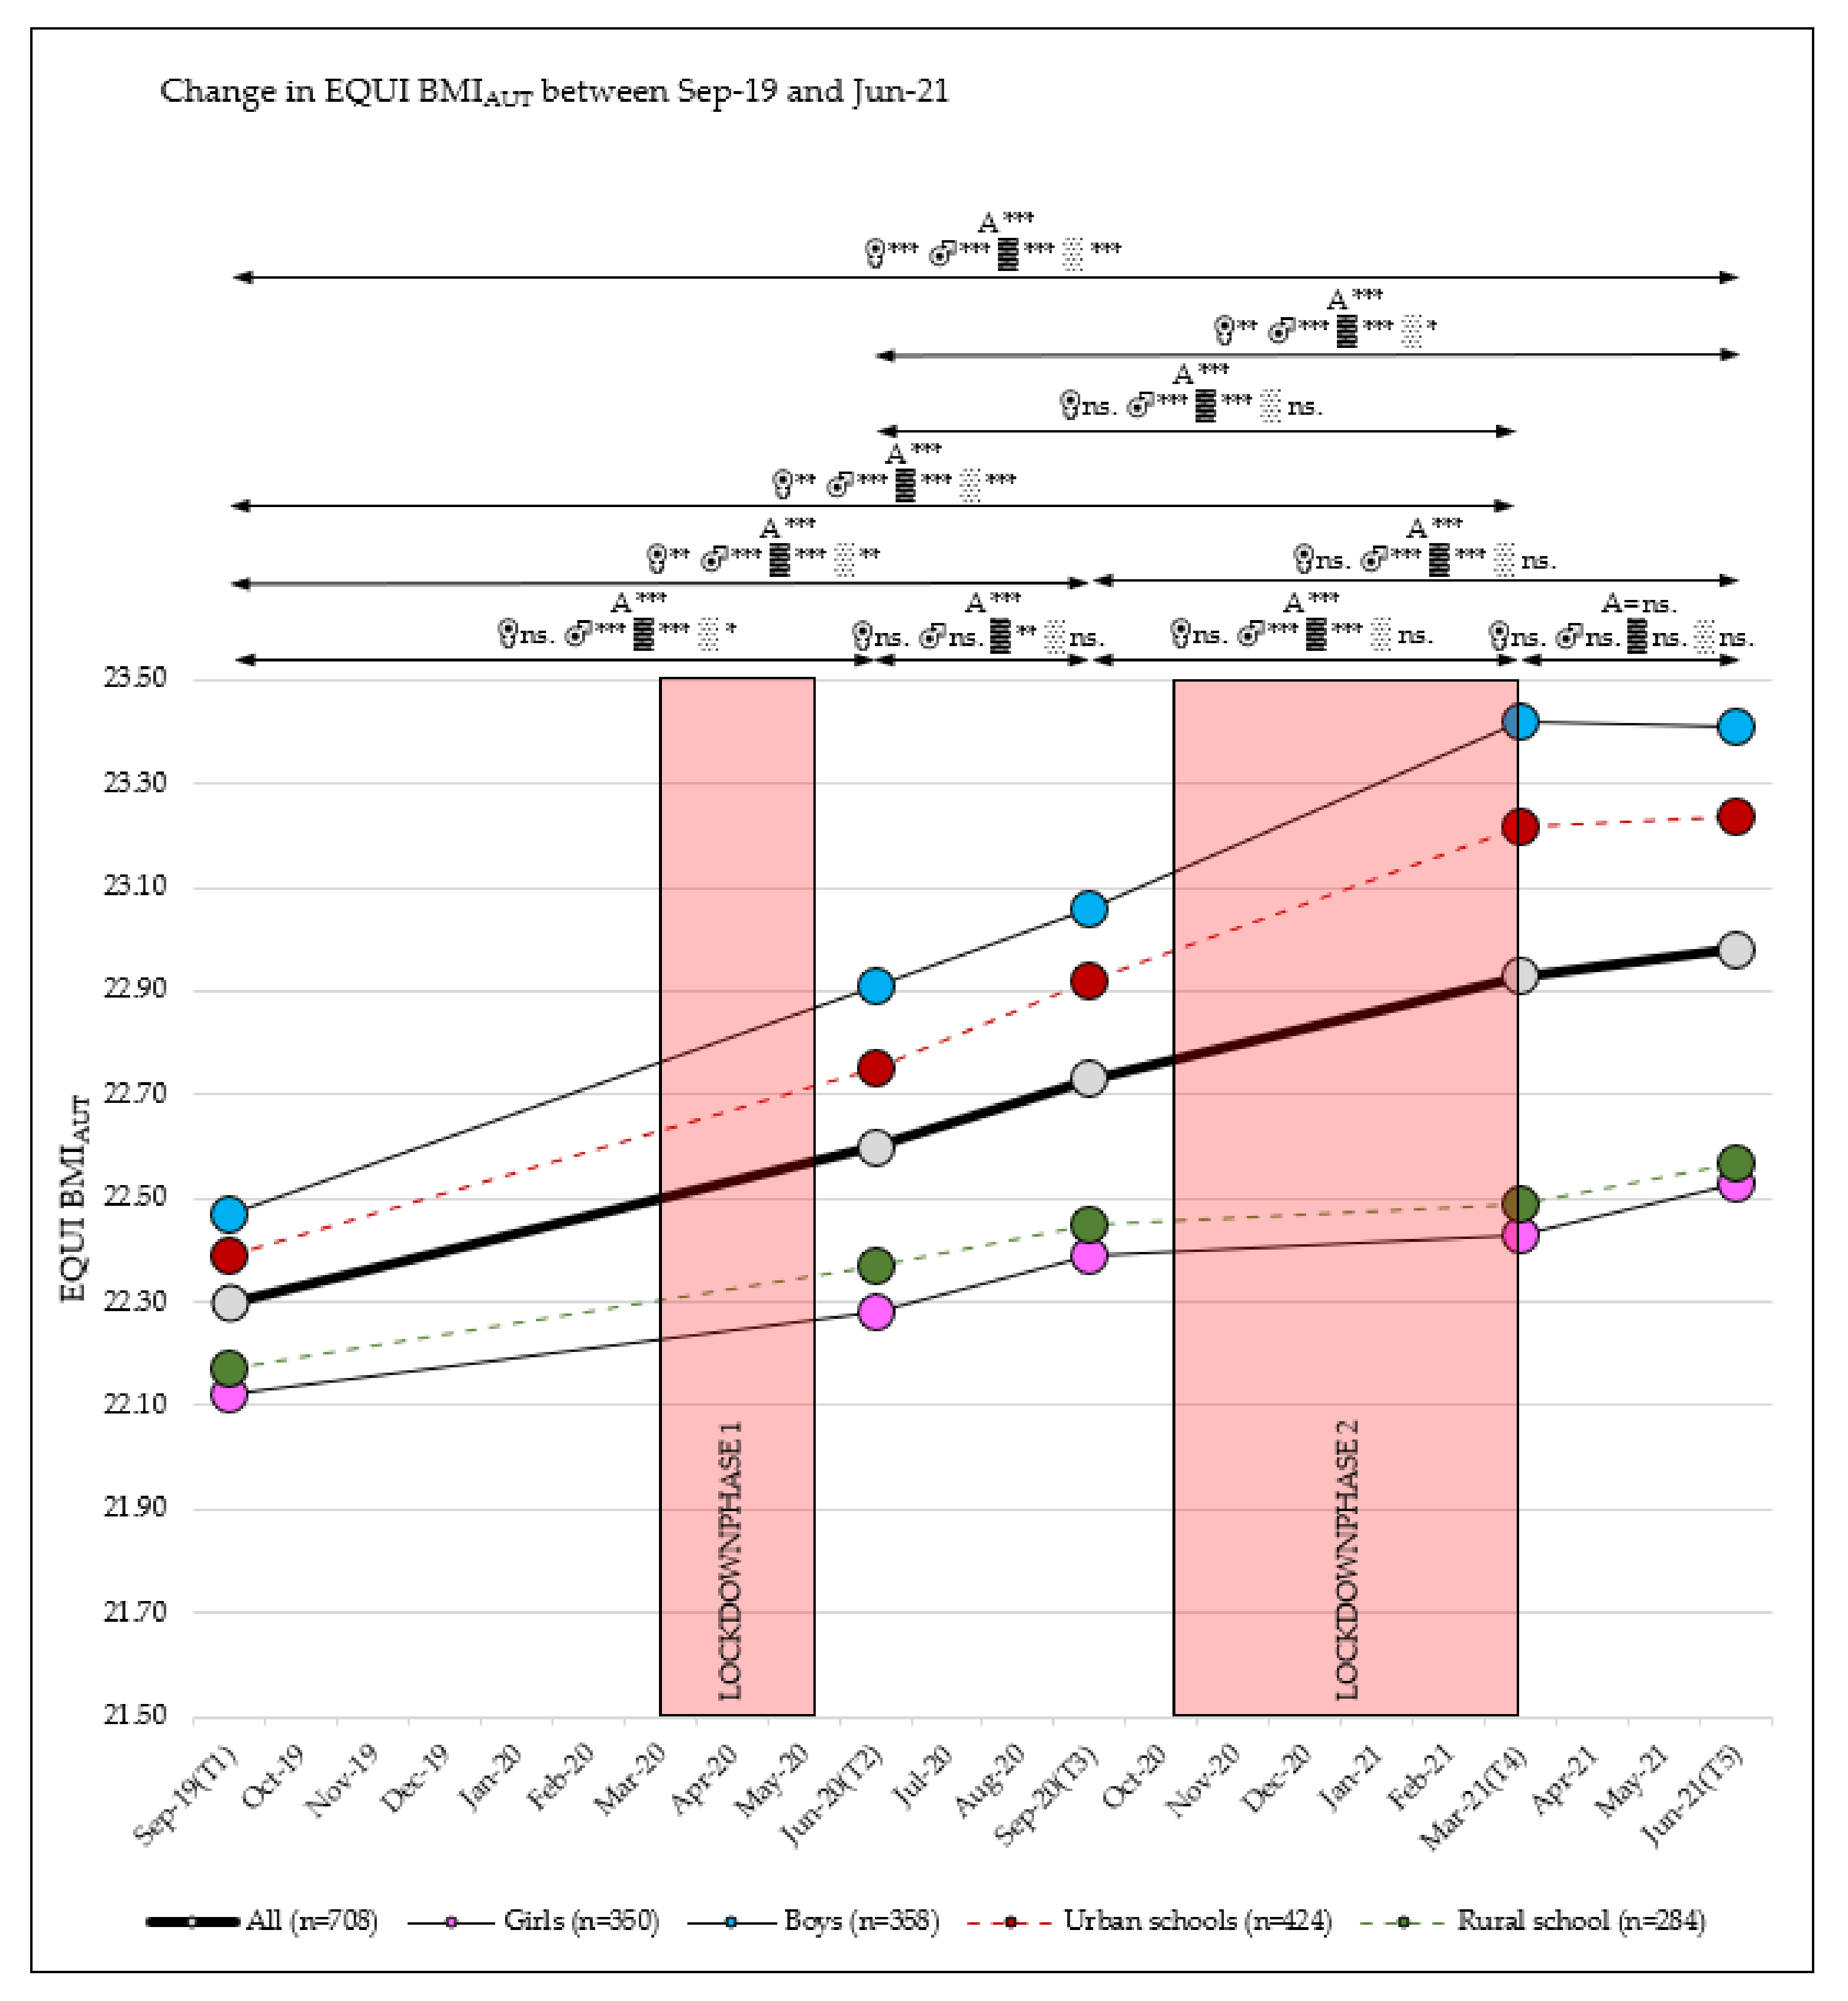
3.1. Change in BMI
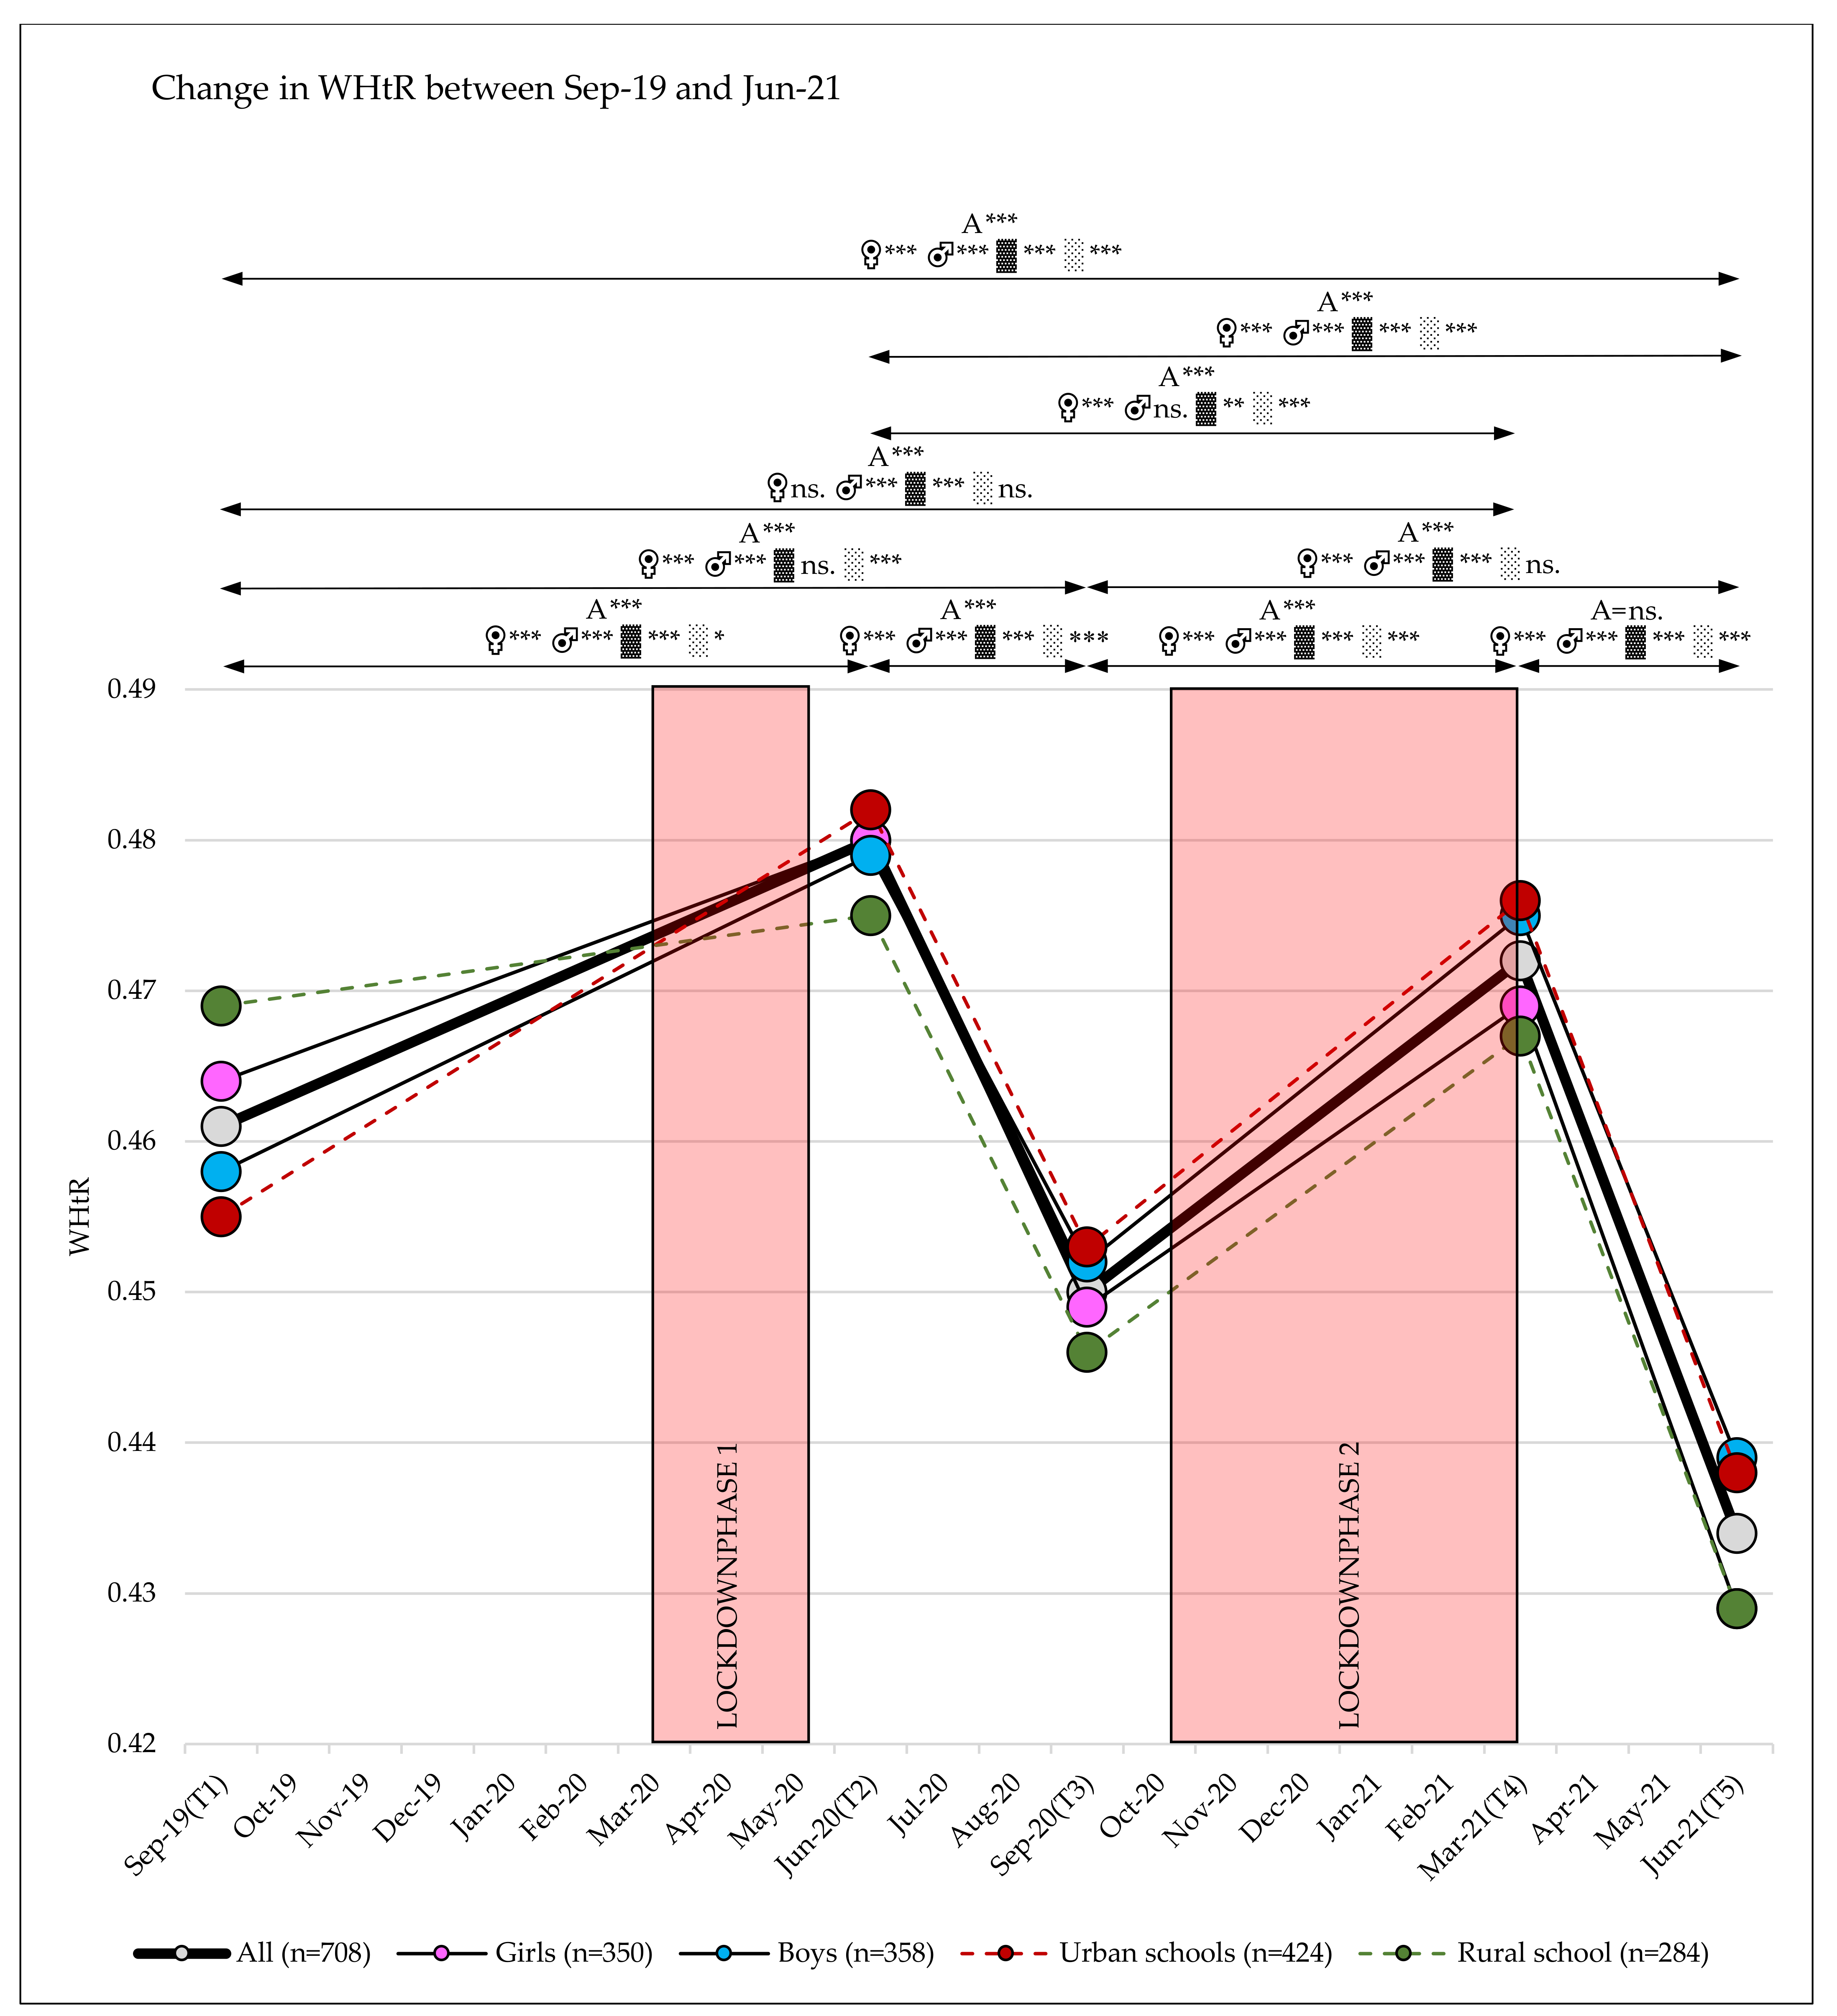
3.2. Change in WHtR
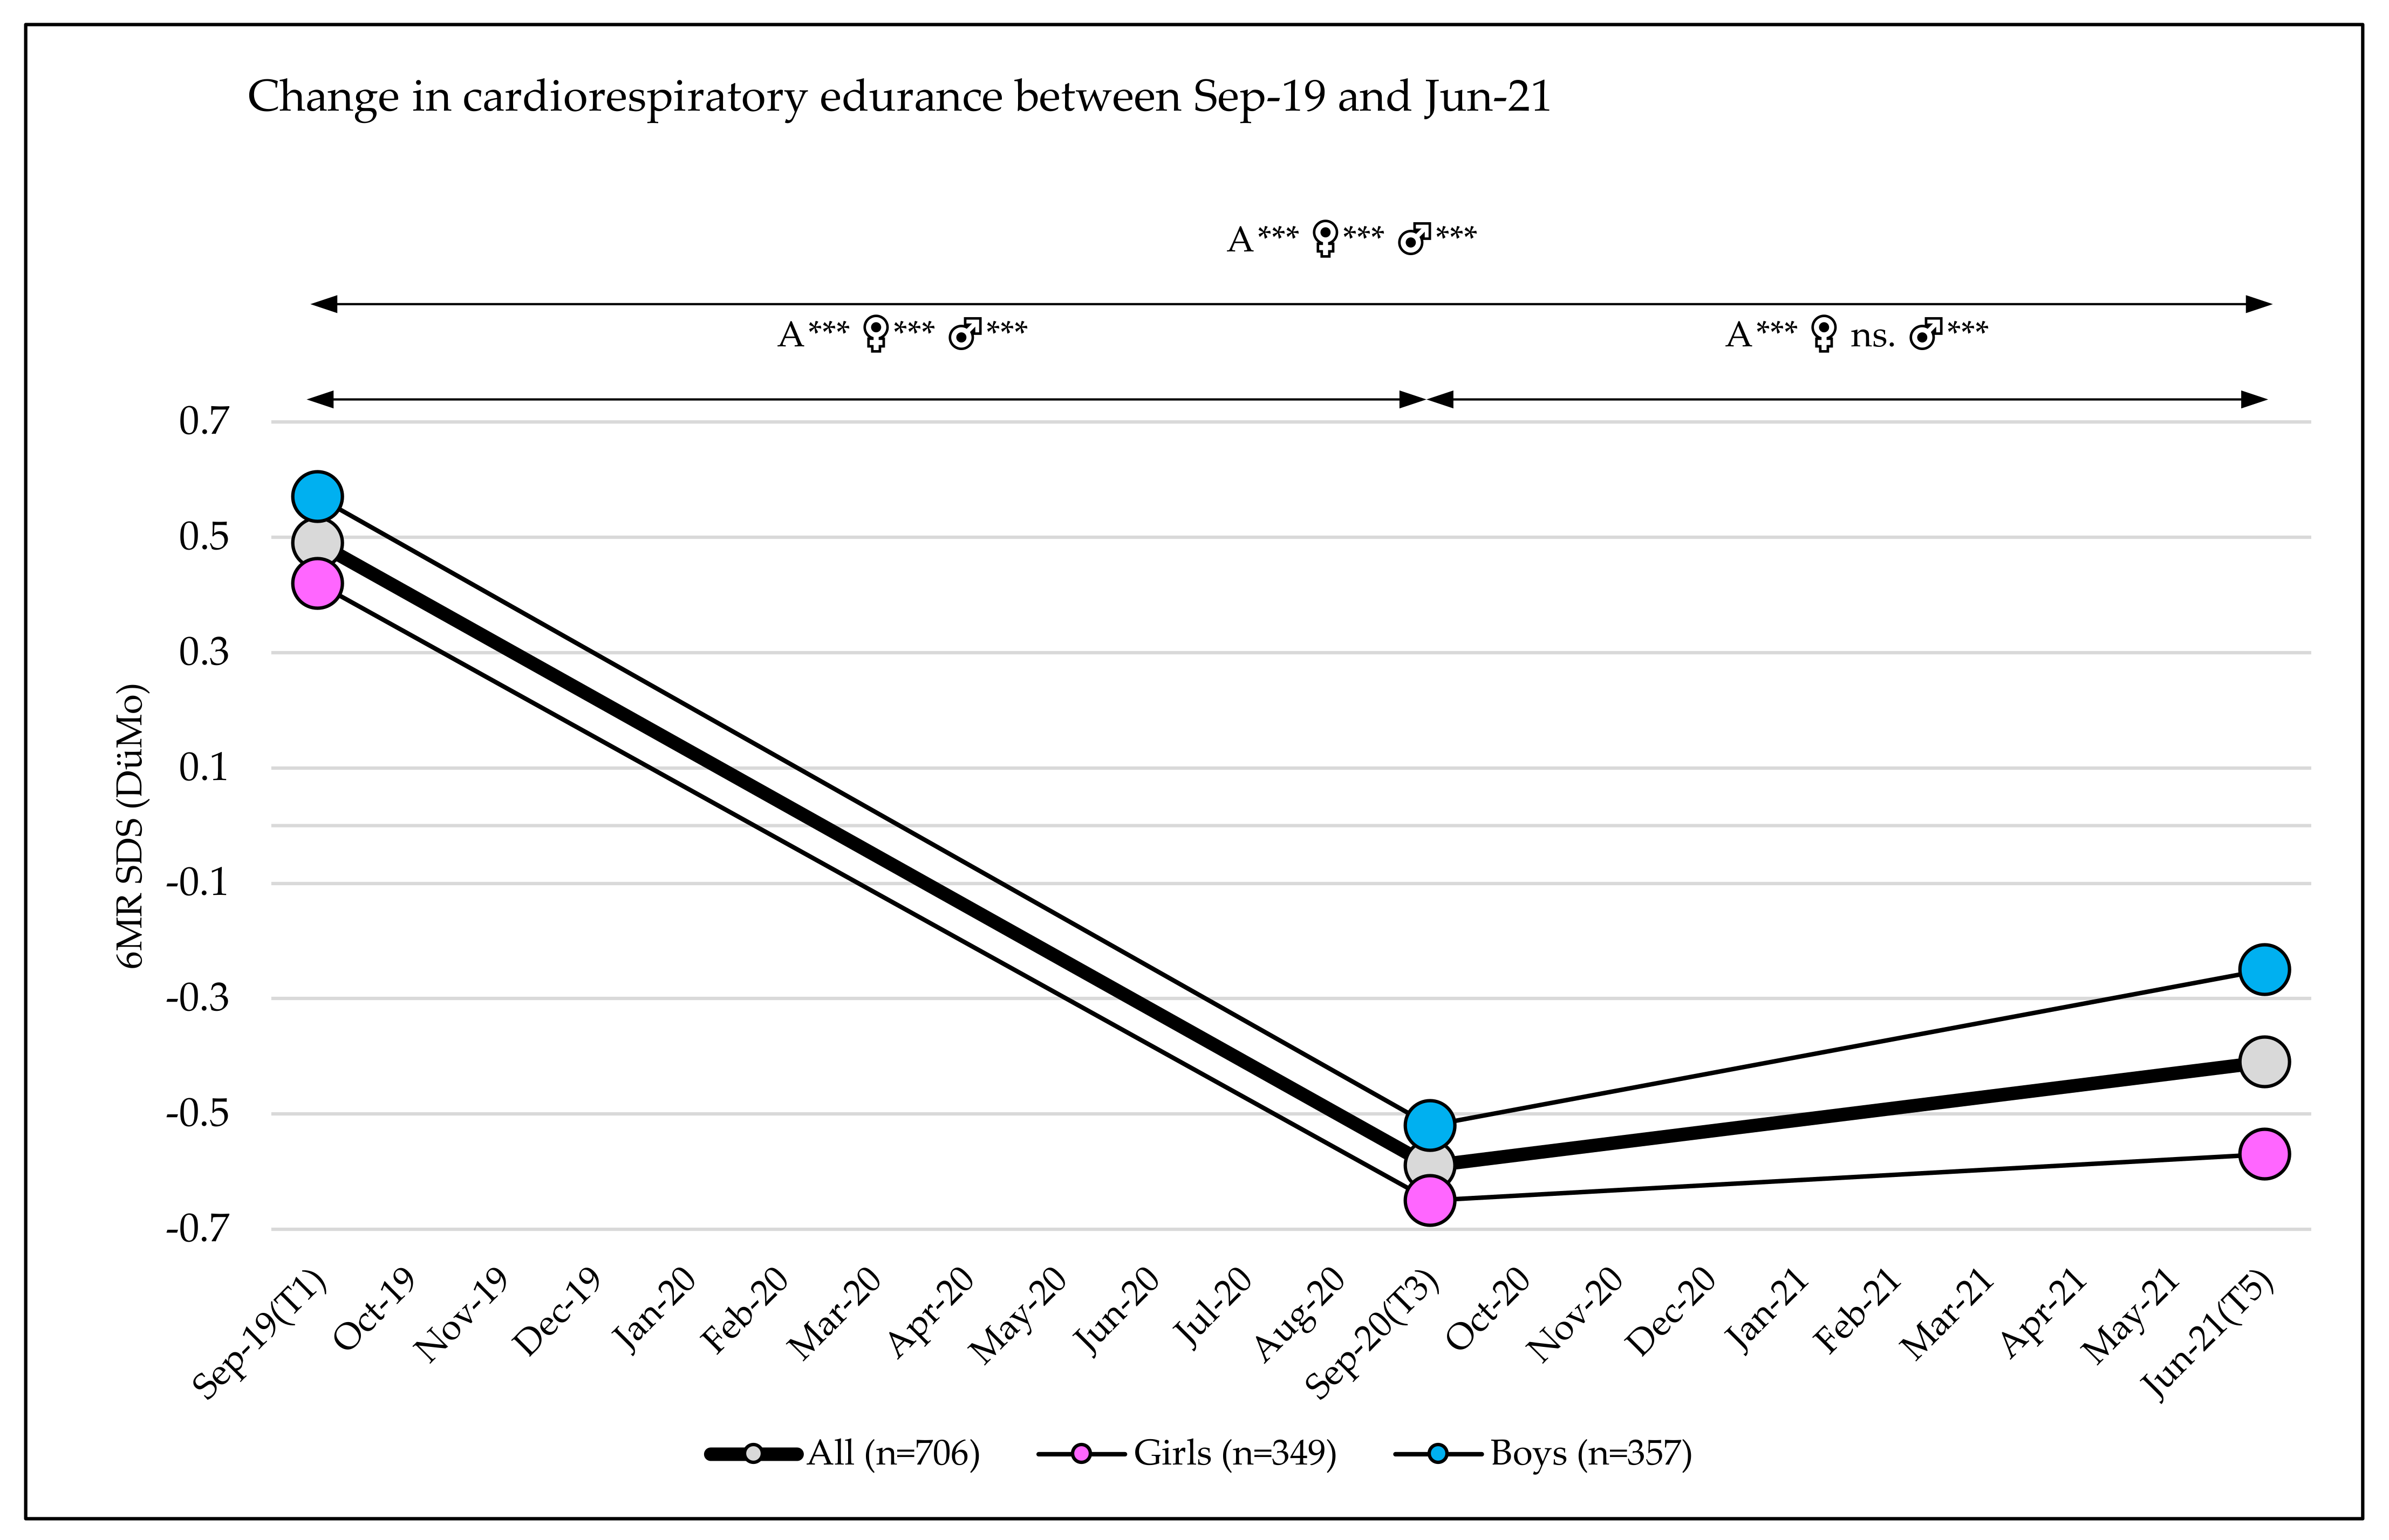
3.3. Change in Fitness
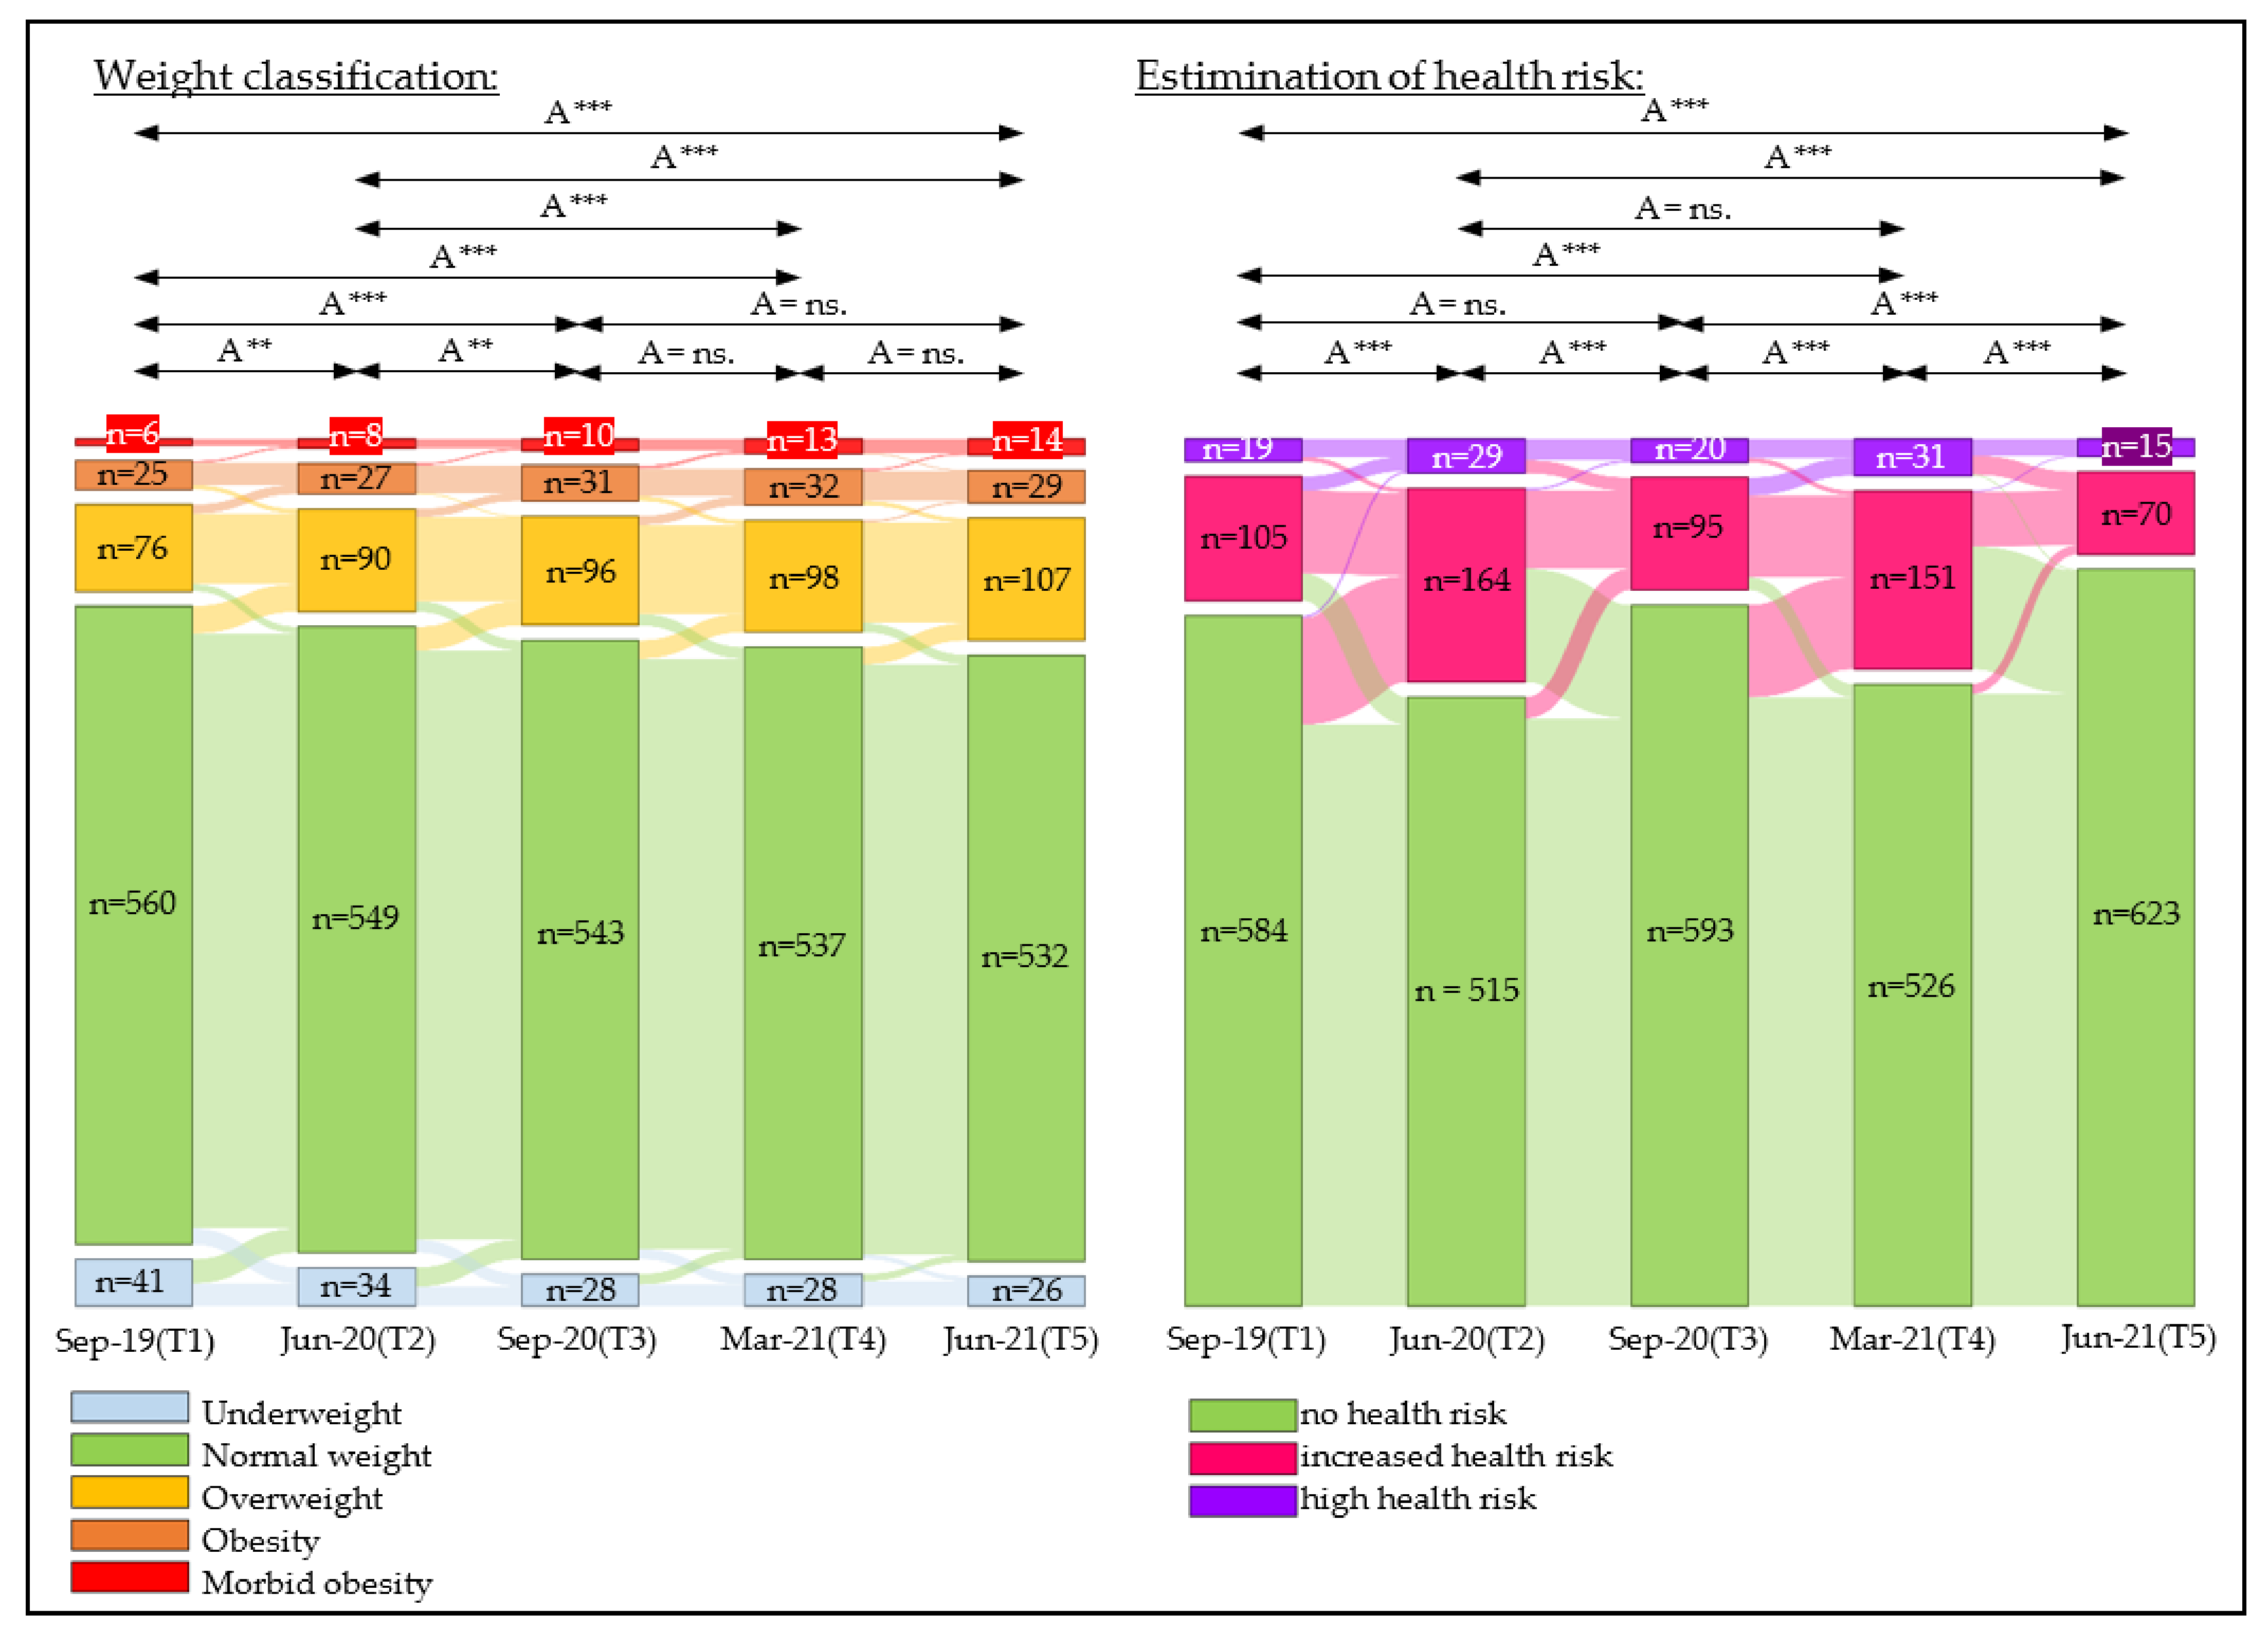
3.4. Change in Weight Classifications
3.5. Change in Estimation of Health Risk
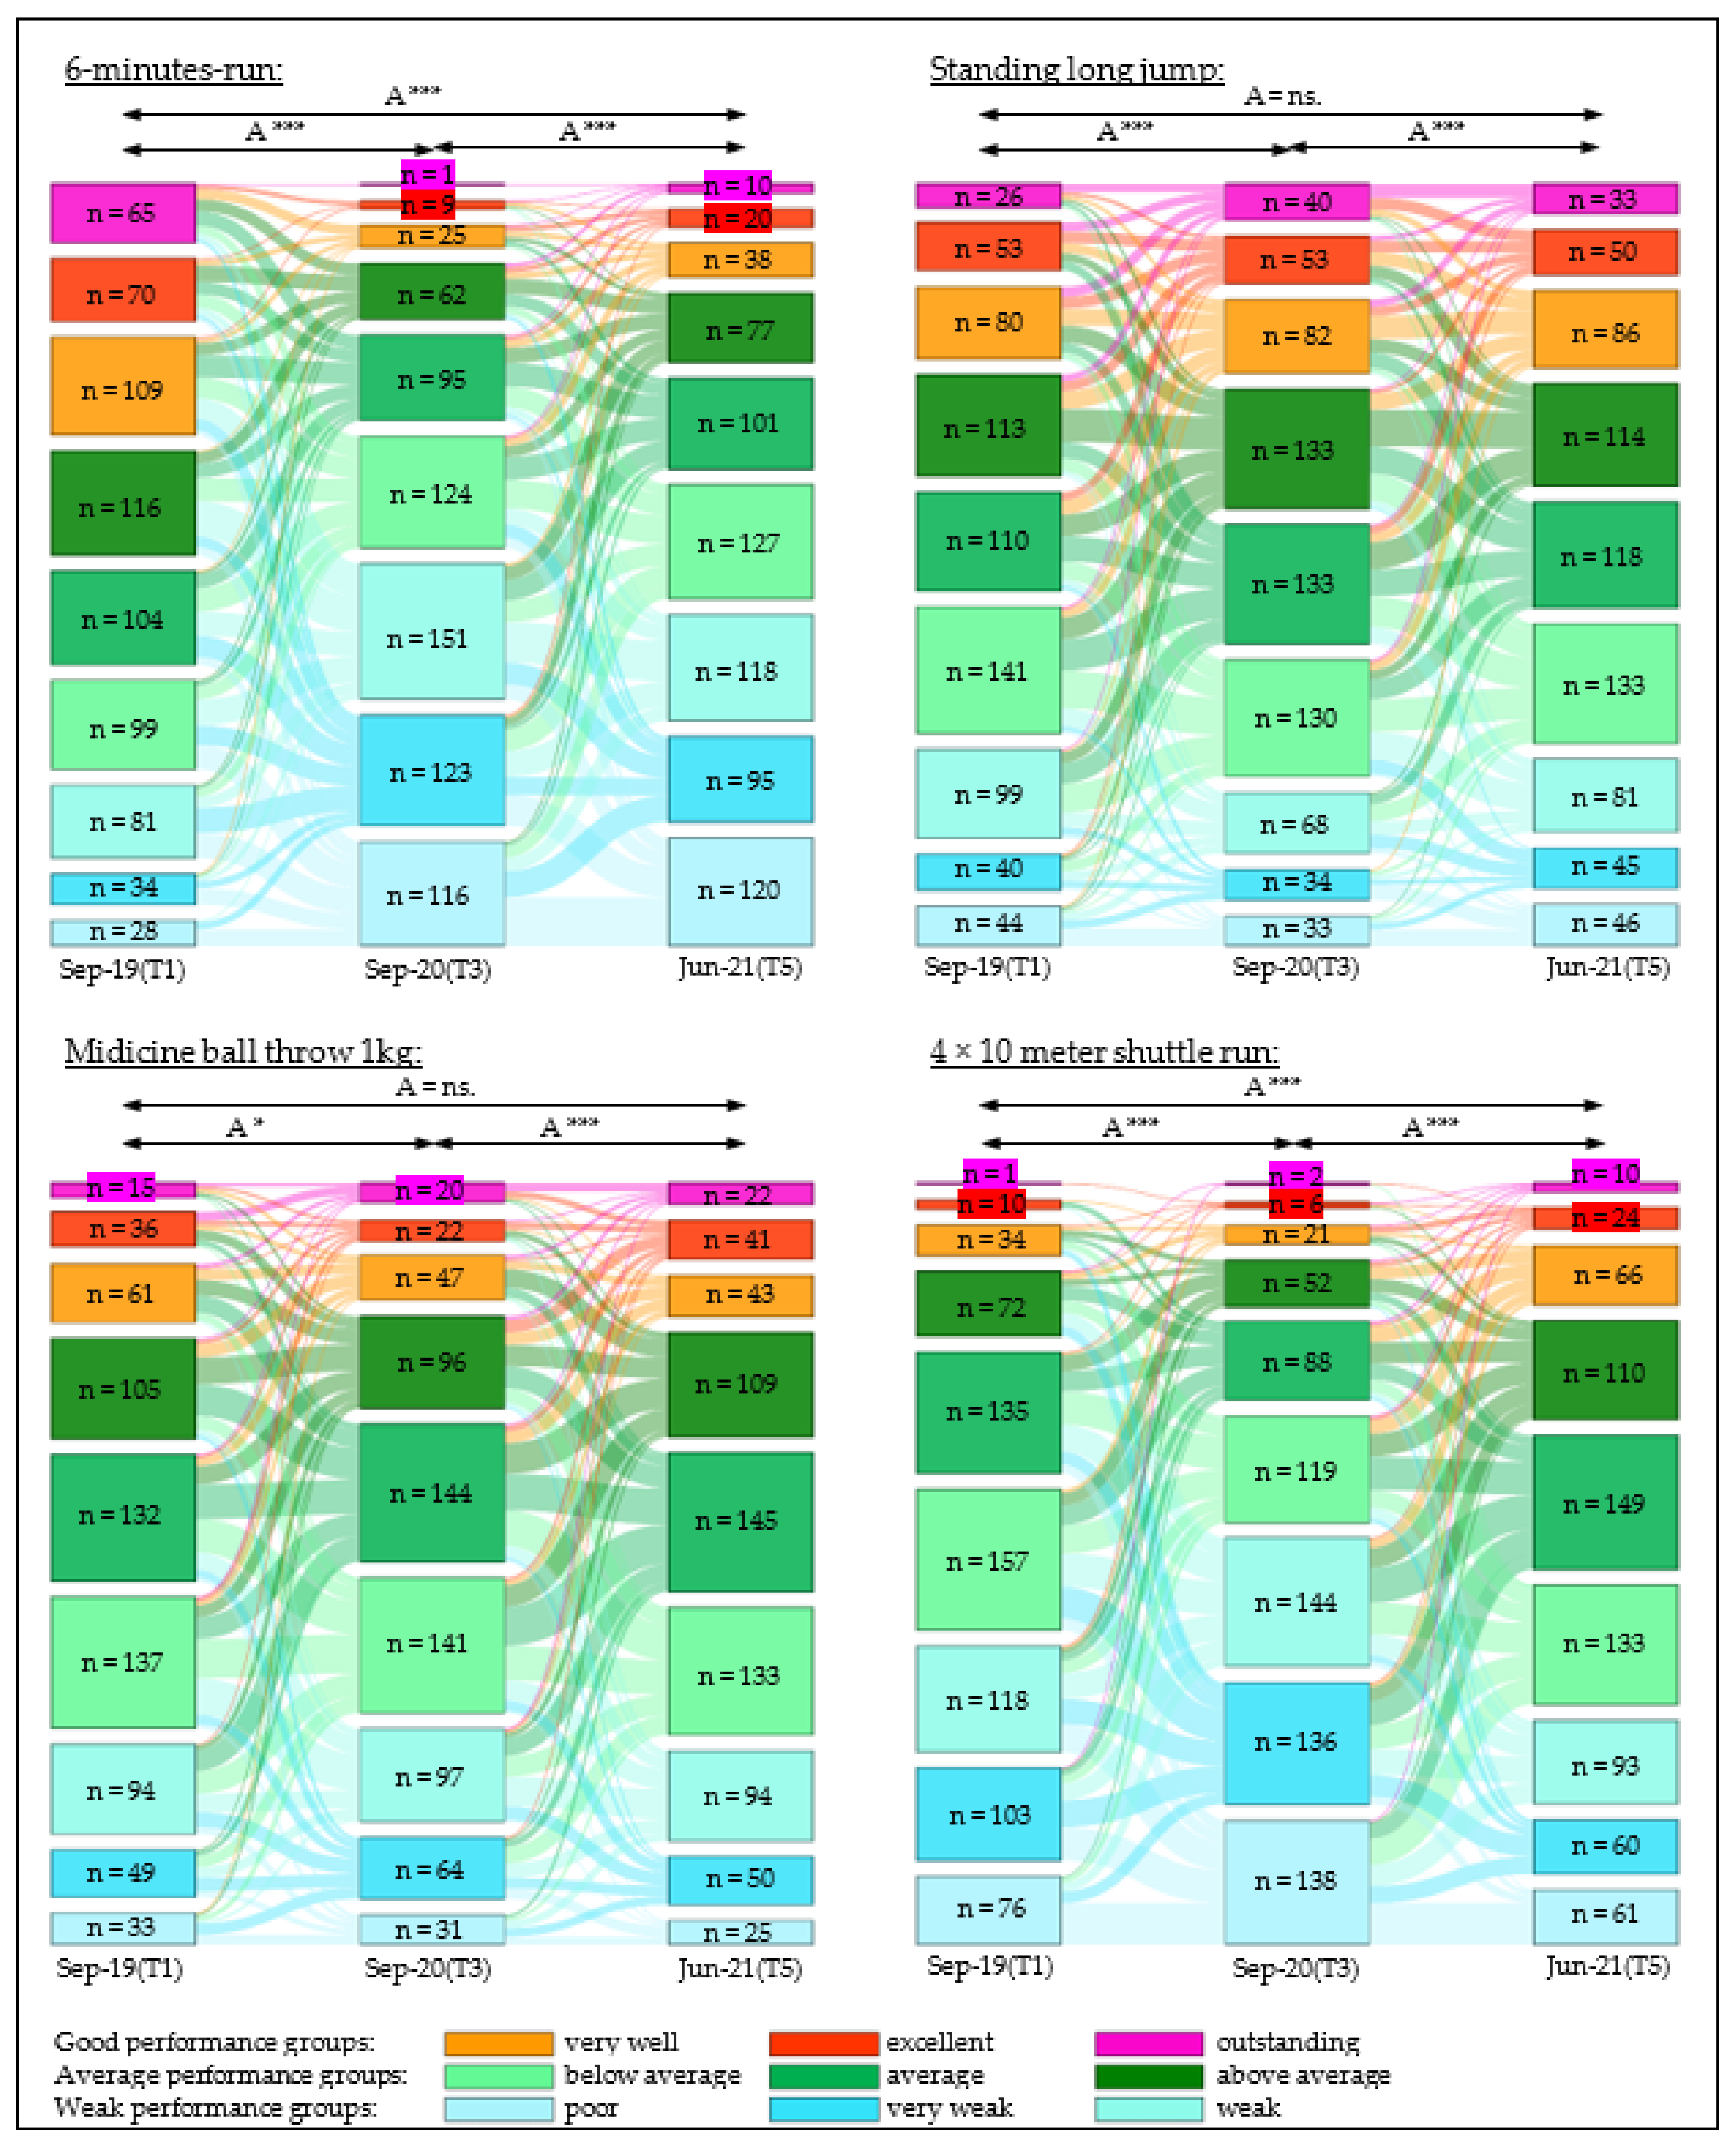
3.6. Change in Classification of Cardiorespiratory Endurance
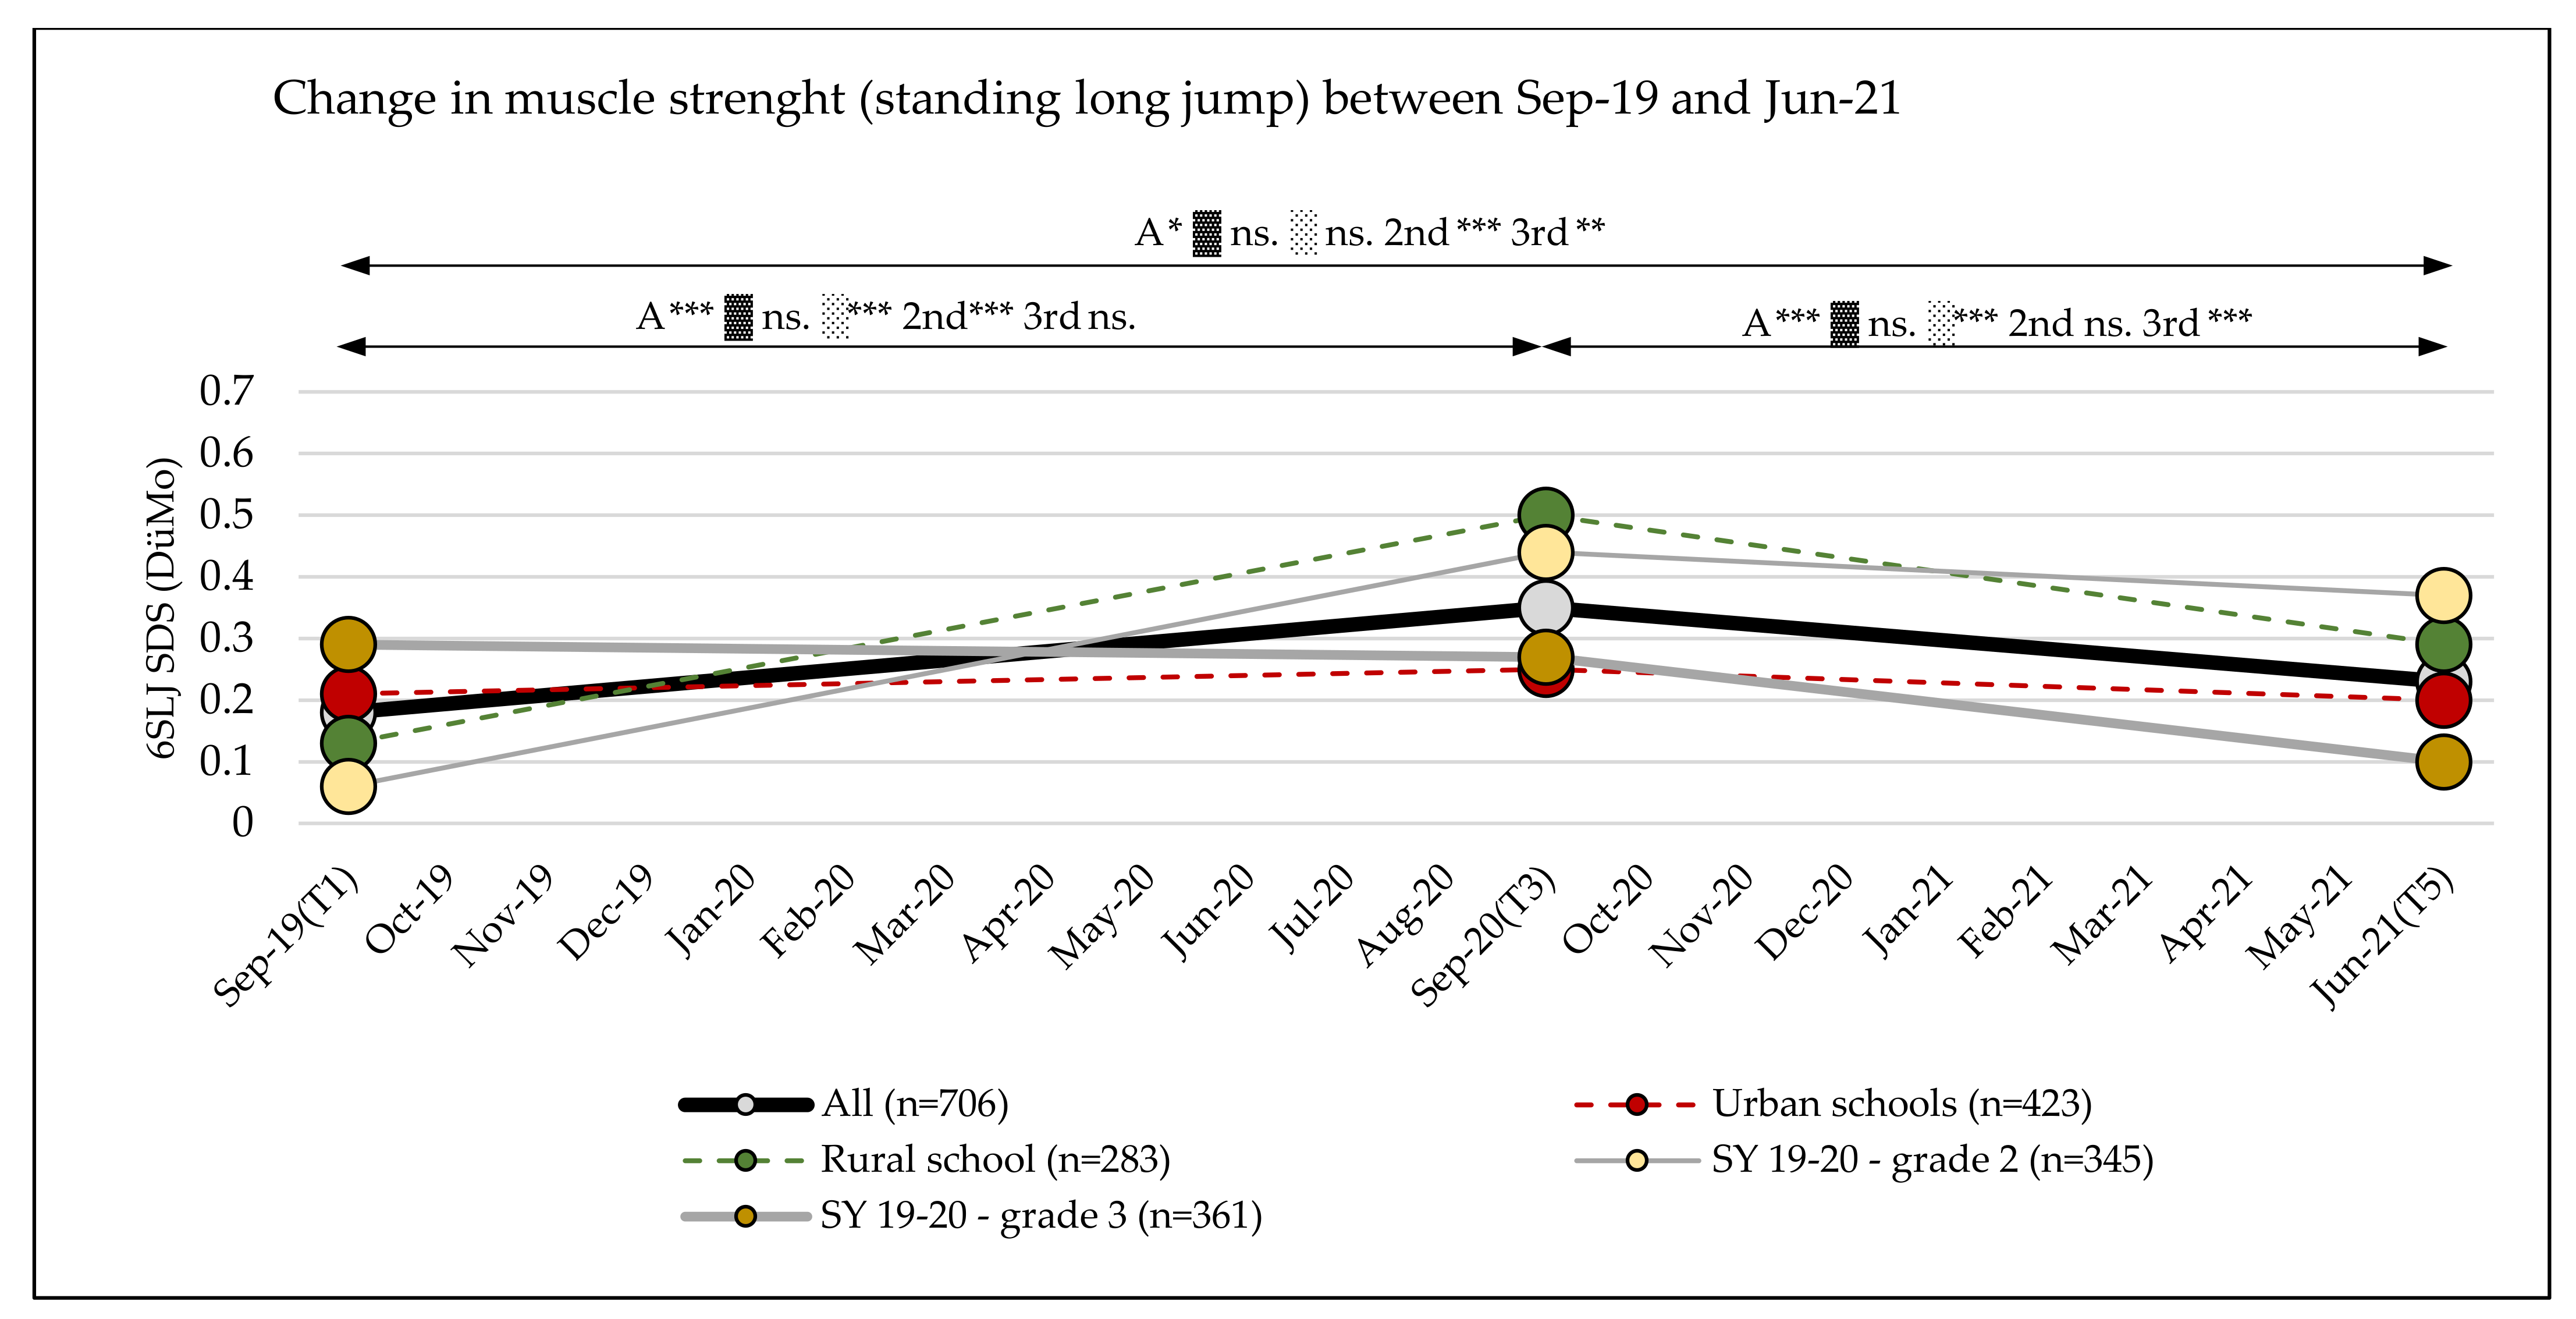
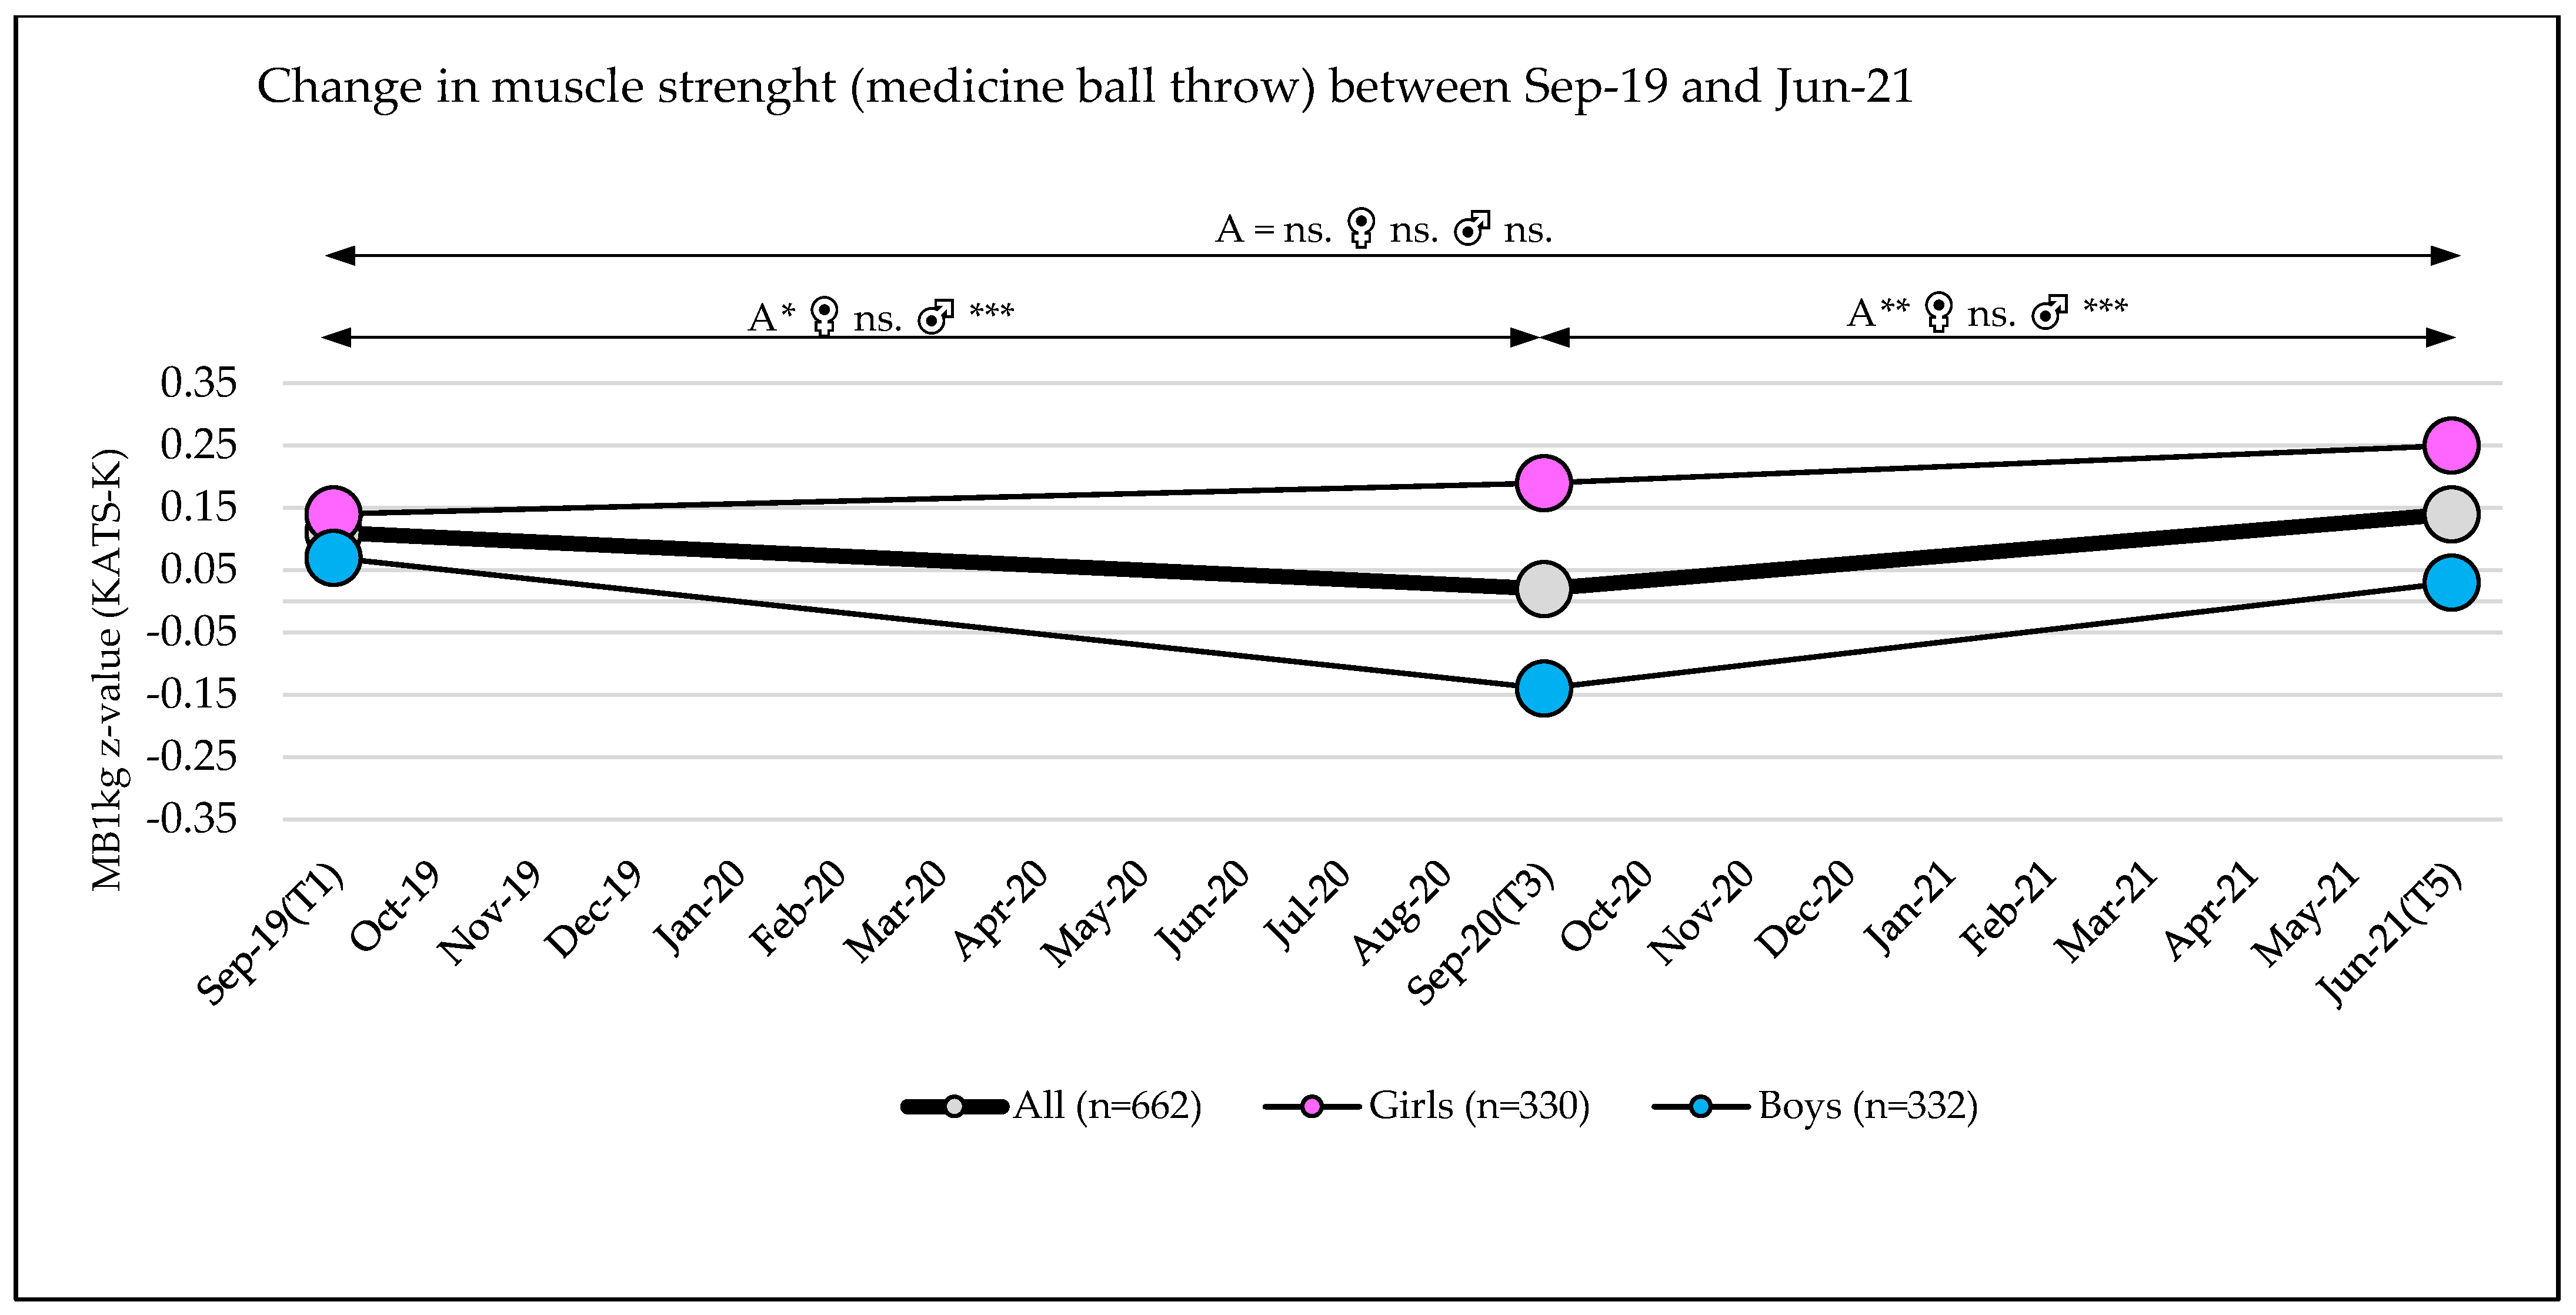
3.7. Change in the Classification of Muscle Strength
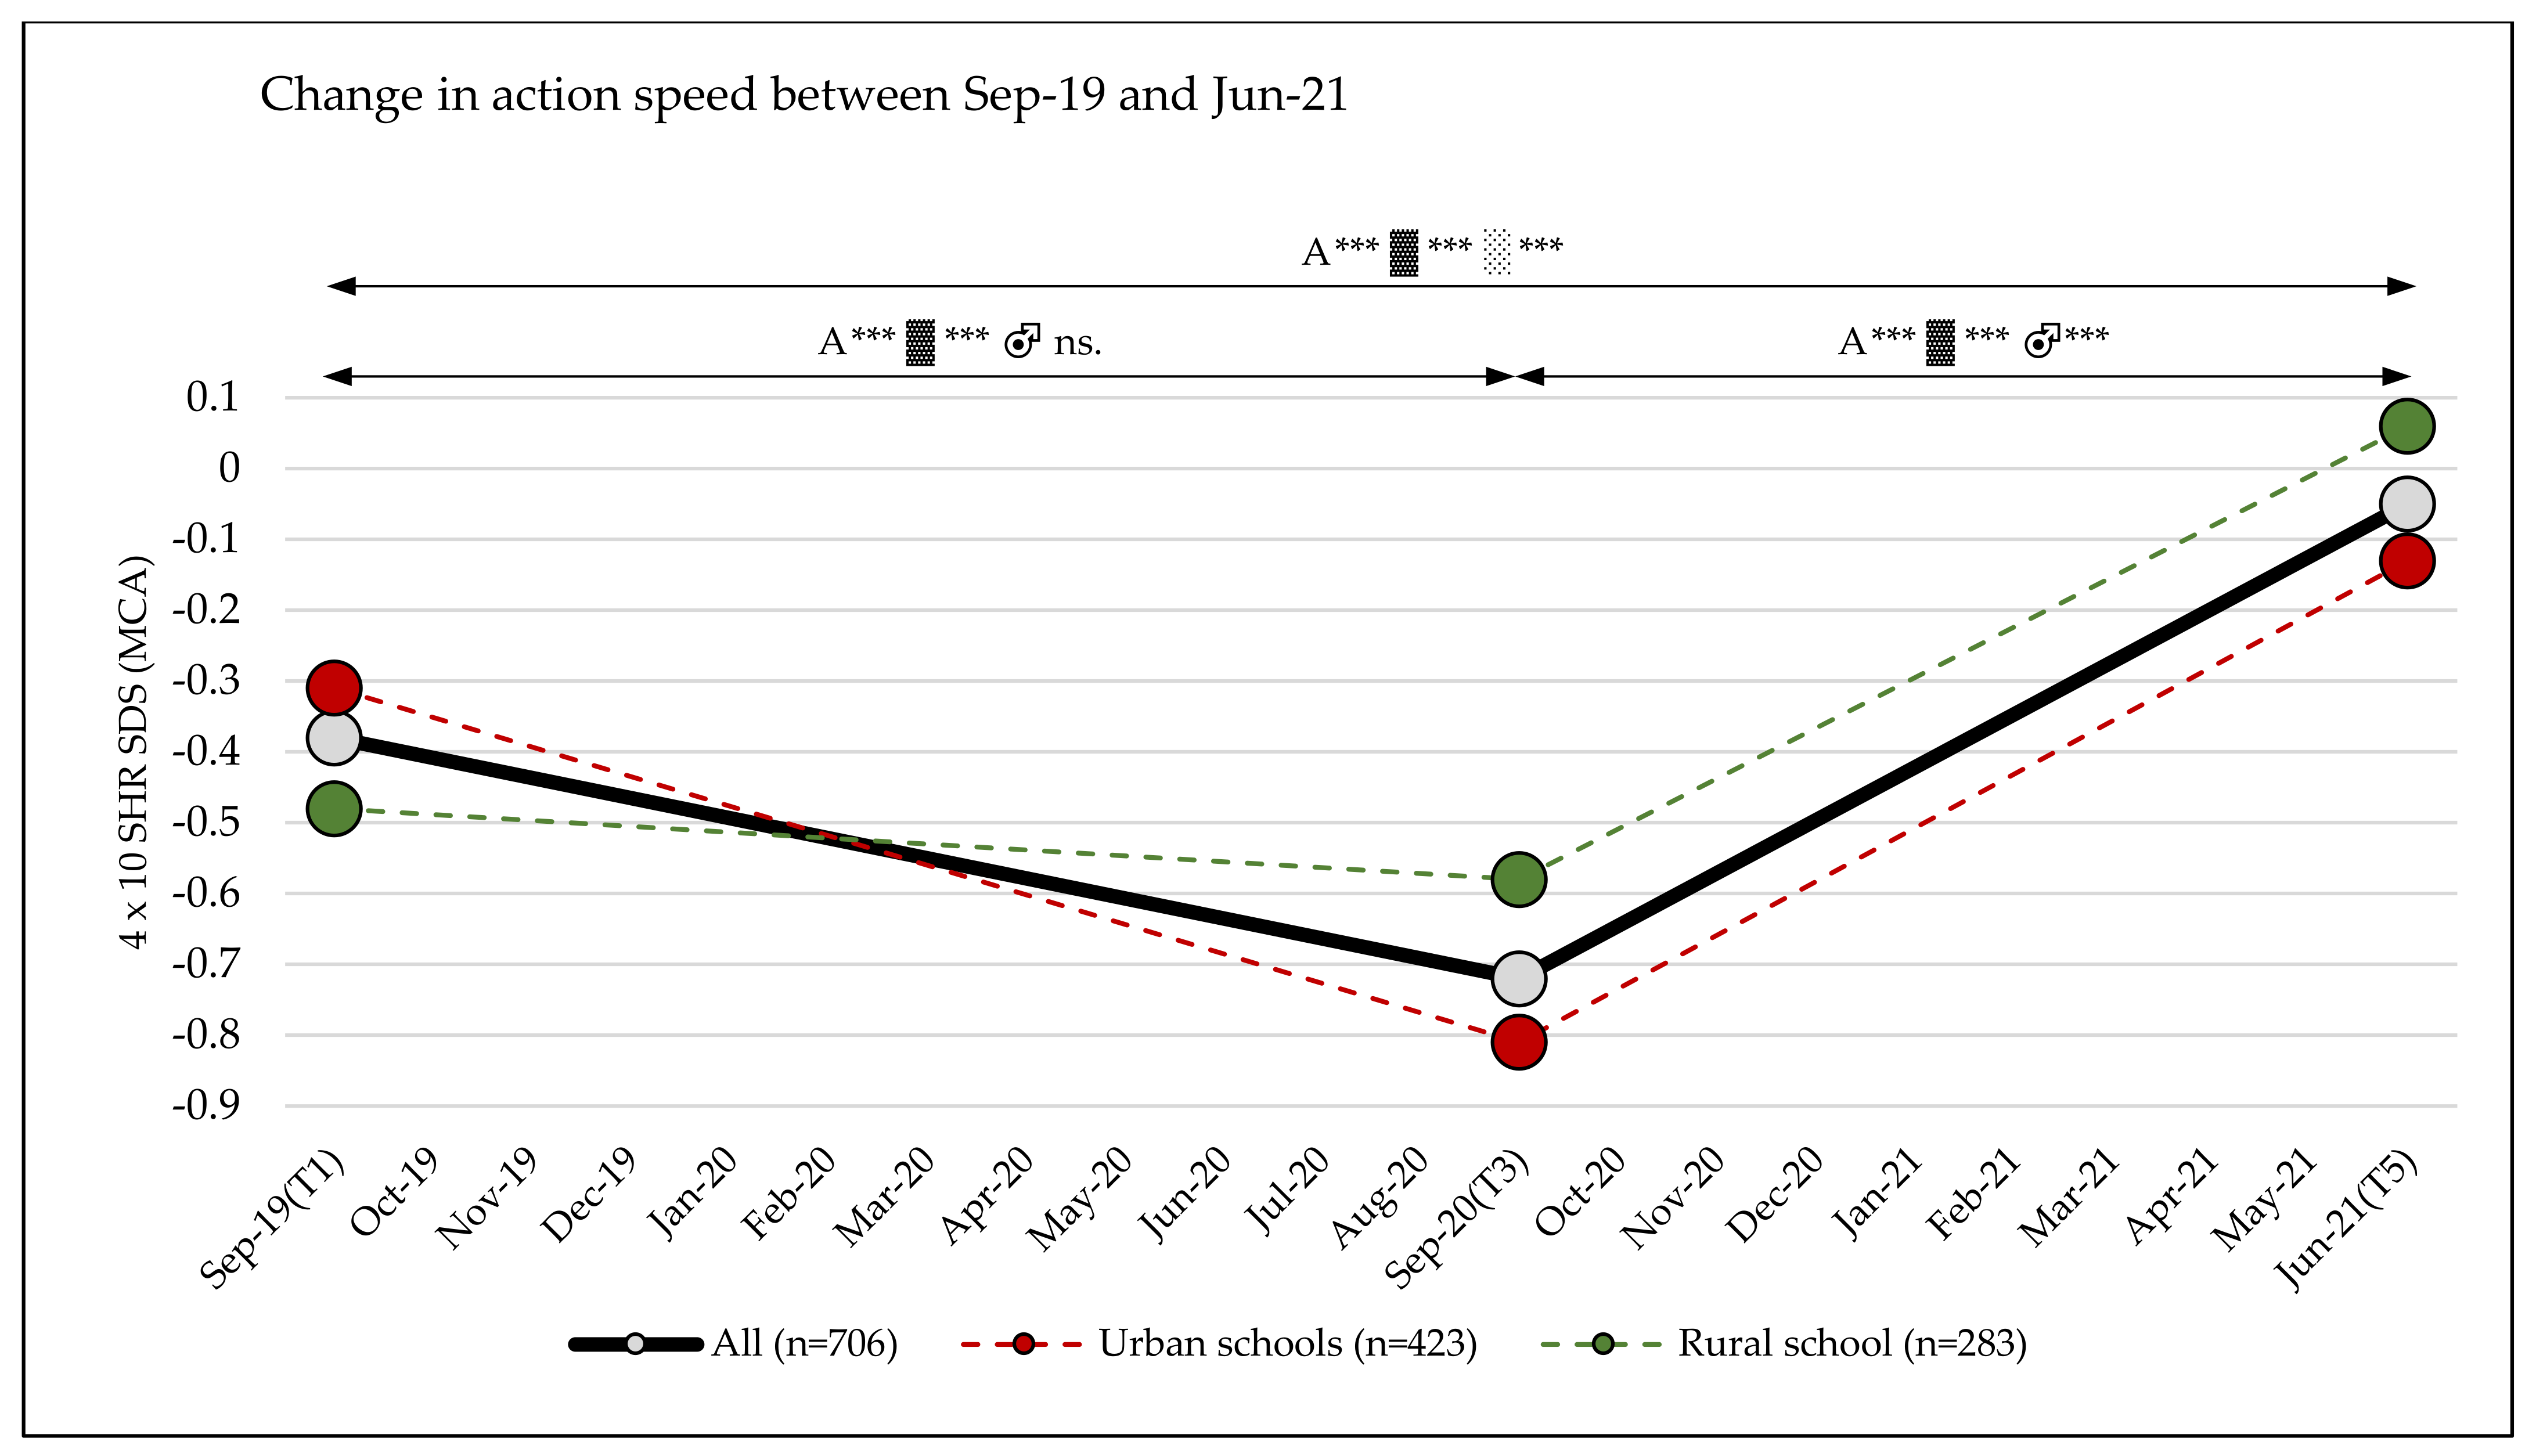
3.8. Change in the Classification of Action Speed
4. Discussion
5. Conclusions
Supplementary Materials
Author Contributions
Funding
Institutional Review Board Statement
Informed Consent Statement
Data Availability Statement
Acknowledgments
Conflicts of Interest
References
- Janssen, I.; Leblanc, A.G. Systematic review of the health benefits of physical activity and fitness in school-aged children and youth. Int. J. Behav. Nutr. Phys. Act. 2010, 7, 40. [Google Scholar] [CrossRef] [PubMed]
- Ács, P.; Betlehem, J.; Oláh, A.; Bergier, J.; Melczer, C.; Prémusz, V.; Makai, A. Measurement of public health benefits of physical activity: Validity and reliability study of the international physical activity questionnaire in Hungary. BMC Public Health 2020, 20, 1198. [Google Scholar] [CrossRef] [PubMed]
- Warburton, D.E.R.; Nicol, C.W.; Bredin, S.S.D. Health benefits of physical activity: The evidence. CMAJ 2006, 174, 801–809. [Google Scholar] [CrossRef]
- García-Hermoso, A.; Ramírez-Vélez, R.; García-Alonso, Y.; Alonso-Martínez, A.M.; Izquierdo, M. Association of Cardiorespiratory Fitness Levels During Youth With Health Risk Later in Life: A Systematic Review and Meta-analysis. JAMA Pediatr. 2020, 174, 952–960. [Google Scholar] [CrossRef]
- Warburton, D.E.R.; Bredin, S.S.D. Health Benefits of Physical Activity: A Strengths-Based Approach. J. Clin. Med. 2019, 8, 2044. [Google Scholar] [CrossRef]
- Eddolls, W.T.B.; McNarry, M.A.; Lester, L.; Winn, C.O.N.; Stratton, G.; Mackintosh, K.A. The association between physical activity, fitness and body mass index on mental well-being and quality of life in adolescents. Qual. Life Res. 2018, 27, 2313–2320. [Google Scholar] [CrossRef]
- Abarca-Gómez, L.; Abdeen, Z.A.; Hamid, Z.A.; Abu-Rmeileh, N.M.; Acosta-Cazares, B.; Acuin, C.; Adams, R.J.; Aekplakorn, W.; Afsana, K.; Aguilar-Salinas, C.A.; et al. Worldwide trends in body-mass index, underweight, overweight, and obesity from 1975 to 2016: A pooled analysis of 2416 population-based measurement studies in 128.9 million children, adolescents, and adults. Lancet 2017, 390, 2627–2642. [Google Scholar] [CrossRef]
- Mintjens, S.; Menting, M.D.; Daams, J.G.; van Poppel, M.N.M.; Roseboom, T.J.; Gemke, R.J.B.J. Cardiorespiratory Fitness in Childhood and Adolescence Affects Future Cardiovascular Risk Factors: A Systematic Review of Longitudinal Studies. Sports Med. 2018, 48, 2577–2605. [Google Scholar] [CrossRef] [PubMed]
- McAuley, E.; Rudolph, D. Physical Activity, Aging, and Psychological Well-Being. J. Aging Phys. Act. 1995, 3, 67–96. [Google Scholar] [CrossRef]
- García, P.L.R.; Marcos, L.T.; Guillamón, A.R.; García-Cantó, E.; Pérez-Soto, J.J.; Casas, A.G.; Lopez, P.T. Physical Fitness Level and Its Relationship with Self-Concept in School Children. PSYCH 2014, 5, 2009–2017. [Google Scholar] [CrossRef][Green Version]
- Ács, P.; Stocker, M.; Füge, K.; Paár, D.; Oláh, A.; Kovács, A. Economic and public health benefits: The result of increased regular physical activity. Eur. J. Integr. Med. 2016, 8, 8–12. [Google Scholar] [CrossRef]
- Elbe, A.-M.; Lyhne, S.N.; Madsen, E.E.; Krustrup, P. Is regular physical activity a key to mental health? Commentary on Association between physical exercise and mental health in 1.2 million individuals in the USA between 2011 and 2015: A cross-sectional study, by Chekroud et al., published in Lancet Psychiatry. J. Sport Health Sci. 2019, 8, 6–7. [Google Scholar] [CrossRef] [PubMed]
- Marker, A.M.; Steele, R.G.; Noser, A.E. Physical activity and health-related quality of life in children and adolescents: A systematic review and meta-analysis. Health Psychol. 2018, 37, 893–903. [Google Scholar] [CrossRef] [PubMed]
- Carnethon, M.R.; Gidding, S.S.; Nehgme, R.; Sidney, S.; Jacobs, D.R.; Liu, K. Cardiorespiratory fitness in young adulthood and the development of cardiovascular disease risk factors. JAMA 2003, 290, 3092–3100. [Google Scholar] [CrossRef] [PubMed]
- Wang, Y.; Lobstein, T. Worldwide trends in childhood overweight and obesity. Int. J. Pediatric Obes. 2006, 1, 11–25. [Google Scholar] [CrossRef]
- Bi, C.; Zhang, F.; Gu, Y.; Song, Y.; Cai, X. Secular Trend in the Physical Fitness of Xinjiang Children and Adolescents between 1985 and 2014. Int. J. Environ. Res. Public Health 2020, 17, 2195. [Google Scholar] [CrossRef]
- Dong, Y.; Lau, P.W.C.; Dong, B.; Zou, Z.; Yang, Y.; Wen, B.; Ma, Y.; Hu, P.; Song, Y.; Ma, J.; et al. Trends in physical fitness, growth, and nutritional status of Chinese children and adolescents: A retrospective analysis of 1·5 million students from six successive national surveys between 1985 and 2014. Lancet Child Adolesc. Health 2019, 3, 871–880. [Google Scholar] [CrossRef]
- Masanovic, B.; Gardasevic, J.; Marques, A.; Peralta, M.; Demetriou, Y.; Sturm, D.J.; Popovic, S. Trends in Physical Fitness Among School-Aged Children and Adolescents: A Systematic Review. Front. Pediatr. 2020, 8, 627529. [Google Scholar] [CrossRef]
- Fühner, T.; Kliegl, R.; Arntz, F.; Kriemler, S.; Granacher, U. An Update on Secular Trends in Physical Fitness of Children and Adolescents from 1972 to 2015: A Systematic Review. Sports Med. 2021, 51, 303–320. [Google Scholar] [CrossRef]
- Tomkinson, G.R.; Léger, L.A.; Olds, T.S.; Cazorla, G. Secular trends in the performance of children and adolescents (1980–2000): An analysis of 55 studies of the 20 m shuttle run test in 11 countries. Sports Med. 2003, 33, 285–300. [Google Scholar] [CrossRef] [PubMed]
- Moliner-Urdiales, D.; Ruiz, J.R.; Ortega, F.B.; Jiménez-Pavón, D.; Vicente-Rodriguez, G.; Rey-López, J.P.; Martínez-Gómez, D.; Casajús, J.A.; Mesana, M.I.; Marcos, A.; et al. Secular trends in health-related physical fitness in Spanish adolescents: The AVENA and HELENA studies. J. Sci. Med. Sport 2010, 13, 584–588. [Google Scholar] [CrossRef] [PubMed]
- Đurić, S.; Sember, V.; Starc, G.; Sorić, M.; Kovač, M.; Jurak, G. Secular trends in muscular fitness from 1983 to 2014 among Slovenian children and adolescents. Scand. J. Med. Sci. Sports 2021, 31, 1853–1861. [Google Scholar] [CrossRef]
- Tomkinson, G.R.; Lang, J.J.; Tremblay, M.S. Temporal trends in the cardiorespiratory fitness of children and adolescents representing 19 high-income and upper middle-income countries between 1981 and 2014. Br. J. Sports Med. 2019, 53, 478–486. [Google Scholar] [CrossRef]
- López-Gil, J.F.; Brazo-Sayavera, J.; Yuste Lucas, J.L.; Renato Cavichiolli, F. Weight Status Is Related to Health-Related Physical Fitness and Physical Activity but Not to Sedentary Behaviour in Children. Int. J. Environ. Res. Public Health 2020, 17, 4518. [Google Scholar] [CrossRef]
- Pojskic, H.; Eslami, B. Relationship Between Obesity, Physical Activity, and Cardiorespiratory Fitness Levels in Children and Adolescents in Bosnia and Herzegovina: An Analysis of Gender Differences. Front. Physiol. 2018, 9, 1734. [Google Scholar] [CrossRef] [PubMed]
- Muntaner-Mas, A.; Palou, P.; Vidal-Conti, J.; Esteban-Cornejo, I. A Mediation Analysis on the Relationship of Physical Fitness Components, Obesity, and Academic Performance in Children. J. Pediatr. 2018, 198, P90–P97.E4. [Google Scholar] [CrossRef] [PubMed]
- Ortega, F.B.; Ruiz, J.R.; Castillo, M.J.; Sjöström, M. Physical fitness in childhood and adolescence: A powerful marker of health. Int. J. Obes. 2008, 32, 1–11. [Google Scholar] [CrossRef]
- Stemper, T.; Bachmann, C.; Diehlmann, K.; Kemper, B. DüMo Düsseldorfer Modell der Bewegungs-, Sport- und Talentförderung: 2003–2018: Konzept, Normwerte, Untersuchungsergebnisse; LIT: Berlin, Germany, 2020; ISBN 9783643147783. [Google Scholar]
- Jurak, G.; Kovac, M.; Sember, V.; Starc, G. 30 Years of SLOfit: Its Legacy and Perspective. Turk. J. Sports Med. 2019, 54, 23–27. [Google Scholar] [CrossRef]
- Morrow, J.R.; Zhu, W.; Franks, D.B.; Meredith, M.D.; Spain, C. 1958–2008: 50 Years of Youth Fitness Tests in the United States. Res. Q. Exerc. Sport 2009, 80, 1–11. [Google Scholar] [CrossRef]
- Green, M.; Collins, S. Policy, Politics and Path Dependency: Sport Development in Australia and Finland. Sport Manag. Rev. 2008, 11, 225–251. [Google Scholar] [CrossRef]
- Ellapen, T.J.; Paul, Y. A Historical Metamorphosis of Physical Education and Extra-curricular School Sport Activities in Chatsworth, Durban, South Africa (1960–2020). Orient. Anthropol. 2021, 21, 395–413. [Google Scholar] [CrossRef]
- Chesham, R.A.; Booth, J.N.; Sweeney, E.L.; Ryde, G.C.; Gorely, T.; Brooks, N.E.; Moran, C.N. Response to Daly-Smith et al.’s commentary on The Daily Mile makes primary school children more active, less sedentary and improves their fitness and body composition: A quasi-experimental pilot study. BMC Med. 2019, 17, 97. [Google Scholar] [CrossRef] [PubMed]
- Brustio, P.R.; Mulasso, A.; Lupo, C.; Massasso, A.; Rainoldi, A.; Boccia, G. The Daily Mile Is Able to Improve Cardiorespiratory Fitness When Practiced Three Times a Week. Int. J. Environ. Res. Public Health 2020, 17, 2095. [Google Scholar] [CrossRef]
- de Jonge, M.; Slot-Heijs, J.J.; Prins, R.G.; Singh, A.S. The Effect of The Daily Mile on Primary School Children’s Aerobic Fitness Levels After 12 Weeks: A Controlled Trial. Int. J. Environ. Res. Public Health 2020, 17, 2198. [Google Scholar] [CrossRef] [PubMed]
- Breheny, K.; Passmore, S.; Adab, P.; Martin, J.; Hemming, K.; Lancashire, E.R.; Frew, E. Effectiveness and cost-effectiveness of The Daily Mile on childhood weight outcomes and wellbeing: A cluster randomised controlled trial. Int. J. Obes. 2020, 44, 812–822. [Google Scholar] [CrossRef]
- Weaver, R.G.; Hunt, E.T.; Armstrong, B.; Beets, M.W.; Brazendale, K.; Turner-McGrievy, G.; Pate, R.R.; Youngstedt, S.D.; Dugger, R.; Parker, H.; et al. COVID-19 Leads to Accelerated Increases in Children’s BMI z-Score Gain: An Interrupted Time-Series Study. Am. J. Prev. Med. 2021, 61, E161–E169. [Google Scholar] [CrossRef]
- Chang, T.-H.; Chen, Y.-C.; Chen, W.-Y.; Chen, C.-Y.; Hsu, W.-Y.; Chou, Y.; Chang, Y.-H. Weight Gain Associated with COVID-19 Lockdown in Children and Adolescents: A Systematic Review and Meta-Analysis. Nutrients 2021, 13, 3668. [Google Scholar] [CrossRef]
- Browne, N.T.; Snethen, J.A.; Greenberg, C.S.; Frenn, M.; Kilanowski, J.F.; Gance-Cleveland, B.; Burke, P.J.; Lewandowski, L. When Pandemics Collide: The Impact of COVID-19 on Childhood Obesity. J. Pediatr. Nurs. 2021, 56, 90–98. [Google Scholar] [CrossRef]
- Chulvi-Medrano, I.; Villa-González, E.; Rial Rebullido, T.; Faigenbaum, A.D. The impact of COVID-19 quarantine on youth: From physical inactivity to pediatric depreobesity. J. M. Health 2020, 18, 1–4. [Google Scholar] [CrossRef]
- Jarnig, G.; Jaunig, J.; Kerbl, R.; Strenger, V.; Haeusler, G.; van Poppel, M.N.M. Acceleration in BMI gain following COVID-19 restrictions. A longitudinal study with 7- to 10-year-old primary school children. Pediatr. Obes. 2022, e12890. [Google Scholar] [CrossRef]
- Pombo, A.; Luz, C.; de Sá, C.; Rodrigues, L.P.; Cordovil, R. Effects of the COVID-19 Lockdown on Portuguese Children’s Motor Competence. Children 2021, 8, 199. [Google Scholar] [CrossRef] [PubMed]
- Dayton, J.D.; Ford, K.; Carroll, S.J.; Flynn, P.A.; Kourtidou, S.; Holzer, R.J. The Deconditioning Effect of the COVID-19 Pandemic on Unaffected Healthy Children. Pediatr. Cardiol. 2021, 42, 554–559. [Google Scholar] [CrossRef]
- Jarnig, G.; Jaunig, J.; van Poppel, M.N.M. Association of COVID-19 Mitigation Measures with Changes in Cardiorespiratory Fitness and Body Mass Index Among Children Aged 7 to 10 Years in Austria. JAMA Net. Open 2021, 4, e2121675. [Google Scholar] [CrossRef] [PubMed]
- López-Bueno, R.; Calatayud, J.; Andersen, L.L.; Casaña, J.; Ezzatvar, Y.; Casajús, J.A.; López-Sánchez, G.F.; Smith, L. Cardiorespiratory fitness in adolescents before and after the COVID-19 confinement: A prospective cohort study. Eur. J. Pediatrics 2021, 180, 2287–2293. [Google Scholar] [CrossRef]
- Jurak, G.; Morrison, S.A.; Kovač, M.; Leskošek, B.; Sember, V.; Strel, J.; Starc, G. A COVID-19 Crisis in Child Physical Fitness: Creating a Barometric Tool of Public Health Engagement for the Republic of Slovenia. Front. Public Health 2021, 9, 644235. [Google Scholar] [CrossRef] [PubMed]
- Dunton, G.F.; Do, B.; Wang, S.D. Early effects of the COVID-19 pandemic on physical activity and sedentary behavior in children living in the U.S. BMC Public Health 2020, 20, 1351. [Google Scholar] [CrossRef]
- Jarnig, G.; Jaunig, J.; Kerbl, R.; Lima, R.A.; van Poppel, M.N.M. A Novel Monitoring System (AUT FIT) for Anthropometrics and Physical Fitness in Primary School Children in Austria: A Cross-Sectional Pilot Study. Sports 2022, 10, 4. [Google Scholar] [CrossRef]
- Republik Österreich. RIS—Rechtsinformationssytem des Bundes—Österreich—Bundesgesetzblatt und Verordnungen. Bundesgesetzblatt. Available online: https://www.ris.bka.gv.at/Bgbl-Auth/ (accessed on 3 September 2021).
- European Commission. Methodological Manual on Territorial Typologies: 2018 Edition; Publications Office: Luxemburg, 2019. [Google Scholar]
- Leiner, E.; Graf, T.; Hlatky, A.; Sternath, A.; Weghofer, W. Statistisches Handbuch des Landes Kärnten: Daten 2019; Eigenverlag Amt der Kärntner Landesregierung: Klagenfurt, Austria, 2020; ISBN 978-3-9504689-2-2. [Google Scholar]
- Stoiser, G.; Jernej, M.; Konic, D. Statistisches Jahrbuch der Landeshauptstadt Klagenfurt; Magistrat; Amtsdruckerei: Klagenfurt, Austria, 2020. [Google Scholar]
- Mayer, M.; Gleiss, A.; Häusler, G.; Borkenstein, M.; Kapelari, K.; Köstl, G.; Lassi, M.; Schemper, M.; Schmitt, K.; Blümel, P. Weight and body mass index (BMI): Current data for Austrian boys and girls aged 4 to under 19 years. Ann. Hum. Biol. 2015, 42, 45–55. [Google Scholar] [CrossRef]
- Cole, T.J.; Bellizzi, M.C.; Flegal, K.M.; Dietz, W.H. Establishing a standard definition for child overweight and obesity worldwide: International survey. BMJ 2000, 320, 1240–1243. [Google Scholar] [CrossRef]
- Rodrigues, L.P.; Luz, C.; Cordovil, R.; Bezerra, P.; Silva, B.; Camões, M.; Lima, R. Normative values of the motor competence assessment (MCA) from 3 to 23 years of age. J. Sci. Med. Sport 2019, 22, 1038–1043. [Google Scholar] [CrossRef]
- Cole, T.J.; Green, P.J. Smoothing reference centile curves: The LMS method and penalized likelihood. Stat. Med. 1992, 11, 1305–1319. [Google Scholar] [CrossRef]
- Bös, K.; Opper, E.; Woll, A.; Liebisch, R.; Breithecker, D.; Kremer, B. Das Karlsruher Testsystem für Kinder (KATS-K)—Testmanual. Haltung Und Beweg. 2001, 21, 4. [Google Scholar]
- Cohen, J. Statistical Power Analysis for the Behavioral Sciences, 2nd ed.; Routledge: New York, NY, USA, 1988; ISBN 0805802835. [Google Scholar]
- Stavridou, A.; Kapsali, E.; Panagouli, E.; Thirios, A.; Polychronis, K.; Bacopoulou, F.; Psaltopoulou, T.; Tsolia, M.; Sergentanis, T.N.; Tsitsika, A. Obesity in Children and Adolescents during COVID-19 Pandemic. Children 2021, 8, 135. [Google Scholar] [CrossRef] [PubMed]
- Woolford, S.J.; Sidell, M.; Li, X.; Else, V.; Young, D.R.; Resnicow, K.; Koebnick, C. Changes in Body Mass Index Among Children and Adolescents During the COVID-19 Pandemic. JAMA 2021, 324, 1434–1436. [Google Scholar] [CrossRef]
- Lange, S.J.; Kompaniyets, L.; Freedman, D.S.; Kraus, E.M.; Porter, R.; Blanck, H.M.; Goodman, A.B. Longitudinal Trends in Body Mass Index Before and During the COVID-19 Pandemic Among Persons Aged 2–19 Years—United States, 2018–2020. MMWR Morb. Mortal. Wkly. Rep. 2021, 70, 1278–1283. [Google Scholar] [CrossRef] [PubMed]
- Visscher, T.L.S.; Seidell, J.C. Time trends (1993–1997) and seasonal variation in body mass index and waist circumference in the Netherlands. Int. J. Obes. Relat. Metab. Disord. 2004, 28, 1309–1316. [Google Scholar] [CrossRef]
- Bernritter, J.A.; Johnson, J.L.; Woodard, S.L. Validation of a novel method for measuring waist circumference. Plast. Surg. Nurs. 2011, 31, 9–15. [Google Scholar] [CrossRef] [PubMed]
- Ashwell, M.; Gunn, P.; Gibson, S. Waist-to-height ratio is a better screening tool than waist circumference and BMI for adult cardiometabolic risk factors: Systematic review and meta-analysis. Obes. Rev. 2012, 13, 275–286. [Google Scholar] [CrossRef]
- Ashwell, M.; Gibson, S. Waist-to-height ratio as an indicator of ‘early health risk’: Simpler and more predictive than using a ‘matrix’ based on BMI and waist circumference. BMJ Open 2016, 6, e010159. [Google Scholar] [CrossRef]
- Fröhlich, M.; Gießing, J.; Strack, A. Krafttraining bei Kindern und Jugendlichen: Hintergründe, Trainingspläne, Übungen, 3; updated and expanded edition; Tectum Verlag: Baden-Baden, Germany, 2019; ISBN 9783828843271. [Google Scholar]


| Variable | September 2019 | June 2020 | September-2020 | March 2021 | June 2021 |
|---|---|---|---|---|---|
| Age (years), mean (SD) | 8.3 (0.7) | 9.0 (0.7) | 9.2 (0.7) | 9.7 (0.7) | 9.9 (0.7) |
| SY 19–20—grade 2, age (years), mean (SD) | 7.7 (0.4) | 8.7 (0.4) | 9.3 (0.4) | ||
| SY 19–20—grade 3, age (years), mean (SD) | 8.8 (0.5) | 9.7 (0.5) | 10.4 (0.5) | ||
| Female sex, No. (%) | 350 (49.4%) | ||||
| Urban school, No. (%) | 424 (59.9%) | ||||
| SY 19–20—grade 2, No. (%) | 345 (48.7%) | ||||
| Variable | Subgroups/ Categories | September 2019 | June 2020 | September-2020 | March 2021 | June 2021 |
|---|---|---|---|---|---|---|
| EQUI BMIAUT, mean (SD) | All (n = 708) | 22.30 (3.51) | 22.60 (3.76) | 22.73 (3.85) | 22.93 (3.97) | 22.98 (3.95) |
| Girls (n = 350) | 22.12 (3.39) | 22.28 (3.48) | 22.39 (3.61) | 22.43(3.65) | 22.53 (3.56) | |
| Boys (n = 358) | 22.47 (3.63) | 22.91 (4.00) | 23.06 (4.05) | 23.42 (4.12) | 23.41 (4.26) | |
| Urban schools (n = 424) | 22.39 (3.70) | 22.75 (4.11) | 22.92 (4.16) | 23.22 (4.34) | 23.24 (4.30) | |
| Rural school (n = 284) | 22.17 (3.22) | 22.37 (3.16) | 22.45 (3.32) | 22.49 (3.33) | 22.57 (3.32) | |
| AUT weight classification, No. (%)—All (n = 708) | Underweight | 41 (5.8) | 34 (4.8) | 28 (4.0) | 28 (4.0) | 26 (3.7) |
| Normal weight | 560 (79.1) | 549 (77.5) | 543 (76.7) | 537 (75.8) | 532 (75.1) | |
| Overweight | 76 (10.7) | 90 (12.7) | 96 (13.6) | 98 (13.8) | 107 (15.1) | |
| Obesity | 25 (3.5) | 27 (3.8) | 31 (4.4) | 32 (4.5) | 29 (4.1) | |
| Morbid obesity | 6 (0.8) | 8 (1.1) | 10 (1.4) | 13 (1.8) | 14 (2.0) | |
| WHtR, Mean (SD) | All (n = 708) | 0.461 (0.052) | 0.480 (0.058) | 0.450 (0.057) | 0.472 (0.060) | 0.434 (0.057) |
| Girls (n = 350) | 0.464 (0.053) | 0.480 (0.058) | 0.449 (0.056) | 0.469 (0.060) | 0.429 (0.055) | |
| Boys (n = 358) | 0.458 (0.050) | 0.479 (0.058) | 0.452 (0.058) | 0.475 (0.061) | 0.439 (0.059) | |
| Urban schools (n = 424) | 0.455 (0.054) | 0.482 (0.062) | 0.453 (0.062) | 0.476 (0.063) | 0.438 (0.061) | |
| Rural school (n = 284) | 0.469 (0.047) | 0.475 (0.051) | 0.446 (0.049) | 0.467 (0.055) | 0.429 (0.050) | |
| WHtR, heath estimation, No. (%)—All (n = 708) | no health risk | 584 (82.5) | 515 (72.7) | 593 (83.8) | 526 (74.3) | 623 (88.0) |
| increased health risk | 105 (14.8) | 164 (23.2) | 95 (13.4) | 151 (21.3) | 70 (9.9) | |
| high health risk | 19 (2.7) | 29 (4.1) | 20 (2.8) | 31 (4.4) | 15 (2.1) |
| Variable | Effects | Time and Subgroups | df | F | p-Value | ηp2 | Power a |
|---|---|---|---|---|---|---|---|
| EQUI BMIAUT | Between-subjects effects | Sex | 1 | 5.824 | 0.016 | 0.008 | 0.674 |
| School Location | 1 | 2.470 | 0.116 | 0.004 | 0.348 | ||
| School Grade | 1 | 0.095 | 0.758 | 0.000 | 0.061 | ||
| Sex × School Location | 1 | 0.061 | 0.805 | 0.000 | 0.057 | ||
| Sex × School Grade | 1 | 1.054 | 0.305 | 0.002 | 0.176 | ||
| School Location × School Grade | 1 | 1.290 | 0.256 | 0.002 | 0.205 | ||
| Sex × School Location × School Grade | 1 | 2.459 | 0.117 | 0.004 | 0.347 | ||
| Error | 700 | ||||||
| Within-subjects effects | Time (T1–T2–T3–T4–T5) | 2.868 | 67.098 | 0.000 | 0.087 | 1.000 | |
| Time × Sex | 2.868 | 15.483 | 0.000 | 0.022 | 1.000 | ||
| Time × School Location | 2.868 | 8.941 | 0.000 | 0.013 | 0.995 | ||
| Time × School Grade | 2.868 | 0.667 | 0.566 | 0.001 | 0.188 | ||
| Time × Sex × School Location | 2.868 | 0.651 | 0.575 | 0.001 | 0.185 | ||
| Time × Sex × School Grade | 2.868 | 2.743 | 0.044 | 0.004 | 0.653 | ||
| Time × School Location × School Grade | 2.868 | 1.484 | 0.219 | 0.002 | 0.386 | ||
| Time × Sex × School Location × School Grade | 2.868 | 0.398 | 0.746 | 0.001 | 0.128 | ||
| Error (Time) | 2007.936 | ||||||
| WHtR | Between-subjects effects | Sex | 1 | 0.424 | 0.515 | 0.001 | 0.100 |
| School Location | 1 | 0.741 | 0.390 | 0.001 | 0.138 | ||
| School Grade | 1 | 0.050 | 0.823 | 0.000 | 0.056 | ||
| Sex × School Location | 1 | 0.055 | 0.814 | 0.000 | 0.056 | ||
| Sex × School Grade | 1 | 1.505 | 0.220 | 0.002 | 0.232 | ||
| School Location × School Grade | 1 | 2.256 | 0.134 | 0.003 | 0.323 | ||
| Sex × School Location × School Grade | 1 | 0.968 | 0.326 | 0.001 | 0.166 | ||
| Error | 700 | ||||||
| Within-subjects effects | Time (T1-T2-T3-T4-T5) | 3.848 | 384.997 | 0.000 | 0.355 | 1.000 | |
| Time × Sex | 3.848 | 9.706 | 0.000 | 0.014 | 1.000 | ||
| Time × School Location | 3.848 | 26.781 | 0.000 | 0.037 | 1.000 | ||
| Time × School Grade | 3.848 | 2.024 | 0.091 | 0.003 | 0.597 | ||
| Time × Sex × School Location | 3.848 | 1.145 | 0.333 | 0.002 | 0.356 | ||
| Time × Sex × School Grade | 3.848 | 0.912 | 0.453 | 0.001 | 0.287 | ||
| Time × School Location × School Grade | 3.848 | 2.584 | 0.037 | 0.004 | 0.719 | ||
| Time × Sex × School Location × School Grade | 3.848 | 0.383 | 0.814 | 0.001 | 0.137 | ||
| Error (Time) | 2693.887 | ||||||
| 6MR SDS (DüMo) | Between-subjects effects | Sex | 1 | 6.731 | 0.010 | 0.010 | 0.736 |
| School Location | 1 | 0.064 | 0.800 | 0.000 | 0.057 | ||
| School Grade | 1 | 0.060 | 0.806 | 0.000 | 0.057 | ||
| Sex × School Location | 1 | 1.408 | 0.236 | 0.002 | 0.220 | ||
| Sex × School Grade | 1 | 2.469 | 0.117 | 0.004 | 0.348 | ||
| School Location × School Grade | 1 | 3.430 | 0.064 | 0.005 | 0.456 | ||
| Sex × School Location × School Grade | 1 | 0.023 | 0.880 | 0.000 | 0.053 | ||
| Error | 698 | ||||||
| Within-subjects effects | Time (T1-T3-T5) | 1.974 | 548.891 | 0.000 | 0.440 | 1.000 | |
| Time × Sex | 1.974 | 3.415 | 0.034 | 0.005 | 0.639 | ||
| Time × School Location | 1.974 | 2.059 | 0.129 | 0.003 | 0.422 | ||
| Time × School Grade | 1.974 | 6.580 | 0.002 | 0.009 | 0.908 | ||
| Time × Sex × School Location | 1.974 | 0.843 | 0.429 | 0.001 | 0.194 | ||
| Time × Sex × School Grade | 1.974 | 1.661 | 0.191 | 0.002 | 0.349 | ||
| Time × School Location × School Grade | 1.974 | 1.968 | 0.141 | 0.003 | 0.406 | ||
| Time × Sex × School Location × School Grade | 1.974 | 0.009 | 0.990 | 0.000 | 0.051 | ||
| Error (Time) | 1377.609 | ||||||
| SLJ SDS (DüMo) | Between-subjects effects | Sex | 1 | 1.083 | 0.298 | 0.002 | 0.180 |
| School Location | 1 | 1.581 | 0.209 | 0.002 | 0.241 | ||
| School Grade | 1 | 0.229 | 0.633 | 0.000 | 0.077 | ||
| Sex × School Location | 1 | 1.833 | 0.176 | 0.003 | 0.272 | ||
| Sex × School Grade | 1 | 0.299 | 0.585 | 0.000 | 0.085 | ||
| School Location × School Grade | 1 | 2.545 | 0.111 | 0.004 | 0.357 | ||
| Sex × School Location × School Grade | 1 | 0.262 | 0.609 | 0.000 | 0.080 | ||
| Error | 698 | ||||||
| Within-subjects effects | Time (T1-T3-T5) | 1.977 | 22.323 | 0.000 | 0.031 | 1.000 | |
| Time × Sex | 1.977 | 1.604 | 0.202 | 0.002 | 0.339 | ||
| Time × School Location | 1.977 | 12.384 | 0.000 | 0.017 | 0.996 | ||
| Time × School Grade | 1.977 | 34.908 | 0.000 | 0.048 | 1.000 | ||
| Time × Sex × School Location | 1.977 | 2.359 | 0.096 | 0.003 | 0.476 | ||
| Time × Sex × School Grade | 1.977 | 0.948 | 0.387 | 0.001 | 0.214 | ||
| Time × School Location × School Grade | 1.977 | 0.036 | 0.964 | 0.000 | 0.055 | ||
| Time × Sex × School Location × School Grade | 1.977 | 0.753 | 0.470 | 0.001 | 0.178 | ||
| Error (Time) | 1379.618 | ||||||
| MB1 kg z-value (KATS-K) | Between-subjects effects | Sex | 1 | 12.770 | 0.000 | 0.019 | 0.946 |
| School Location | 1 | 0.590 | 0.443 | 0.001 | 0.120 | ||
| School Grade | 1 | 0.208 | 0.648 | 0.000 | 0.074 | ||
| Sex × School Location | 1 | 2.105 | 0.147 | 0.003 | 0.305 | ||
| Sex × School Grade | 1 | 0.799 | 0.372 | 0.001 | 0.145 | ||
| School Location × School Grade | 1 | 0.441 | 0.507 | 0.001 | 0.102 | ||
| Sex × School Location × School Grade | 1 | 0.618 | 0.432 | 0.001 | 0.123 | ||
| Error | 654 | ||||||
| Within-subjects effects | Time (T1–T3–T5) | 1.948 | 6.966 | 0.001 | 0.011 | 0.921 | |
| Time × Sex | 1.948 | 8.643 | 0.000 | 0.013 | 0.966 | ||
| Time × School Location | 1.948 | 3.429 | 0.034 | 0.005 | 0.637 | ||
| Time × School Grade | 1.948 | 5.551 | 0.004 | 0.008 | 0.848 | ||
| Time × Sex × School Location | 1.948 | 0.185 | 0.826 | 0.000 | 0.078 | ||
| Time × Sex × School Grade | 1.948 | 0.823 | 0.436 | 0.001 | 0.190 | ||
| Time × School Location × School Grade | 1.948 | 2.783 | 0.064 | 0.004 | 0.542 | ||
| Time × Sex × School Location × School Grade | 1.948 | 6.530 | 0.002 | 0.010 | 0.903 | ||
| Error (Time) | 1273.678 | ||||||
| 4 × 10 SHR SDS (MCA), mean (SD) | Between-subjects effects | Sex | 1 | 1.691 | 0.194 | 0.002 | 0.255 |
| School Location | 1 | 2.026 | 0.155 | 0.003 | 0.295 | ||
| School Grade | 1 | 1.325 | 0.250 | 0.002 | 0.210 | ||
| Sex × School Location | 1 | 1.404 | 0.236 | 0.002 | 0.220 | ||
| Sex × School Grade | 1 | 0.969 | 0.325 | 0.001 | 0.166 | ||
| School Location × School Grade | 1 | 1.001 | 0.317 | 0.001 | 0.170 | ||
| Sex × School Location × School Grade | 1 | 1.108 | 0.293 | 0.002 | 0.183 | ||
| Error | 698 | ||||||
| Within-subjects effects | Time (T1–T3–T5) | 2 | 198.380 | 0.000 | 0.221 | 1.000 | |
| Time × Sex | 2 | 3.929 | 0.020 | 0.006 | 0.708 | ||
| Time × School Location | 2 | 20.824 | 0.000 | 0.029 | 1.000 | ||
| Time × School Grade | 2 | 3.488 | 0.031 | 0.005 | 0.653 | ||
| Time × Sex × School Location | 2 | 3.650 | 0.026 | 0.005 | 0.674 | ||
| Time × Sex × School Grade | 2 | 1.013 | 0.364 | 0.001 | 0.228 | ||
| Time × School Location × School Grade | 2 | 2.893 | 0.056 | 0.004 | 0.567 | ||
| Time × Sex × School Location × School Grade | 2 | 1.242 | 0.289 | 0.002 | 0.272 | ||
| Error (Time) | 1396 |
| Fitness Test | Subgroup/Categories | September 2019 | September 2020 | June 2021 |
|---|---|---|---|---|
| 6MR SDS (DüMo), mean (SD) | All (n = 706) | 0.49 (1.12) | −0.59 (0.93) | −0.41 (1.08) |
| Girls (n = 349) | 0.42 (1.05) | −0.65 (0.88) | −0.57 (1.01) | |
| Boys (n = 357) | 0.57 (1.18) | −0.52 (0.98) | −0.25 (1.13) | |
| Urban schools (n = 423) | 0.48 (1.13) | −0.58 (1.02) | −0.37 (1.14) | |
| Rural school (n = 283) | 0.52 (1.11) | −0.60 (0.80) | −0.48 (0.99) | |
| SY 19–20—grade 2 (n = 345) | 0.44 (1.10) | −0.53 (0.92) | −0.33 (1.11) | |
| SY 19–20—grade 3 (n = 361) | 0.55 (1.14) | −0.63 (0.92) | −0.50 (1.06) | |
| SLJ SDS (DüMo), mean (SD) | All (n = 706) | 0.18 (1.06) | 0.35 (1.05) | 0.23 (1.07) |
| Girls (n = 349) | 0.10 (1.02) | 0.33 (1.02) | 0.18 (1.03) | |
| Boys (n = 357) | 0.25 (1.09) | 0.37 (1.08) | 0.28 (1.10) | |
| Urban schools (n = 423) | 0.21 (1.05) | 0.25 (1.08) | 0.20 (1.08) | |
| Rural school (n = 283) | 0.13 (1.07) | 0.50 (0.98) | 0.29 (1.08) | |
| SY 19–20—grade 2 (n = 345) | 0.06 (1.00) | 0.44 (1.06) | 0.37 (1.07) | |
| SY 19–20—grade 3 (n = 361) | 0.29 (1.10) | 0.27 (1.04) | 0.10 (1.05) | |
| MB1 kg z-value (KATS-K), mean (SD) | All (n = 662) | 0.11 (0.95) | 0.02 (0.93) | 0.14 (0.97) |
| Girls (n = 330) | 0.14 (0.93) | 0.19 (0.91) | 0.25 (0.93) | |
| Boys (n = 332) | 0.07 (0.97) | −0.14 (0.93) | 0.03 (0.99) | |
| Urban schools (n = 394) | 0.05 (0.98) | −0.01 (0.94) | 0.14 (1.00) | |
| Rural school (n = 268) | 0.19 (0.89) | 0.07 (0.92) | 0.13 (0.93) | |
| SY 19–20—grade 2 (n = 344) | 0.11 (0.97) | 0.11 (0.93) | 0.10 (0.97) | |
| SY 19–20—grade 3 (n = 318) | 0.10 (0.93) | −0.07 (0.93) | 0.18 (0.96) | |
| 4 × 10 SHR SDS (MAC), mean (SD) | All (n = 706) | −0.38 (0.92) | −0.72 (1.00) | −0.05 (1.01) |
| Girls (n = 349) | −0.47 (0.93) | −0.78 (0.96) | −0.05 (0.95) | |
| Boys (n = 357) | −0.29 (0.90) | −0.66 (1.04) | −0.06 (1.06) | |
| Urban schools (n = 423) | −0.31 (0.90) | −0.81 (1.02) | −0.13 (1.06) | |
| Rural school (n = 283) | −0.48 (0.94) | −0.58 (0.95) | 0.06 (0.91) | |
| SY 19–20—grade 2 (n = 345) | −0.38 (0.88) | −0.62 (0.98) | −0.00 (0.96) | |
| SY 19–20—grade 3 (n = 361) | −0.37 (0.96) | −0.81 (1.01) | −0.11 (1.04) |
Publisher’s Note: MDPI stays neutral with regard to jurisdictional claims in published maps and institutional affiliations. |
© 2022 by the authors. Licensee MDPI, Basel, Switzerland. This article is an open access article distributed under the terms and conditions of the Creative Commons Attribution (CC BY) license (https://creativecommons.org/licenses/by/4.0/).
Share and Cite
Jarnig, G.; Kerbl, R.; van Poppel, M.N.M. The Impact of COVID-19-Related Mitigation Measures on the Health and Fitness Status of Primary School Children in Austria: A Longitudinal Study with Data from 708 Children Measured before and during the Ongoing COVID-19 Pandemic. Sports 2022, 10, 43. https://doi.org/10.3390/sports10030043
Jarnig G, Kerbl R, van Poppel MNM. The Impact of COVID-19-Related Mitigation Measures on the Health and Fitness Status of Primary School Children in Austria: A Longitudinal Study with Data from 708 Children Measured before and during the Ongoing COVID-19 Pandemic. Sports. 2022; 10(3):43. https://doi.org/10.3390/sports10030043
Chicago/Turabian StyleJarnig, Gerald, Reinhold Kerbl, and Mireille N. M. van Poppel. 2022. "The Impact of COVID-19-Related Mitigation Measures on the Health and Fitness Status of Primary School Children in Austria: A Longitudinal Study with Data from 708 Children Measured before and during the Ongoing COVID-19 Pandemic" Sports 10, no. 3: 43. https://doi.org/10.3390/sports10030043
APA StyleJarnig, G., Kerbl, R., & van Poppel, M. N. M. (2022). The Impact of COVID-19-Related Mitigation Measures on the Health and Fitness Status of Primary School Children in Austria: A Longitudinal Study with Data from 708 Children Measured before and during the Ongoing COVID-19 Pandemic. Sports, 10(3), 43. https://doi.org/10.3390/sports10030043