Article

Epigenome-Wide Changes in the Cell Layers of the Vein Wall When Exposing the Venous Endothelium to Oscillatory Shear Stress

by
Mariya A. Smetanina
1,2,*,
Valeria A. Korolenya
1,3,
Alexander E. Kel
1,4,
Ksenia S. Sevostyanova
5,6,7,
Konstantin A. Gavrilov
5,7,
Andrey I. Shevela
5,6,7 and
Maxim L. Filipenko
1
1
Laboratory of Pharmacogenomics, Institute of Chemical Biology and Fundamental Medicine (ICBFM) SB RAS, Novosibirsk 630090, Russia
2
Department of Fundamental Medicine, V. Zelman Institute for Medicine and Psychology, Novosibirsk State University (NSU), Novosibirsk 630090, Russia
3
Department of Natural Sciences, Novosibirsk State University (NSU), Novosibirsk 630090, Russia
4
Department of Research & Development, GeneXplain GmbH, D-38302 Wolfenbüttel, Germany
5
Center of New Medical Technologies, Institute of Chemical Biology and Fundamental Medicine (ICBFM) SB RAS, Novosibirsk 630090, Russia
6
Laboratory of Invasive Medical Technologies, Institute of Chemical Biology and Fundamental Medicine (ICBFM) SB RAS, Novosibirsk 630090, Russia
7
Department of Surgical Diseases, V. Zelman Institute for Medicine and Psychology, Novosibirsk State University (NSU), Novosibirsk 630090, Russia
*
Author to whom correspondence should be addressed.
Epigenomes 2023, 7(1), 8; https://doi.org/10.3390/epigenomes7010008
Submission received: 31 December 2022 / Revised: 10 March 2023 / Accepted: 13 March 2023 / Published: 20 March 2023

Abstract

:
Epigenomic changes in the venous cells exerted by oscillatory shear stress towards the endothelium may result in consolidation of gene expression alterations upon vein wall remodeling during varicose transformation. We aimed to reveal such epigenome-wide methylation changes. Primary culture cells were obtained from non-varicose vein segments left after surgery of 3 patients by growing the cells in selective media after magnetic immunosorting. Endothelial cells were either exposed to oscillatory shear stress or left at the static condition. Then, other cell types were treated with preconditioned media from the adjacent layer’s cells. DNA isolated from the harvested cells was subjected to epigenome-wide study using Illumina microarrays followed by data analysis with GenomeStudio (Illumina), Excel (Microsoft), and Genome Enhancer (geneXplain) software packages. Differential (hypo-/hyper-) methylation was revealed for each cell layer’s DNA. The most targetable master regulators controlling the activity of certain transcription factors regulating the genes near the differentially methylated sites appeared to be the following: (1) HGS, PDGFB, and AR for endothelial cells; (2) HGS, CDH2, SPRY2, SMAD2, ZFYVE9, and P2RY1 for smooth muscle cells; and (3) WWOX, F8, IGF2R, NFKB1, RELA, SOCS1, and FXN for fibroblasts. Some of the identified master regulators may serve as promising druggable targets for treating varicose veins in the future.

1. Introduction

Varicose vein (VV) disease pathogenesis is of a multifactorial chronic nature; genetic, as well as epigenetic, factors make a considerable contribution to it and may serve as predisposing and affecting factors. Altered (non-uniform) shear stress, a tangential hemodynamic force, accompanies the pathological condition of the vessels and is one of the characteristics of many vascular disorders [1]. The mechanical effect of changes in hemodynamics may result in a cascade of molecular reactions leading to a shift in physiological processes and prompting the development of the disease. Not all factors underlying the initiation and the progression of VV disease have been discovered so far.
The three main layers constituting the vein wall are the following. The inner layer, the tunica intima, consists of a monolayer of endothelial cells with underlying collagen and elastin. The middle layer, the tunica media, predominantly consists of several layers of circularly located smooth muscle cells separated by collagen and elastin fibers. The outer layer, the tunica adventitia or externa, consists of collagen and, mainly, fibroblasts [2]. These layers are tightly connected to each other such that all changes happening to one layer are reflected in another layer. Moreover, these changes promptly spread through the whole vein wall, affecting its condition. Indeed, one of the shear-stress responsive genes, LKLF (KLF2), is endothelium-specific, and its expression affects tunica media formation and vessel wall integrity/stabilization [3].
Endothelial cells line the inner surface of the vein wall and, since they come in contact with both circulating blood components and surrounding tissues, they serve as primary sensors of the systemic, as well as the local, stimuli that may modulate the essential endothelial functions. For instance, due to blood flow, such modulation by local stimuli—hemodynamic forces—can lead to short-term vasoactive responses and long-term remodeling of the vessel wall [4]. Endothelial cells possess a set of mechanosensors, such as receptor tyrosine kinases, ion channels, integrins, and G-protein-coupled receptors that convert changes in the hemodynamics into the biochemical signals modulating endothelial cells’ gene expression, morphology, behavior, and phenotype through specialized mechanosensitive signaling pathways [1,5]. The endothelium plays a key role in vascular hemostasis, coagulation, inflammation, regulation of angiogenesis and vascular tone, and vascular permeability. Therefore, by sensing biochemical and biomechanical signals, as well as modifying its functional phenotype, the inner layer of the venous wall contributes to the maintenance of vascular homeostasis and the development of vascular pathology [4]. It is widely accepted that local hemodynamics play a crucial role in risk prediction [6].
Endothelial cells possess phenotypic and functional heterogeneity depending on the type of blood vessels, and, therefore, demonstrate vascular-bed-specific properties that define their response to fluid shear stress exposure (laminar, oscillatory, or pulsatile) [1]. There are different in vitro 2D and 3D (two-dimensional and three-dimensional) models mimicking the hemodynamics of the vascular system, but these cannot take into account all aspects of the complex in vivo environment, since various factors, including vessel geometry, blood viscosity and velocity, and blood pressures, affect hemodynamics in the vasculature. Nevertheless, these models are quite useful because they may help to investigate cellular responses and interactions under different patterns of fluid shear stress [6]. Of particular interest for us is the endothelial cells’ response to oscillatory shear stress (which is most effective for mimicking varicose vein conditions) and the transmission of the molecular signals to the adjacent layers of the vein wall. Thereby, the affected layers may respond to such molecular signals with changes within themselves and, subsequently, outside of themselves—into their environment. This is the case of the middle layer, which is responsible for constriction of the vessel wall and venous tone maintenance.
Studies have demonstrated that upon exposure to an altered hemodynamic environment, the vascular endothelium becomes activated (including ROS (reactive oxygen species) generation/production) and acquires a proinflammatory phenotype. This is caused by mechanoactivation of the NF-KB signaling pathway and characterized by the expression of endothelial inflammatory markers, augmented endothelial cell turnover, and increased endothelial cell apoptosis/loss [1,4,6].
Hemodynamic forces such as shear stress control the transcriptional activity of a large and diverse set of genes (noteworthily, not necessarily endothelium-specific genes) expressed by the vascular endothelium that plays a key role in transducing biomechanical forces into biochemical signaling [6,7]. We hypothesized that the oscillatory flow present in incompetent veins and primarily affecting endothelial cells leads to epigenomic changes in these cells and cells of other types constituting adjacent layers of the venous wall. The influence of epigenetic factors contributes to the multifactorial nature of varicose vein disease [8]. Such factors change the structure of DNA without changing the DNA sequence itself. Thus, DNA methylation can affect the transcription and, consequently, gene expression. Epigenomic modifications, i.e., epigenetic changes across the whole genome, are unique in terms of the type and amount of chemical modification at each location on a chromosome, and can vary from cell to cell; moreover, they are very dependent on environmental factors, so they can be modulated externally with small molecules [9]. This gives us hope that there could be awesome possibilities for the treatment of vascular diseases in the future.
“OMIC” approaches allow the profiling of multiple genes/their modifications and products simultaneously [10]. Recording “OMIC” data to measure gene activities, protein expression, and metabolic events is becoming a standard approach to characterize the pathological state of an affected tissue. Increasingly, several of these methods are applied in a combined approach, leading to large multi-“OMIC” data sets. Still, the challenge remains how to reveal the underlying molecular mechanisms that render a given pathological state different from the norm. The disease-causing mechanism can be described by a re-wiring of the cellular regulatory network, for instance as a result of epigenetic alterations influencing the activity of relevant genes. Reconstruction of the disease-specific regulatory networks can help to identify potential master regulators of the respective pathological processes [11,12,13,14]. Knowledge about these master regulators can point to ways to block a pathological regulatory cascade. Suppression of certain molecular targets as components of these cascades may stop the pathological process and cure the disease.
In case of the epigenome, and methylome in particular, epigenome-wide association studies (EWAS) significantly accelerated the field of epigenetics research. The aim of this study was to reveal epigenome-wide methylation changes in the cells-representatives of the venous wall layers, exerted by oscillatory shear stress towards the endothelium, which may result in the consolidation of gene expression alterations upon vein wall remodeling during varicose transformation. It is essential to investigate how hemodynamics is involved in VV disease initiation/progression, since it may render to the identification of potential drug targets in the molecular network that governs the studied pathological process. Yet, future mechanistic studies on the pathogenesis of the disease should provide new insights into potential targets for VVs treatment.

2. Results

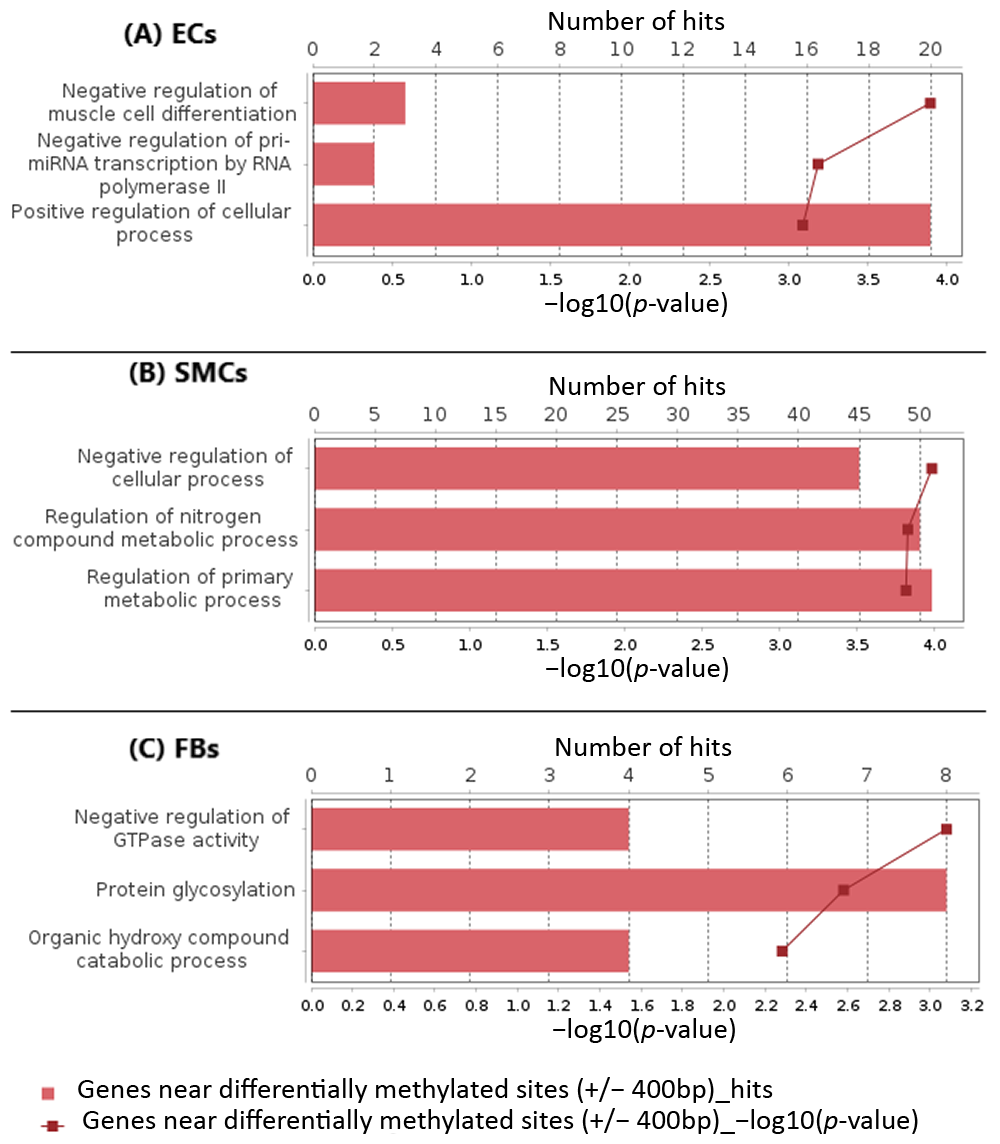
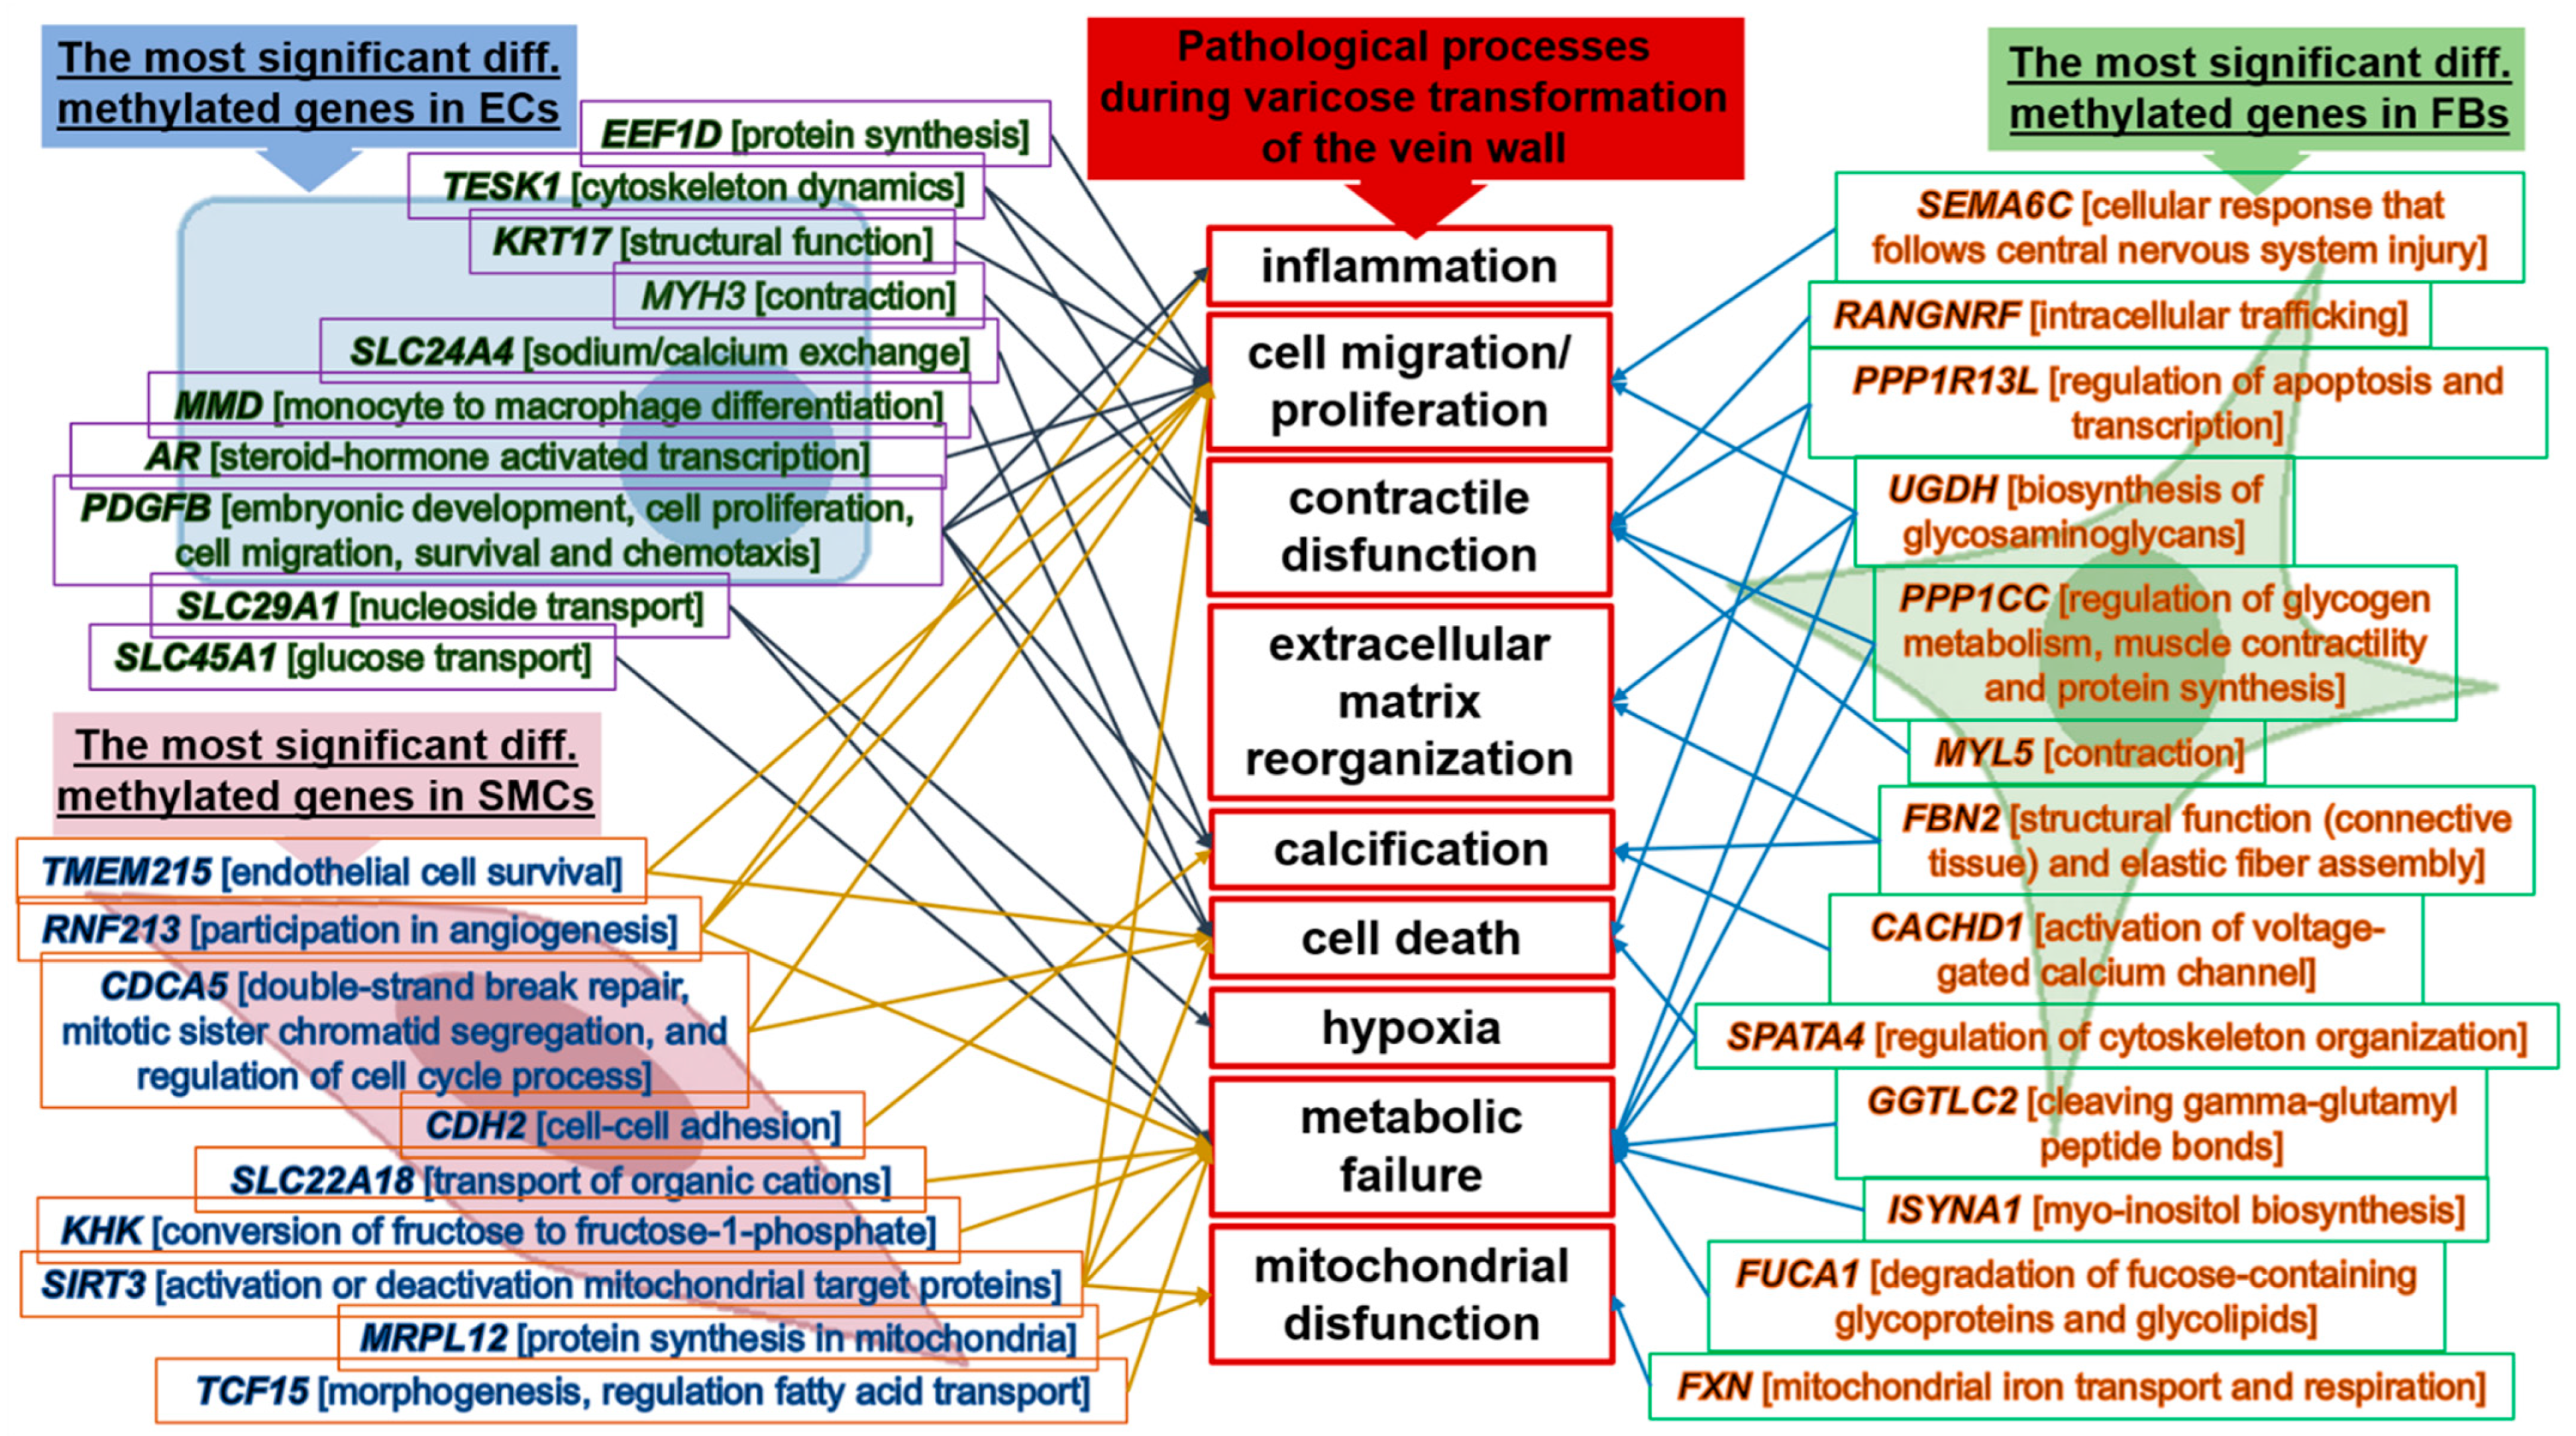
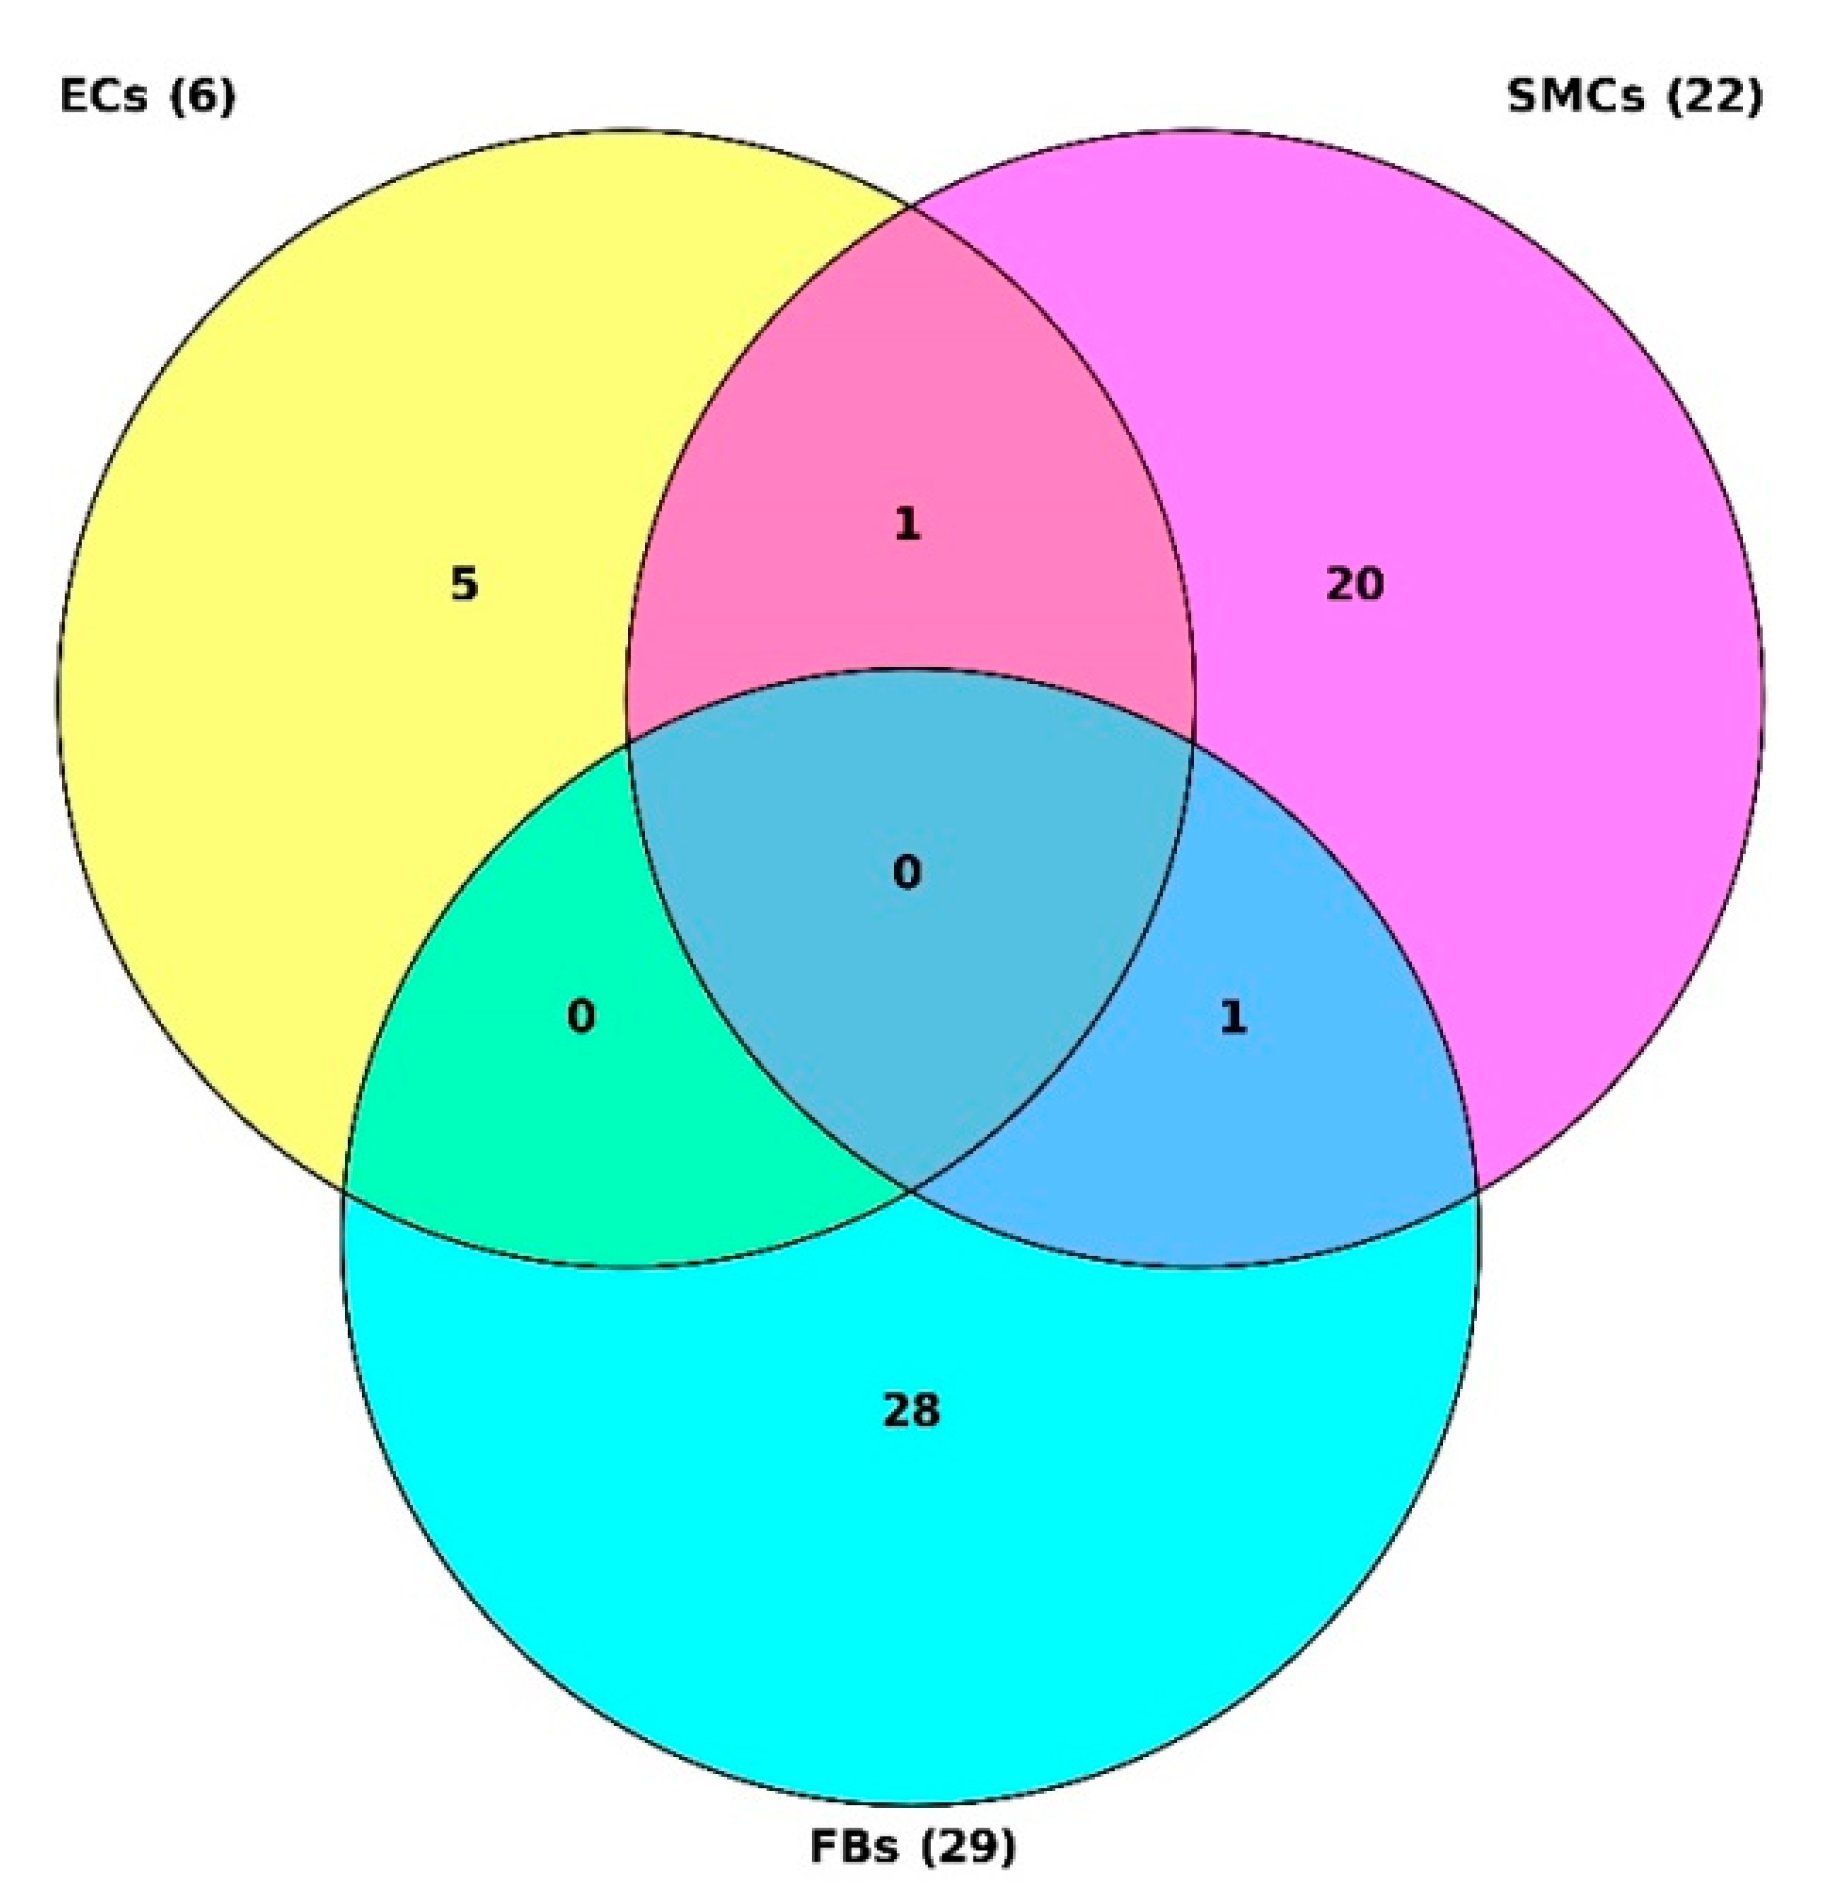
2.1. Identification of Target Genes

In the first step of the analysis, target genes were identified from the uploaded experimental data. There were 300 genes (among all mapped to differentially methylated sites), with the highest number of transcription factor binding sites found in the regions ±400 bp from these methylated sites. Initially, raw methylation data were analyzed using Illumina GenomeStudio (Methylation Module) software, which mapped the differentially methylated sites to: (a) 36 differentially methylated genes (17 hypo- and 19 hypermethylated) for endothelial cells (ECs), (b) 92 differentially methylated genes (19 hypo- and 73 hypermethylated) for smooth muscle cells (SMCs), and (c) 353 differentially methylated genes (222 hypo- and 131 hypermethylated) for fibroblasts (FBs), as listed in Supplementary Tables S1–S3. This prompts us to speculate that the ratios of hypo- to hypermethylated genes may reflect possible changes after oscillatory shear stress exposure in overall transcription processes within the corresponding cell type of the vein layer: 0.89 < 1 (which means quenching) for ECs, 0.26 << 1 (which means considerable quenching) for SMCs, and 1.69 > 1 (which means activating) for FBs.
Then, we applied the software package “Genome Enhancer” (geneXplain platform) to a data set processed in GenomeStudio. The ultimate goal of this pipeline was to identify potential drug targets in the molecular network that governs the studied pathological process. According to the Genome Enhancer, there were twenty main genes (presented in Table 1) that changed their methylation statuses in ECs after being exposed to oscillatory shear stress.
After SMCs cells representing an adjacent (to the endothelium) vein wall layer—tunica media—were treated with cell culture media taken from +/− exposed ECs, they also changed their DNA methylation statuses (as shown in Table 2 for top ten hypo- and top ten hypermethylated genes).
After FBs representing an adjacent (to the tunica media) vein wall layer—tunica adventitia—were treated with cell culture media taken from +/− treated SMCs, they also changed their DNA methylation statuses (as shown in Table 3 for top ten hypo- and top ten hypermethylated genes).
Epigenome-wide DNA methylation profiling revealed the changes in the cell type of each venous wall layer, not only in the venous endothelium exposed to oscillatory shear stress, but also in the cells-representatives of the adjacent layers. For a graphical illustration of the data shown in Table 1, Table 2 and Table 3, we created a cluster heatmap where the average beta values reflecting the methylation levels of the genes (assigned to CpG loci in the group of samples) are represented by colors, and the rows and columns of the data matrix have been ordered according to the output from clustering (Figure 1).
In Figure 1, a heatmap of differentially methylated genes is shown for each cell type separately. One can observe that there are clusters of genes that synchronously increase or synchronously decrease in methylation. Additionally, we combined all three sets of genes, each of them being differentially methylated in a certain cell type, with the corresponding beta values in all those cells (treated and untreated), and applied a cluster heatmap analysis in order to compare samples from different cells with each other (Supplementary Figure S1). Interestingly, the result was that they did not differ much (the difference between “treatment” and “control” in one cell type was often higher than the difference between control samples in other cell types). Additionally, in general, these genes had fairly stable methylation statuses in different cell types—they are represented with similar colors along the entire length of the heatmap.
However, we focused not just on the hypo-/hypermethylated sites, but rather on their regulators and potential master regulators. Differentially methylated sites were mapped to genes, and the top 300 genes with the highest number of transcription factor binding sites (found in the 400 bp regions around these methylated sites) were selected for further analysis.

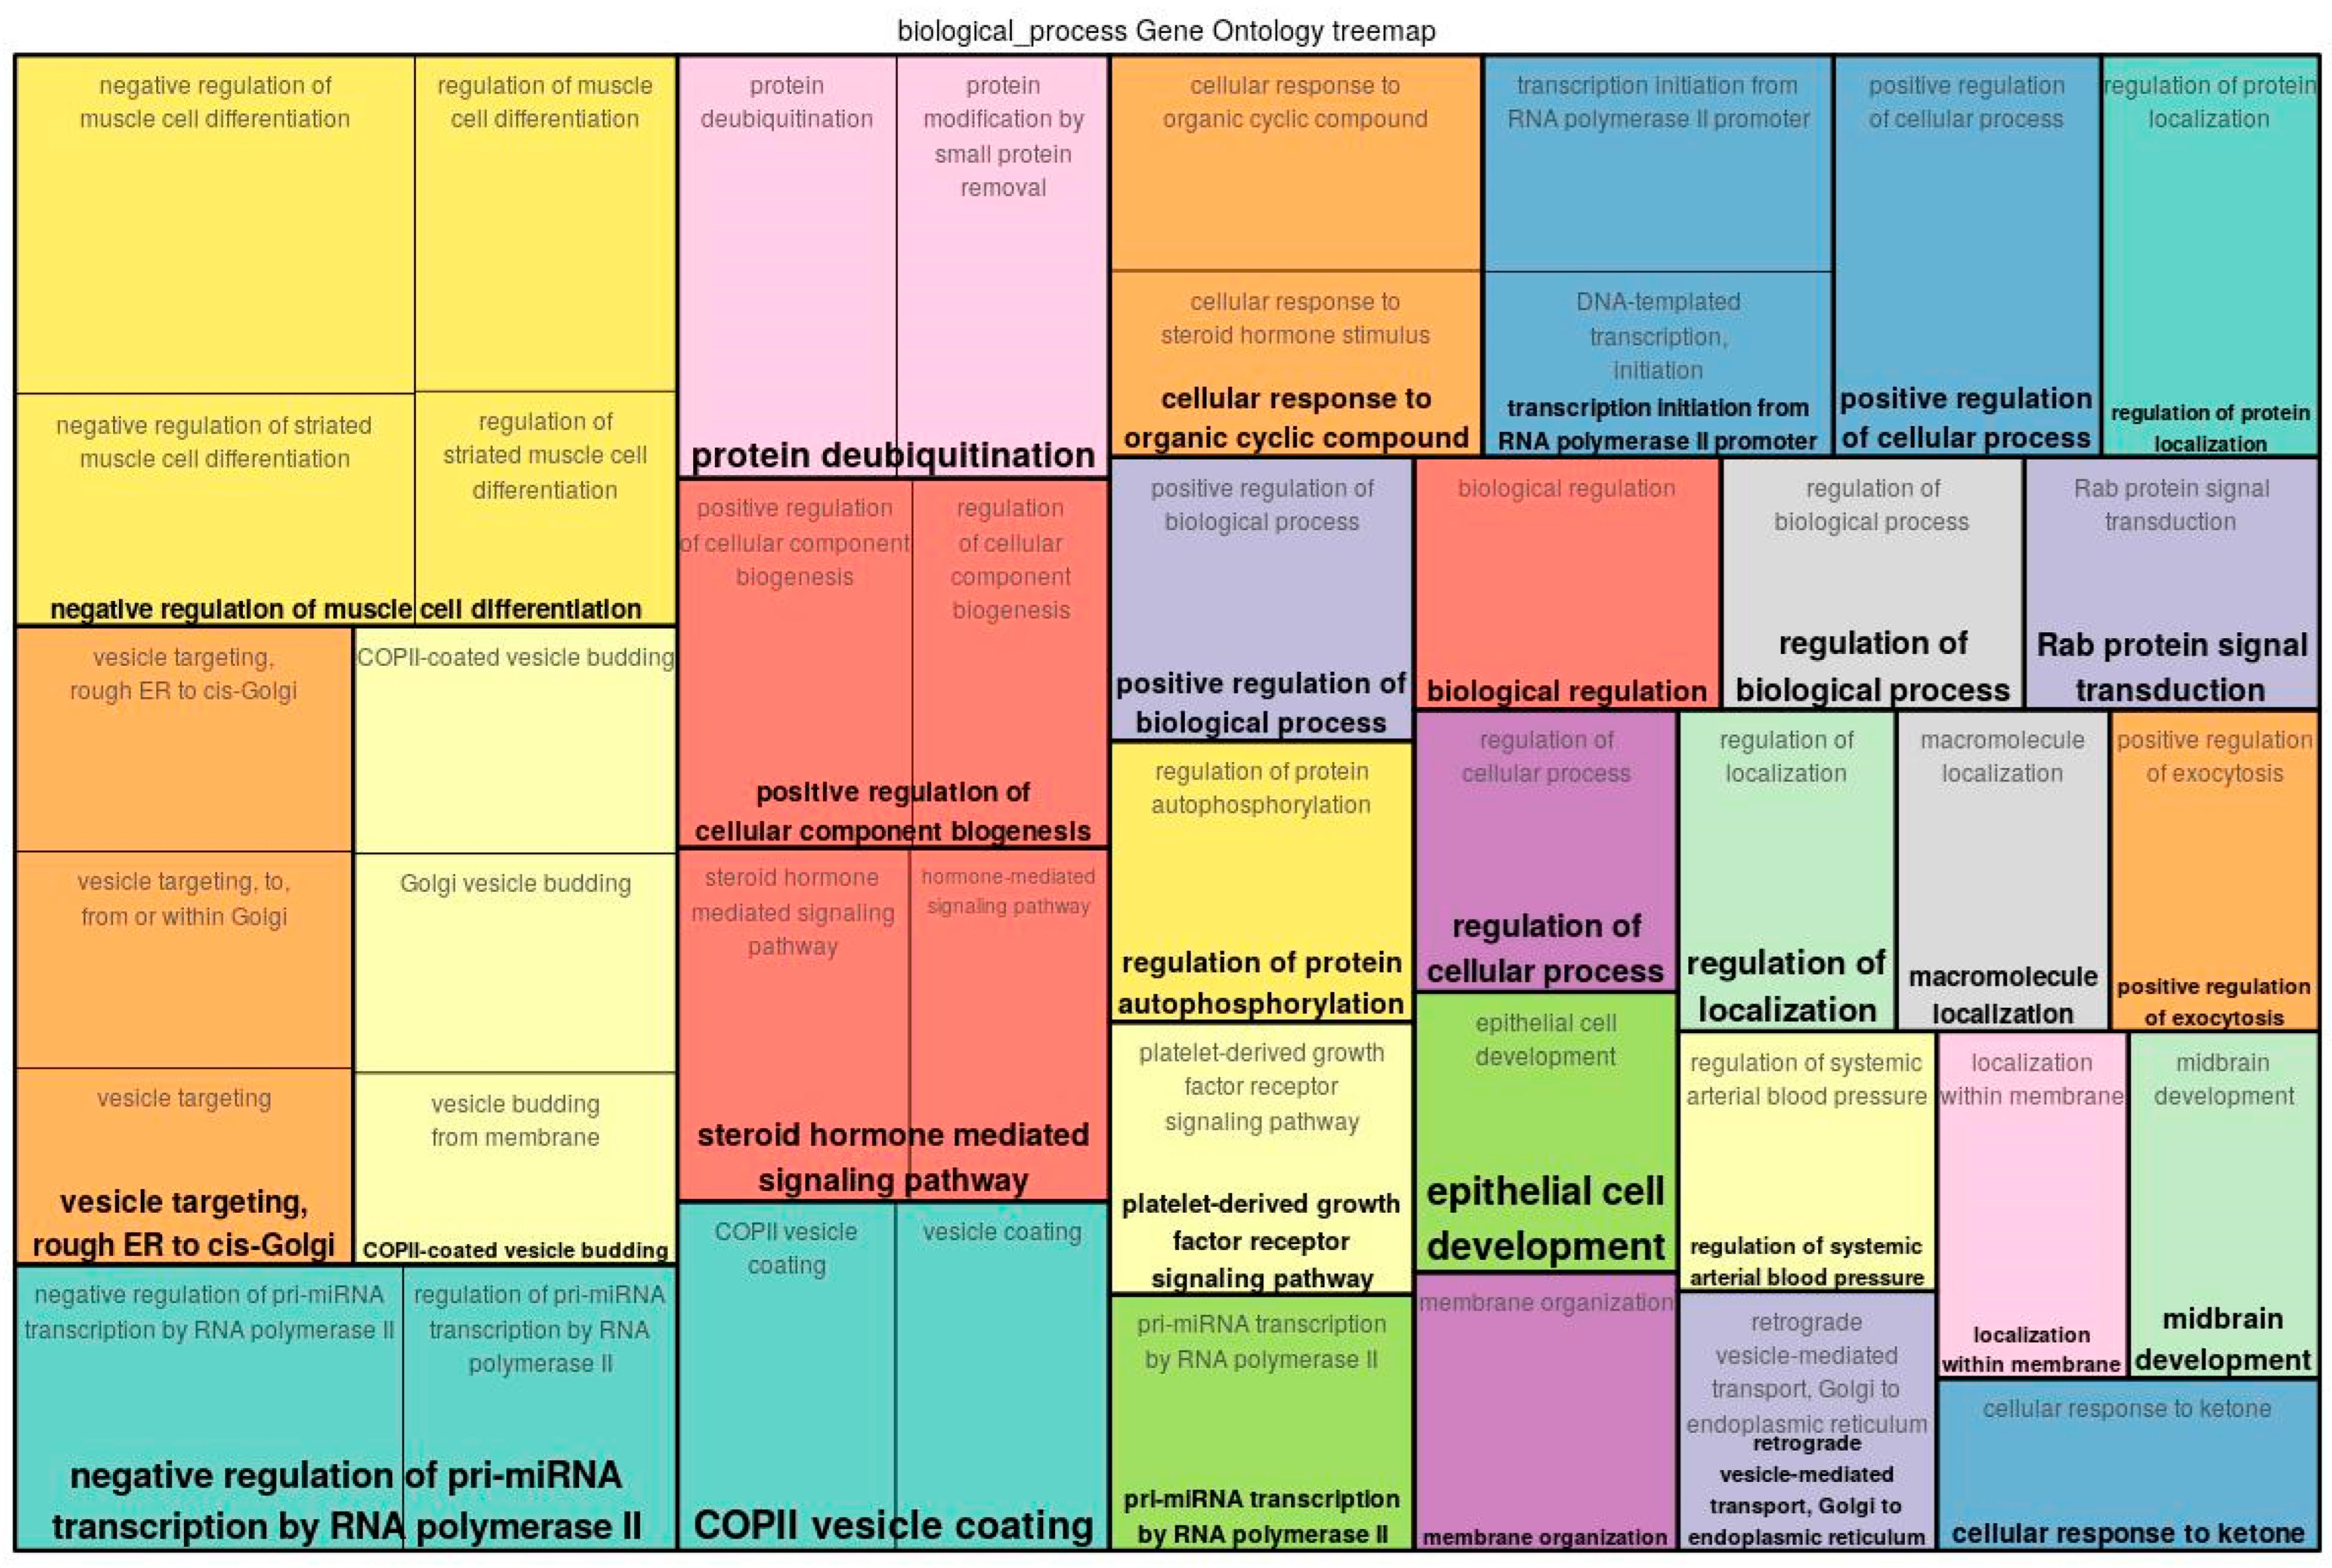
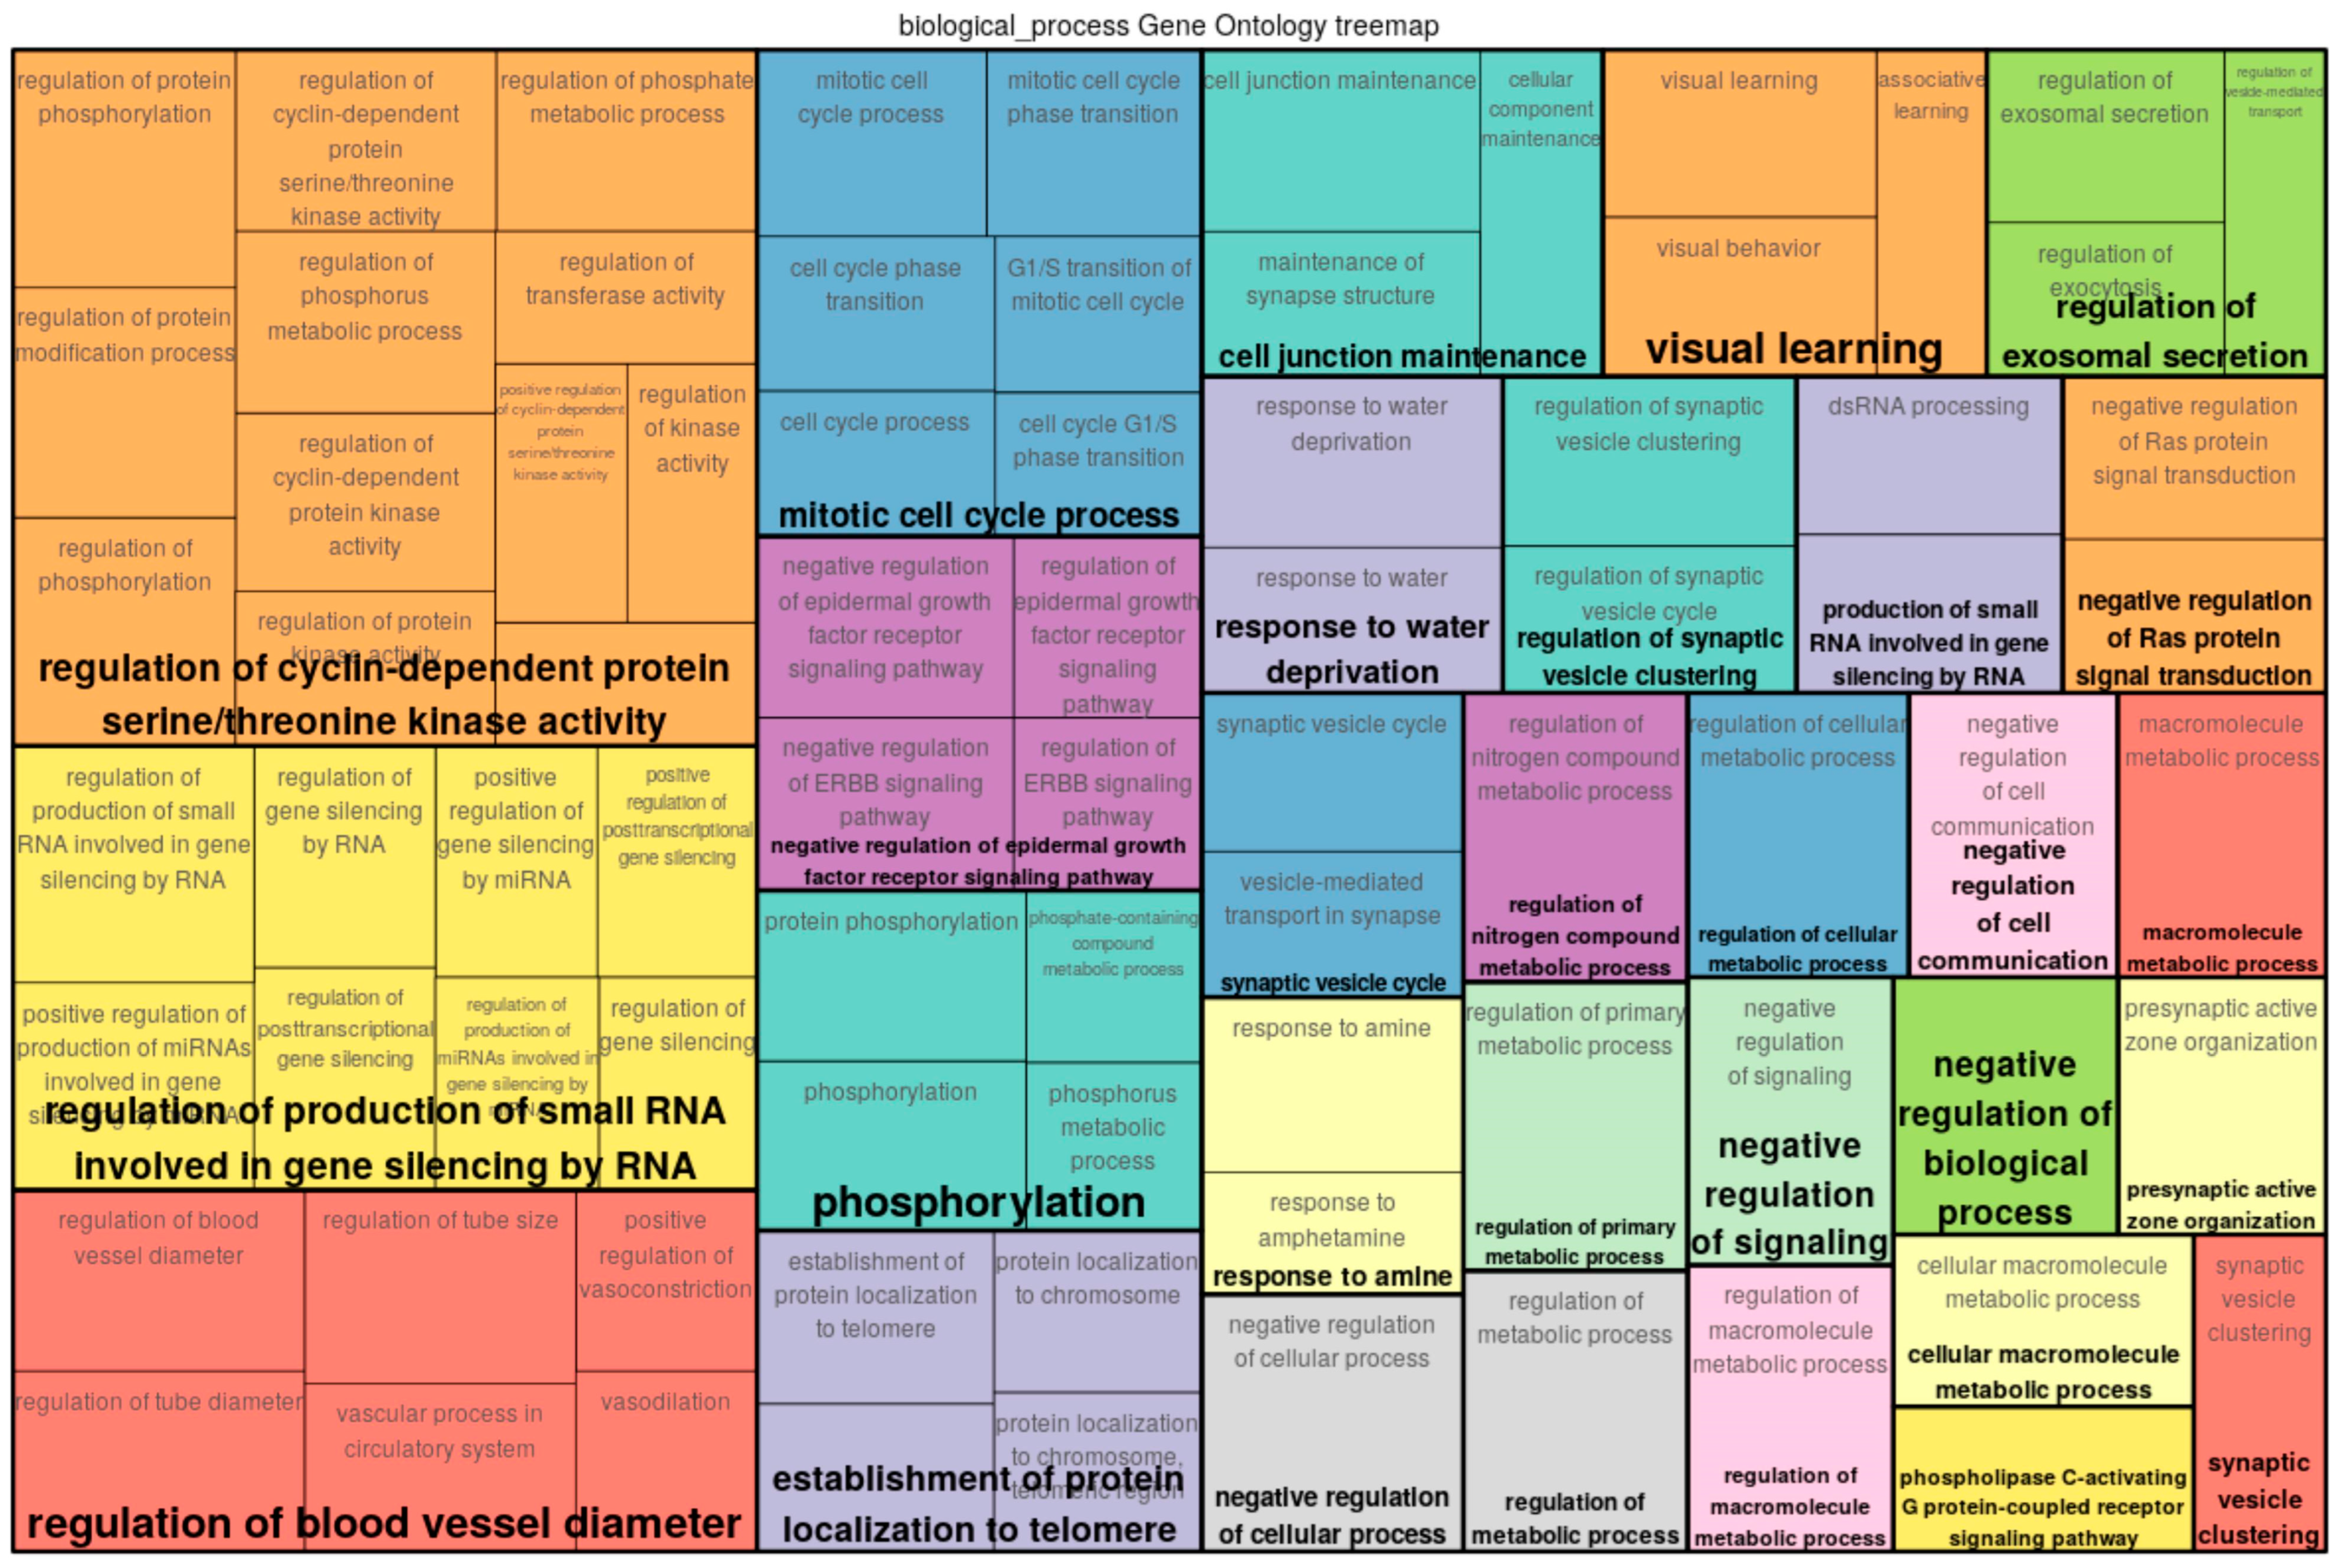
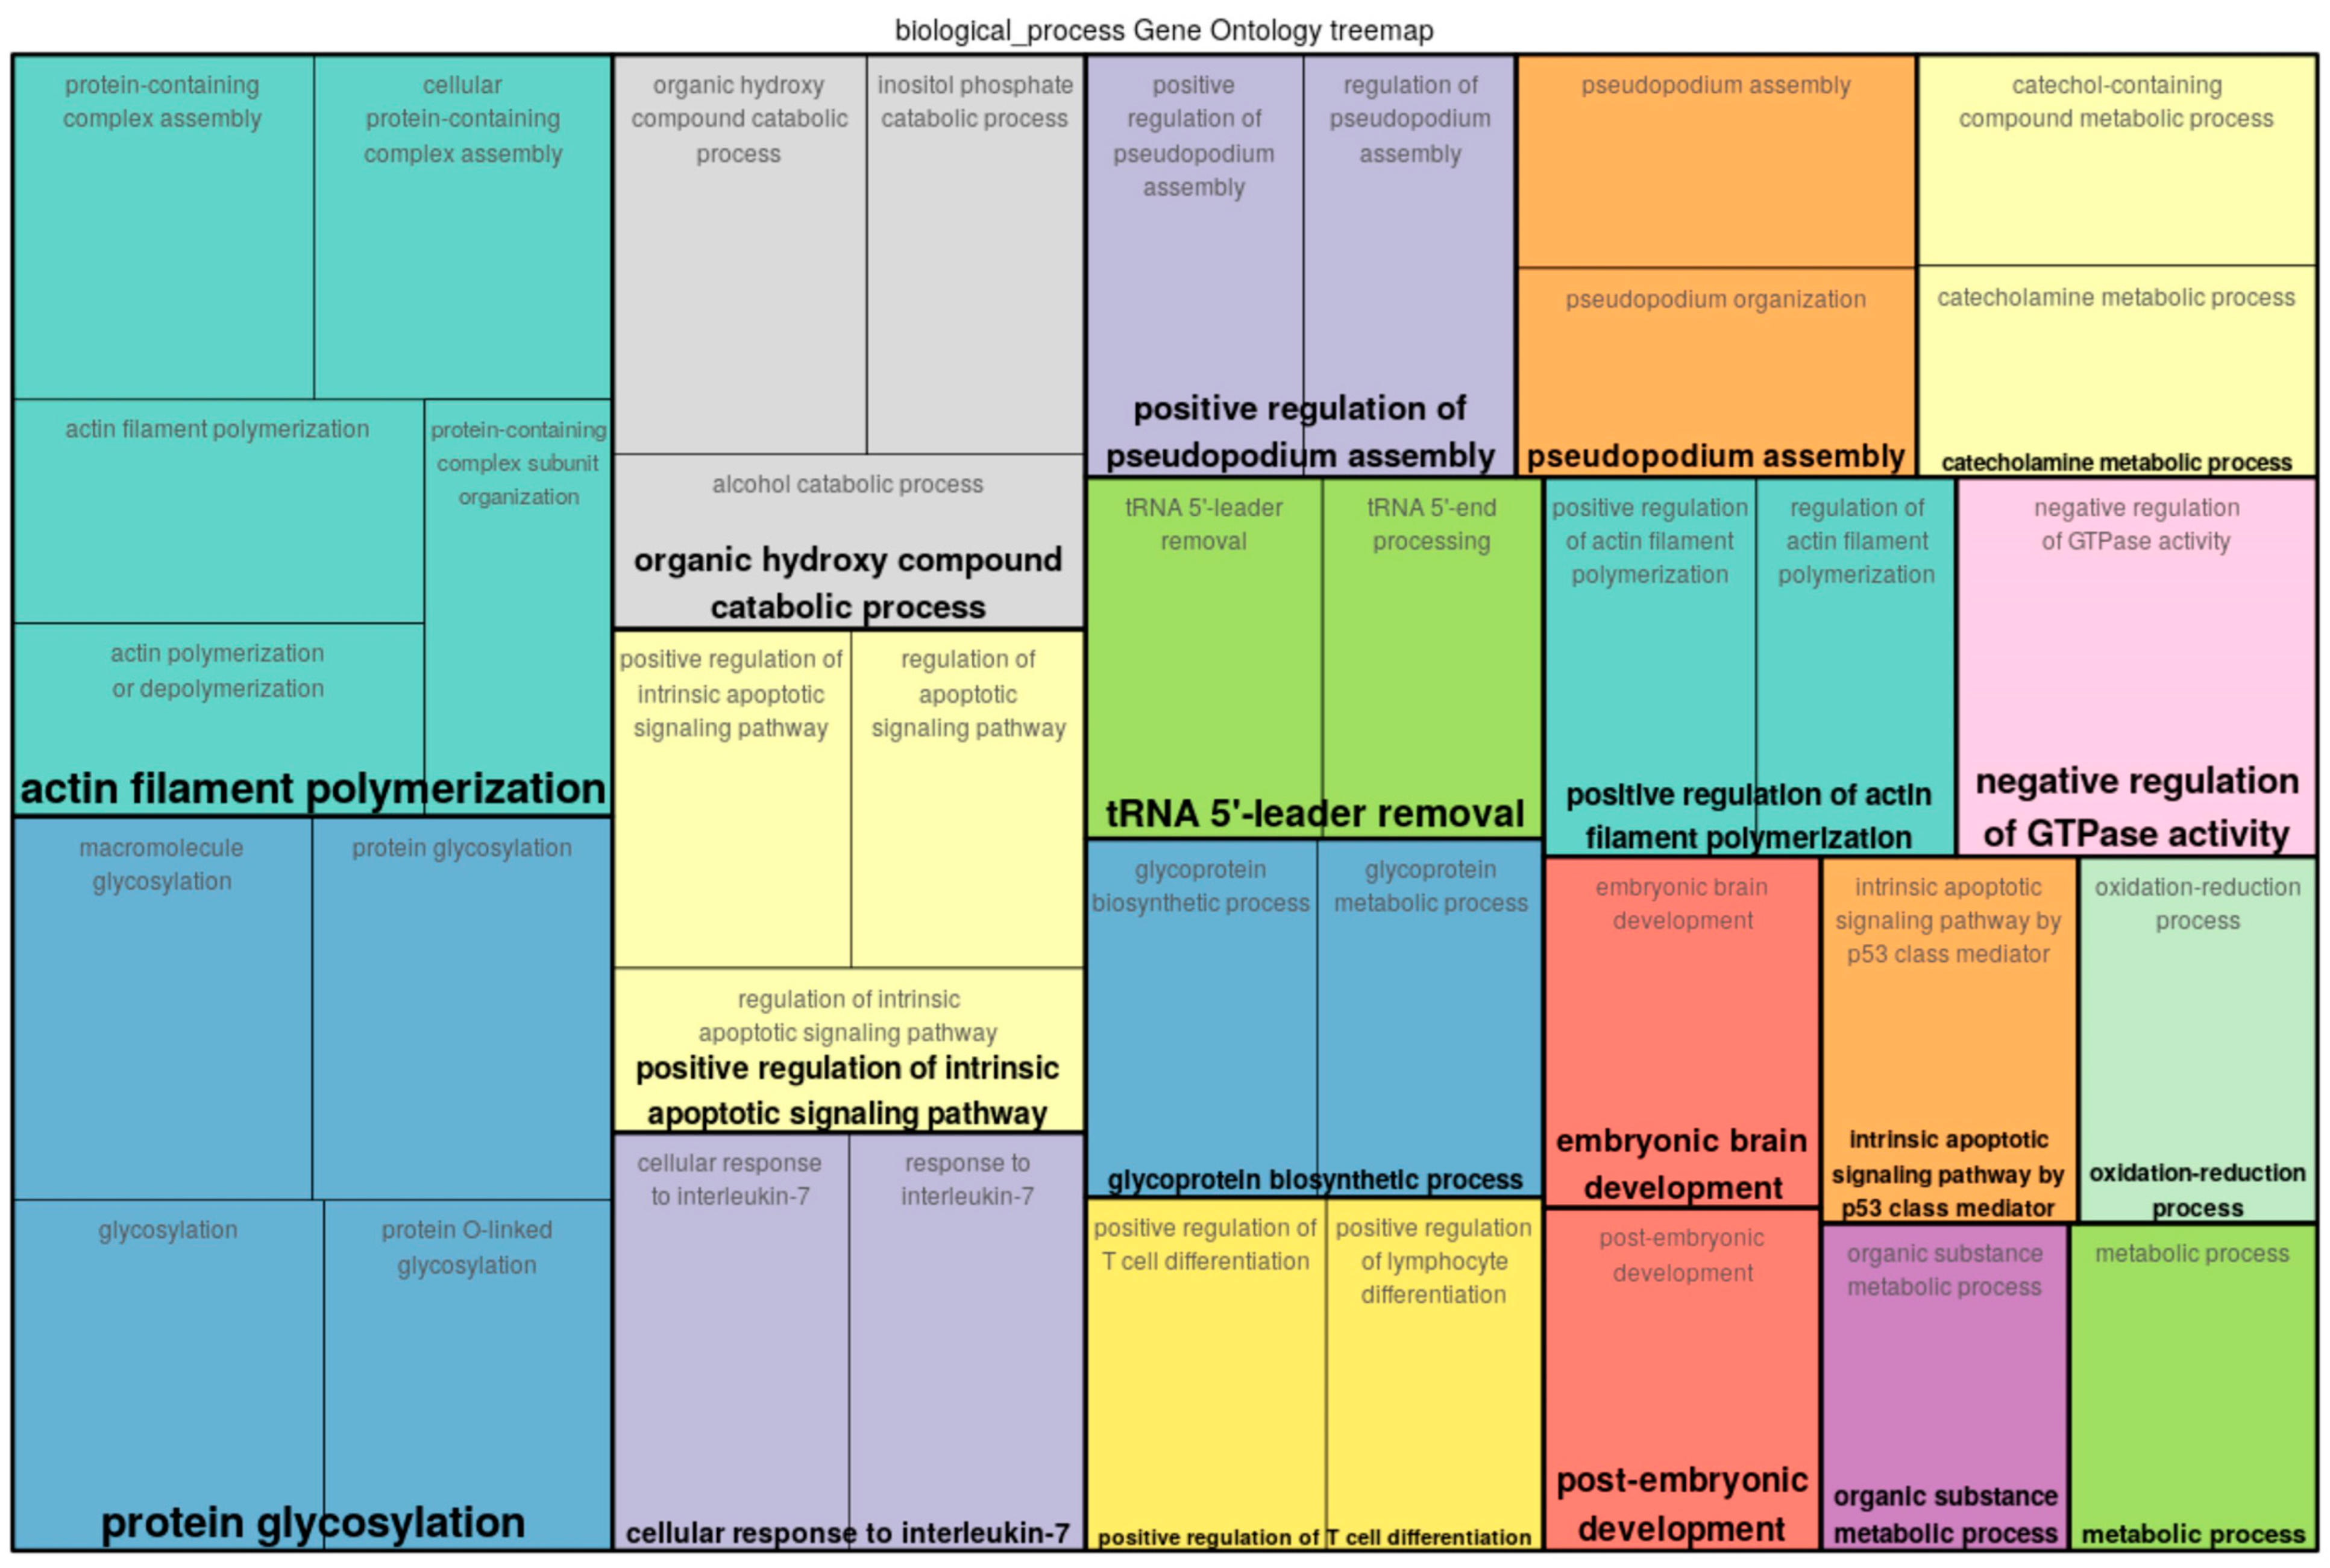
2.2. Functional Classification of Genes

A functional analysis of the top 300 genes near differentially methylated sites was conducted by mapping the input genes to several known ontologies, such as the Gene Ontology (GO)_biological process and the ontology of signal transduction and metabolic pathways from the TRANSPATH® database. Statistical significance was computed using a binomial test. Figure 2, Figure 3 and Figure 4 show the most significant categories for ECs, SMCs, and FBs, correspondingly.
GO analysis of the genes associated with differentially methylated sites showed that a number of genes potentially affected by differential methylation upon exposure of ECs to Oscillatory Shear Stress played roles in such processes as negative regulation of muscle cell differentiation (hit names: PDGFB, PLPP7, YY1), positive regulation of cellular component biogenesis (CCP110, HGS, TESK1, TIGD5, TPPP2), regulation of protein autophosphorylation (PDGFB, TESK1), platelet-derived growth factor receptor signaling pathway (HGS, PDGFB), steroid hormone mediated signaling pathway (AR, NR3C2, NR4A2), cellular response to organic cyclic compound (AR, LARP1, NR3C2, NR4A2, PDGFB), vesicle targeting/coating and rough ER to cis-Golgi and vesicle budding from membrane (CNIH2, RAB1B), positive regulation of exocytosis (HGS, RAB9A), regulation of systemic arterial blood pressure (AR, PDGFB), retrograde vesicle-mediated transport, Golgi to endoplasmic reticulum (RAB1B, RER1), macroautophagy (HGS, LARP1, RAB1B), etc. (see Supplementary Table S4).
Full classification of GO categories for SMCs may be seen in Supplementary Table S5. GO analysis revealed that a number of genes potentially affected by differential methylation upon exposure of SMCs to the preconditioned media from ECs (+/− oscillatory shear stress-exposed) played roles in such processes as negative regulation of cellular processes, regulation of nitrogen compound metabolic processes (hit names: C5AR2, CCND2, CD38, CD9, CDH2, CDKN3, CHFR, CHMP6, CLSPN, DCLK1, DDX5, etc.), regulation of metabolic process (C5AR2, CCND2, CCNJL, CCNT2, CCT7, HGS, etc.), negative regulation of cell communication (C5AR2, CD38, CDH2, DRD1, F2R, HGS, HIF1AN, ING2, P2RY1, PSMD13, SIRT3, SPRY2, etc.), regulation of the production of small RNAs involved in gene silencing by RNA (DDX5, LIN28A, TERT), presynaptic active zone organization (ERC2, PCDH17), regulation of protein phosphorylation (C5AR2, CCND2, CCNJL, CCNT2, CDH2, CDKN3, CHMP6, CLSPN, DRD1, F2R, HGS, MICAL1, NCKAP1L, P2RY1, etc.), regulation of blood vessel diameter and size (CD38, CPS1, DRD1, F2R, P2RY1), cell junction maintenance (ERC2, F2R, SYNGAP1), regulation of synaptic vesicle clustering (CDH2, PCDH17), regulation of cyclin-dependent protein serine/threonine kinase activity (CCND2, CCNJL, CCNT2, CDKN3), negative regulation of the epidermal growth factor receptor signaling pathway (CHMP6, HGS, SPRY2), vascular processes in the circulatory system (CD38, CPS1, DRD1, F2R, P2RY1), regulation of presynaptic cytosolic calcium ion concentration (ATP2B2, P2RY1), regulation of exosomal secretion (CHMP6, HGS), and smooth muscle contraction (CD38, DRD1, F2R).
HIF1AN (also known as FIH1)—a HIF1-alpha inhibitor—is the cellular oxygen sensor factor inhibiting hypoxia-inducible factor 1 alpha [15] by preventing its transcriptional activity and leading to adaptive responses to hypoxia. HIF1AN plays a critical role in controlling the survival of vascular ECs through interacting with Notch2 and repressing its activity [16]. This may point to an interconnection between ECs and SMCs belonging to adjacent layers. It is worth noting that the HIF1AN antagonist—HIF1-alpha—is not only regulated by the hypoxic stimulus, but can also act as a target for potentiating the protective effects from some adaptogenic triggers [17].
A full classification of GO categories for FBs may be seen in Supplementary Table S6. GO analysis revealed that a number of genes potentially affected by differential methylation upon exposure of FBs to the preconditioned media from SMCs (treated with the preconditioned media from +/− oscillatory shear stress-exposed ECs) played roles in such processes as negative regulation of GTPase activity (hit names: GPS1, IQGAP2, PTPRN2, RCC2), protein glycosylation (B3GALT6, DOLK, GALNT1, GALNT17, MAN2A2, RFNG, TET2, TMTC2, etc.), protein-containing complex assembly (CDC42EP2, CDC42EP4, CHMP6, F8, FMC1, GPX4, etc.), intrinsic apoptotic signaling pathway by p53 class mediator (PTTG1IP, RPL11, SHISA5, WWOX), actin filament polymerization (CDC42EP2, CDC42EP4, IQGAP2, MSRB2, PPP1R9A, TIGD5), the inositol phosphate catabolic process (IMPA2, NUDT3), the oxidation–reduction process (ADHFE1, CYP4B1, DHCR7, DHFR, F8, FAHD1, FXN, GPX4, HIF1AN, MSRB2, NDUFA7, NDUFS3.., etc.), and regulation of the apoptotic signaling pathway (FXN, INHBB, MCL1, NACC2, NDUFS3, NR4A2, PTTG1IP, RPL11, WWOX).
For instance, it was shown that activation of CDC42 is involved in the hypoxia-induced production of angiogenesis-promoting factors such as vascular endothelial growth factor (VEGF) [18], as well as in actin filament polymerization [19]. Proteins of this family also play roles in cytoskeletal remodeling and signaling, cell shape, directed migration and differentiation, and pathological fibroblast activation [20]. The aforementioned HIF1AN, participating in the oxidation–reduction process, is also present in FBs.
The results of the additional functional analysis of the input genes mapped to the ontology of signal transduction and metabolic pathways, according to the TRANSPATH® database, are shown in Supplementary Figures S2–S4. The affected genes were significantly enriched with specific pathway ontology categories. A full classification of those categories for each cell type may be seen in Supplementary Tables S7–S9.
The result of overall GO analysis of the genes near differentially methylated sites can be summarized by the following diagram (Figure 5), which reveals the most significant functional categories overrepresented among the observed genes. Thus, we can report that our epigenome-wide analysis revealed important changes that accompany the effect of oscillatory shear stress on the venous endothelium, which spreads to SMCs and FBs that represent the middle and outer layers of the vein wall, correspondingly.
To better understand the relation of differentially methylated genes to the pathological condition, we developed an interactive illustration for the most significant of those genes in different cells and their cellular functions with respect to pathological consequences (Figure 6).
The figure shows how the functions of these genes (with the highest value of |DiffScore|) could be linked to the pathological processes involved in varicose transformation of the vein wall.

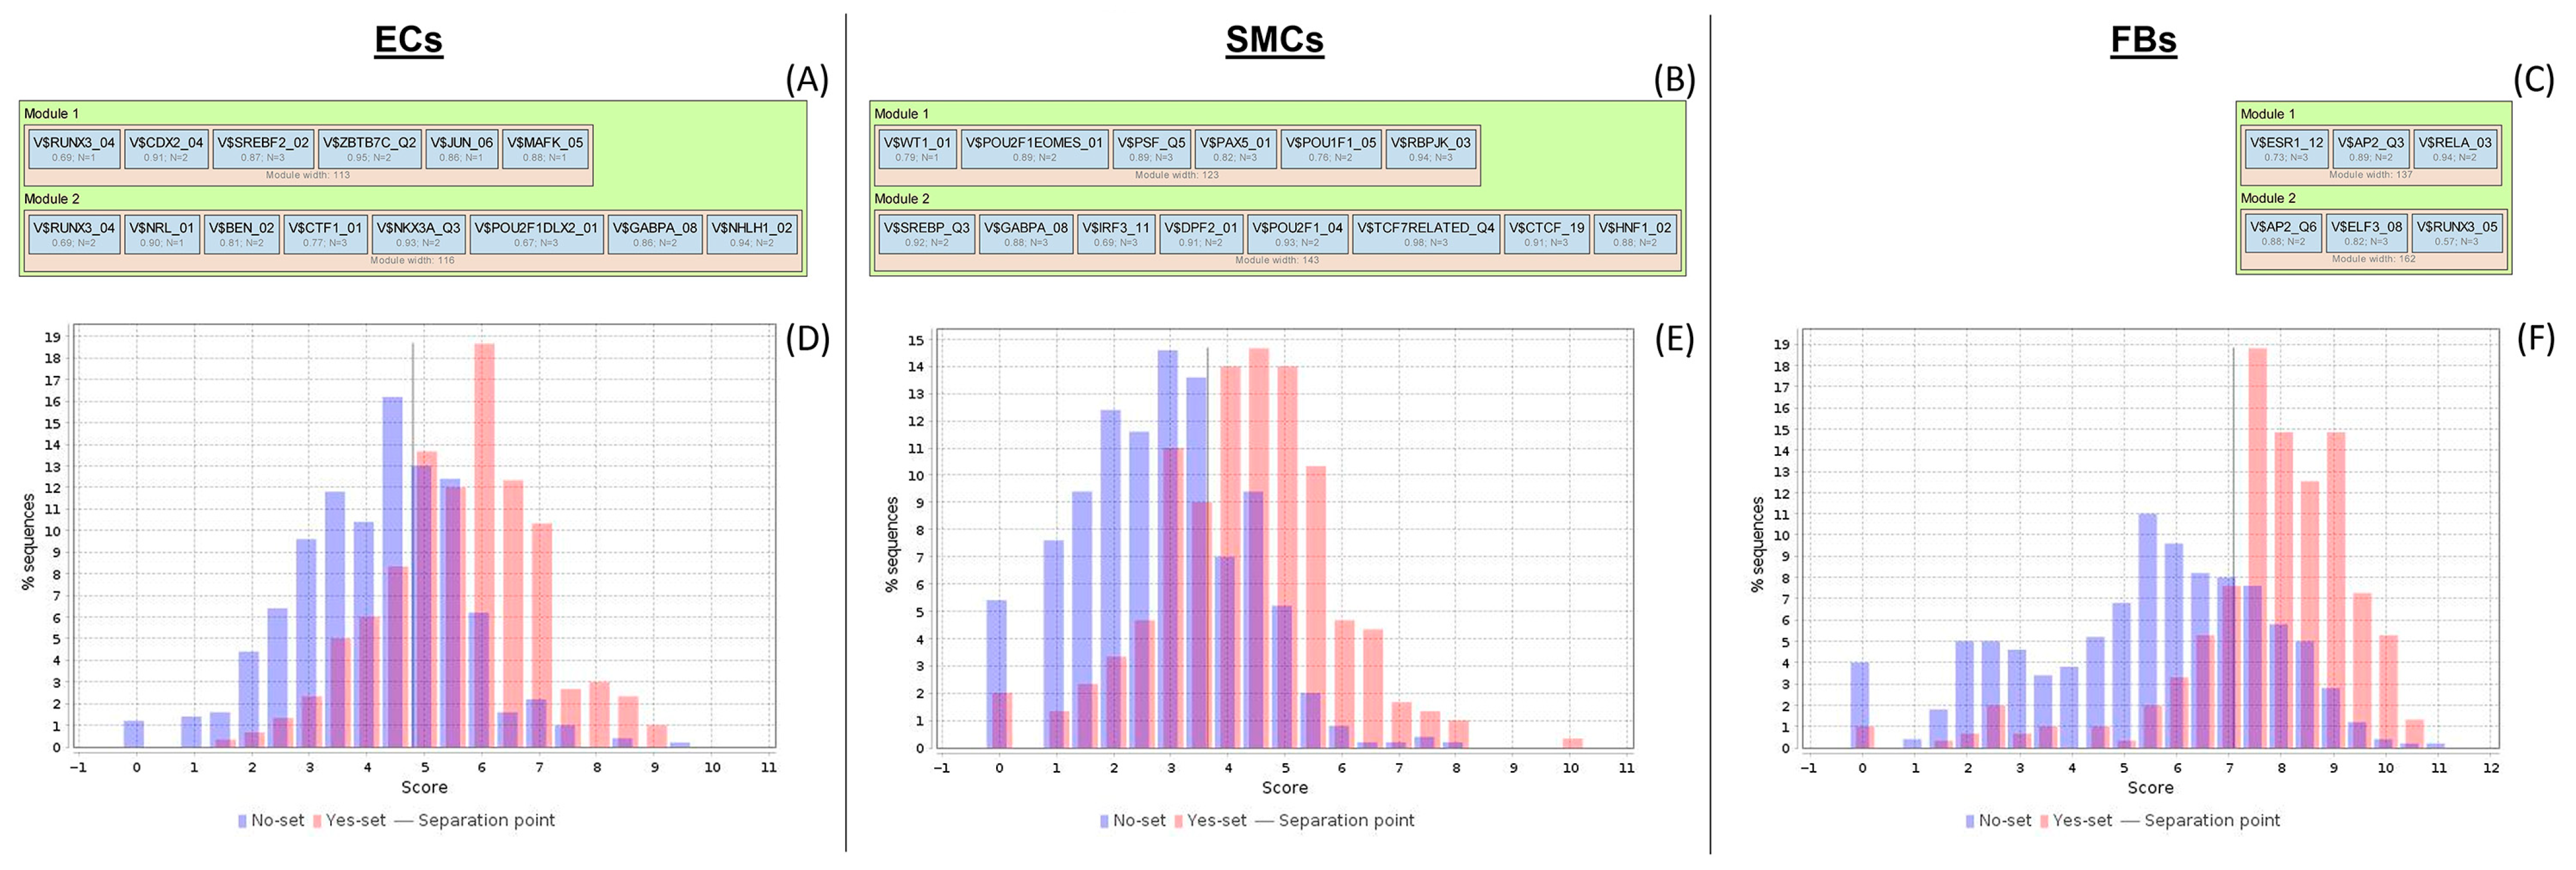
2.3. Analysis of Enriched Transcription Factor Binding Sites and Composite Modules

In the next step, a search for transcription factor binding sites (TFBS) was performed in the regulatory regions of the target genes by using the TF binding motif library of the TRANSFAC® database. We searched for so-called composite modules acting as potential condition-specific enhancers of the target genes in their upstream regulatory regions (−1000 bp upstream of transcription start site (TSS)) and identified transcription factors regulating the activity of the genes through such enhancers.
Classically, enhancers are defined as regions in the genome that increase the transcription of one or several genes when inserted in either orientation at various distances upstream or downstream of the gene [21]. Enhancers typically have a length of several hundreds of nucleotides and are bound by multiple transcription factors in a cooperative manner [22].
In the current work, we used epigenomics data from the tracks (Supplementary Tables S1–S3) to predict the positions of potential enhancers regulating the genes near differentially methylated sites revealed by comparative epigenomics analysis. We took genomic regions −550 bp upstream and 550 bp downstream from the middle point of each interval of the track and checked whether these regions were located inside the 5 kb flanking areas of the genes near differentially methylated sites (or inside the bodies of the genes). In such cases, these genomic regions are used for the search for potential condition-specific enhancers. In all other cases, when the genes near differentially methylated sites did not contain epigenomic peaks in their bodies or in the 5 kb flanking regions, we used the upstream regulatory regions of these genes (−1000 bp upstream and 100 bp downstream of TSS) for our search for condition-specific enhancers.
We applied the Composite Module Analyst (CMA) method [8] to detect such potential enhancers as targets of multiple TFs bound in a cooperative manner to the regulatory regions of the genes of interest. CMA applies a genetic algorithm to construct a generalized model of the enhancers by specifying combinations of TF motifs (from TRANSFAC®) whose sites are most frequently clustered together in the regulatory regions of the studied genes. CMA identifies the transcription factors which, through their cooperation, provide a synergistic effect and, thus, have a great influence on the gene regulation process.
To build the most specific composite modules, we chose genes as the input for the CMA algorithm. The results of this search are represented in Figure 7. The model consisted of two modules. In Figure 7A–C, the following information is shown for each module: PWMs (position weight matrixes) producing matches, scores of the best matches, and the number of individual matches (N) for each PWM. Through this analysis, we identified TFs whose binding to their control regions may be significantly altered by CpG methylation, leading to shifts in the expression of many genes in our experiment. The CMA algorithm identified enriched combinations of TFs with high statistical significance (Wilcoxon p-value = 2.33 × 10−36 for ECs, 4.34 × 10⁻³⁵ for SMCs, and 1.62 × 10−48 for FBs). The AUC of the model for FBs achieved a value (=0.81) significantly higher than expected for a random set of regulatory regions (Z-score = 3.81), which means that there are significantly more TF site pairs in CpG regulatory regions compared to the background.
On the basis of the enhancer models, we identified transcription factors potentially regulating the target genes of our interest. We found 14, 17, and 7 transcription factors controlling the expression of target genes for ECs, SMCs, and FBs, correspondingly (see Table 4). In the table, ≤10 TFs for each cell type are shown. Full lists of TFs may be seen in Supplementary Tables S10–S12.
The key transcription factors which were predicted to be potentially regulating genes near differentially methylated sites in our experiment were: JUN, CDX2, and POU2F1 for ECs; SREBF2, LEF1, and IRF3 for SMCs; and RELA, ESR1, and TFAP2A for FBs. The relevance of these TFs is discussed later on, in the Section 3.

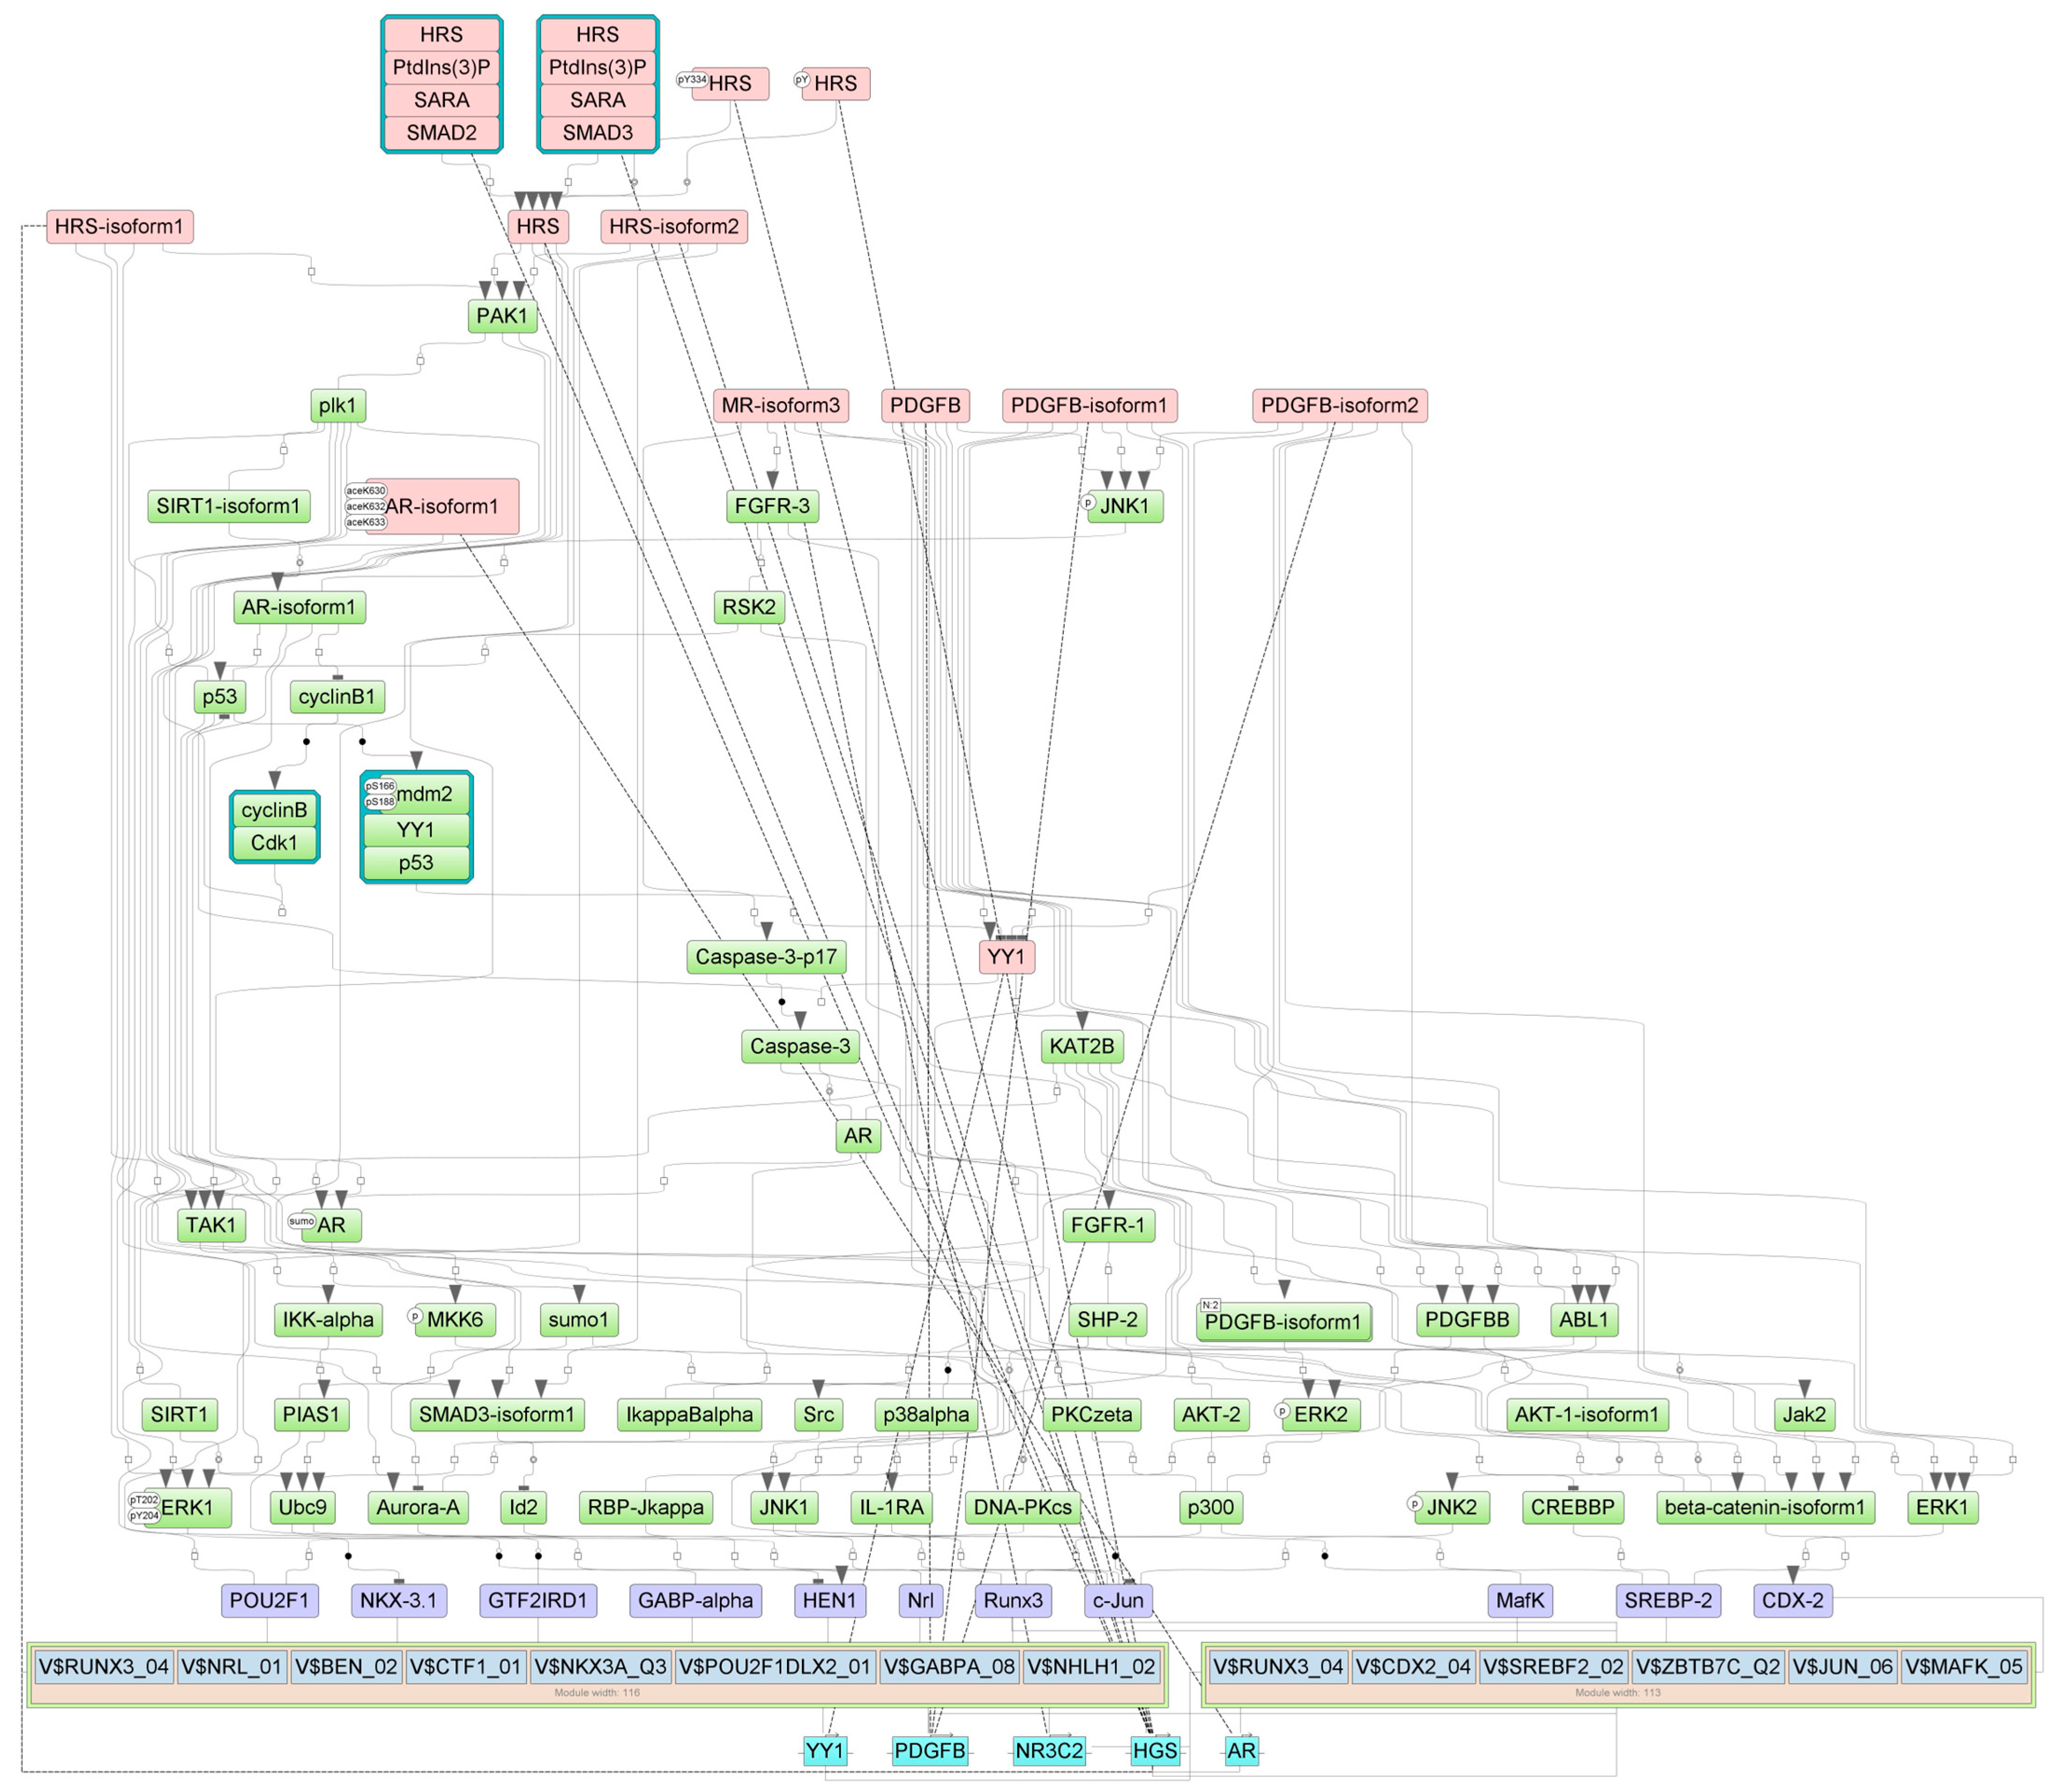
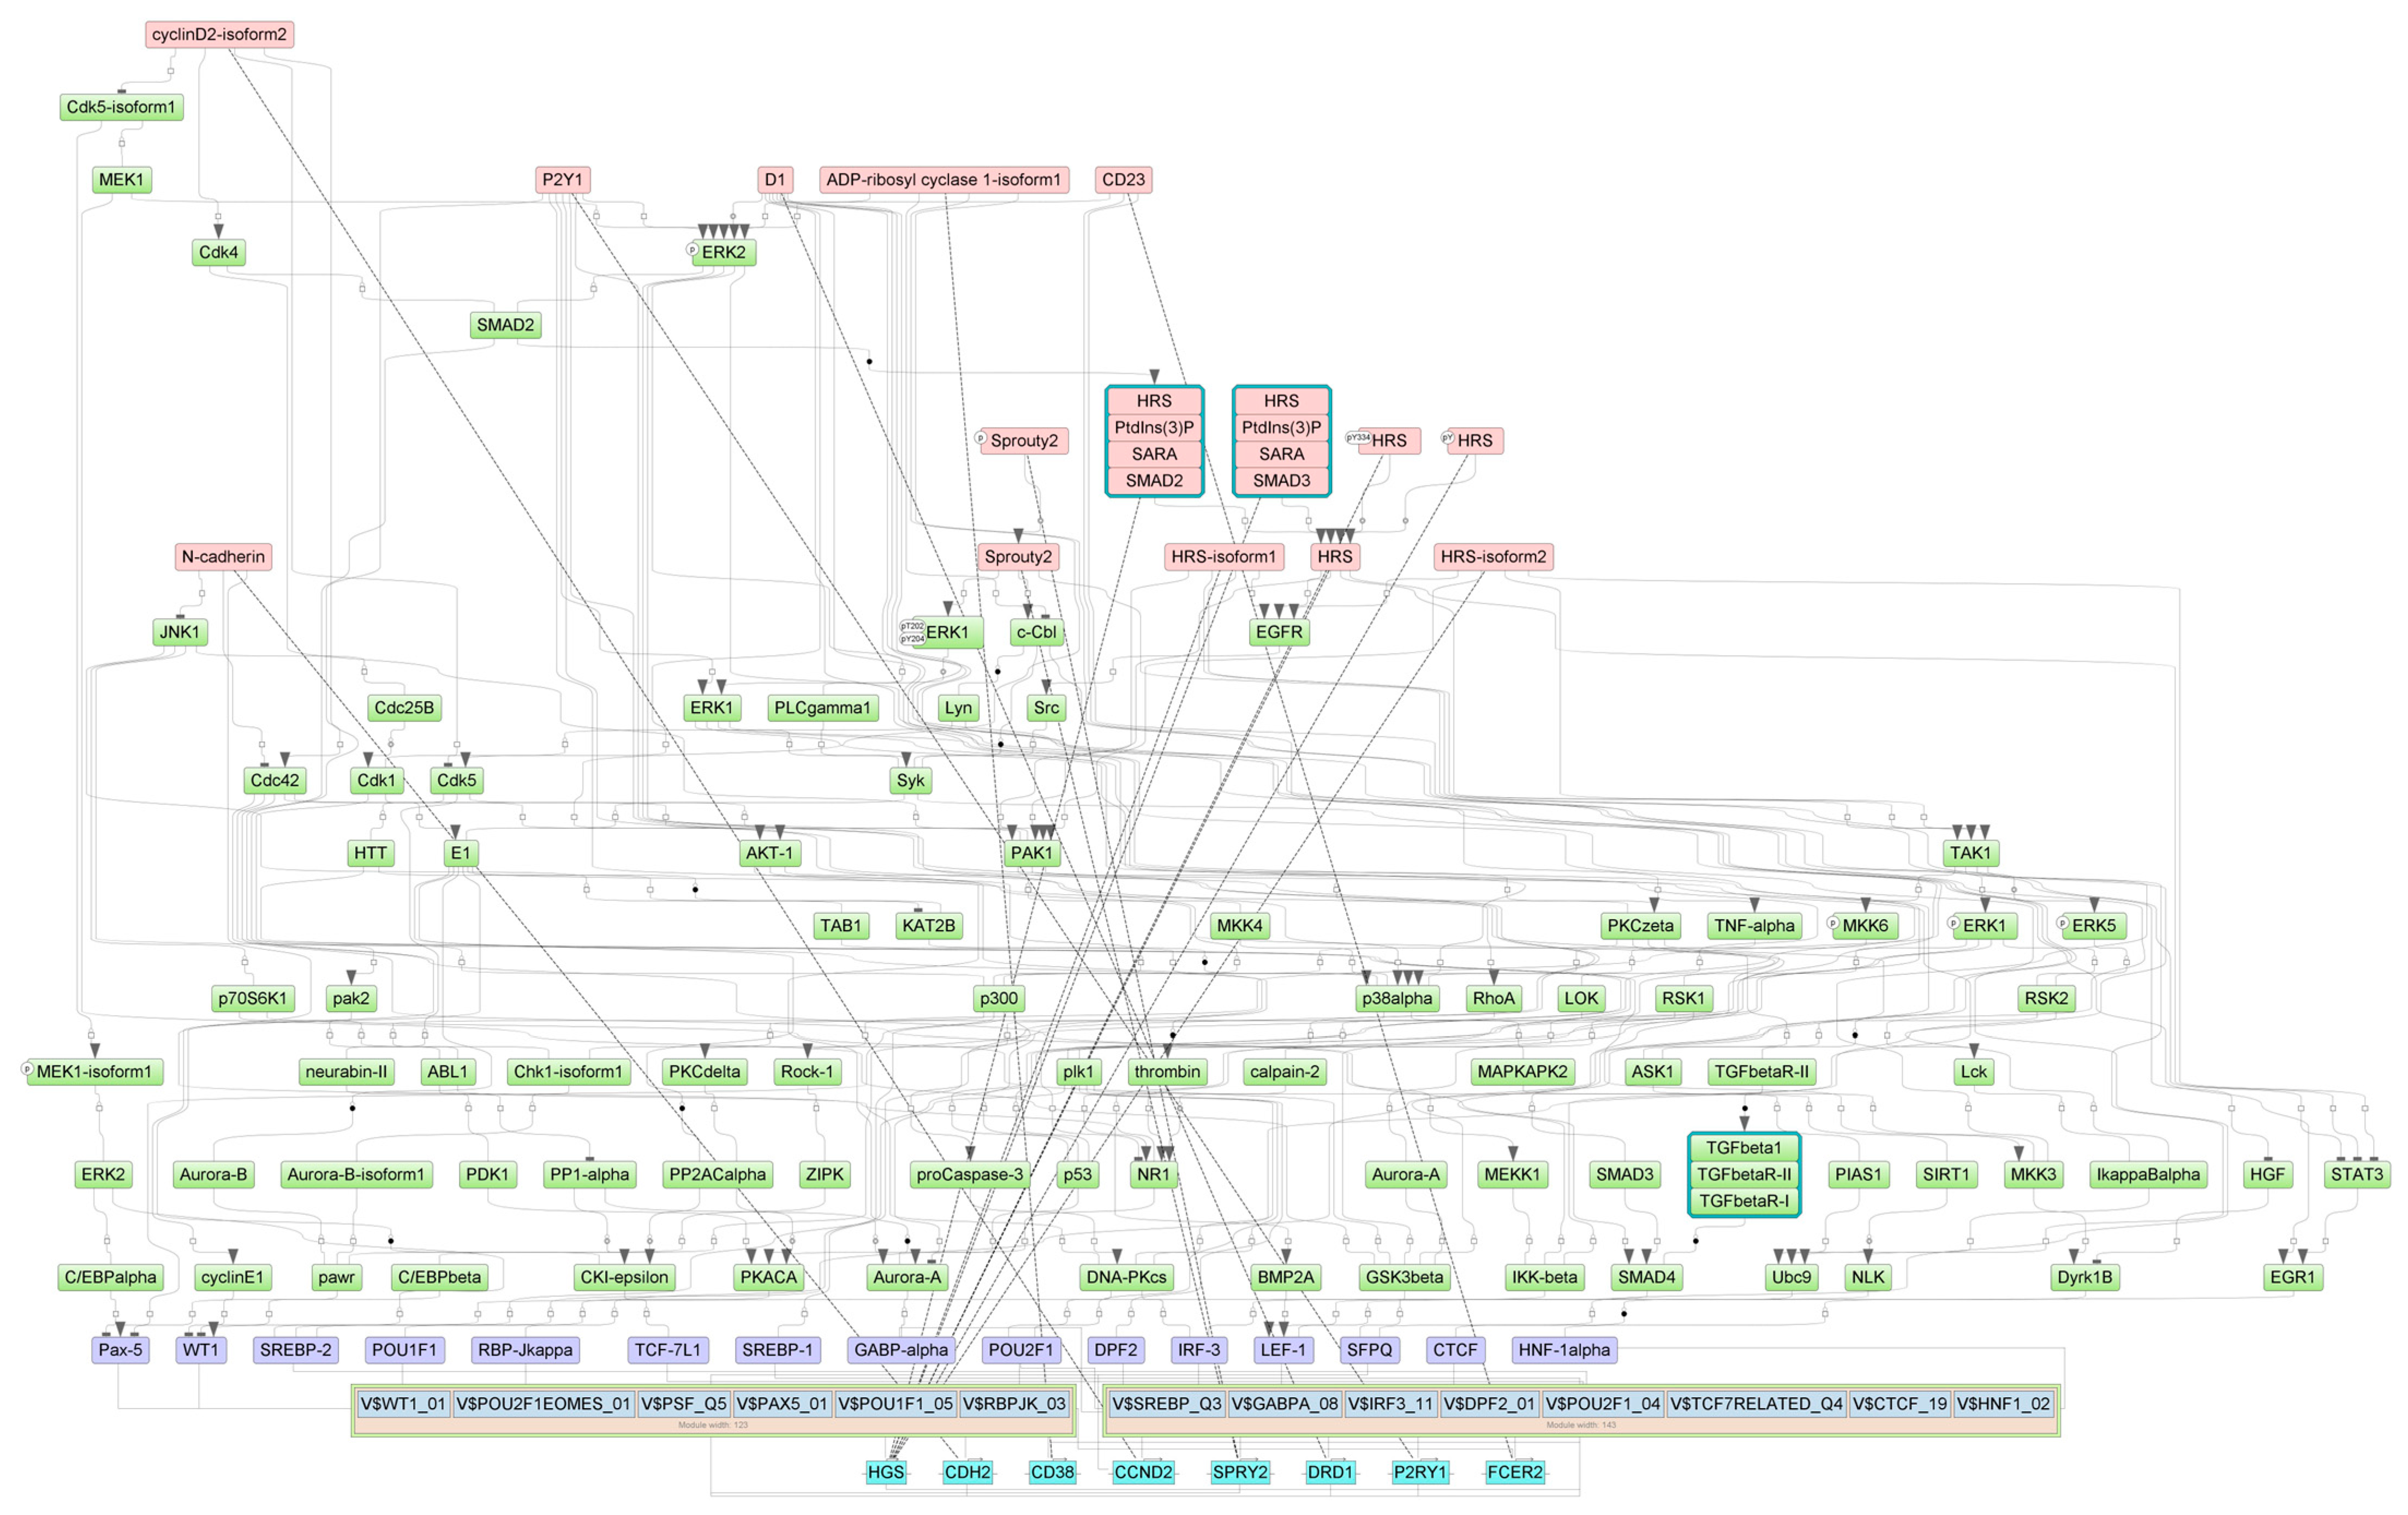
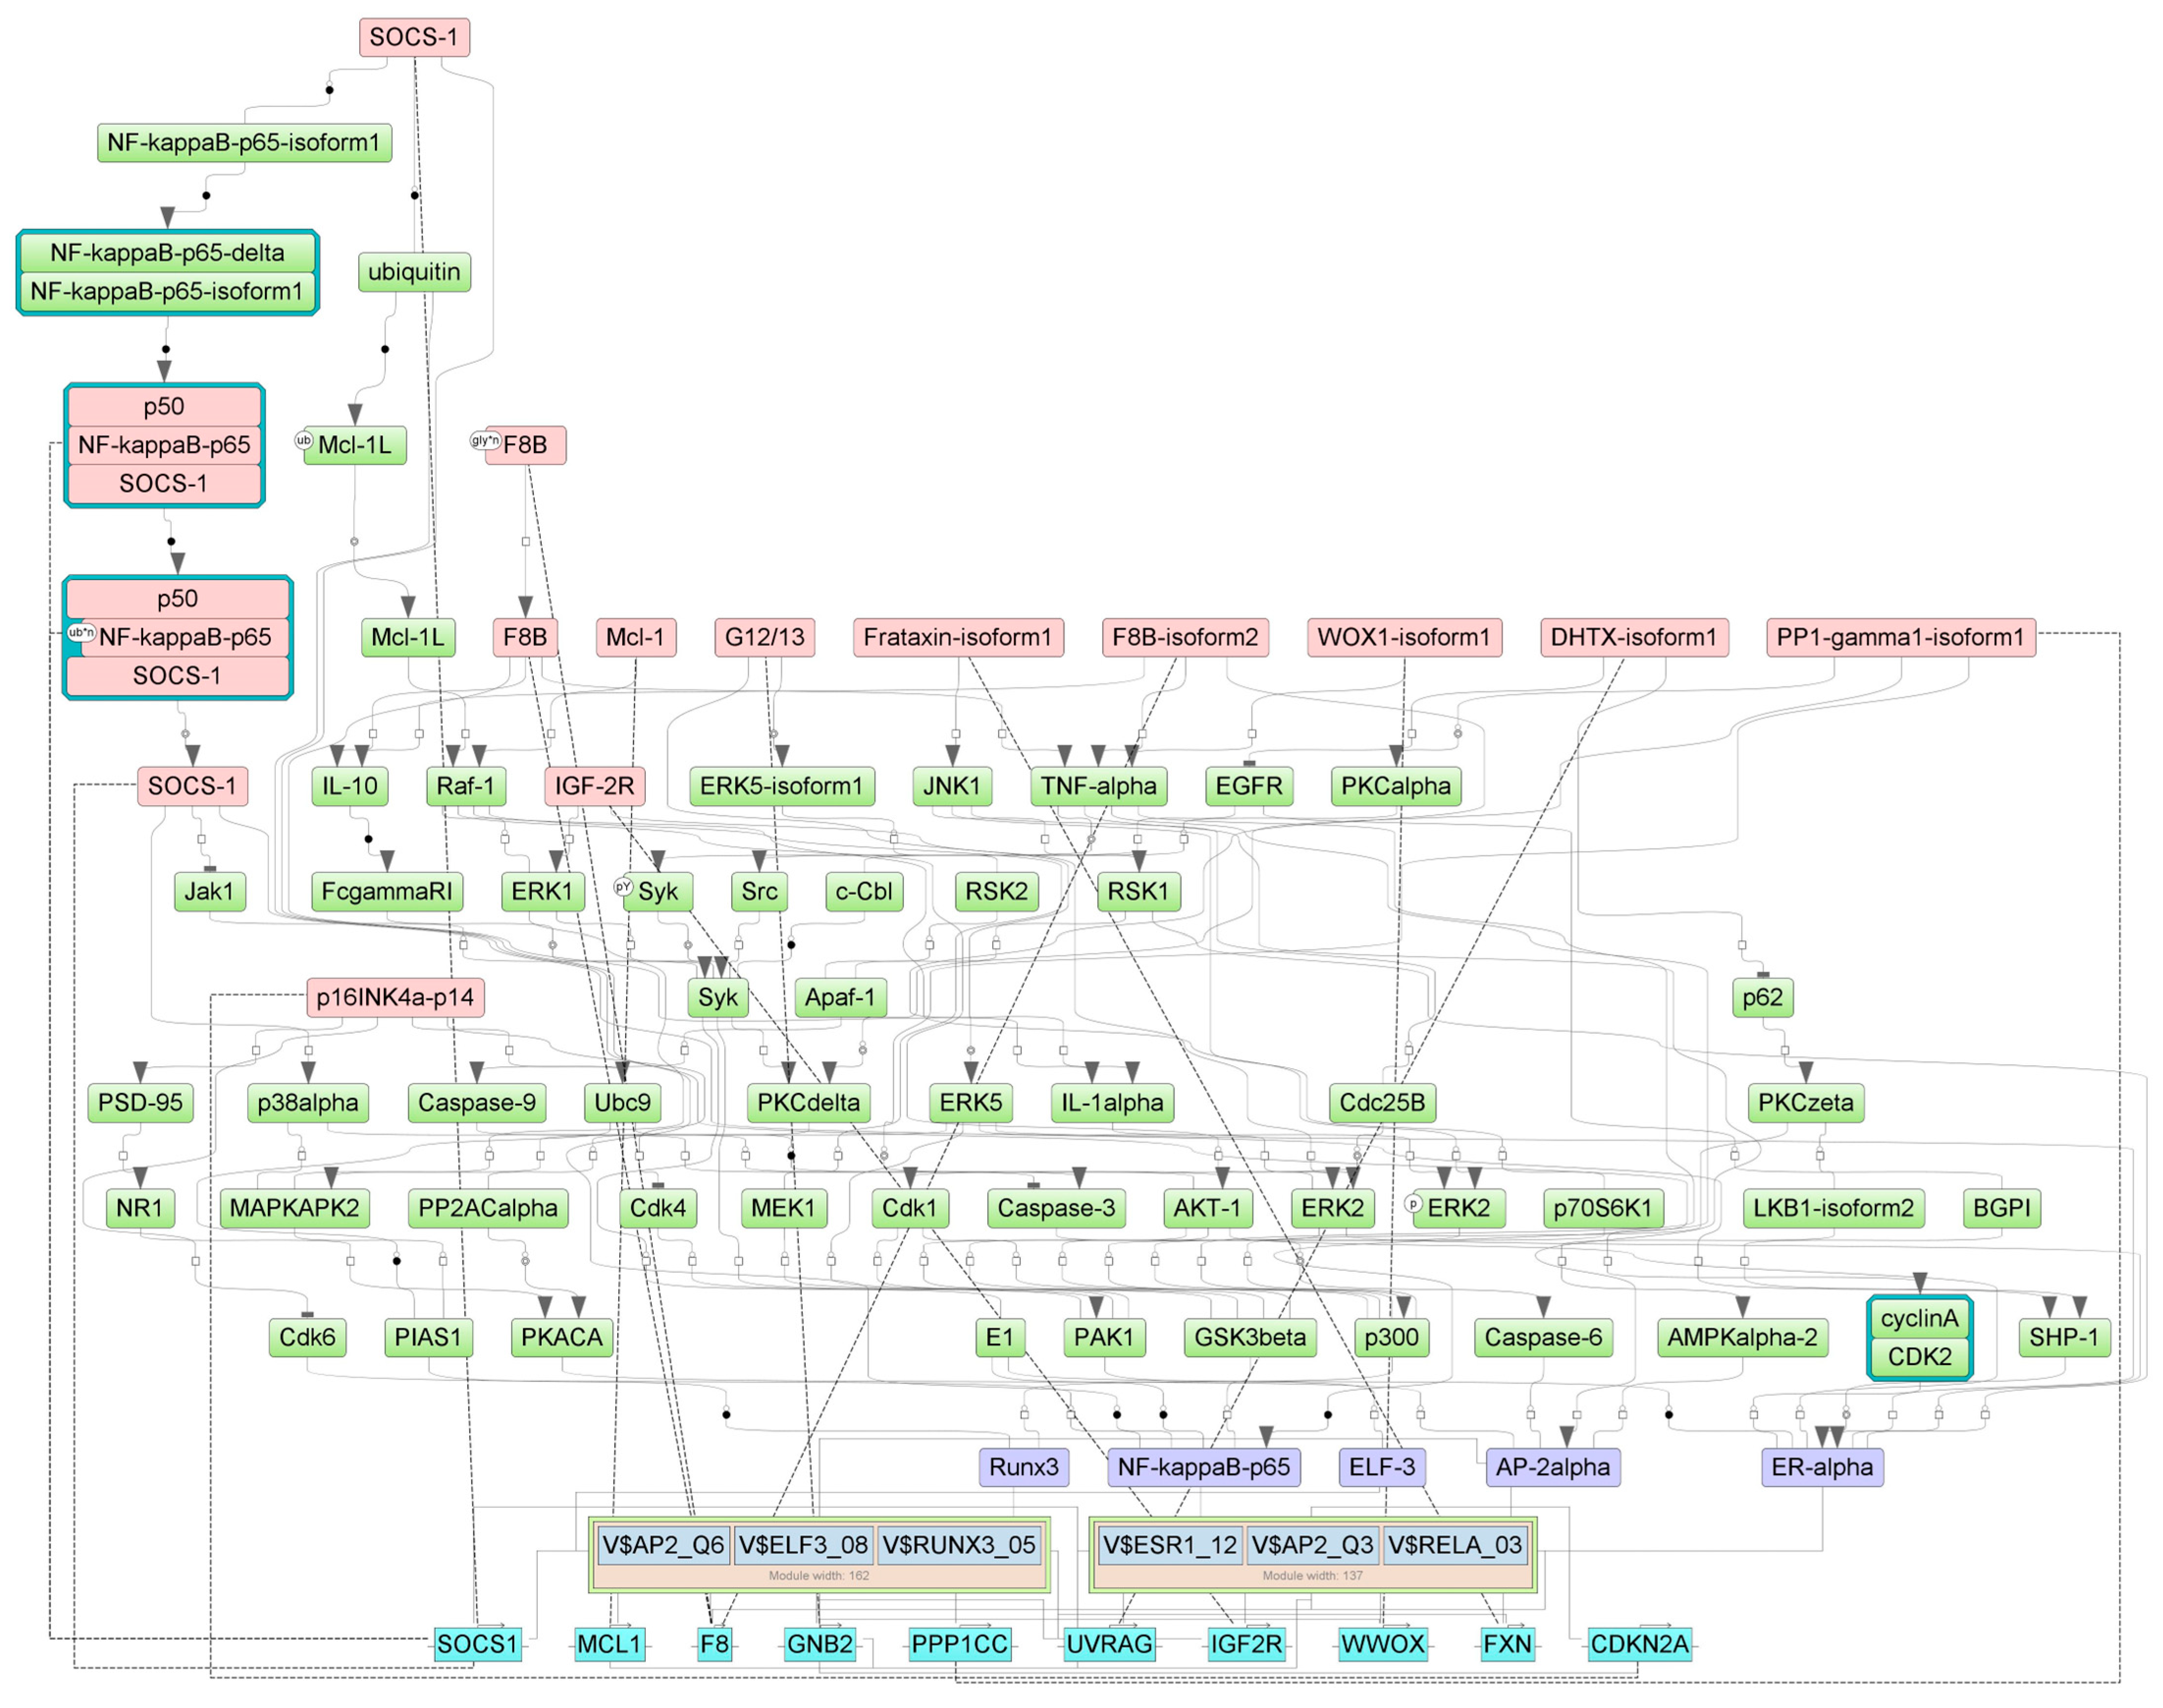
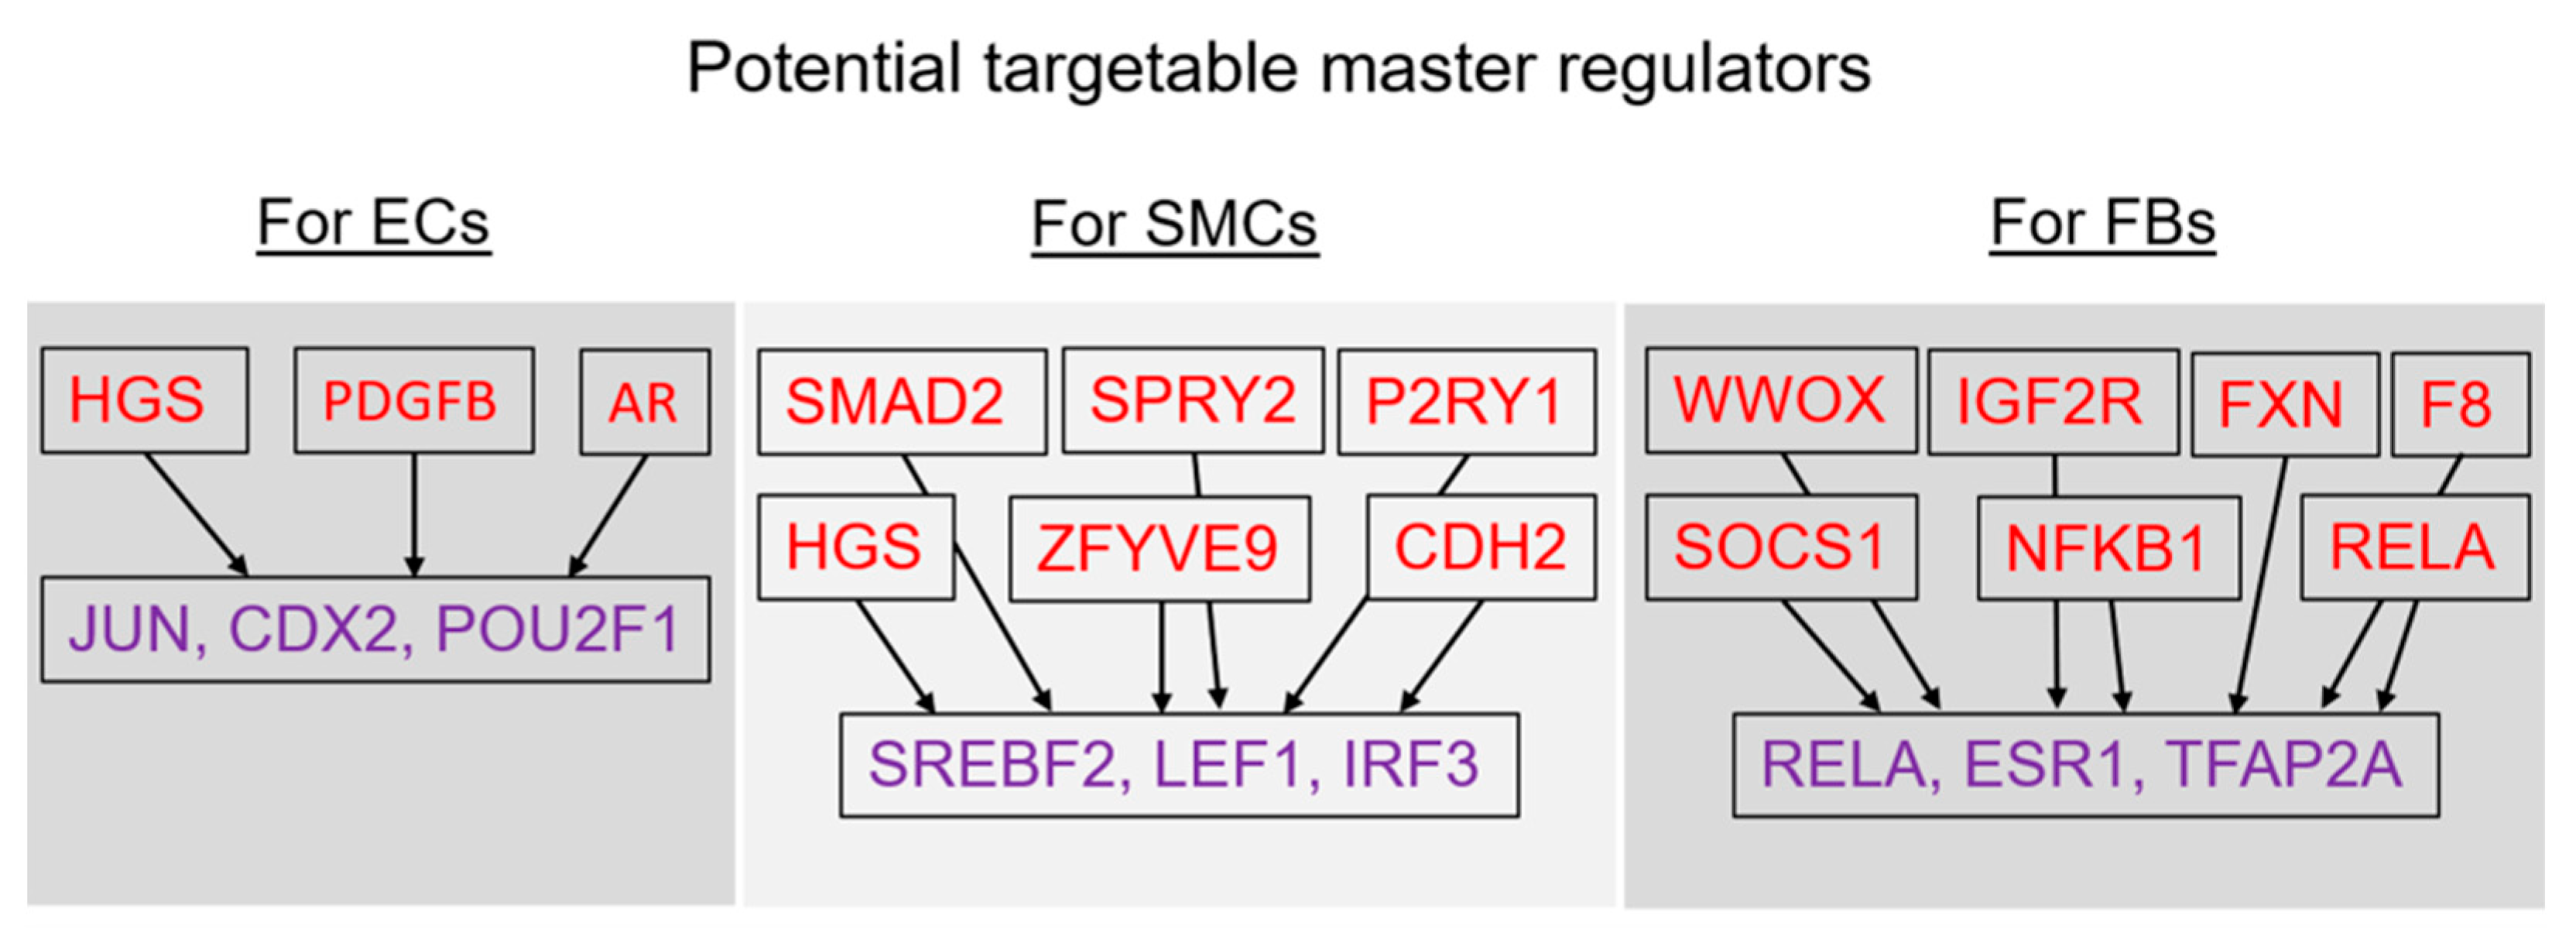
2.4. Finding Master Regulators in Networks

In the second step of the upstream analysis, common regulators of the revealed TFs were identified. We considered master regulators to be the keynodes with positive feedback loops; master regulator protein controls the activity of TFs which, in turn, activate the gene encoding the master regulator protein. The sorting of master regulators is conducted by total rank. The total rank is a kind of average rank that takes into account both whether this keynode is at the top of the regulatory pyramid (keynode score) and to what degree the gene encoding this keynode is regulated by predicted TFs (CMA score), as well as whether or not this gene contains a hypomethylation or hypermethylation site (epigenomics data). These master regulators appear to be the key candidates for therapeutic targets, as they have a master effect on the regulation of the intracellular pathways that activate the pathological processes which are the focal points of our study. The identified master regulators may be seen in Table 5, where the top 10 master molecules for ECs, SMCs, and FBs, correspondingly, are shown. Full lists of the master molecules for each type of cells may be seen in Supplementary Tables S13–S15.
The intracellular regulatory pathways controlled by the aforementioned master regulators are depicted in Figure 8, Figure 9 and Figure 10, where positive feedback is represented by dotted lines. This diagram displays the connections between the identified TFs that play important roles in the regulation of genes near the differentially methylated sites and the selected master regulators that are responsible for the regulation of these TFs.
For ECs, master regulators HGS and PDGFB are involved in the platelet-derived growth factor receptor signaling pathway; AR and PDGFB are involved in epithelial cell development and regulation of systemic arterial blood pressure; and AR, HGS, and PDGFB are involved in the regulation of protein phosphorylation and cellular protein metabolic process (according to GO processes presented in Supplementary Table S4). Furthermore, the key pathways for master regulators in ECs are: the AR pathway; the IGF-1 pathway; MKK4 ---JNK1---/AR; PDGF A, PDGF B ---> AKT; PDGF B ---> STATs; PDGF B---/Ras; and the PDGF pathway (according to the pathway categories presented in Supplementary Table S7).
For SMCs, master regulators CDH2, HGS, and SPRY2 are involved in such key processes as regulation of the nitrogen compound metabolic process, regulation of cell population proliferation, and blood vessel morphogenesis. CDH2, HGS, P2RY1, and SPRY2 are involved in regulation of cellular metabolic process, negative regulation of cell communication, and phosphorylation. HGS and SPRY2 are involved in negative regulation of the ERBB signaling pathway, regulation of protein kinase activity, and regulation of the epidermal growth factor receptor signaling pathway. CDH2 and P2RY1 are involved in regulation of the synaptic vesicle cycle and neurogenesis. HGS, P2RY1, and SPRY2 are involved in positive regulation of gene expression; HGS and P2RY1 are involved in export from the cell and secretion by the cell (according to GO processes presented in Supplementary Table S5). The key pathways for the master regulators in SMCs are: Spry2 ---> ErbB1; EGF pathway; activin A ---> Smad3; activin A ---> Smad2; TGFbeta pathway; and N-cadherin ---Eplin---> actin; N-cadherin network (according to the pathway categories presented in Supplementary Table S8).
For FBs, the master regulators WWOX, F8, and FXN are involved in oxidation–reduction processes; FXN and WWOX are involved in regulation of the apoptotic signaling pathway (according to GO processes presented in Supplementary Table S6). The key pathways for master regulators in FBs are: Src ---/p73beta; ErbB4 mediated signaling; p73 pathway; IL-5 pathway; and SOCS-1 ---/STAT5; IL-2—STAT5 pathway (according to the pathway categories presented in Supplementary Table S9).
The Tables with master regulator molecules that have been converted into genes are Supplementary Tables S16–S18 for ECs, SMCs, and FBs, correspondingly. After we performed intersection of those three tables, we found that the first two cell types shared one potential master molecule {HRS(h),HRS(h){pY334},HRS(h){pY},HRS-isoform1(h),HRS-isoform2(h),HRS:PtdIns(3)P:SARA:SMAD2,HRS:PtdIns(3)P:SARA:SMAD3} that corresponded to potential master regulators HGS, SMAD2, SMAD3, and ZFYVE9 (see the Venn diagram in the Figure 11). The second two cell types—SMCs and FBs—representing the middle and outer layers of the venous wall, correspondingly, also shared one potential master molecule {ZNRF1(h),ZNRF1-isoform1(h),ZNRF1-isoform2(h} that corresponded to the potential master regulator ZNRF1. In addition, ZNRF1 was in the fourth place (according to the DiffScore = −30.56, p-value < 0.001) among the genes hypomethylated in SMCs upon our treatment, and this gene was also hypomethylated in FBs, albeit to a lesser extent (DiffScore = −22.02).
For the final summary, Genome Enhancer software chose the potential master regulators that were the most interesting and promising in terms of druggability. These master regulators control the activity of certain TFs regulating the genes near differentially methylated sites. Thus, the most targetable master regulators appeared to be the following: (1) HGS, PDGFB, and AR (corresponding to the master molecules {HRS}, {PDGFB}, and {AR-isoform1}), which control the activity of transcription factors JUN, CDX2, and POU2F1 for endothelial cells; (2) HGS, CDH2, SPRY2, SMAD2, ZFYVE9, and P2RY1 (corresponding to the master molecules {HRS}, {N-cadherin}, {Sprouty2}, {HRS:PtdIns(3)P:SARA:SMAD2}, and {P2Y1}), which control the activity of transcription factors SREBF2, LEF1, and IRF3 for smooth muscle cells; and (3) WWOX, F8, IGF2R, NFKB1, RELA, SOCS1, and FXN (corresponding to the master molecules {WOX1}, {F8B}, {IGF-2R}, {p50:NF-kappaB-p65:SOCS-1}, {FXN}, and {SOCS-1}), which control the activity of transcription factors RELA, ESR1, and TFAP2A for fibroblasts (see Figure 12).

3. Discussion

This study is the first attempt, to the best of our knowledge, to assess the changes to methylation profiles in the cells representing the corresponding layers of the vein wall in response to oscillatory shear stress, which somehow reflects the events happening in incompetent veins (VVs). Such an effort to resolve the heterogeneity of cell composition of the vein as an organ may deliver new insights into the mechanism of VV pathogenesis. Our 2D experimental model may not have been 100 percent realistic, but it definitely covered some aspects of the pathological condition. It is worth mentioning that our experimental design, which utilized oscillatory shear stress, partially represented proatherogenic conditions that are characterized by low-magnitude and oscillatory shear stress [1].
The cellular monolayer lining the tunica intima is normally subjected to biomechanical stimuli resulting from shear stress and from strain due to stretching of the vein wall. Shear stress has been implicated in altering the structure and functional properties of ECs at the cellular and molecular levels, with profound effects on physiology [23]. The vascular endothelium in vivo acts as a signal transduction interface for hemodynamic forces which determine the cytoskeletal organization, shape, and function of ECs, allowing the vessels to cope with physiological or pathological conditions [24]. This must be true for conditions in vitro. Interestingly, in response to shear stress, ECs increase NO production leading to an enhancement of the shear stress response of leukocytes [25]. On the other hand, we cannot exclude the outside-in hypothesis, according to which the tunica adventitia may be a sensor of vascular wall disruption and dysfunction, as well as an early responder and activator of the blood vessels’ response to injury [26]. The tunica media is in between, and must react and adjust to all possible effects from the inside and outside of the vein wall.
In this work, we have shown that the exposure of the venous endothelium to oscillatory shear stress not only resulted in epigenome-wide changes within this layer, but exerted even more prominent changes in the neighboring layers of the vein wall. Moreover, we observed different ratios of hypo- to hypermethylated genes, which may reflect possible changes caused by oscillatory shear stress in the overall transcription processes within the corresponding cell type of the vein layer: quenching for ECs (0.89 < 1), considerable quenching for SMCs (0.26 << 1), and activation for FBs (1.69 > 1). In turn, this may overlap with morphological changes during the varicose transformation of the venous wall, when endothelial dysfunction, impairment of the functional smooth muscle layer, and accrescence of adventitia are often observed. It is amazing how an impact of oscillatory shear stress on the inner layer alone is capable to launch much bigger changes in the adjacent layers of the vessel.
In the current work, we were limited by the methylation studies, but a combination of DNA methylation with gene expression could provide much more information about the molecular mechanisms involved. Herein, we used 27 K CpG arrays that represented only a fraction of the CpG positions in the genome (located near gene bodies and covering mainly predominately invariant methylation regions) that can become methylated and potentially affect gene regulation; thus, other regions not covered by these arrays were not included in our analysis. Despite this, we were able to discover a number of differentially methylated CpGs mapped to the genes whose functions were linked to the transformative changes that occurred in the vein wall (Figure 6). In addition, in our study, we conducted an analysis of the individual DMSs (differentially methylated sites) located in various genes, but we did not analyze DMRs (differentially methylated regions) that could potentially provide additional information about epigenetic changes in the genome and draw attention to some specific genes, though DMRs usually have nothing to do with gene regulation.
Conventional approaches of statistical “OMICs” data analysis provide only very limited information about the causes of the observed phenomena, and, therefore, contribute little to the understanding the pathological molecular mechanism. In contrast, the “upstream analysis” method [11,12,13,14] applied herein is designed to provide a casual interpretation of the data obtained for a pathology state. This approach comprises two major steps: (1) analyzing promoters and enhancers of differentially expressed genes for the transcription factors (TFs) involved in their regulation and, thus, important for the process under study; (2) reconstructing the signaling pathways that activate these TFs and identifying master regulators at the top of such pathways. For the first step, the database TRANSFAC® [27] is employed together with the TF binding site identification algorithms Match [28] and CMA [21], so that pipeline discovers TFs that regulate genes’ activities in a pathological state. The activities of these TFs are controlled by so-called master regulators, which are identified in the second step of analysis. The second step involves the signal transduction database TRANSPATH® [22] and special graph search algorithms [29] implemented in the “Genome Enhancer” software. After a subsequent druggability checkup, the most promising master regulators are chosen as potential drug targets for the analyzed pathology.
In the present work, we have revealed the master regulators that control the activity of certain TFs regulating genes near the differentially methylated sites for ECs, SMCs, and FBs, which represent the three layers of the venous wall. Herein, we will discuss only those potential master regulators which are the most promising in terms of druggability [30].
JUN, CDX2, and POU2F1 have been revealed as the key transcription factors predicted to potentially regulate genes near differentially methylated sites in our experiment for ECs exposed to oscillatory shear stress. JUN (Jun proto-oncogene, AP-1 transcription factor subunit) is a member of the Jun family of proteins, which are primary components of the activating protein transcription factor [31]. It is inducible by hypoxia related to endothelial cell barrier dysfunction [32]. CDX2 (caudal-type homeobox-2) is a member of the caudal-related homeobox transcription factor gene family. Aberrant expression of the CDX2 gene is associated with intestinal inflammation [33]. Researchers hypothesize that it is related to the reconstruction of the blood vessels [34]. POU2F1 (POU class 2 homeobox 1) is shown as a transcription factor regulated by DNA damage [35] and as a transcriptional repressor for genes expressed in ECs [36]. The POU2F1 gene may play an important role in the development of primary VVs [37], as well as generally, in the condition of the vascular system [38].
The most obvious master regulators of the aforementioned TFs were HGS, PDGFB, and AR. HGS (hepatocyte growth factor-regulated tyrosine kinase substrate) is involved in tight junction protein trafficking and ECs permeability [39]. HGS is necessary for maintaining cerebrovascular stability [40]. PDGFB (platelet-derived growth factor subunit B) is expressed at a very low level in healthy vessels [41]. It contributes to the migration and proliferation of SMCs [42] and plays a role in cell growth, apoptosis, and actin reorganization [41]. It is believed that platelet-derived growth factor is necessary for tunica intima growth and to prevent regression of its thickening [43]. Platelet-derived growth factors are involved in tissue homeostasis regulation due to control of the interstitial fluid pressure [44]. ARs (androgen receptors) play a role in vascular calcification [45], vascular SMC migration [46], endothelial dysfunction [47,48], and induction of vascular SMC apoptosis [49]. In veins from organ donor extraction (from patients without VVs) ARs were located in the adventitia. The redistribution of ARs through the venous wall was observed in VV conditions, and as a result, AR-positive cells were found in the neointima [50].
SREBF2, LEF1, and IRF3 have been revealed as the key transcription factors predicted to potentially regulate genes near differentially methylated sites in our experiment with SMCs treated with culture media from ECs ± exposed to oscillatory shear stress. In vascular endothelial cells, SREBF2 (sterol regulatory element binding transcription factor 2) is activated by sterol loss [51] and oscillatory shear stress [52]. It also promotes TGF-β1-induced cell movement [53]. LEF1 (lymphoid enhancer binding factor 1) plays an important role in embryogenesis and tumorigenicity [54]. LEF1 suppresses the expression of epithelial/endothelial–mesenchymal transition-relevant genes, which contributes to the malignancy of colonic adenocarcinomas [55]. IRF3 (interferon regulatory factor 3) is member of a family of transcription factors for genes associated with innate and adaptive immune responses [56]. In response to low shear stress, IRF3 is activated, which leads to endothelial inflammation [57].
For SMCs, the most obvious master regulators of the TF identified were HGS, CDH2, SPRY2, SMAD2, ZFYVE9, and P2RY1. CDH2 (cadherin 2) is essential for vascular SMC survival [58]. Inhibition of CDH2 function retards SMC migration and the promotion of ECs survival [59]. Blockade of SPRY2 (sprouty RTK signaling antagonist 2) (together with blockade of Dll4) leads to augmentation of the expression of venous markers in arteries [60]. SPRY2 is upregulated in response to fibroblast growth factor 2 in primary dermal ECs [61]. SMAD2 (SMAD family member 2) mediates the signal of the transforming growth factor beta, which allows for the regulation of cell proliferation, apoptosis, and differentiation. Low fluid shear stress activates SMAD2, leading to inward remodeling in atherosclerotic vessels [62]. ZFYVE9 (zinc finger FYVE-type containing 9) participates in the transforming growth factor beta signaling pathway. ZFYVE9 recruits the aforementioned master regulator SMAD2 to the transforming growth factor beta receptor complex by controlling its subcellular localization [63]. P2RY1 (purinergic receptor P2Y1) functions as a receptor for extracellular ATP and ADP. The expression of the P2Y1 in vascular ECs has also been shown [64]. It has previously been demonstrated that P2Y1 mediates ADP stimulation of MAPK pathways and ECs migration [65].
RELA, ESR1, and TFAP2A have been revealed as the key transcription factors predicted to potentially regulate genes near differentially methylated sites in our experiment with FBs exposed to culture media from pretreated SMCs. RELA (RELA proto-oncogene, NF-kB subunit) is a member of the NF-kB family [66]. The NF-kB pathway can be activated by different stimuli, including cytokines, oncogenes, oxidative stress, and DNA damage [67,68]. RELA inhibition led to the inactivation of proinflammatory molecules [69]. ESR1 (estrogen receptor 1) gene expression in the VVs of women around menopause noticeably increases. ESR1 is present in the endothelium, SMCs, and some adventitial cells in the femoral veins [70]. TFAP2A (transcription factor AP-2 alpha) is expressed in the neural tube, neural crest, facial prominences, and limb bud mesenchyme throughout embryogenesis [71]. In ECs, TFAP2A plays a role in cell proliferation [72].
For FBs, the most obvious master regulators of the TF identified were WWOX, F8, IGF2R, NFKB1, RELA, SOCS1, and FXN. WWOX (WW domain containing oxidoreductase) is involved in cell proliferation, differentiation, and metabolism [73]. Mutations in the WWOX gene cause neurodevelopmental and brain degenerative disorders [74]. F8 (coagulation factor VIII) participates in the intrinsic pathway of blood coagulation. Defects in this gene result in hemophilia A, a common recessive X-linked coagulation disorder [75]. Activation of cardiac IGF2R (insulin like growth factor 2 receptor) results in cardiomyocyte hypertrophy, cardiomyocyte proliferation, binucleation, or apoptosis [76]. NFKB1 (nuclear factor kappa B subunit 1) gene mutants affect the expression of mitochondrial morphology-related proteins, leading to excessive mitochondrial fission [77]. SOCS1 (suppressor of cytokine signaling 1) is a member of the STAT-induced STAT inhibitor. A decrease in SOCS1 promotes immune activation of SMCs [78]. FXN (frataxin) is a mitochondrial protein [79] expressed mainly in tissues with high metabolic rates (e.g., heart and brown fat) [80].
After three tables showing the most promising master regulators for each cell type (Tables S16–S18, where all master molecules were converted into genes) were intersected, it was revealed that ECs and SMCs share such potential master regulators as HGS, SMAD2, SMAD3, and ZFYVE9, and SMCs and FBs share a potential master regulator—ZNRF1. It is known that rs17684886 in ZNRF1 is associated with diabetic retinopathy [81], and its expression is induced in peripheral nerves after injury [82], so its overexpression causes neurite-like elongation. It has been found that expression of the SMAD2 protein is progressively increased in reactive lesions and oral submucous fibrosis (OSMF) [83], and SMAD3 contributes to ascending aortic dilatation independently of transforming growth factor-beta in bicuspid and unicuspid aortic valve disease [84], which is consistent with our data.
A meta-analysis of epigenome-wide association studies in trauma-exposed cohorts revealed the association of the HGS differential methylation in whole blood-derived DNA with post-traumatic stress disorder [85]. Recently, a novel physiological role of endogenous HGS—a key component of the endosomal sorting complex required for transport (ESCRT)—has been explored in the vascular system. It was discovered that in mice, knockout of this gene in brain ECs led to impaired endothelial apicobasal polarity and brain vessel collapse; thus, the product of this gene was essential for vascular endothelial (VE)-cadherin recycling to the plasma membrane, pointing to a crucial function of HGS in the maintenance of endothelial cell polarity and cerebrovascular stability [40]. All of these studies appear to be supportive of the data analyzed in this study.

4. Materials and Methods

4.1. Sample Preparation and Cell Culture Experiments

Non-varicose great saphenous vein segments (adjacent to varicose vein segments) left after surgeries on 3 patients with VVs (C2-C3 CEAP [86] clinical classes) were immediately placed in cell culture media and transported to the laboratory for the subsequent production of primary cell cultures. Mechanically crushed fragments of the vein segments were treated with a solution of type II collagenase. A growth medium was added to the obtained suspensions of pieces and cells and centrifuged for 5 min at 300× g; then, the supernatant was taken and the sediment was resuspended in the medium for endothelial growth before being seeded on adhesive plates coated with type IV collagen. Pieces with cells (in the medium, but not covered with it, to prevent floating) were cultured under conditions of 5% CO2, 37 °C. When there was a sufficient density of cells that had grown from the pieces (in reality, this was a mixture of endothelial cells, smooth muscle cells, and fibroblasts), they were removed from the plastic with a TrypLE Express solution (Life Technologies, Carlsbad, CA, USA) and sorted by magnetic immunosorting using a CD31 MicroBead Kit (Miltenyi Biotec) according to the manufacturer’s instructions. CD31+ endothelial cells were seeded in endothelial growth medium (EGM-2 Endothelial Medium, Lonza, Basel, Switzerland), CD31− cells were seeded in the growth media for SMCs and FBs (SmGM-2 Smooth Muscle/FGM-2 Fibroblast BulletKits, Lonza), respectively, on adhesive plates coated with type IV collagen (primary cell cultures are illustrated in Supplementary Figure S5). The endothelial cells grew much more slowly compared to SMCs and FBs.
ECs were either exposed to oscillatory shear stress for 1 day (using a Multitron Cell shaker-incubator (INFORS HT) at 37 °C and 5% CO2, with platform oscillation only in the plane along the XY axis) or left in static conditions (37 °C and 5% CO2). Then, SMCs were treated for 1 day with preconditioned media from ECs, and FBs were subsequently treated for 1 day with preconditioned media from SMCs. Each experimental condition was performed in triplicate. After every exposure, the cells were harvested and subjected to DNA isolation using TRIzol Reagent (Life Technologies, Carlsbad, CA, USA). The experiment design is schematically shown in Supplementary Figure S6. DNA from all samples was further processed according to the manufacturer’s instructions (Illumina, Inc., San Diego, CA, USA), and then taken for methylation microarray analysis.

4.2. Epigenome-Wide DNA Methylation Analysis

DNA methylation microarray analysis was carried out according to the standard Illumina protocol. A total of 1 μg of gDNA was bisulfite converted using a EZ DNA Methylation™ Kit (Zymo Research, Irvine, CA, USA) according to the manufacturer’s protocol. After that, for genome-wide screening of methylation events, we used Infinium HumanMethylation27 BeadChips (Illumina), which cover 27,578 CpG sites spanning 14,495 genes per sample. Arrays were scanned on the Illumina iScan. Overall chip performance and the quality of the raw data were checked using Illumina GenomeStudio (methylation module) software in accordance with the manufacturer’s instructions (GenomeStudio Methylation Module v1.8 User Guide [87]). The raw intensity data were quantile-normalized. The methylation level of each CpG locus was calculated as methylation beta-value (β = intensity of the methylated allele (M)/(intensity of the unmethylated allele (U) + intensity of the methylated allele (M) + 100). Differential methylation (hypo- or hypermethylation) of the CpG sites was determined based on a DiffScore cut-off of ±13. DiffScore is the measure of the likelihood of variability between the compared groups. It is directly derived from the p-value, for which it provides methylation change directionality. It is a log10 transformation of the p-value and provides the p-value with scale and direction: p-value = [10^(DiffScore/10)] for hypomethylated genes, and [10^(−DiffScore/10)] for hypermethylated genes. The higher (or lower) the DiffScore is, the more likely it is that a change in methylation has taken place. Statistically significant values were determined (p-value < 0.05 that corresponds to |DiffScore| > 13): DiffScore < 0 corresponds to hypomethylated genes; DiffScore > 0 corresponds to hypermethylated genes. Differentially methylated (DM) sites were associated with genes using the Custom Model of the Illumina GenomeStudio. Then, the software package “Genome Enhancer” from the geneXplain platform was applied to a data set analyzed with GenomeStudio and Microsoft Excel. A cluster heatmap analysis was performed within the geneXplain platform.

4.3. Advanced Bioinformatics Analyses

Transcription factor binding sites (TFBS) in promoters and enhancers of genes near differentially methylated sites were analyzed using known DNA-binding motifs described in the TRANSFAC® library, release 2022.2 (geneXplain GmbH, Wolfenbüttel, Germany) (https://genexplain.com/transfac (accessed on 22 December 2022)). The motifs were specified using position weight matrices (PWMs), which gave weights to each nucleotide in each position of the DNA-binding motif for a TF or a group of them.
We searched for TFBS that were enriched in the promoters and enhancers under study as compared to a background sequence set, such as promoters of genes that were not differentially regulated under the conditions of the experiment. We denoted study and background sets briefly as Yes and No sets. In the current work, we used a workflow considering promoter sequences of a standard length of 1100 bp (−1000 to +100). The error rate in this section of the pipeline was controlled by estimating the adjusted p-value (using the Benjamini–Hochberg procedure) in comparison to the TFBS frequency found in randomly selected regions of the human genome (adjusted p-value < 0.01).
We applied the CMA (Composite Module Analyst) algorithm for the purpose of searching for composite modules [28] in the promoters and enhancers of the Yes and No sets. We searched for a composite module consisting of a cluster of 10 TFs in a sliding window of 200–300 bp that statistically significantly separated sequences in the Yes and No sets (minimizing the Wilcoxon p-value).
Then, we searched for master regulator molecules in signal transduction pathways upstream of the identified TFs. The master regulator search used the TRANSPATH® database (BIOBASE), release 2022.2 (geneXplain GmbH, Wolfenbüttel, Germany) (https://genexplain.com/transpath (accessed on December 2022)). A comprehensive signal transduction network of human cells was built by the software on the basis of reactions annotated in TRANSPATH®. All signal transduction reactions from TRANSPATH® (including ligand binding reactions, phosphorylation and dephosphorylation reactions, complex formation reactions, ubiquitination, and other reactions known from the scientific literature) were considered as a weighted and directed graph. The main algorithm of the master regulator search has been described in earlier works [13,14]. The goal of the algorithm was to find nodes in the global signal transduction network that may potentially regulate the activity of a set of TFs found at the previous step of the analysis. Such nodes are considered as most promising drug targets, since any influence on such a node may switch the transcriptional programs of hundreds of genes that are regulated by their respective TFs. In our analysis, we ran the algorithm with a maximum radius of 12 steps upstream of each TF in the input set. The error rate of this algorithm is controlled by applying it 10,000 times to randomly generated sets of input transcription factors of the same set size. Then Z-score and FDR (false discovery rate) value of ranks were calculated for each potential master regulator node on the basis of such random runs (see detailed description in [22]). The error rate was controlled by an FDR threshold of 0.05.

5. Conclusions

The present in vitro study on methylation profiling identified epigenome-wide changes in the cells that represent the corresponding layers of the vein wall in response to oscillatory shear stress towards the endothelium. These epigenomic changes may be implicated in creating altered phenotypes of those cells, which reflects the morphological changes observed in incompetent veins (VVs). The master regulators that control the activity of key TFs regulating the genes near the differentially methylated sites were revealed for ECs, SMCs, and FBs. Due to the discovery of novel therapeutic targets, the future development of treatment strategies may eventually improve the quality of life of patients suffering from vascular diseases.

Supplementary Materials

The following supporting information can be downloaded at: https://www.mdpi.com/article/10.3390/epigenomes7010008/s1, Figure S1: Cluster heatmap depicting methylation levels of the top 20 genes among those significantly hypo- and hypermethylated in 3 cell types (combined) upon the exposure; Figure S2: Enriched TRANSPATH® Pathways (2022.2) of genes near differentially methylated sites in ECs; Figure S3: Enriched TRANSPATH® Pathways (2022.2) of genes near differentially methylated sites in SMCs; Figure S4: Enriched TRANSPATH® Pathways (2022.2) of genes near differentially methylated sites in FBs; Figure S5: Cell culture examples; Figure S6: Experiment design; Table S1: DiffMethylated genes_FDR_DiffScore 13_ECs; Table S2: DiffMethylated genes_FDR_DiffScore 13_SMCs; Table S3: DiffMethylated genes_FDR_DiffScore 13_FBs; Table S4: GO (biological process)_ECs; Table S5: GO (biological process)_SMCs; Table S6: GO (biological process)_FBs; Table S7: TRANSPATH Pathways (2022.2)_ECs; Table S8: TRANSPATH Pathways (2022.2)_SMCs; Table S9: TRANSPATH Pathways (2022.2)_FBs; Table S10: Transcription factor proteins annotated_ECs; Table S11: Transcription factor proteins annotated_SMCs; Table S12: Transcription factor proteins annotated_FBs; Table S13: Keynodes for best model annotated ranked_Master regulators_ECs; Table S14: Keynodes for best model annotated ranked_Master regulators_SMCs; Table S15: Keynodes for best model annotated ranked_Master regulators_FBs; Table S16: Feedback Controlled Master Regulators_ECs; Table S17: Feedback Controlled Master Regulators_SMCs; Table S18: Feedback Controlled Master Regulators_FBs.

Author Contributions

Conceptualization, M.A.S. and M.L.F.; methodology, M.A.S. and M.L.F.; software, A.E.K.; formal analysis, M.A.S., A.E.K. and V.A.K.; investigation, M.A.S.; resources, K.S.S., K.A.G., A.I.S. and M.L.F.; data curation, M.A.S.; writing—original draft preparation, M.A.S. and V.A.K.; writing—review and editing, M.A.S.; visualization, M.A.S. and V.A.K.; supervision, M.A.S.; project administration, M.A.S.; funding acquisition, M.A.S. All authors have read and agreed to the published version of the manuscript.

Funding

This research was funded by the Russian Science Foundation, grant number 22-25-00832.

Institutional Review Board Statement

The study was conducted in accordance with the Declaration of Helsinki, and approved by the Ethics Committee of the Institute of Chemical Biology and Fundamental Medicine (protocol No.03, 6 October 2019).

Informed Consent Statement

Informed consent was obtained from all subjects involved in the study.

Data Availability Statement

Data are contained within the article and Supplementary Materials.

Acknowledgments

We gratefully thank Irina Zakharova and Alexander Shevchenko for the helpful advice and technical support on cell culture experiments, and fruitful discussions.

Conflicts of Interest

The authors declare no conflict of interest. The funders had no role in the design of the study; in the collection, analyses, or interpretation of data; in the writing of the manuscript; or in the decision to publish the results.

References

  1. Jackson, M.L.; Bond, A.R.; George, S.J. Mechanobiology of the endothelium in vascular health and disease: In vitro shear stress models. Cardiovasc. Drugs Ther. 2022. [Google Scholar] [CrossRef] [PubMed]
  2. Oklu, R.; Habito, R.; Mayr, M.; Deipolyi, A.R.; Albadawi, H.; Hesketh, R.; Walker, T.G.; Linskey, K.R.; Long, C.A.; Wicky, S.; et al. Pathogenesis of varicose veins. J. Vasc. Interv. Radiol. 2012, 23, 33–39. [Google Scholar] [CrossRef]
  3. Kuo, C.T.; Veselits, M.L.; Barton, K.P.; Lu, M.M.; Clendenin, C.; Leiden, J.M. The LKLF transcription factor is required for normal tunica media formation and blood vessel stabilization during murine embryogenesis. Genes Dev. 1997, 11, 2996–3006. [Google Scholar] [CrossRef] [Green Version]
  4. Wasserman, S.M.; Topper, J.N. Adaptation of the endothelium to fluid flow: In vitro analyses of gene expression and in vivo implications. Vasc. Med. 2004, 9, 35–45. [Google Scholar] [CrossRef] [Green Version]
  5. Roux, E.; Bougaran, P.; Dufourcq, P.; Couffinhal, T. Fluid Shear Stress Sensing by the Endothelial Layer. Front. Physiol. 2020, 1, 861. [Google Scholar] [CrossRef]
  6. Urschel, K.; Tauchi, M.; Achenbach, S.; Dietel, B. Investigation of Wall Shear Stress in Cardiovascular Research and in Clinical Practice—From Bench to Bedside. Int. J. Mol. Sci. 2021, 22, 5635. [Google Scholar] [CrossRef]
  7. Dekker, R.J.; van Soest, S.; Fontijn, R.D.; Salamanca, S.; de Groot, P.G.; VanBavel, E.; Pannekoek, H.; Horrevoets, A.J.G. Prolonged fluid shear stress induces a distinct set of endothelial cell genes, most specifically lung Krüppel-like factor (KLF2). Blood 2002, 100, 1689–1698. [Google Scholar] [CrossRef] [PubMed] [Green Version]
  8. Smetanina, M.A.; Kel, A.E.; Sevost’ianova, K.S.; Maiborodin, I.V.; Shevela, A.I.; Zolotukhin, I.A.; Stegmaier, P.; Filipenko, M.L. DNA methylation and gene expression profiling reveal MFAP5 as a regulatory driver of extracellular matrix remodeling in varicose vein disease. Epigenomics 2018, 10, 1103–1119. [Google Scholar] [CrossRef]
  9. Umehara, T. Epidrugs: Toward Understanding and Treating Diverse Diseases. Epigenomes 2022, 6, 18. [Google Scholar] [CrossRef] [PubMed]
  10. Smetanina, M.A.; Shevela, A.I.; Gavrilov, K.A.; Filipenko, M.L. The genetic constituent of varicose vein pathogenesis as a key for future treatment option development. Vessel Plus 2021, 5, 19. [Google Scholar] [CrossRef]
  11. Kel, A.; Voss, N.; Jauregui, R.; Kel-Margoulis, O.; Wingender, E. Beyond microarrays: Finding key transcription factors controlling signal transduction pathways. BMC Bioinform. 2006, 7, S13. [Google Scholar] [CrossRef] [Green Version]
  12. Stegmaier, P.; Voss, N.; Meier, T.; Kel, A.; Wingender, E.; Borlak, J. Advanced Computational Biology Methods Identify Molecular Switches for Malignancy in an EGF Mouse Model of Liver Cancer. PLoS ONE 2011, 6, e17738. [Google Scholar] [CrossRef] [PubMed] [Green Version]
  13. Koschmann, J.; Bhar, A.; Stegmaier, P.; Kel, A.; Wingender, E. “Upstream Analysis”: An Integrated Promoter-Pathway Analysis Approach to Causal Interpretation of Microarray Data. Microarrays 2015, 4, 270–286. [Google Scholar] [CrossRef] [PubMed]
  14. Kel, A.; Stegmaier, P.; Valeev, T.; Koschmann, J.; Poroikov, V.; Kel-Margoulis, O.V.; Wingender, E. Multi-omics “upstream analysis” of regulatory genomic regions helps identifying targets against methotrexate resistance of colon cancer. EuPA Open Proteom. 2016, 13, 1–13. [Google Scholar] [CrossRef] [Green Version]
  15. Volkova, Y.L.; Pickel, C.; Jucht, A.E.; Wenger, R.H.; Scholz, C.C. The Asparagine Hydroxylase FIH: A Unique Oxygen Sensor. Antioxid. Redox Signal. 2022, 37, 913–935. [Google Scholar] [CrossRef] [PubMed]
  16. Kiriakidis, S.; Henze, A.T.; Kruszynska-Ziaja, I.; Skobridis, K.; Theodorou, V.; Paleolog, E.M.; Mazzone, M. Factor-inhibiting HIF-1 (FIH-1) is required for human vascular endothelial cell survival. FASEB J. 2015, 29, 2814–2827. [Google Scholar] [CrossRef]
  17. Tregub, P.P.; Kulikov, V.P.; Malinovskaya, N.A.; Kuzovkov, D.A.; Kovzelev, P.D. HIF-1—Alternative signals pathways of activation and formation of tolerance to hypoxia/ischemia. Patol. Fiziol. Eksp. Ter. 2019, 63, 115–122. (In Russian) [Google Scholar] [CrossRef]
  18. Xue, Y.; Bi, F.; Zhang, X.; Zhang, S.; Pan, Y.; Liu, N.; Shi, Y.; Yao, X.; Zheng, Y.; Fan, D. Role of Rac1 and Cdc42 in hypoxia induced p53 and von Hippel-Lindau suppression and HIF1alpha activation. Int. J. Cancer 2006, 118, 2965–2972. [Google Scholar] [CrossRef] [PubMed]
  19. Burbelo, P.D.; Snow, D.M.; Bahou, W.; Spiegel, S. MSE55, a Cdc42 effector protein, induces long cellular extensions in fibroblasts. Proc. Natl. Acad. Sci. USA 1999, 96, 9083–9088. [Google Scholar] [CrossRef] [PubMed] [Green Version]
  20. Farrugia, A.J.; Calvo, F. The Borg family of Cdc42 effector proteins Cdc42EP1-5. Biochem. Soc. Trans. 2016, 44, 1709–1716. [Google Scholar] [CrossRef] [Green Version]
  21. Waleev, T.; Shtokalo, D.; Konovalova, T.; Voss, N.; Cheremushkin, E.; Stegmaier, P.; Kel-Margoulis, O.; Wingender, E.; Kel, A. Composite Module Analyst: Identification of transcription factor binding site combinations using genetic algorithm. Nucleic Acids Res. 2006, 34, W541–W545. [Google Scholar] [CrossRef] [PubMed]
  22. Krull, M.; Pistor, S.; Voss, N.; Kel, A.; Reuter, I.; Kronenberg, D.; Michael, H.; Schwarzer, K.; Potapov, A.; Choi, C.; et al. TRANSPATH: An information resource for storing and visualizing signaling pathways and their pathological aberrations. Nucleic Acids Res. 2006, 34, D546–D551. [Google Scholar] [CrossRef] [PubMed] [Green Version]
  23. Cheng, M.; Wu, J.; Li, Y.; Nie, Y.; Chen, H. Activation of MAPK participates in low shear stress-induced IL-8 gene expression in endothelial cells. Clin. Biomech. 2008, 23 (Suppl. 1), S96–S103. [Google Scholar] [CrossRef]
  24. Tzima, E.; del Pozo, M.A.; Shattil, S.J.; Chien, S.; Schwartz, M.A. Activation of integrins in endothelial cells by fluid shear stress mediates Rho-dependent cytoskeletal alignment. EMBO J. 2001, 20, 4639–4647. [Google Scholar] [CrossRef] [PubMed] [Green Version]
  25. Fukuda, S.; Yasu, T.; Predescu, D.N.; Schmid-Schönbein, G.W. Mechanisms for Regulation of Fluid Shear Stress Response in Circulating Leukocytes. Circ. Res. 2000, 86, e13–e18. [Google Scholar] [CrossRef] [Green Version]
  26. Tinajero, M.G.; Gotlieb, A.I. Recent Developments in Vascular Adventitial Pathobiology—The Dynamic Adventitia as a Complex Regulator of Vascular Disease. Am. J. Pathol. 2020, 190, 520–534. [Google Scholar] [CrossRef] [PubMed] [Green Version]
  27. Matys, V.; Kel-Margoulis, O.V.; Fricke, E.; Liebich, I.; Land, S.; Barre-Dirrie, A.; Reuter, I.; Chekmenev, D.; Krull, M.; Hornischer, K.; et al. TRANSFAC and its module TRANSCompel: Transcriptional gene regulation in eukaryotes. Nucleic Acids Res. 2006, 34, D108–D110. [Google Scholar] [CrossRef] [PubMed] [Green Version]
  28. Kel, A.E.; Gössling, E.; Reuter, I.; Cheremushkin, E.; Kel-Margoulis, O.V.; Wingender, E. MATCH: A tool for searching transcription factor binding sites in DNA sequences. Nucleic Acids Res. 2003, 31, 3576–3579. [Google Scholar] [CrossRef] [Green Version]
  29. Boyarskikh, U.; Pintus, S.; Mandrik, N.; Stelmashenko, D.; Kiselev, I.; Evshin, I.; Sharipov, R.; Stegmaier, P.; Kolpakov, F.; Filipenko, M.; et al. Computational master-regulator search reveals mTOR and PI3K pathways responsible for low sensitivity of NCI-H292 and A427 lung cancer cell lines to cytotoxic action of p53 activator Nutlin-3. BMC Med. Genom. 2018, 11, 12. [Google Scholar] [CrossRef] [Green Version]
  30. Michael, H.; Hogan, J.; Kel, A.; Kel-Margoulis, O.; Schacherer, F.; Voss, N.; Wingender, E. Building a knowledge base for systems pathology. Brief Bioinform. 2008, 9, 518–531. [Google Scholar] [CrossRef]
  31. Relja, B.; Schwestka, B.; Lee, V.S.; Henrich, D.; Czerny, C.; Borsello, T.; Marzi, I.; Lehnert, M. Inhibition of c-Jun N-terminal kinase after hemorrhage but before resuscitation mitigates hepatic damage and inflammatory response in male rats. Shock 2009, 32, 509–516. [Google Scholar] [CrossRef] [PubMed]
  32. Wu, F.; Wang, J.Y.; Dorman, B.; Zeineddin, A.; Kozar, R.A. c-Jun-mediated miR-19b expression induces endothelial barrier dysfunction in an in vitro model of hemorrhagic shock. Mol. Med. 2022, 28, 123. [Google Scholar] [CrossRef]
  33. Coskun, M.; Troelsen, J.T.; Nielsen, O.H. The role of CDX2 in intestinal homeostasis and inflammation. Biochim. Biophys. Acta 2011, 1812, 283–289. [Google Scholar] [CrossRef] [Green Version]
  34. Dunk, C.; Petkovic, L.; Baczyk, D.; Rossant, J.; Winterhager, E.; Lye, S. A novel in vitro model of trophoblast-mediated decidual blood vessel remodeling. Lab. Investig. 2003, 83, 1821–1828. [Google Scholar] [CrossRef] [Green Version]
  35. Zhao, H.; Jin, S.; Fan, F.; Fan, W.; Tong, T.; Zhan, Q. Activation of the transcription factor Oct-1 in response to DNA damage. Cancer Res. 2000, 60, 6276–6280. [Google Scholar]
  36. Schwachtgen, J.L.; Remacle, J.E.; Janel, N.; Brys, R.; Huylebroeck, D.; Meyer, D.; Kerbiriou-Nabias, D. Oct-1 is involved in the transcriptional repression of the von willebrand factor gene promoter. Blood 1998, 92, 1247–1258. [Google Scholar] [CrossRef]
  37. Jeong, G.A.; Choi, E.T.; Chang, J.H. Octamer-binding transcription factor-1 gene is upregulated in primary varicose veins. Ann. Vasc. Surg. 2008, 22, 115–120. [Google Scholar] [CrossRef]
  38. Thum, T.; Haverich, A.; Borlak, J. Cellular dedifferentiation of endothelium is linked to activation and silencing of certain nuclear transcription factors: Implications for endothelial dysfunction and vascular biology. FASEB J. 2000, 14, 740–751. [Google Scholar] [CrossRef] [Green Version]
  39. Murakami, T.; Felinski, E.A.; Antonetti, D.A. Occludin phosphorylation and ubiquitination regulate tight junction trafficking and vascular endothelial growth factor-induced permeability. J. Biol. Chem. 2009, 284, 21036–21046. [Google Scholar] [CrossRef] [PubMed] [Green Version]
  40. Yu, Z.; Zeng, J.; Wang, J.; Cui, Y.; Song, X.; Zhang, Y.; Cheng, X.; Hou, N.; Teng, Y.; Lan, Y.; et al. Hepatocyte growth factor-regulated tyrosine kinase substrate is essential for endothelial cell polarity and cerebrovascular stability. Cardiovasc. Res. 2021, 117, 533–546. [Google Scholar] [CrossRef] [PubMed] [Green Version]
  41. Heldin, C.H.; Westermark, B. Mechanism of action and in vivo role of platelet-derived growth factor. Physiol. Rev. 1999, 79, 1283–1316. [Google Scholar] [CrossRef] [Green Version]
  42. Ferns, G.A.; Sprugel, K.H.; Seifert, R.A.; Bowen-Pope, D.F.; Kelly, J.D.; Murray, M.; Raines, E.W.; Ross, R. Relative platelet-derived growth factor receptor subunit expression determines cell migration to different dimeric forms of PDGF. Growth Factors 1990, 3, 315–324. [Google Scholar] [CrossRef] [PubMed]
  43. Kenagy, R.D.; Fukai, N.; Min, S.K.; Jalikis, F.; Kohler, T.R.; Clowes, A.W. Proliferative capacity of vein graft smooth muscle cells and fibroblasts in vitro correlates with graft stenosis. J. Vasc. Surg. 2009, 49, 1282–1288. [Google Scholar] [CrossRef] [PubMed] [Green Version]
  44. Rodt, S.A.; Ahlén, K.; Berg, A.; Rubin, K.; Reed, R.K. A novel physiological function for platelet-derived growth factor-BB in rat dermis. J. Physiol. 1996, 495 Pt 1, 193–200. [Google Scholar] [CrossRef] [PubMed] [Green Version]
  45. Zhu, D.; Hadoke, P.W.; Wu, J.; Vesey, A.T.; Lerman, D.A.; Dweck, M.R.; Newby, D.E.; Smith, L.B.; MacRae, V.E. Ablation of the androgen receptor from vascular smooth muscle cells demonstrates a role for testosterone in vascular calcification. Sci. Rep. 2016, 6, 24807. [Google Scholar] [CrossRef] [PubMed] [Green Version]
  46. Chignalia, A.Z.; Schuldt, E.Z.; Camargo, L.L.; Montezano, A.C.; Callera, G.E.; Laurindo, F.R.; Lopes, L.R.; Avellar, M.C.; Carvalho, M.H.; Fortes, Z.B.; et al. Testosterone induces vascular smooth muscle cell migration by NADPH oxidase and c-Src-dependent pathways. Hypertension 2012, 59, 1263–1271. [Google Scholar] [CrossRef] [Green Version]
  47. Akishita, M.; Hashimoto, M.; Ohike, Y.; Ogawa, S.; Iijima, K.; Eto, M.; Ouchi, Y. Low testosterone level is an independent determinant of endothelial dysfunction in men. Hypertens. Res. 2007, 30, 1029–1034. [Google Scholar] [CrossRef] [Green Version]
  48. Rech, C.M.; Clapauch, R.; de Souza, M.; Bouskela, E. Low testosterone levels are associated with endothelial dysfunction in oophorectomized early postmenopausal women. Eur. J. Endocrinol. 2016, 174, 297–306. [Google Scholar] [CrossRef] [Green Version]
  49. Lopes, R.A.; Neves, K.B.; Pestana, C.R.; Queiroz, A.L.; Zanotto, C.Z.; Chignalia, A.Z.; Valim, Y.M.; Silveira, L.R.; Curti, C.; Tostes, R.C. Testosterone induces apoptosis in vascular smooth muscle cells via extrinsic apoptotic pathway with mitochondria-generated reactive oxygen species involvement. Am. J. Physiol. Heart Circ. Physiol. 2014, 306, H1485–H1494. [Google Scholar] [CrossRef] [Green Version]
  50. García-Honduvilla, N.; Asúnsolo, Á.; Ortega, M.A.; Sainz, F.; Leal, J.; Lopez-Hervas, P.; Pascual, G.; Buján, J. Increase and Redistribution of Sex Hormone Receptors in Premenopausal Women Are Associated with Varicose Vein Remodelling. Oxidative Med. Cell. Longev. 2018, 2018, 3974026. [Google Scholar] [CrossRef] [Green Version]
  51. Zeng, L.; Liao, H.; Liu, Y.; Lee, T.S.; Zhu, M.; Wang, X.; Stemerman, M.B.; Zhu, Y.; Shyy, J.Y. Sterol-responsive element-binding protein (SREBP) 2 down-regulates ATP-binding cassette transporter A1 in vascular endothelial cells: A novel role of SREBP in regulating cholesterol metabolism. J. Biol. Chem. 2004, 279, 48801–48807. [Google Scholar] [CrossRef] [Green Version]
  52. Xiao, H.; Lu, M.; Lin, T.Y.; Chen, Z.; Chen, G.; Wang, W.C.; Marin, T.; Shentu, T.P.; Wen, L.; Gongol, B.; et al. Sterol regulatory element binding protein 2 activation of NLRP3 inflammasome in endothelium mediates hemodynamic-induced atherosclerosis susceptibility. Circulation 2013, 128, 632–642. [Google Scholar] [CrossRef] [Green Version]
  53. Wang, Y.; Yang, H.; Su, X.; Cao, A.; Chen, F.; Chen, P.; Yan, F.; Hu, H. SREBP2 promotes the viability, proliferation, and migration and inhibits apoptosis in TGF-β1-induced airway smooth muscle cells by regulating TLR2/NF-κB/NFATc1/ABCA1 regulatory network. Bioengineered 2022, 13, 3137–3147. [Google Scholar] [CrossRef]
  54. Zhao, Y.; Zhu, J.; Shi, B.; Wang, X.; Lu, Q.; Li, C.; Chen, H. The transcription factor LEF1 promotes tumorigenicity and activates the TGF-β signaling pathway in esophageal squamous cell carcinoma. J. Exp. Clin. Cancer Res. 2019, 38, 304. [Google Scholar] [CrossRef] [PubMed]
  55. Xiao, L.; Zhang, C.; Li, X.; Jia, C.; Chen, L.; Yuan, Y.; Gao, Q.; Lu, Z.; Feng, Y.; Zhao, R.; et al. LEF1 Enhances the Progression of Colonic Adenocarcinoma via Remodeling the Cell Motility Associated Structures. Int. J. Mol. Sci. 2021, 22, 10870. [Google Scholar] [CrossRef]
  56. Nguyen, H.; Hiscott, J.; Pitha, P.M. The growing family of interferon regulatory factors. Cytokine Growth Factor Rev. 1997, 8, 293–312. [Google Scholar] [CrossRef] [PubMed]
  57. Zhu, L.; Yang, H.; Chao, Y.; Gu, Y.; Zhang, J.; Wang, F.; Yu, W.; Ye, P.; Chu, P.; Kong, X.; et al. Akt phosphorylation regulated by IKKε in response to low shear stress leads to endothelial inflammation via activating IRF3. Cell Signal. 2021, 80, 109900. [Google Scholar] [CrossRef] [PubMed]
  58. Koutsouki, E.; Beeching, C.A.; Slater, S.C.; Blaschuk, O.W.; Sala-Newby, G.B.; George, S.J. N-cadherin-dependent cell-cell contacts promote human saphenous vein smooth muscle cell survival. Arterioscler. Thromb. Vasc. Biol. 2005, 25, 982–988. [Google Scholar] [CrossRef] [PubMed] [Green Version]
  59. Lyon, C.A.; Koutsouki, E.; Aguilera, C.M.; Blaschuk, O.W.; George, S.J. Inhibition of N-cadherin retards smooth muscle cell migration and intimal thickening via induction of apoptosis. J. Vasc. Surg. 2010, 52, 1301–1309. [Google Scholar] [CrossRef] [Green Version]
  60. Biyashev, D.; Veliceasa, D.; Topczewski, J.; Topczewska, J.M.; Mizgirev, I.; Vinokour, E.; Reddi, A.L.; Licht, J.D.; Revskoy, S.Y.; Volpert, O.V. miR-27b controls venous specification and tip cell fate. Blood 2012, 119, 2679–2687. [Google Scholar] [CrossRef] [Green Version]
  61. Glienke, J.; Fenten, G.; Seemann, M.; Sturz, A.; Thierauch, K.H. Human SPRY2 inhibits FGF2 signalling by a secreted factor. Mech. Dev. 2000, 96, 91–99. [Google Scholar] [CrossRef]
  62. Deng, H.; Min, E.; Baeyens, N.; Coon, B.G.; Hu, R.; Zhuang, Z.W.; Chen, M.; Huang, B.; Afolabi, T.; Zarkada, G.; et al. Activation of Smad2/3 signaling by low fluid shear stress mediates artery inward remodeling. Proc. Natl. Acad. Sci. USA 2021, 118, e2105339118. [Google Scholar] [CrossRef]
  63. Tsukazaki, T.; Chiang, T.A.; Davison, A.F.; Attisano, L.; Wrana, J.L. SARA, a FYVE domain protein that recruits Smad2 to the TGFbeta receptor. Cell 1998, 95, 779–791. [Google Scholar] [CrossRef] [PubMed] [Green Version]
  64. Pirotton, S.; Communi, D.; Motte, S.; Janssens, R.; Boeynaems, J.M. Endothelial P2-purinoceptors: Subtypes and signal transduction. J. Auton. Pharmacol. 1996, 16, 353–356. [Google Scholar] [CrossRef] [PubMed]
  65. Shen, J.; DiCorleto, P.E. ADP stimulates human endothelial cell migration via P2Y1 nucleotide receptor-mediated mitogen-activated protein kinase pathways. Circ. Res. 2008, 102, 448–456. [Google Scholar] [CrossRef] [PubMed] [Green Version]
  66. Zhang, Q.; Lenardo, M.J.; Baltimore, D. 30 Years of NF-κB: A Blossoming of Relevance to Human Pathobiology. Cell 2017, 168, 37–57. [Google Scholar] [CrossRef] [Green Version]
  67. Liu, T.; Zhang, L.; Joo, D.; Sun, S.C. NF-κB signaling in inflammation. Signal Transduct. Target. Ther. 2017, 2, 17023. [Google Scholar] [CrossRef] [PubMed] [Green Version]
  68. Taniguchi, K.; Karin, M. NF-κB, inflammation, immunity and cancer: Coming of age. Nat. Rev. Immunol. 2018, 18, 309–324. [Google Scholar] [CrossRef]
  69. Mato-Basalo, R.; Morente-López, M.; Arntz, O.J.; van de Loo, F.A.J.; Fafián-Labora, J.; Arufe, M.C. Therapeutic Potential for Regulation of the Nuclear Factor Kappa-B Transcription Factor p65 to Prevent Cellular Senescence and Activation of Pro-Inflammatory in Mesenchymal Stem Cells. Int. J. Mol. Sci. 2021, 22, 3367. [Google Scholar] [CrossRef]
  70. Bracamonte, M.P.; Jayachandran, M.; Rud, K.S.; Miller, V.M. Acute effects of 17beta -estradiol on femoral veins from adult gonadally intact and ovariectomized female pigs. Am. J. Physiol. Heart Circ. Physiol. 2002, 283, H2389–H2396. [Google Scholar] [CrossRef] [Green Version]
  71. Mitchell, P.J.; Timmons, P.M.; Hébert, J.M.; Rigby, P.W.; Tjian, R. Transcription factor AP-2 is expressed in neural crest cell lineages during mouse embryogenesis. Genes Dev. 1991, 5, 105–119. [Google Scholar] [CrossRef] [Green Version]
  72. Tam, J.C.; Ko, C.H.; Koon, C.M.; Cheng, Z.; Lok, W.H.; Lau, C.P.; Leung, P.C.; Fung, K.P.; Chan, W.Y.; Lau, C.B. Identification of Target Genes Involved in Wound Healing Angiogenesis of Endothelial Cells with the Treatment of a Chinese 2-Herb Formula. PLoS ONE 2015, 10, e0139342. [Google Scholar] [CrossRef]
  73. Baryła, I.; Kośla, K.; Bednarek, A.K. WWOX and metabolic regulation in normal and pathological conditions. J. Mol. Med. 2022, 100, 1691–1702. [Google Scholar] [CrossRef] [PubMed]
  74. Iacomino, M.; Baldassari, S.; Tochigi, Y.; Kośla, K.; Buffelli, F.; Torella, A.; Severino, M.; Paladini, D.; Mandarà, L.; Riva, A.; et al. Loss of Wwox Perturbs Neuronal Migration and Impairs Early Cortical Development. Front. Neurosci. 2020, 14, 644. [Google Scholar] [CrossRef]
  75. Pezeshkpoor, B.; Pavlova, A.; Oldenburg, J.; El-Maarri, O. F8 genetic analysis strategies when standard approaches fail. Hamostaseologie 2014, 34, 167–173. [Google Scholar] [CrossRef]
  76. Wang, K.C.; Brooks, D.A.; Thornburg, K.L.; Morrison, J.L. Activation of IGF-2R stimulates cardiomyocyte hypertrophy in the late gestation sheep fetus. J. Physiol. 2012, 590, 5425–5437. [Google Scholar] [CrossRef] [PubMed]
  77. Luo, J.Y.; Liu, F.; Fang, B.B.; Tian, T.; Li, Y.H.; Zhang, T.; Li, X.M.; Yang, Y.N. NFKB1 Gene Mutant Was Associated with Prognosis of Coronary Artery Disease and Exacerbated Endothelial Mitochondrial Fission and Dysfunction. Oxidative Med. Cell. Longev. 2022, 2022, 9494926. [Google Scholar] [CrossRef]
  78. Batchu, S.N.; Xia, J.; Ko, K.A.; Doyley, M.M.; Abe, J.; Morrell, C.N.; Korshunov, V.A. Axl modulates immune activation of smooth muscle cells in vein graft remodeling. Am. J. Physiol. Heart Circ. Physiol. 2015, 309, H1048–H1058. [Google Scholar] [CrossRef] [PubMed] [Green Version]
  79. Pandey, A.; Gordon, D.M.; Pain, J.; Stemmler, T.L.; Dancis, A.; Pain, D. Frataxin directly stimulates mitochondrial cysteine desulfurase by exposing substrate-binding sites, and a mutant Fe-S cluster scaffold protein with frataxin-bypassing ability acts similarly. J. Biol. Chem. 2013, 288, 36773–36786. [Google Scholar] [CrossRef] [Green Version]
  80. Koutnikova, H.; Campuzano, V.; Foury, F.; Dollé, P.; Cazzalini, O.; Koenig, M. Studies of human, mouse and yeast homologues indicate a mitochondrial function for frataxin. Nat. Genet. 1997, 16, 345–351. [Google Scholar] [CrossRef] [PubMed]
  81. Peng, D.; Wang, J.; Zhang, R.; Jiang, F.; Tang, S.; Chen, M.; Yan, J.; Sun, X.; Wang, S.; Wang, T.; et al. Common variants in or near ZNRF1, COLEC12, SCYL1BP1 and API5 are associated with diabetic retinopathy in Chinese patients with type 2 diabetes. Diabetologia 2015, 58, 1231–1238. [Google Scholar] [CrossRef] [Green Version]
  82. Araki, T.; Nagarajan, R.; Milbrandt, J. Identification of genes induced in peripheral nerve after injury. Expression profiling and novel gene discovery. J. Biol. Chem. 2001, 276, 34131–34141. [Google Scholar] [CrossRef] [PubMed] [Green Version]
  83. Zagabathina, S.; Ramadoss, R.; Ah, H.P.; Krishnan, R. Comparative Evaluation of SMAD-2 Expression in Oral Submucous Fibrosis and Reactive Oral Lesions. Asian Pac. J. Cancer Prev. 2020, 21, 399–403. [Google Scholar] [CrossRef] [PubMed]
  84. Balint, B.; Federspiel, J.; Kollmann, C.; Teping, P.; Schwab, T.; Schäfers, H.J. SMAD3 contributes to ascending aortic dilatation independent of transforming growth factor-beta in bicuspid and unicuspid aortic valve disease. Sci. Rep. 2022, 12, 15476. [Google Scholar] [CrossRef]
  85. Uddin, M.; Ratanatharathorn, A.; Armstrong, D.; Kuan, P.F.; Aiello, A.E.; Bromet, E.J.; Galea, S.; Koenen, K.C.; Luft, B.; Ressler, K.J.; et al. Epigenetic meta-analysis across three civilian cohorts identifies NRG1 and HGS as blood-based biomarkers for post-traumatic stress disorder. Epigenomics 2018, 10, 1585–1601. [Google Scholar] [CrossRef]
  86. Lurie, F.; Passman, M.; Meisner, M.; Dalsing, M.; Masuda, E.; Welch, H.; Bush, R.L.; Blebea, J.; Carpentier, P.H.; De Maeseneer, M.; et al. The 2020 update of the CEAP classification system and reporting standards. J. Vasc. Surg. Venous Lymphat. Disord. 2020, 8, 342–352. [Google Scholar] [CrossRef] [PubMed]
  87. Genome Studio Methylation Module v1.8 User Guide (11319130). Available online: https://support.illumina.com/content/dam/illuminasupport/documents/documentation/software_documentation/genomestudio/genomestudio-2011-1/genomestudio-methylation-v1-8-user-guide-11319130-b.pdf (accessed on 22 December 2022).
Figure 1. Cluster heatmap depicting methylation levels of the top 20 genes among those significantly hypo- and hypermethylated in 3 cell types upon exposure. (AC) represent a heatmap for −/+ treated ECs, SMCs, and FBs, respectively. Heatmap displays differentially methylated genes ranging from hypomethylated (blue) to hypermethylated (red). avg_Beta represents an average methylation beta value and corresponds to a certain color within the range. Cluster pattern is shown on the left side of each diagram.
Epigenomes 07 00008 g001
Figure 2. Enriched GO (biological process) tree map of the list of genes provided as input for ECs.
Epigenomes 07 00008 g002
Figure 3. Enriched GO (biological process) tree map of the list of genes provided as input for SMCs.
Epigenomes 07 00008 g003
Figure 4. Enriched GO (biological process) tree map of the list of genes provided as input for FBs.
Epigenomes 07 00008 g004
Figure 5. The most significant functional GO categories overrepresented among the observed genes near differentially methylated sites.
Epigenomes 07 00008 g005
Figure 6. Association of genes (and their functions) differentially methylated in different cell types with the pathological processes during varicose transformation of the vein wall.
Epigenomes 07 00008 g006
Figure 7. Enhancer model potentially involved in the regulation of target genes. (AC)—the most specific composite modules obtained as the results of CMA analysis for ECs, SMCs, and FBs, correspondingly. “Module width” is the preferable distance between sites; “V$” stands for “vertebrates”; the right part of the PWM name represents the TF family name. Score of the best match is shown as the optimized cut-off of the PWM score; number of individual matches (N) for each PWM gives the maximal number of TF sites with the highest scores, which are computed in the module. (DF)—for ECs, SMCs, and FBs, correspondingly, contain two histograms of the distributions of model scores (reflecting the number of TF site pairs found in the sequence) in the CpG regulatory regions (red) versus CpG sites of unchanged genes (blue). AUC = 0.76 for ECs and SMCs, and 0.81 for FBs.
Epigenomes 07 00008 g007
Figure 8. Diagram of intracellular regulatory signal transduction pathways of genes near differentially methylated sites in ECs. Master regulators are indicated by red rectangles, transcription factors are indicated by purple rectangles, and green rectangles represent intermediate molecules, which were added to the network during the search for master regulators from the selected TFs. Orange and blue frames highlight molecules that are encoded by genes mapped to differentially methylated sites. Positive feedbacks are represented by dotted lines.
Epigenomes 07 00008 g008
Figure 9. Diagram of intracellular regulatory signal transduction pathways of genes near differentially methylated sites in SMCs. Master regulators are indicated by red rectangles; transcription factors are indicated by purple rectangles; and green rectangles represent intermediate molecules, which were added to the network during the search for master regulators from the selected TFs. Orange and blue frames highlight molecules that are encoded by genes mapped to differentially methylated sites. Positive feedbacks are represented by dotted lines.
Epigenomes 07 00008 g009
Figure 10. Diagram of intracellular regulatory signal transduction pathways of genes near differentially methylated sites in FBs. Master regulators are indicated by red rectangles, transcription factors are indicated by purple rectangles, and green rectangles represent intermediate molecules, which were added to the network during the search for master regulators from the selected TFs. Orange and blue frames highlight molecules that are encoded by genes mapped to differentially methylated sites. Positive feedbacks are represented by shown by dotted lines.
Epigenomes 07 00008 g010
Figure 11. Venn diagram showing the intersection of 3 tables with top master regulators for ECs (yellow), SMCs (pink), and FBs (blue).
Epigenomes 07 00008 g011
Figure 12. Potential targetable master regulators for each cell type representing the layers of the vein wall.
Epigenomes 07 00008 g012
Table 1. Top 20 genes among those significantly hypo- and hypermethylated in ECs upon exposure.
Gene SymbolGene DescriptionDiffScore 1ECs + Avg_Beta 2ECs − Avg_BetaTargetID 3p-Value 4
EEF1Deukaryotic translation elongation factor 1 delta−109.18540.65556440.8999788cg221865331.21 × 10−11
MMDmonocyte to macrophage differentiation-associated−35.189650.29811080.5100111cg148615700.000302716
TESK1testis associated actin remodeling kinase 1−31.420260.49988180.6956196cg090005100.000721064
SLC24A4solute carrier family 24 member 4−28.640840.32708590.5232344cg150529010.001367464
MYH3myosin heavy chain 3−28.244310.23935930.4242639cg181904330.001498197
PDGFBplatelet derived growth factor subunit B−24.952730.118670.2644652cg191676730.003196885
ARandrogen receptor−24.150090.57321130.7435369cg272713680.003845838
ZCCHC10zinc finger CCHC-type containing 10−22.238470.5859280.748945cg088017540.005972457
CELSR3cadherin EGF LAG seven-pass G-type receptor 3−22.238470.50435650.6789438cg066213580.005972457
CNIH2cornichon family AMPA receptor auxiliary protein 2−21.253180.16619030.3161516cg190262600.007493453
ZFP28ZFP28 zinc finger protein16.80810.42039980.2640518cg238502120.02085403
YY1YY1 transcription factor18.579490.79564050.6552107cg227631810.013869187
FRMD1FERM domain containing 119.001120.65879150.49145cg003504780.012586008
MESTmesoderm specific transcript21.279020.80930460.6647319cg139175040.007449
LARP1La ribonucleoprotein 1, translational regulator23.042860.50519060.3232486cg236133170.004962654
CRELD2cysteine rich with EGF like domains 223.15150.8369810.6953279cg258820560.004840052
RAB9ARAB9A, member RAS oncogene family25.781060.78092070.6158033cg026202280.002641764
KRT17keratin 1728.640840.75020070.5708218cg002147940.001367464
SLC29A1solute carrier family 29 member 1 (Augustine blood group)45.24530.75066050.5342799cg105191402.98862 × 10−5
SLC45A1solute carrier family 45 member 157.25970.67445240.4233551cg112838601.87945 × 10−6
1 DiffScore definition is given in Materials and Methods (4.2). 2 Avg_Beta represents an average methylation beta-value for ECs (+/− shear stress, respectively). 3 TargetID identifies the probe name. cg# represents CpG loci. 4 p-value = [10^(DiffScore/10)] for hypomethylated genes; [10^(−DiffScore/10)] for hypermethylated genes.
Table 2. Top 20 genes among those significantly hypo- and hypermethylated in SMCs upon exposure.
Gene SymbolGene DescriptionDiffScore 1SMCs + Avg_Beta 2SMCs − Avg_BetaTargetID 3p-Value 4
SCTsecretin−44.153690.30019440.5255814cg057822923.84265 × 10−5
HLTFhelicase-like transcription factor−37.048740.33064790.5443499cg261513100.0001973
CDH2cadherin 2−34.434250.38505240.5944616cg093134390.000360226
ZNRF1zinc and ring finger 1−30.559430.3853220.5856031cg209571930.000879138
PRADC1protease associated domain containing 1−28.454220.42620780.6192294cg269939510.001427506
CCNJLcyclin J-like−21.769850.43901450.6126426cg171788880.006652961
METTL25Bmethyltransferase-like 25B−21.188770.41711890.590144cg238816010.007605416
CDCA5cell division cycle-associated 5−21.183820.43158230.6038101cg202520160.00761409
SIRT3sirtuin 3−20.958260.73627660.8588417cg235302880.008019993
TCF15transcription factor 15−20.045350.36517210.534321cg061439010.009896121
TMEM215transmembrane protein 21529.977240.84319170.6911527cg113088400.001005254
KMT2Dlysine methyltransferase 2D30.486150.47649720.2821061cg244718670.000894098
CDC37L1cell division cycle 37-like 1, HSP90 cochaperone30.559430.83508120.6772436cg221895190.000879138
SPA17sperm autoantigenic protein 1734.09790.81236210.6387361cg223183040.000389233
PGBD4piggyBac transposable element derived 435.793050.63024170.4193449cg122379460.000263448
KHKketohexokinase39.88730.85989250.6937668cg015221940.000102629
RNF213ring finger protein 21344.153690.87671440.7105584cg099073953.84265 × 10−5
MRPL12mitochondrial ribosomal protein L1248.637780.8166420.6133671cg013726891.36843 × 10−5
RPRMreprimo, TP53-dependent G2 arrest mediator homolog58.149570.64503880.3928624cg184118981.53124 × 10−6E
SLC22A18solute carrier family 22 member 1877.427340.81398060.5674041cg160352771.80828 × 10−8
1 DiffScore definition is given in Materials and Methods (4.2). 2 Avg_Beta represents an average methylation beta-value for SMCs (+/− shear stress, respectively). 3 TargetID identifies the probe name. cg# represents CpG loci. 4 p-value = [10^(DiffScore/10)] for hypomethylated genes; [10^(−DiffScore/10)] for hypermethylated genes.
Table 3. Top 20 genes among those significantly hypo- and hypermethylated in FBs upon exposure.
Gene SymbolGene DescriptionDiffScore 1FBs + Avg_Beta 2FBs −
Avg_Beta
TargetID 3p-Value 4
PPP1R13Lprotein phosphatase 1 regulatory subunit 13-like−287.47830.14251810.5611927cg035545521.78719 × 10−29
PPP1CCprotein phosphatase 1 catalytic subunit gamma−195.85750.58205950.9008529cg033104532.59567 × 10−20
SCRN2secernin 2−174.57410.53768090.858446cg116468873.48811 × 10−18
MYL5myosin light chain 5−174.36850.50007650.831169cg181767123.65721 × 10−18
FUCA1alpha-L-fucosidase 1−166.37220.63123420.9132504cg247923602.30558 × 10−17
ISYNA1inositol-3-phosphate synthase 1−161.81020.46224250.7933455cg093749496.59144 × 10−17
YIPF5Yip1 domain family member 5−153.5720.44133350.7704819cg042937264.39339 × 10−16
SEMA6Csemaphorin 6C−149.78120.45702270.7800868cg258206931.05167 × 10−15
FBN2fibrillin 2−147.24050.74762420.9649287cg250848781.88777 × 10−15
RANGNRFRAN guanine nucleotide release factor−146.24990.41673340.743665cg111784432.37143 × 10−15
DCAF16DDB1 and CUL4-associated factor 1690.261630.72068820.4538092cg271270569.41536 × 10−10
SACM1LSAC1-like phosphatidylinositide phosphatase91.751780.84581250.6134535cg229862716.6807 × 10−10
CACHD1cache domain containing 194.274480.79174840.5357191cg193044103.73725 × 10−10
UGDHUDP-glucose 6-dehydrogenase97.152920.88461640.6643396cg251179761.92623 × 10−10
GGTLC2gamma-glutamyltransferase light chain 299.881580.82047790.5666317cg014576221.02764 × 10−10
C16orf54chromosome 16 open reading frame 54101.72360.26496940.0511992cg230934966.72419 × 10−11
FXNfrataxin103.50870.52431530.2395225cg236679334.4579 × 10−11
RGS11regulator of G protein signaling 11104.23190.49082510.2102013cg013445183.77407 × 10−11
PRICKLE3prickle planar cell polarity protein 3105.78410.34533710.09902742cg104175592.63992 × 10−11
SPATA4spermatogenesis associated 4335.95890.56175820.2024512cg013112852.53577 × 10−34
1 DiffScore definition is given in Materials and Methods (4.2). 2 Avg_Beta represents an average methylation beta-value for FBs (+/− shear stress, respectively). 3 TargetID identifies the probe name. cg# represents CpG loci. 4 p-value = [10^(DiffScore/10)] for hypomethylated genes; [10^(−DiffScore/10)] for hypermethylated genes.
Table 4. Transcription factors of the predicted enhancer model potentially regulating the genes near the differentially methylated sites.
Gene SymbolGene DescriptionRegulatory Score 1Yes-No Ratio 2
ECs
JUNJun proto-oncogene, AP-1 transcription factor subunit2.091.56
CDX2caudal type homeobox 21.771.62
POU2F1POU class 2 homeobox 11.611.87
SREBF2sterol regulatory element binding transcription factor 21.591.33
NKX3-1NK3 homeobox 11.581.58
NHLH1nescient helix-loop-helix 11.392.6
GABPAGA binding protein transcription factor subunit alpha1.381.24
RUNX3RUNX family transcription factor 31.324.61
NRLneural retina leucine zipper1.211.75
MAFKMAF bZIP transcription factor K1.152.13
SMCs
SREBF2sterol regulatory element binding transcription factor 21.81.5
LEF1lymphoid enhancer binding factor 11.782.26
IRF3interferon regulatory factor 31.762.39
WT1WT1 transcription factor1.745.13
SFPQsplicing factor proline and glutamine rich1.711.24
POU2F1POU class 2 homeobox 11.73.54
RBPJrecombination signal binding protein for immunoglobulin kappa J region1.71.65
DPF2double PHD fingers 21.641.31
PAX5paired box 51.641.35
SREBF1sterol regulatory element binding transcription factor 11.644.45
FBs
RELARELA proto-oncogene, NF-kB subunit2.271.9
ESR1estrogen receptor 12.092.44
TFAP2Atranscription factor AP-2 alpha1.662.12
RUNX3RUNX family transcription factor 31.621.8
ELF3E74 like ETS transcription factor 31.462.96
TFAP2Btranscription factor AP-2 beta02.12
TFAP2Ctranscription factor AP-2 gamma02.42
1 Regulatory score is the measure of involvement of the given TF in controlling the expression of genes that encode the master regulators presented below (through positive feedback loops). 2 Yes–No ratio is the ratio between frequencies of the sites in Yes sequences versus No sequences. It describes the level of the enrichment of binding sites for the indicated TF in the regulatory target regions.
Table 5. Master regulators that may govern the regulation of genes near the differentially methylated sites.
Master Molecule NameGene SymbolGene DescriptionTotal Rank 1
ECs
PDGFB-isoform1(h)PDGFBplatelet-derived growth factor subunit B9
PDGFB-isoform2(h) PDGFBplatelet-derived growth factor subunit B9
PDGFB(h)PDGFBplatelet-derived growth factor subunit B11
HRS(h)HGShepatocyte growth factor-regulated tyrosine kinase substrate13
HRS:PtdIns(3)P:SARA:SMAD2HGS, SMAD2, ZFYVE9SMAD family member 2, hepatocyte growth factor-regulated tyrosine kinase substrate, zinc finger FYVE-type containing 913
HRS:PtdIns(3)P:SARA:SMAD3HGS, SMAD3, ZFYVE9SMAD family member 3, hepatocyte growth factor-regulated tyrosine kinase substrate, zinc finger FYVE-type containing 913
HRS-isoform1(h)HGShepatocyte growth factor-regulated tyrosine kinase substrate13
HRS(h){pY}HGShepatocyte growth factor-regulated tyrosine kinase substrate13
HRS-isoform2(h)HGShepatocyte growth factor-regulated tyrosine kinase substrate13
HRS(h){pY334}HGShepatocyte growth factor-regulated tyrosine kinase substrate13
SMCs
HRS(h)HGShepatocyte growth factor-regulated tyrosine kinase substrate30
HRS:PtdIns(3)P:SARA:SMAD2HGS, SMAD2, ZFYVE9SMAD family member 2, hepatocyte growth factor-regulated tyrosine kinase substrate, zinc finger FYVE-type containing 930
HRS:PtdIns(3)P:SARA:SMAD3HGS, SMAD3, ZFYVE9SMAD family member 3, hepatocyte growth factor-regulated tyrosine kinase substrate, zinc finger FYVE-type containing 930
HRS-isoform1(h)HGShepatocyte growth factor-regulated tyrosine kinase substrate30
HRS(h){pY}HGShepatocyte growth factor-regulated tyrosine kinase substrate30
HRS-isoform2(h)HGShepatocyte growth factor-regulated tyrosine kinase substrate30
HRS(h){pY334}HGShepatocyte growth factor-regulated tyrosine kinase substrate30
Sprouty2(h){p}SPRY2sprouty RTK signaling antagonist 230
Sprouty2(h)SPRY2sprouty RTK signaling antagonist 231
CD23(h)FCER2Fc fragment of IgE receptor II32
FBs
SOCS-1(h)SOCS1suppressor of cytokine signaling 121
p50:NF-kappaBp65:SOCS-1NFKB1, RELA, SOCS1RELA proto-oncogene, NF-kB subunit, nuclear factor kappa B subunit 1, suppressor of cytokine signaling 121
p50:NF-kappaBp65{ub}n:SOCS-1NFKB1, RELA, SOCS1RELA proto-oncogene, NF-kB subunit, nuclear factor kappa B subunit 1, suppressor of cytokine signaling 121
SOCS-1(h)SOCS1suppressor of cytokine signaling 129
IGF-2R(h)IGF2Rinsulin like growth factor 2 receptor32
G12/13GNA12, GNA13, GNB1, GNB1L, GNB2, GNB3, GNB4, GNB5, GNG2, GNG3, GNG5, GNGT1G protein subunit alpha 12, G protein subunit alpha 13, G protein subunit beta 1, G protein subunit beta 1 like, G protein subunit beta 2, G protein subunit beta 3, G protein subunit beta 4, G protein subunit beta 5, G protein subunit gamma 2, G protein subunit gamma 3, G protein subunit gamma 5, G protein subunit gamma transducin 149
DHTXisoform1(h)UVRAGUV radiation resistance associated50
F8B(h){gly}nF8coagulation factor VIII51
F8B(h)F8coagulation factor VIII52
F8B-isoform2(h)F8coagulation factor VIII53
1 Total rank is the sum of the ranks of the master molecules sorted by keynode score, CMA score, and epigenomics data. The lower the total rank is, the more likely it is that a master molecule is considered as a master regulator.
Disclaimer/Publisher’s Note: The statements, opinions and data contained in all publications are solely those of the individual author(s) and contributor(s) and not of MDPI and/or the editor(s). MDPI and/or the editor(s) disclaim responsibility for any injury to people or property resulting from any ideas, methods, instructions or products referred to in the content.

