Article

Hypomagnetic Field Exposure Alters Iron–Sulfur Homeostasis and Oxidative Balance in a Frataxin-Deficient Insect System

1
Beijing Key Laboratory of Bioelectromagnetics, Institute of Electrical Engineering, Chinese Academy of Sciences, Beijing 100190, China
2
School of Electronic, Electrical and Communication Engineering, University of Chinese Academy of Sciences, Beijing 101408, China
3
Shanghai Synchrotron Radiation Facility, Shanghai Advanced Research Institute, Chinese Academy of Sciences, Shanghai 201204, China
4
Department of Entomology, College of Plant Protection, Nanjing Agricultural University, Nanjing 210095, China
5
Department of Plant Biosecurity and MOA Key Laboratory of Surveillance and Management for Plant Quarantine Pests, College of Plant Protection, China Agricultural University, Beijing 100193, China
*
Author to whom correspondence should be addressed.
Insects 2026, 17(4), 373; https://doi.org/10.3390/insects17040373

Submission received: 25 January 2026 / Revised: 23 March 2026 / Accepted: 24 March 2026 / Published: 1 April 2026
(This article belongs to the Section Insect Molecular Biology and Genomics)

Simple Summary

This study explored whether a hypomagnetic field, an environmental condition found in some places like deep space or shielded rooms, could worsen the problems associated with a genetic disease called Friedreich’s ataxia. This disease is caused by a lack of the vital protein frataxin, which is essential for cellular iron–sulfur cluster biogenesis and oxidative balance. Using fruit flies as a model, researchers aimed to see if this hypomagnetic field would further disturb these elements and increase stress. They found that the hypomagnetic field changed iron and sulfur levels in very specific ways in different tissues, like the brain and eyes, and significantly increased harmful molecules in the brains of affected flies. It also altered the activity of genes related to iron and stress. The conclusion is that this environmental factor can indeed intensify the core cellular damage in this condition. This is valuable to society because it highlights how certain environmental conditions could potentially worsen symptoms for patients with similar metabolic diseases, informing future protective strategies.

Abstract

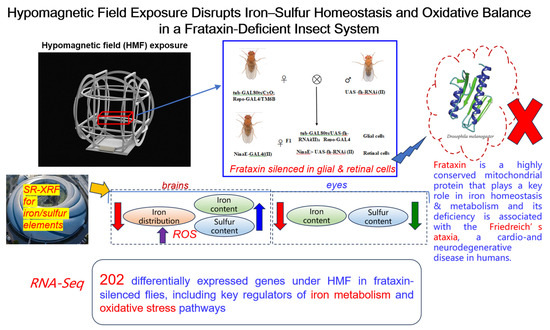
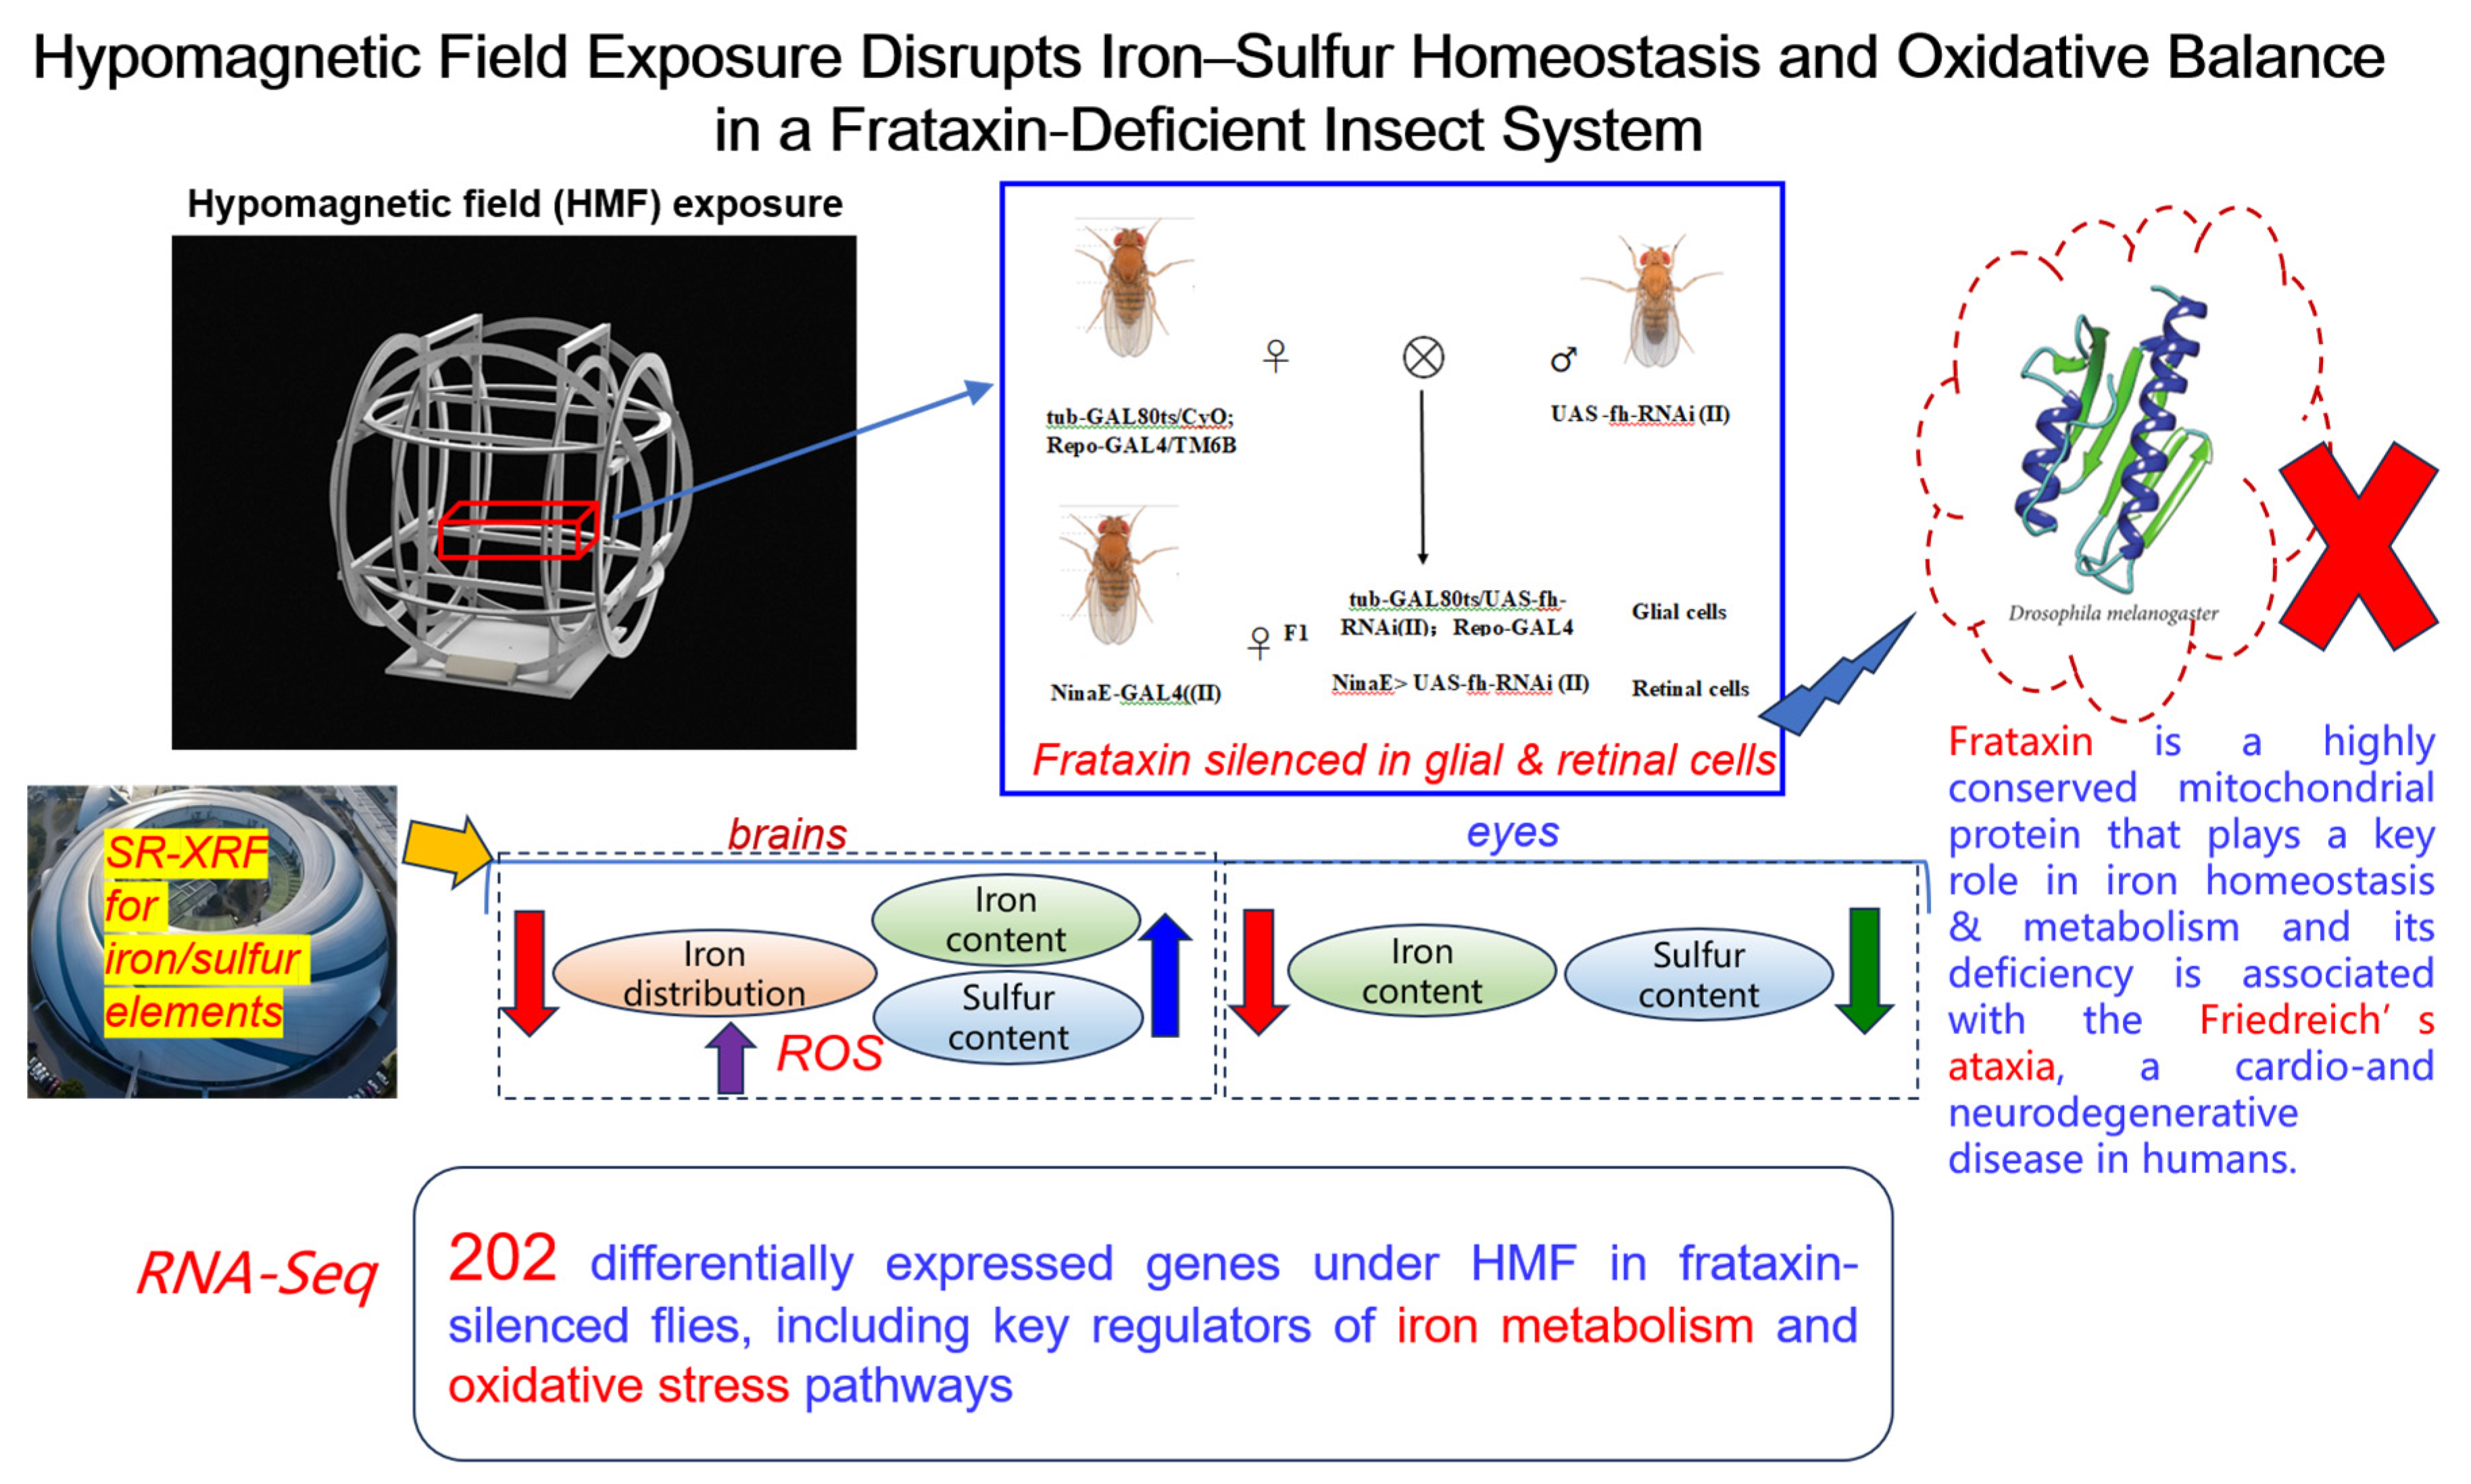
Frataxin is a conserved mitochondrial protein essential for cellular iron–sulfur (Fe–S) cluster biogenesis and oxidative balance, with its deficiency causing Friedreich’s ataxia in humans. The hypomagnetic field (HMF), an environmental stressor known to influence oxidative stress and neurodevelopment, may interact with such inherent metabolic vulnerabilities. This study investigated whether HMF exposure exacerbates Fe–S homeostasis and oxidative disruption in a Drosophila melanogaster model of frataxin deficiency. Using synchrotron radiation-based X-ray fluorescence (SR-XRF) spectroscopy for in situ elemental analysis in live tissues, we found that HMF significantly altered iron distribution and content in a tissue-specific manner. In frataxin-silenced brains, HMF decreased iron distribution but increased total iron content, whereas in eyes it reduced iron content. Sulfur content decreased in frataxin-deficient eyes but increased in brains under HMF, though its spatial distribution was unchanged. Critically, HMF elevated reactive oxygen species (ROS) in frataxin-deficient brains. Transcriptomic analysis identified 202 differentially expressed genes under HMF in frataxin-silenced flies, including key regulators of iron metabolism and oxidative stress pathways. These findings demonstrate that HMF disrupts tissue-specific iron and sulfur homeostasis and intensifies oxidative stress in a frataxin-deficient insect system, underscoring its role as an environmental factor capable of aggravating metabolic fragility.

Graphical Abstract

1. Introduction

Frataxin, a nuclear-encoded mitochondrial protein, is universally recognized as a critical factor in iron–sulfur cluster (ISC) biogenesis and cellular iron homeostasis [1,2,3,4,5,6]. Its deficiency is the primary cause of Friedreich’s ataxia (FRDA), a common hereditary neurodegenerative disease. Although its precise molecular functions are still being elucidated, a leading hypothesis posits that frataxin acts as an iron chaperone, serving as a finely tuned “gatekeeper” that delivers ferrous iron to the scaffold protein ISCU and prevents premature or ineffective reactions during ISC assembly. Iron–sulfur clusters are vital cofactors for numerous metalloproteins involved in electron transport, enzymatic catalysis, and gene regulation. The consequences of frataxin deficiency are profound and conserved across model organisms, leading to mitochondrial iron accumulation, cytoplasmic iron depletion, reduced activity of Fe-S-dependent enzymes, and increased oxidative stress [7,8]. This cascade of mitochondrial dysfunction manifests clinically as impaired motor coordination, reduced lifespan, and, in the case of Drosophila melanogaster (D. melanogaster), a specific developmental blockade [9,10].
The pathological cascade involved in frataxin deficiency is complex, culminating in late-stage mitochondrial iron accumulation. In D. melanogaster models, this iron directly drives neurodegeneration by activating the sphingolipid metabolism-Pdk1/Mef2 signaling axis—a pathway also conserved in mammalian hearts [11]. Given frataxin’s established role in mitochondrial iron handling and redox metabolism, it is of interest to examine how frataxin deficiency responds to environmental perturbations that may affect these same processes. One such perturbation is the hypomagnetic field (HMF), a condition of markedly reduced magnetic flux encountered in deep-space and magnetically shielded environments. Rather than representing a direct patient-relevant exposure scenario, HMF is used here as an experimental environmental stressor to probe whether reduced magnetic field conditions can modify redox balance, mitochondrial-associated function, and iron-related homeostasis in a metabolically vulnerable background. In this context, D. melanogaster provides a tractable model for testing how environmental conditions interact with frataxin deficiency at the tissue level.
We therefore used synchrotron radiation-based X-ray fluorescence (SR-XRF) spectroscopy to characterize iron- and sulfur-associated signals in living tissues of D. melanogaster under GMF and HMF conditions. In parallel, we assessed oxidative-stress-associated fluorescence and transcriptomic responses to determine whether HMF exposure modifies molecular and cellular readouts in a frataxin-deficient background. Our aim was to evaluate HMF as an environmental perturbation model for studying gene–environment interactions relevant to metabolic fragility, rather than to imply a direct clinical exposure model for Friedreich’s ataxia. Given that iron dyschondrosteosis is a pathological hallmark of FRDA [12]—initially revealed by granular iron deposits in cardiomyocytes—understanding the subcellular spatial distribution of iron is critically important. To this end, we are leveraging the unique capabilities of synchrotron radiation-based X-ray fluorescence (SR-XRF) spectroscopy. The SR-XRF method is ideally suited for acquiring quantitative, spatially resolved data on spatially resolved elemental signals with high resolution [13]. This study aims to use these insights to investigate the spatiotemporal dynamics of iron metabolism under the environmental stress of a hypomagnetic field, using D. melanogaster as a model organism. We will employ microbeam XRF and perform real-time, quantitative analysis of iron and sulfur content, distribution, and chemical states in live tissues of D. melanogaster. Furthermore, in order to explore the differential gene expression under hypomagnetic field exposure in frataxin-deficient flies, the comparative transcriptomes of frataxin-silenced and parental lines were sequenced using RNA-sequencing (RNA-Seq) technology and comparative analyses were performed to uncover the targeted alterations in genetic networks governing cellular oxidative stress responses and iron ion metabolism. Our goal was to elucidate the precise function and molecular pathways of frataxin in mediating these changes, thereby advancing our understanding of FRDA pathogenesis and opening avenues for new therapeutic interventions.

2. Materials and Methods

2.1. Drosophila Melanogaster Lines and Cultivation

The Gal4-UAS system was utilized for tissue-specific gene expression. The tub-Gal80ts/CyO; repo-GAL4/TM6B lines obtained from China Agricultural University were used to drive RNAi expression. The RNAi line used in this work was UAS-fh RNAi (Bloomington Line Center, BDSC 24620, Bloomington, IN, USA). D. melanogaster stocks were cultivated at 25 ± 1 °C, with a relative humidity of 60 ± 5% and a 12:12 h light: dark cycle. All magnetic field exposure assays were performed at 25 °C. For genotypes carrying tub-GAL80ts (repo-GAL4; tub-GAL80ts > fh-RNAi), flies were reared at 18 °C during development and shifted to 29 °C at 3–5 days post-eclosion to induce adult-onset RNAi, followed by magnetic field exposure at 25 °C. In contrast, the ninaE-GAL4 > fh-RNAi flies (without tub-GAL80ts) were maintained at 25 °C throughout the whole experiment. Standard regular diet (RD): agar 20 g/L, sucrose 80 g/L, active dry yeast 5 g/L, calcium chloride dihydrate 1.6 g/L, ferrous sulfate heptahydrate 1.6 g/L, sodium potassium tartrate tetrahydrate 8 g/L, sodium chloride 0.5 g/L, manganese chloride tetrahydrate 0.5 g/L, and nipagin 5.3 mL/L [14].

2.2. Construction of Frataxin-Silenced Drosophila melanogaster Mutants Using RNAi

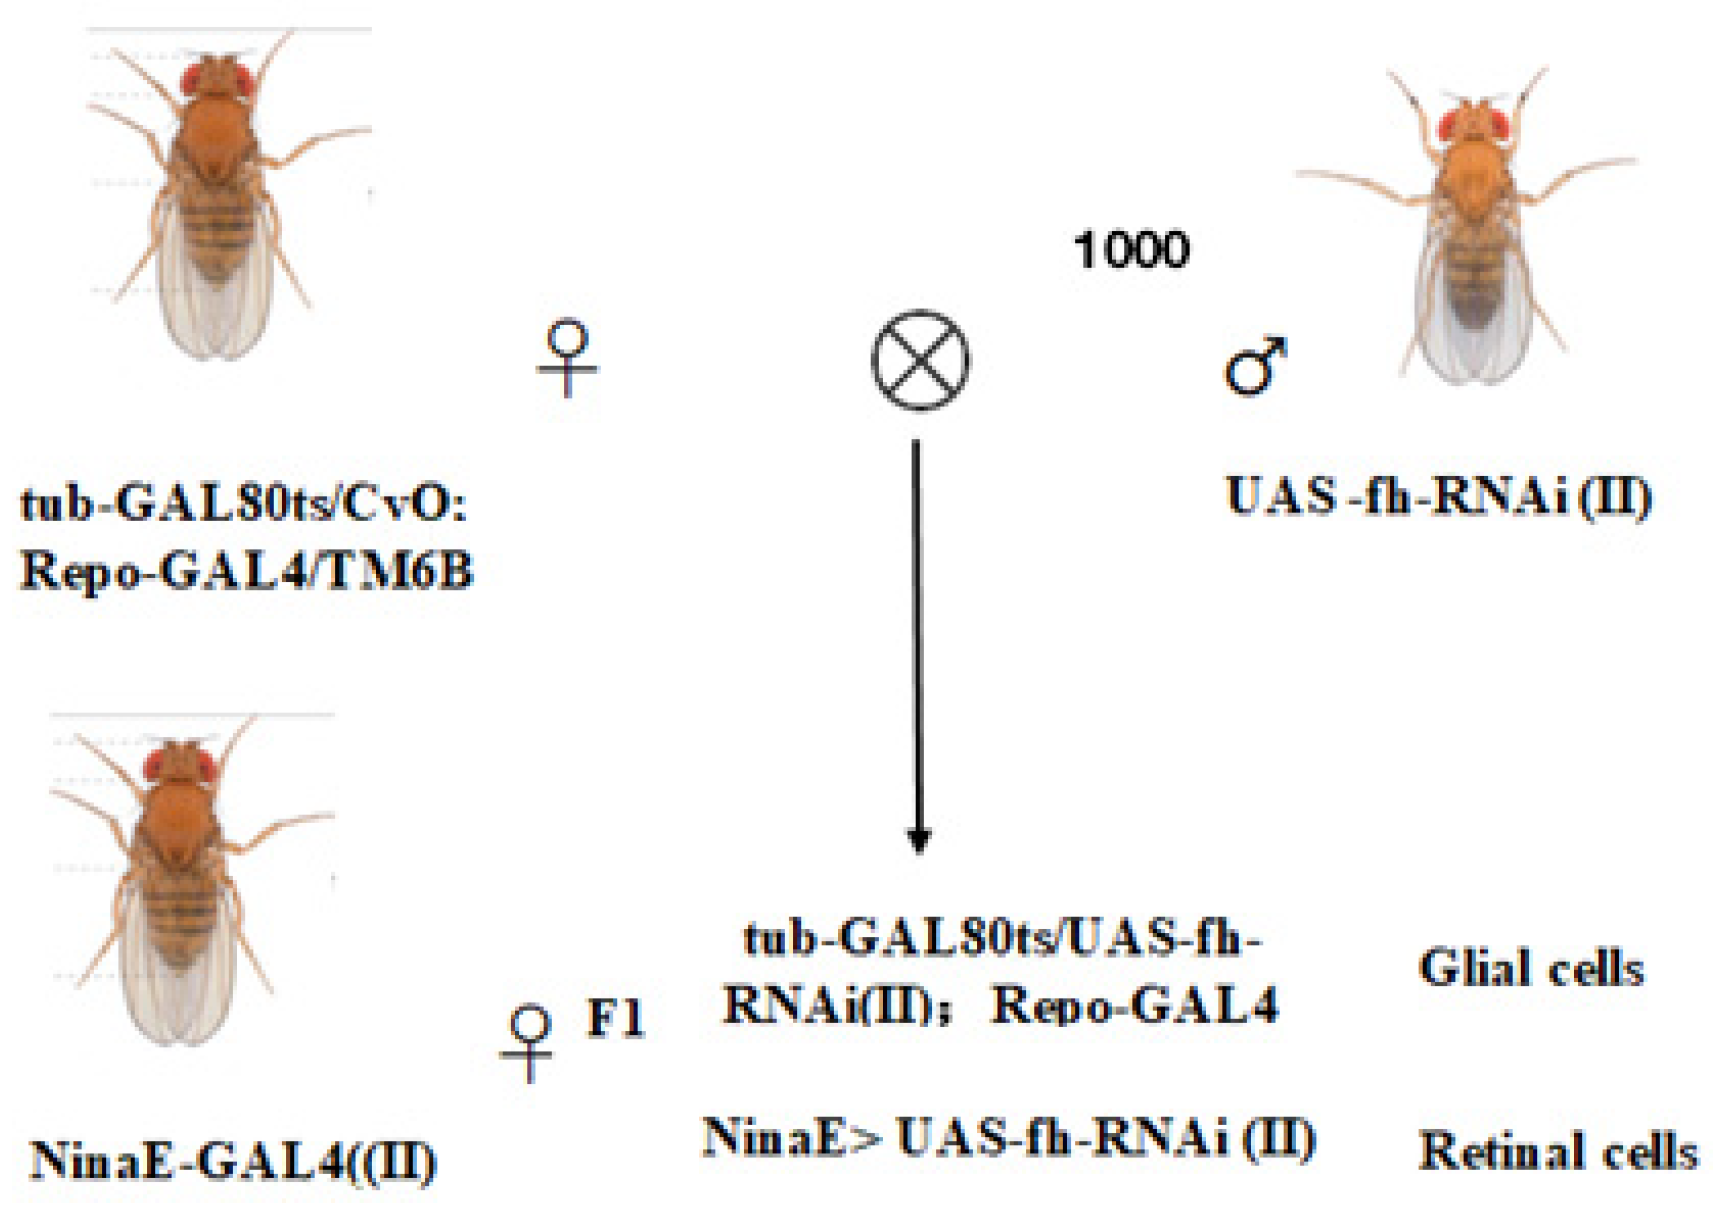
The GAL4/UAS system was employed to generate frataxin gene silencing in different tissues. The D. melanogaster lines were maintained on a cornmeal-agar medium at 25 °C. To achieve time-controlled silencing of frataxin (fh) in glial cells (repo-GAL4; tub-GAL80ts > fh-RNAi), we employed the GAL4/UAS system combined with tub-GAL80ts. In addition, to silence fh specifically in retinal photoreceptors, we used ninaE-GAL4 > fh-RNAi (without GAL80ts) as a retina-specific (non–time-controlled) knockdown strategy. The genetic control was one of the parental lines, UAS-fh RNAi. Virgin female flies from one of the parental lines were selected for hybridization. Hybridization experiments were conducted to generate F1 generations with silenced frataxin in glial cells (repo-GAL4; tub-GAL80ts > fh-RNAi) and retinal cells (ninaE-GAL4 > fh-RNAi) (Figure 1). For all crosses involving GAL80ts, both parents and their developmental-stage offspring were reared at 18 °C to suppress GAL4 activity. To induce target gene silencing, F1 offspring were transferred to 29 °C post-eclosion. Upon reaching adulthood, F1 individuals were sorted for specific phenotypes to establish the silencing model.

2.3. Magnetic Field Generation System and Insect Exposures

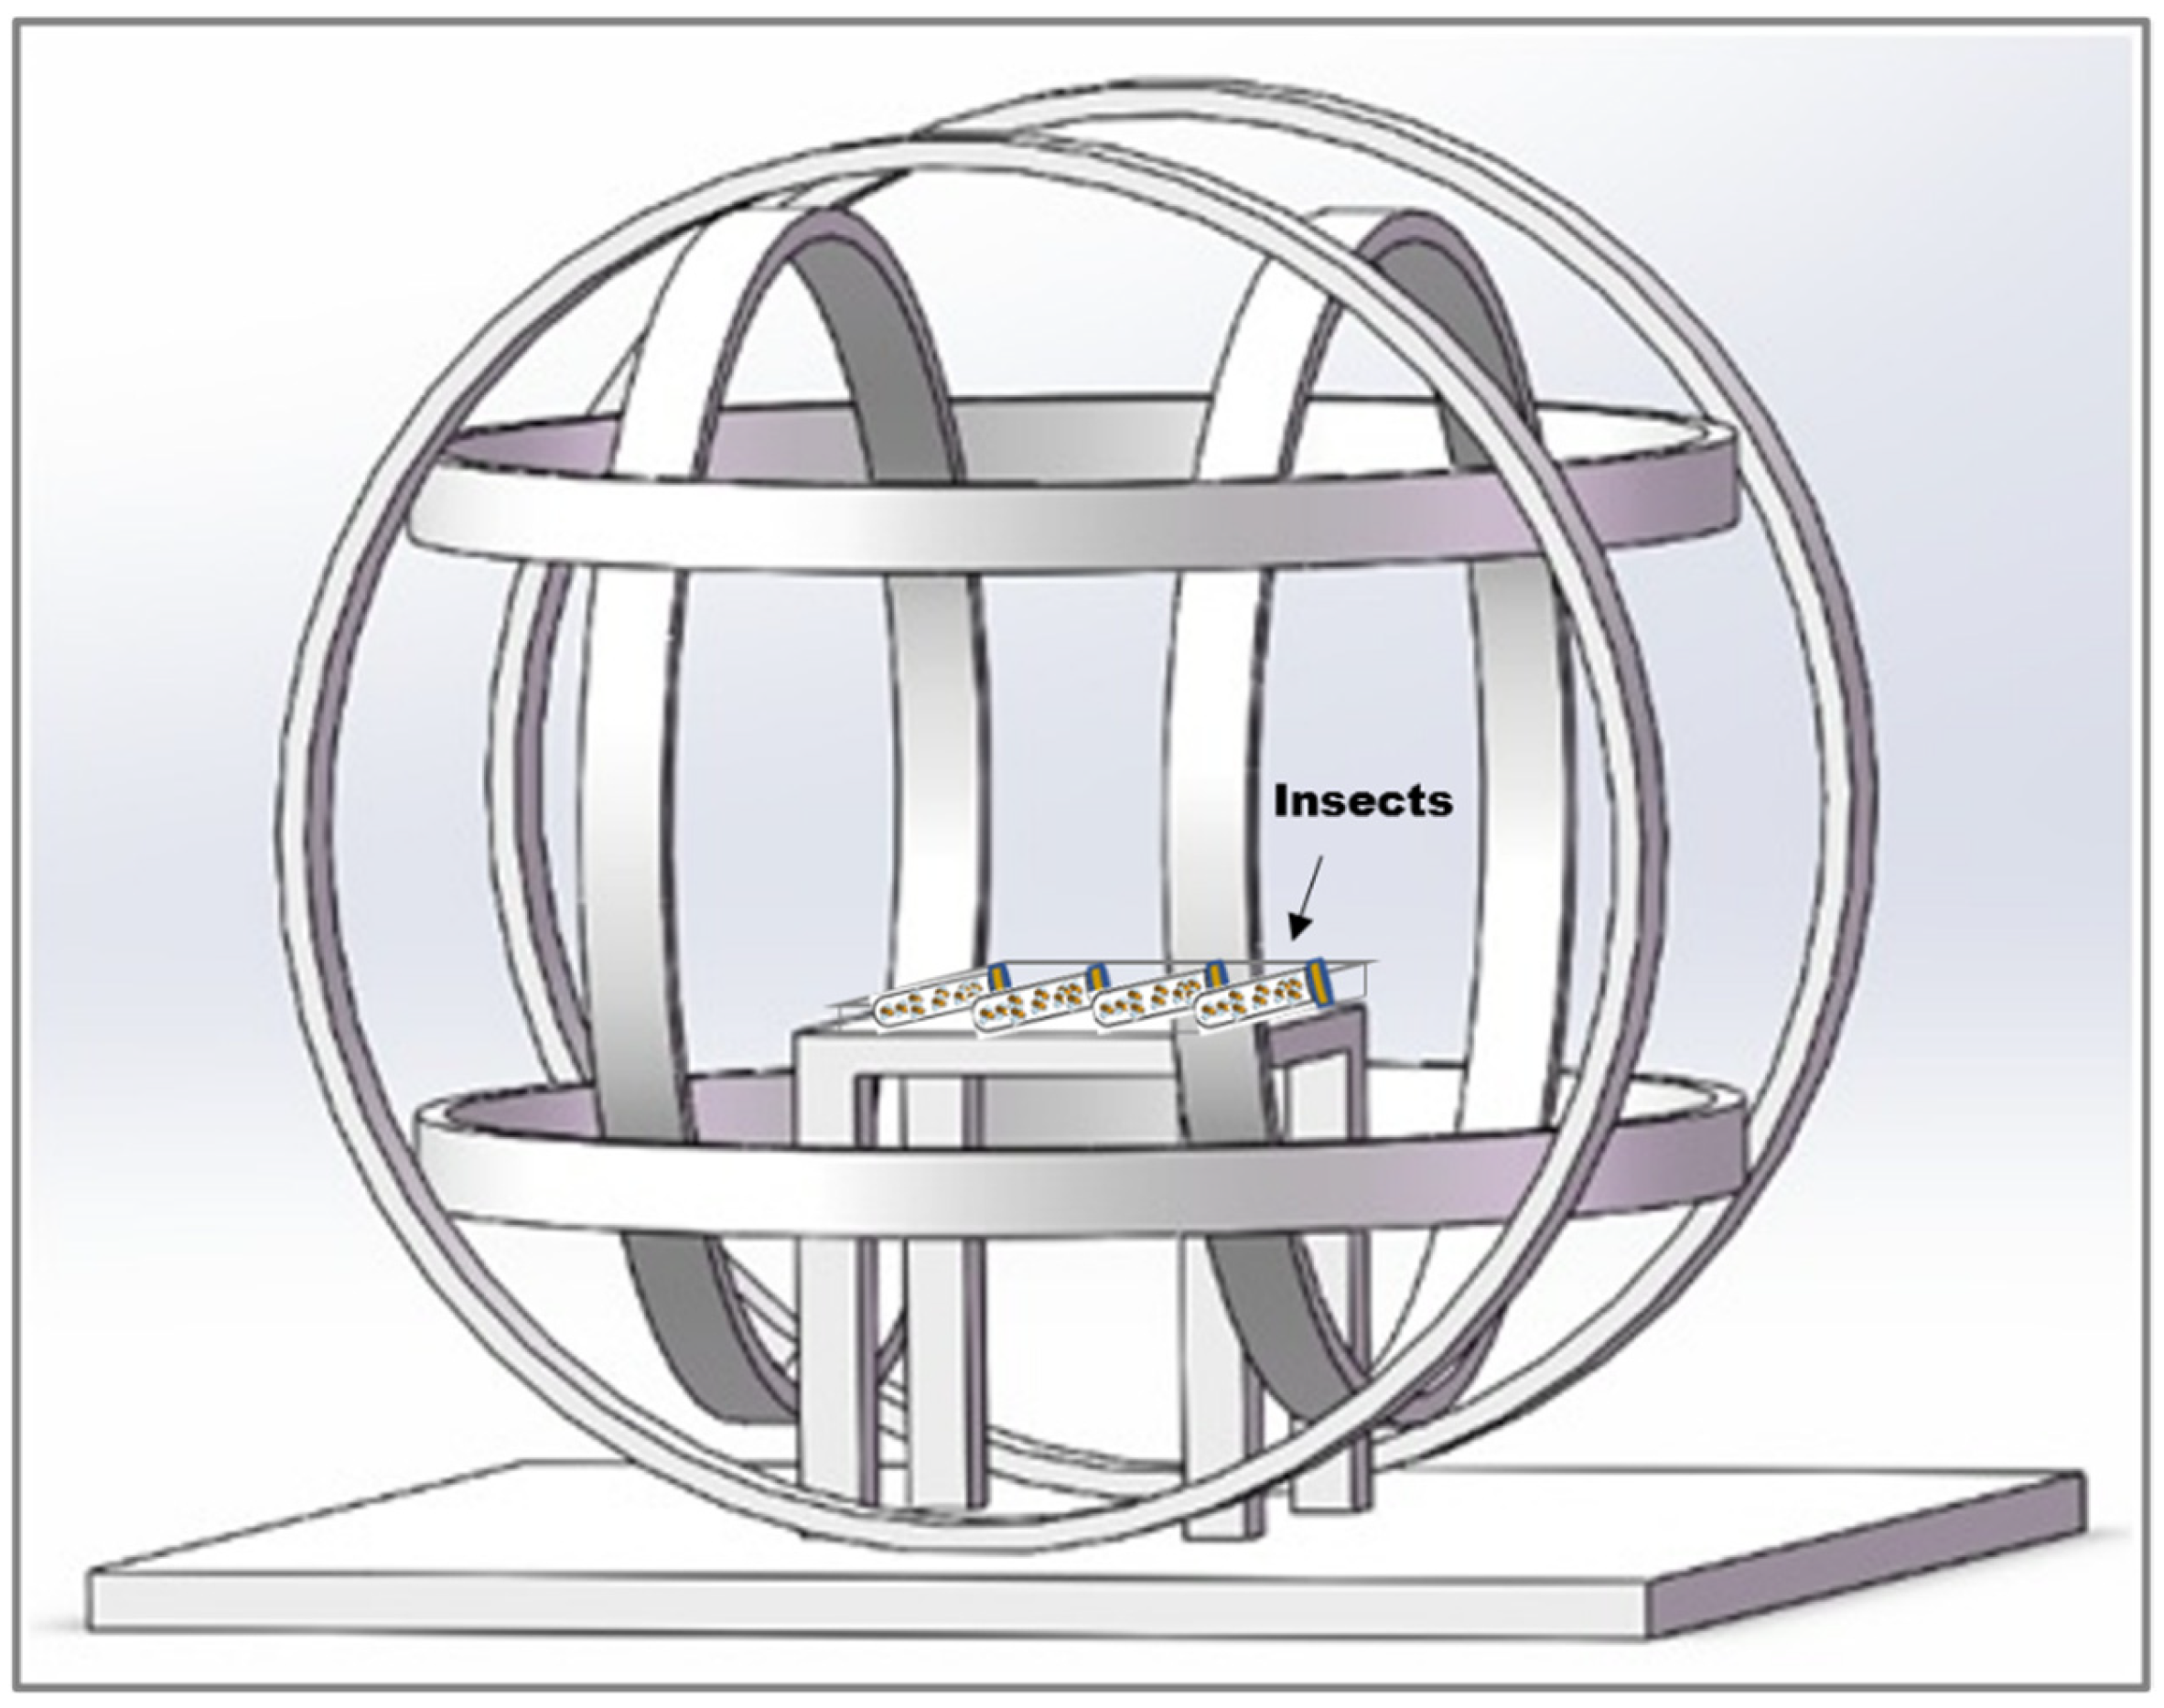
The experiment was conducted in a laboratory in Beijing (39°59′14″ N, 116°19′21″ E), where the local geomagnetic field (GMF) has an intensity of 52,487 ± 841 nT, a declination of 5.30 ± 0.59°, and an inclination of 56°29′ ± 1.02°. To create a hypomagnetic field (HMF), we employed three sets of Helmholtz coils, each powered independently to generate an artificial field that precisely opposed and offset each vector component of the local GMF to nullify the total intensity of the GMF. This setup produced a spherical hypomagnetic environment of 300 × 300 × 300 mm3 with an average residual intensity < 500 nT (Figure 2). The external diameter of the HMF system was 1200 mm, and insects were placed on the wooden table in the middle of the Helmholtz coils during experiments. A fluxgate magnetometer (Honor Top model 191A, Qingdao Zhongyu Huantai Magnetoelectric Technology Co., Ltd., Qingdao, China, sensitivity ±1 nT) was used to calibrate and verify the HMF intensity twice daily, both before and after experimental sessions.
D. melanogaster flies used for the HMF exposure were 3–10-day-old adult male flies, from fh-RNAi flies. The flies were housed in groups of 20 per vial, with three replicate groups per condition. Each condition consisted of three independent biological replicate vials (20 flies per vial) within one experimental cycle. Each experimental cycle consisted of a 72 h exposure to either the HMF or the normal GMF, under a light–dark regimen of 12 h of light followed by 12 h of darkness.

2.4. Synchrotron Radiation-Based X-Ray Fluorescence (SR-XRF) and Elemental Distribution and Quantitative Measurements of Iron/Sulfur in Glial and Retinal Cells

To investigate the composition and spatial distribution of iron and sulfur within the microregions of living tissues, brain and eye tissues from D. melanogaster male flies exposed to either HMF or GMF conditions were analyzed using microbeam X-ray fluorescence (μ-XRF). The experiments were conducted at the wiggler beamlines 6-2, 10-2 at BL15U1 of the Shanghai Synchrotron Radiation Facility (SSRF) (Shanghai, China). The BL15U1 beamline enables multi-element mapping and quantitative analysis at the sub-parts per million level, utilizing a micron or sub-micron beam. During analysis, the sample was oriented at a 45° angle to the incident X-ray beam, while the X-ray Vortex-90EX Silicon drift detector (SDD) is perpendicular to the beam incidence. The ion chamber is used to monitor the incident photon intensity. An integrated optical microscope facilitated sample observation. The µ-XRF scanning was performed in stepwise mode, with the spectrum for each pixel saved for subsequent quantitative analysis. For data analysis, the software packages GeoPIXE and PyMCA 5.9.7rc1 were employed [15,16,17]. Regions of interest (ROIs) on the spectra can be selected. Once ROIs are created, they are applied across all collected data points to generate two-dimensional, multi-element maps visualizing the distribution of the target elements.

2.5. ROS Detection Using DHE Staining and Confocal Microscopy

A 2 mM solution of dihydroethidium (DHE) was prepared using DMSO as the solvent. PBS buffer (500 μL) was combined with 2 μL of DHE stock (2 mM) to achieve a final working concentration of 8 μM. D. melanogaster male flies of appropriate genotype and age were selected and transferred using tweezers to a glass 9-well plate containing PBS for dissection under a stereomicroscope. The dissected brain and eye tissues were then placed into a 96-well plate containing DHE solution. The DHE solution was removed, and the samples were washed twice with fresh PBS buffer. Subsequently, 200 µL of 4% PFA solution was added for fixation at room temperature for 5 min. Following suctioning of the fixative, the samples were washed twice with PBS before secondary dissection, and film sealing and imaging were performed. Five biological replicates were conducted for each treatment.
At least 5–10 male flies per genotype were scanned. The samples were analyzed using an LSM 510 confocal microscope (Zeiss, Oberkochen, Germany). All images were acquired using the same exposure time, light intensity, and filter settings across all conditions. Image analysis was performed in Fiji 2.0.0 [18]. For each sample, the region of interest (ROI) was defined consistently for the corresponding brain or eye tissue, and mean fluorescence intensity was measured within the ROI after applying the same analysis workflow across groups. Background signal was measured from an adjacent non-tissue region and subtracted before quantification. Image contrast was adjusted only for visualization and was not used for quantitative measurement.

2.6. RNA-Seq and Differential Gene Expression Analysis

Total RNA was extracted from heads of 3–8-day-old adult male flies. For each genotype, three biological replicates with ten heads of flies for each replicate were sent to Novogene for RNA-Seq analysis using TRNzol Universal Reagent (Tiangen Biotech, Beijing, China, Cat. No. DP424) according to the manufacturer’s instructions. RNA quantity and integrity were verified on a Nanodrop 2000 (Thermo, Waltham, MA, USA) for the purpose of library preparation. Sequencing libraries were constructed with the Fast RNA-seq Lib Prep Kit V2 (ABclonal, Wuhan, China, Cat. No. RK20306) following the supplier’s protocol. The clean reads were aligned to the corresponding reference genome using HISAT2 (v2.2.1). Read counts for each gene were obtained with feature Counts (v2.0.6), and gene expression levels were estimated as fragments per kilobase of transcript per million mapped reads (FPKM). Differentially expressed genes (DEGs) between groups were identified using the R Package DESeq2 (v1.42.0), with Benjamini–Hochberg correction to control the false discovery rate. Genes with adjusted p value (padj) ≤ 0.05 and |log2(FoldChange)| ≥ 1 were considered significantly differentially expressed. Functional enrichment analyses of DEGs were performed using cluster Profiler (v4.8.1) for Gene Ontology (GO) and KEGG pathway enrichment. Gene set enrichment analysis (GSEA) was conducted with the GSEA software (v4.3.2) using default parameters and curated GO/KEGG gene sets.

2.7. Statistics

Data analysis was performed using SPSS version 23.0 software (IBM SPSS Statistics Inc., Chicago, IL, USA). A uniform intensity threshold was defined from the background signal of each elemental map, and the area of pixels above this threshold was calculated as a semi-quantitative proxy for the spatial extent of detectable elemental signal. This metric reflects tissue-level signal-positive area and does not resolve subcellular localization, chemical speciation, or definitive intracellular redistribution.
Based on this, normality and homogeneity of variance tests were performed for iron and sulfur content and distribution counts, respectively. When parametric tests were feasible, one-way ANOVA followed by Tukey’s post hoc multiple comparisons was conducted to evaluate the effects of different magnetic fields and genotypes on element content and distribution in brain and eye tissues. The Shapiro–Wilk test was used to test the normality of the data. The data conforming to the normal distribution were expressed as mean ± SEM (standard error of the mean). Outliers were dropped if they were observed due to incorrect entry or measurement of the data. The independent-samples t-test was performed to evaluate the effects of different magnetic fields and genotypes on ROS levels in brain and eye tissues. One-way repeated-measures ANOVA with Tukey’s post hoc test was used to measure the effects of frataxin gene silencing on the distribution and content of iron/sulfur in brain or eye tissues of D. melanogaster under GMF or HMF. p values < 0.05 were considered statistically significant.

3. Results

3.1. Analysis of Iron/Sulfur Elemental Distribution and Content Based on Frataxin Silencing Model Under GMF or HMF

3.1.1. Iron Elemental Analysis

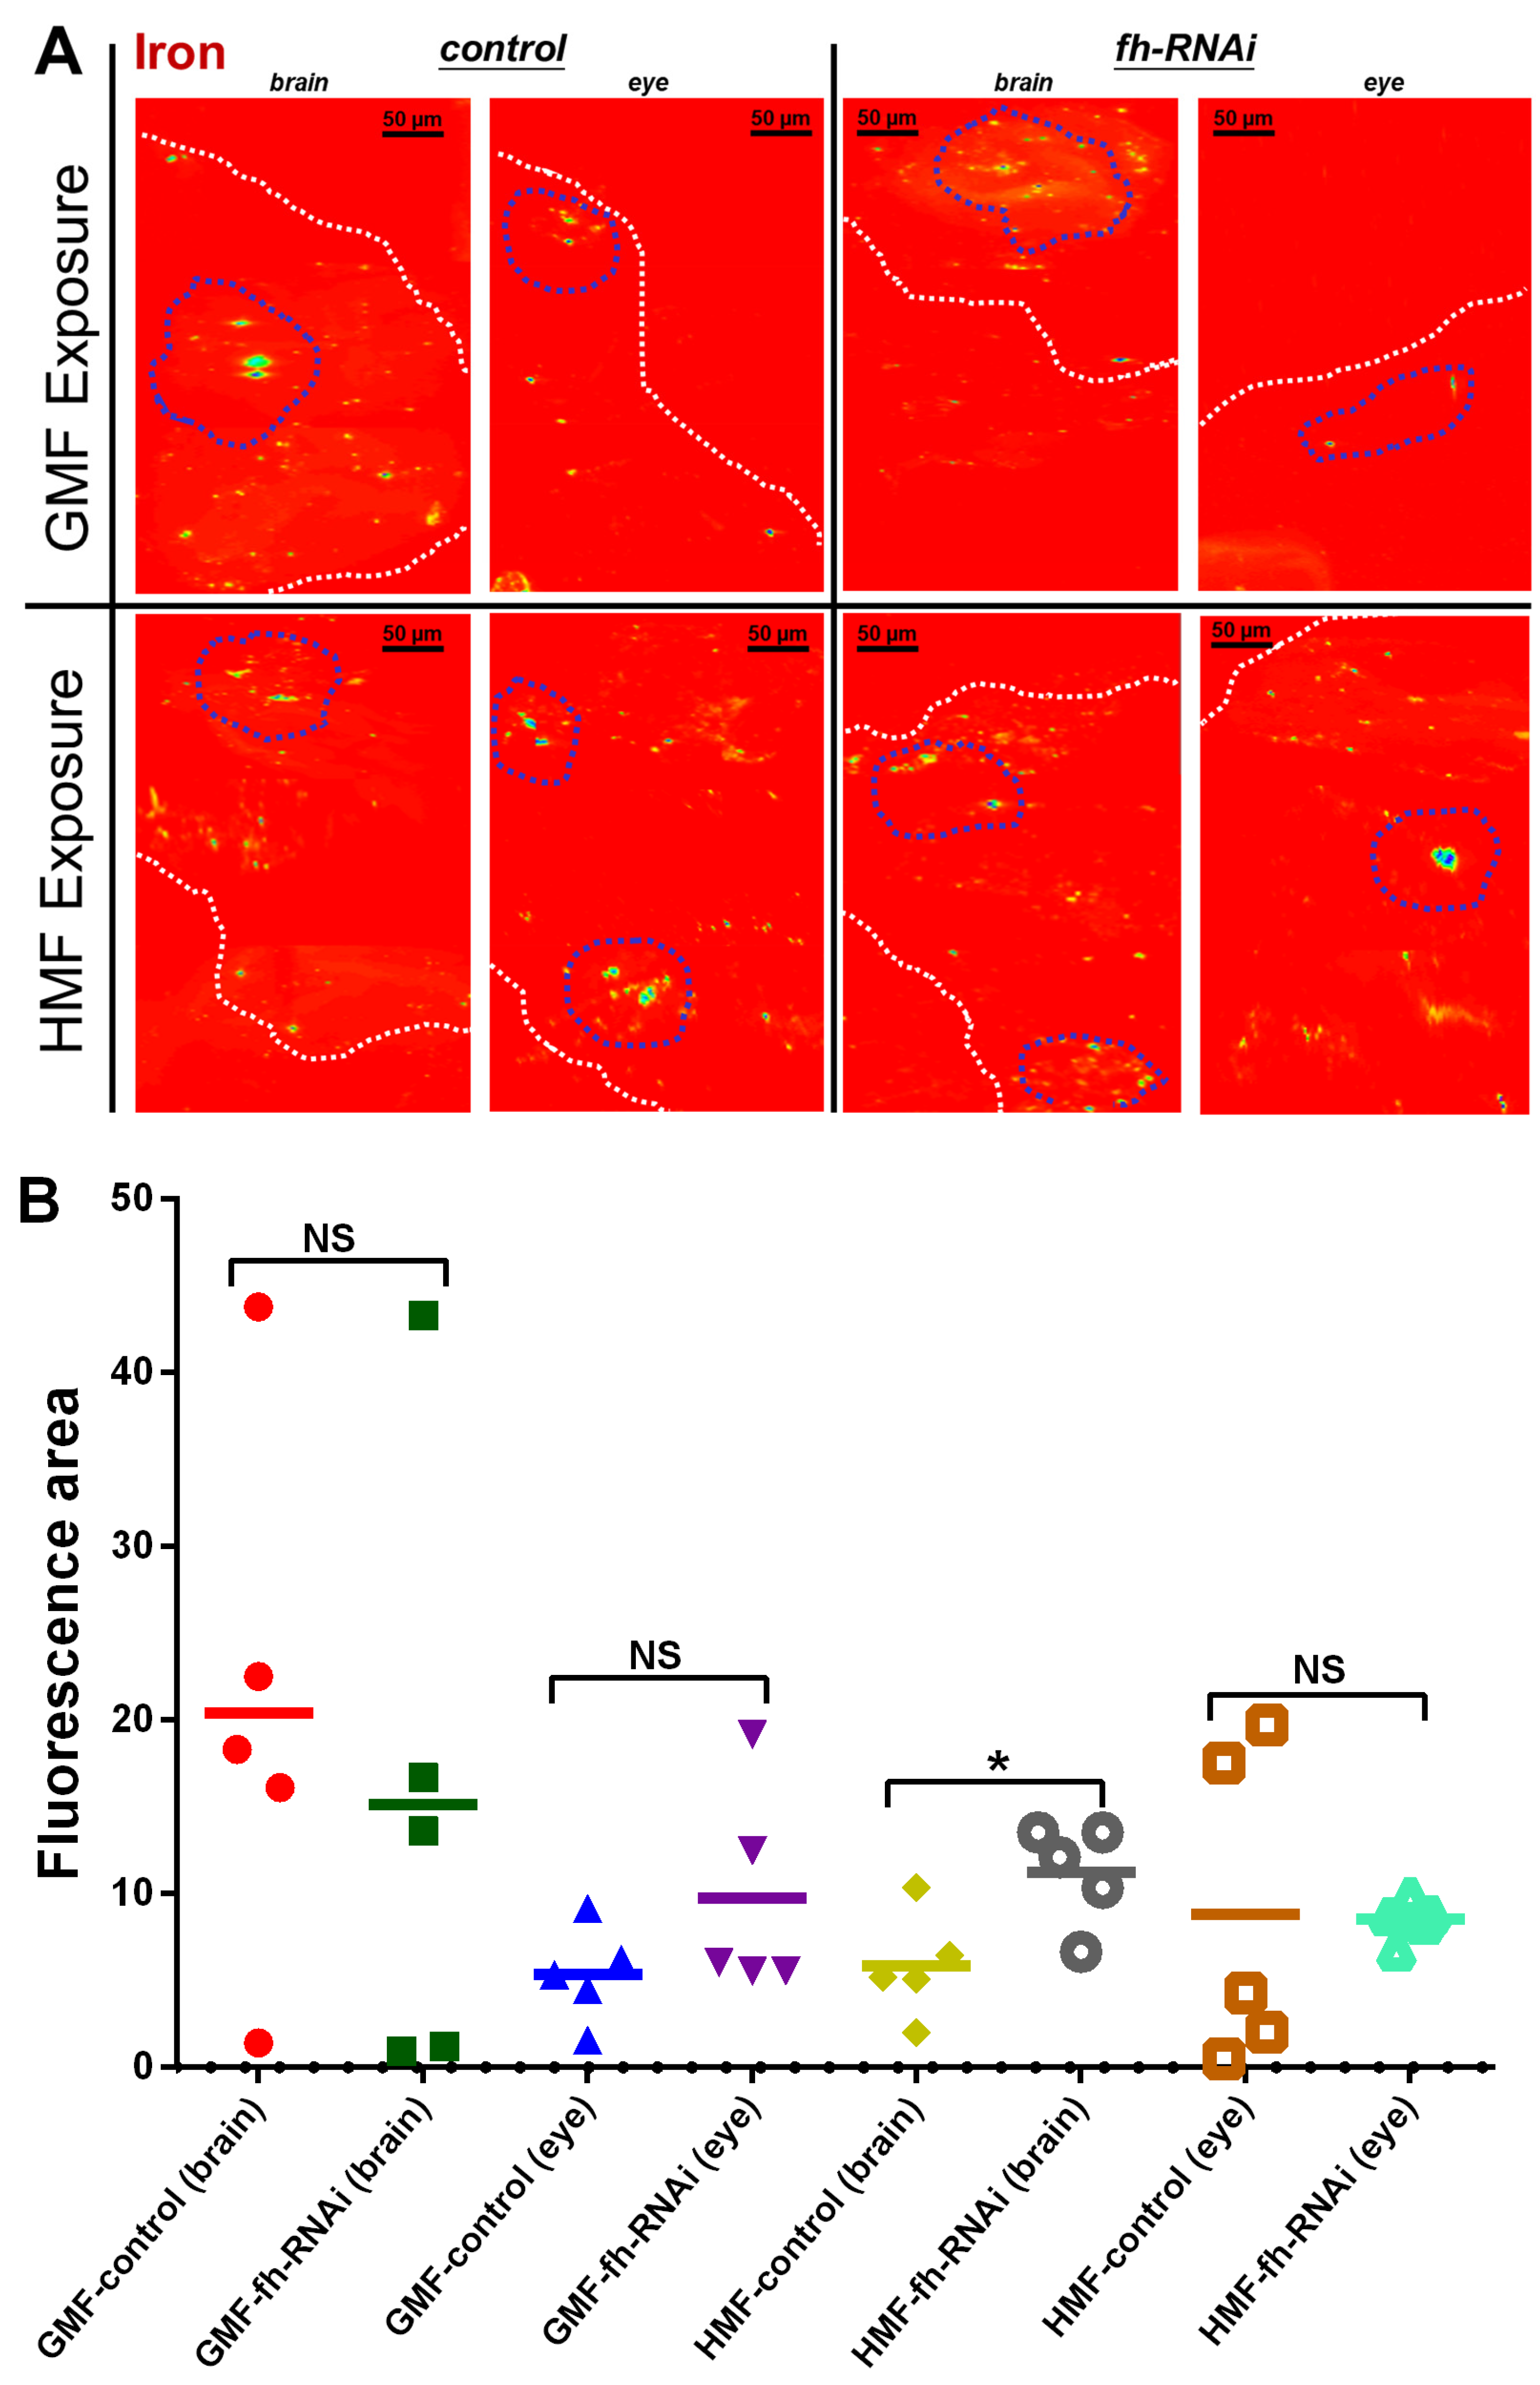
To determine whether HMF exposure alters iron/sulfur homeostasis in a frataxin-deficient insect system, we examined elemental spatial distribution using SR-XRF mapping (Figure 3A), followed by quantitative assessment of total elemental content (Figure 4). This two-level analysis enables us to unify the spatial distribution and content variations of iron/sulfur elements, thereby obtaining an intuitive understanding of in situ profiles of iron/sulfur elements in the frataxin-deficient model under HMF exposure. In this study, as each brain sample was taken from the whole brain of an insect, the image shows a top-down view of the head from left to right. Compared with the control group, the frataxin-silenced group, either in brain or eye tissue, showed no significant difference in iron elemental distribution (p > 0.05) and fluorescence area (p > 0.05) under GMF exposure (Figure 3B). However, in brain tissues, compared with the control group, iron elemental distribution was significantly decreased (p < 0.05) in frataxin-silenced flies under HMF exposure, and fluorescence area or total fluorescence intensity was significantly increased (p < 0.05) in the frataxin-silenced group under HMF exposure (Figure 3B). In contrast, in eye tissues, neither a significant difference in iron elemental distribution (p > 0.05) nor in fluorescence area (p > 0.05) in frataxin-silenced flies was revealed under HMF exposure (Figure 3B).
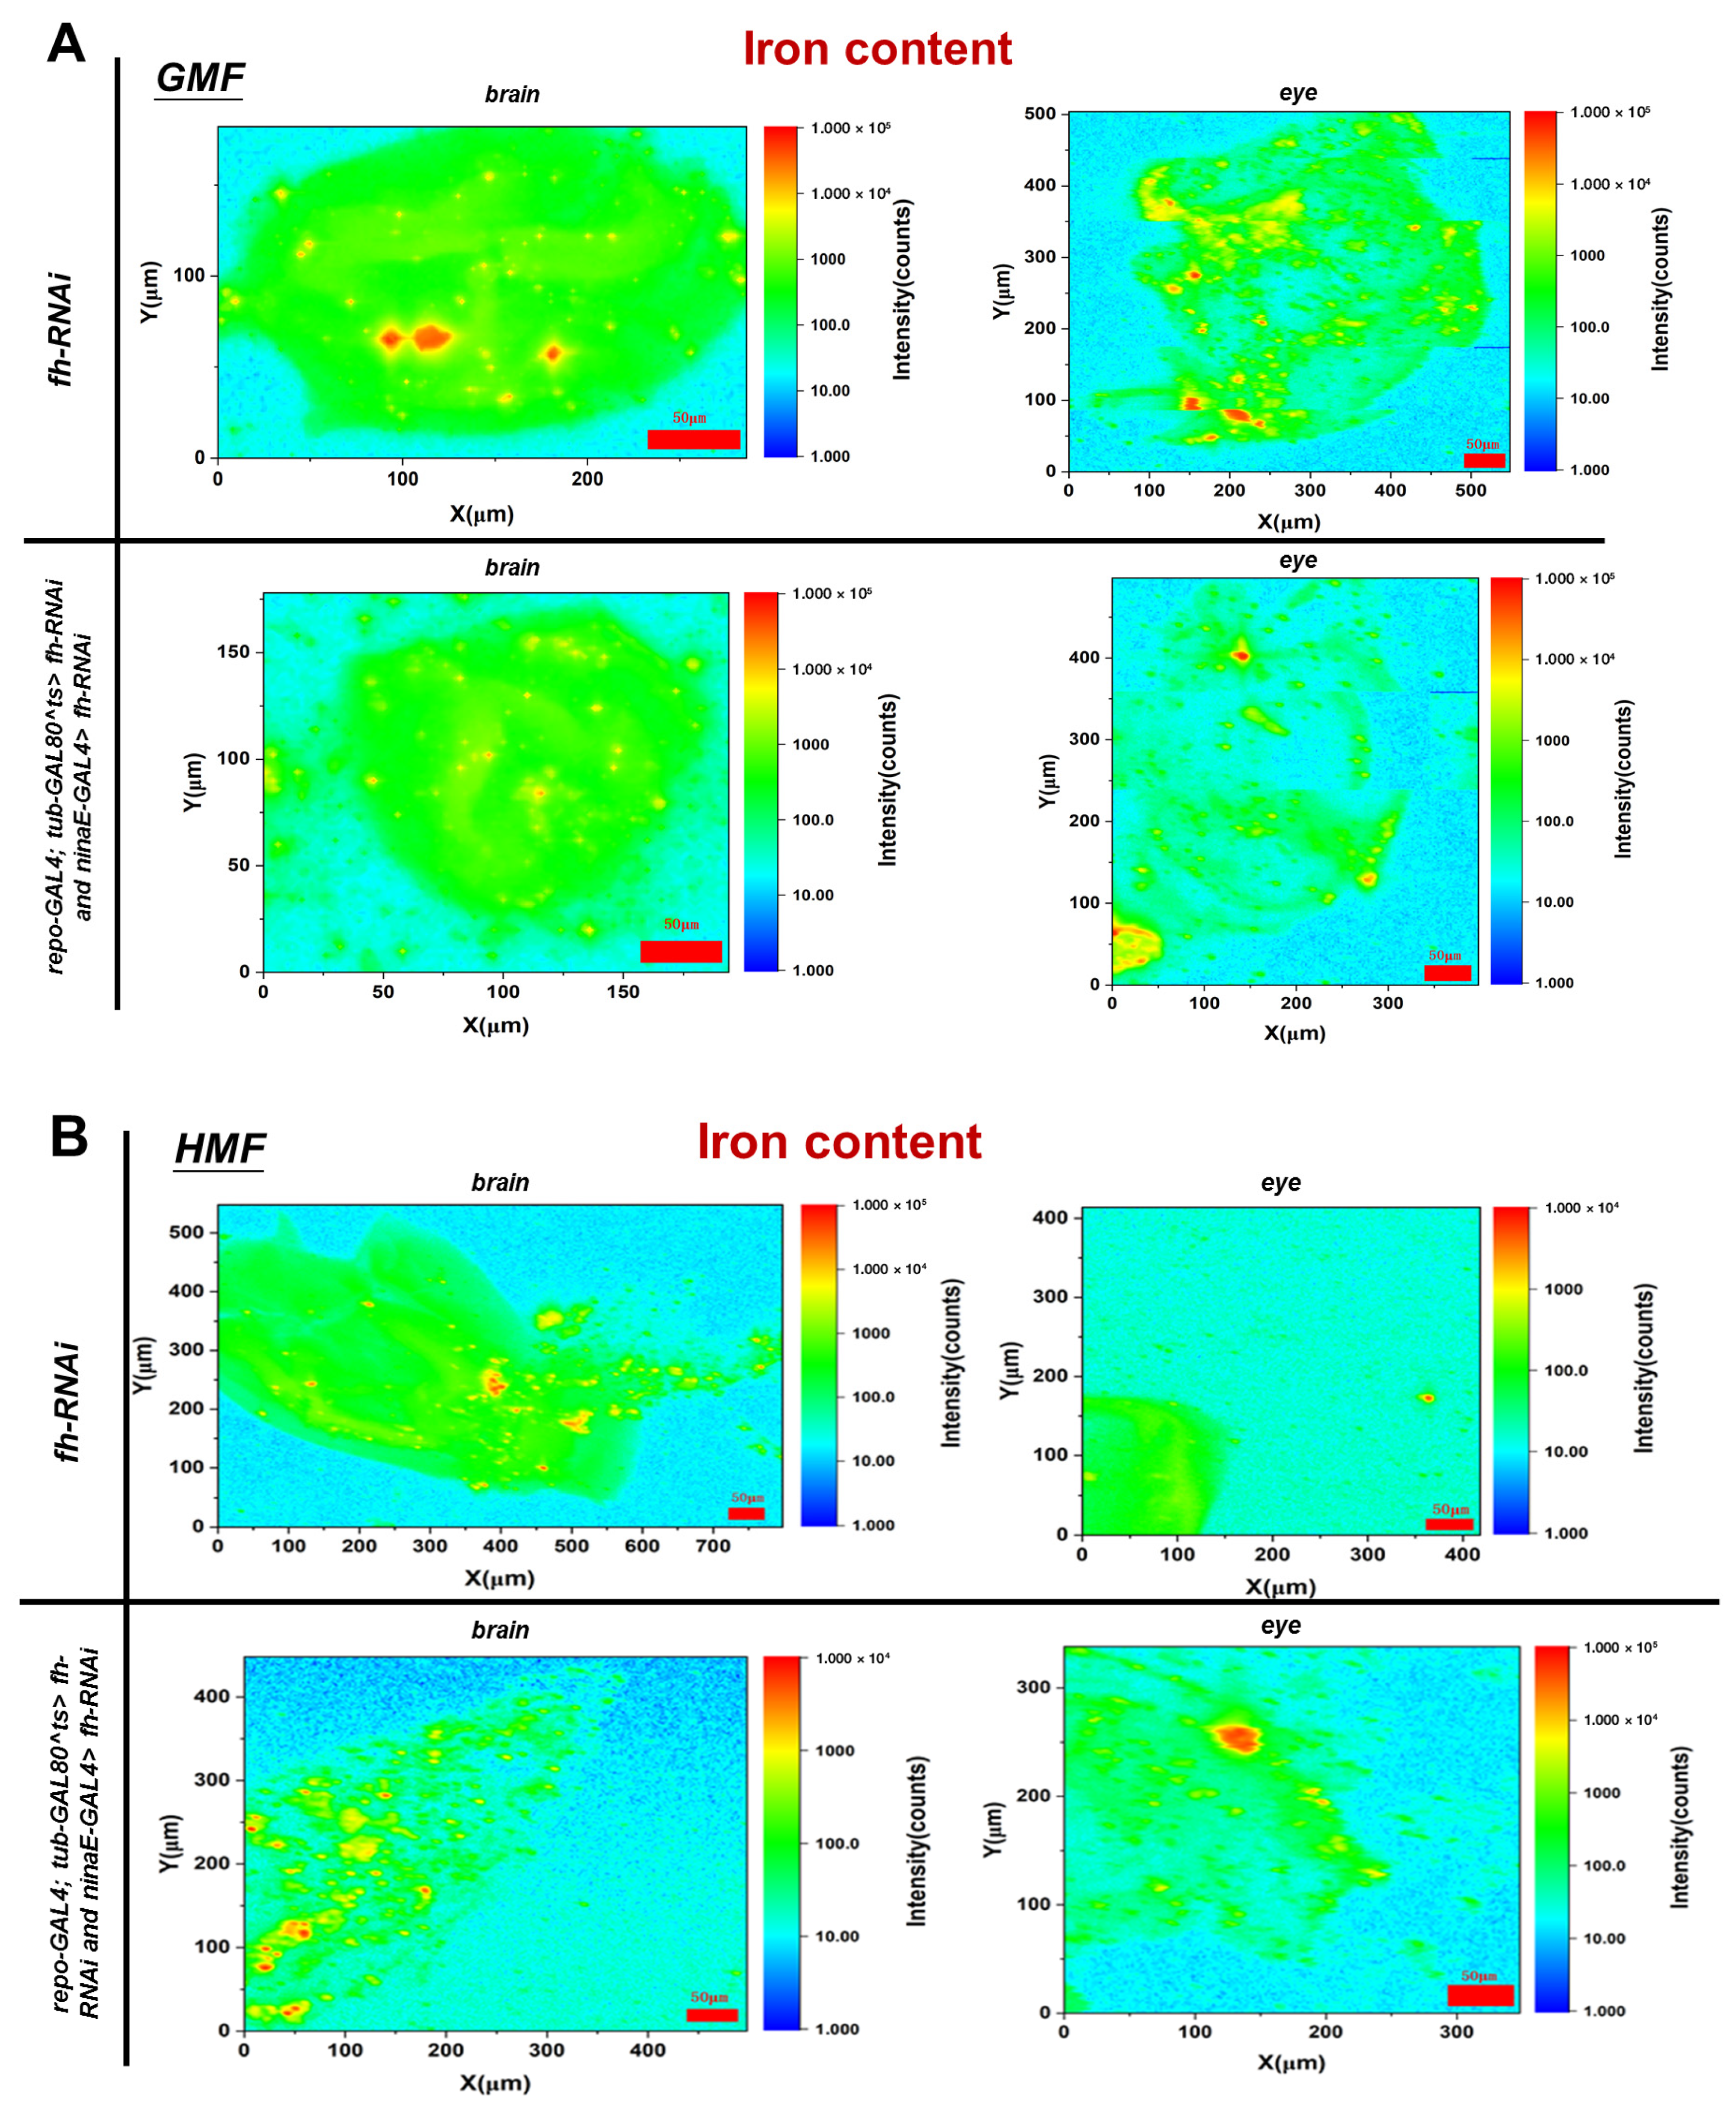
Compared with the control group, the iron content in brain and eye tissues after frataxin silencing under GMF exposure decreased by 35.73% (p < 0.05) and 16.51% (p < 0.05), respectively (Figure 4A). Compared with GMF, the iron content in brain tissues of frataxin-silenced flies increased by 46.71% (p < 0.05), while that in eye tissues after frataxin silencing decreased by 24.57% (p < 0.05) under HMF exposure (Figure 4A vs. Figure 4B).

3.1.2. Sulfur Elemental Analysis

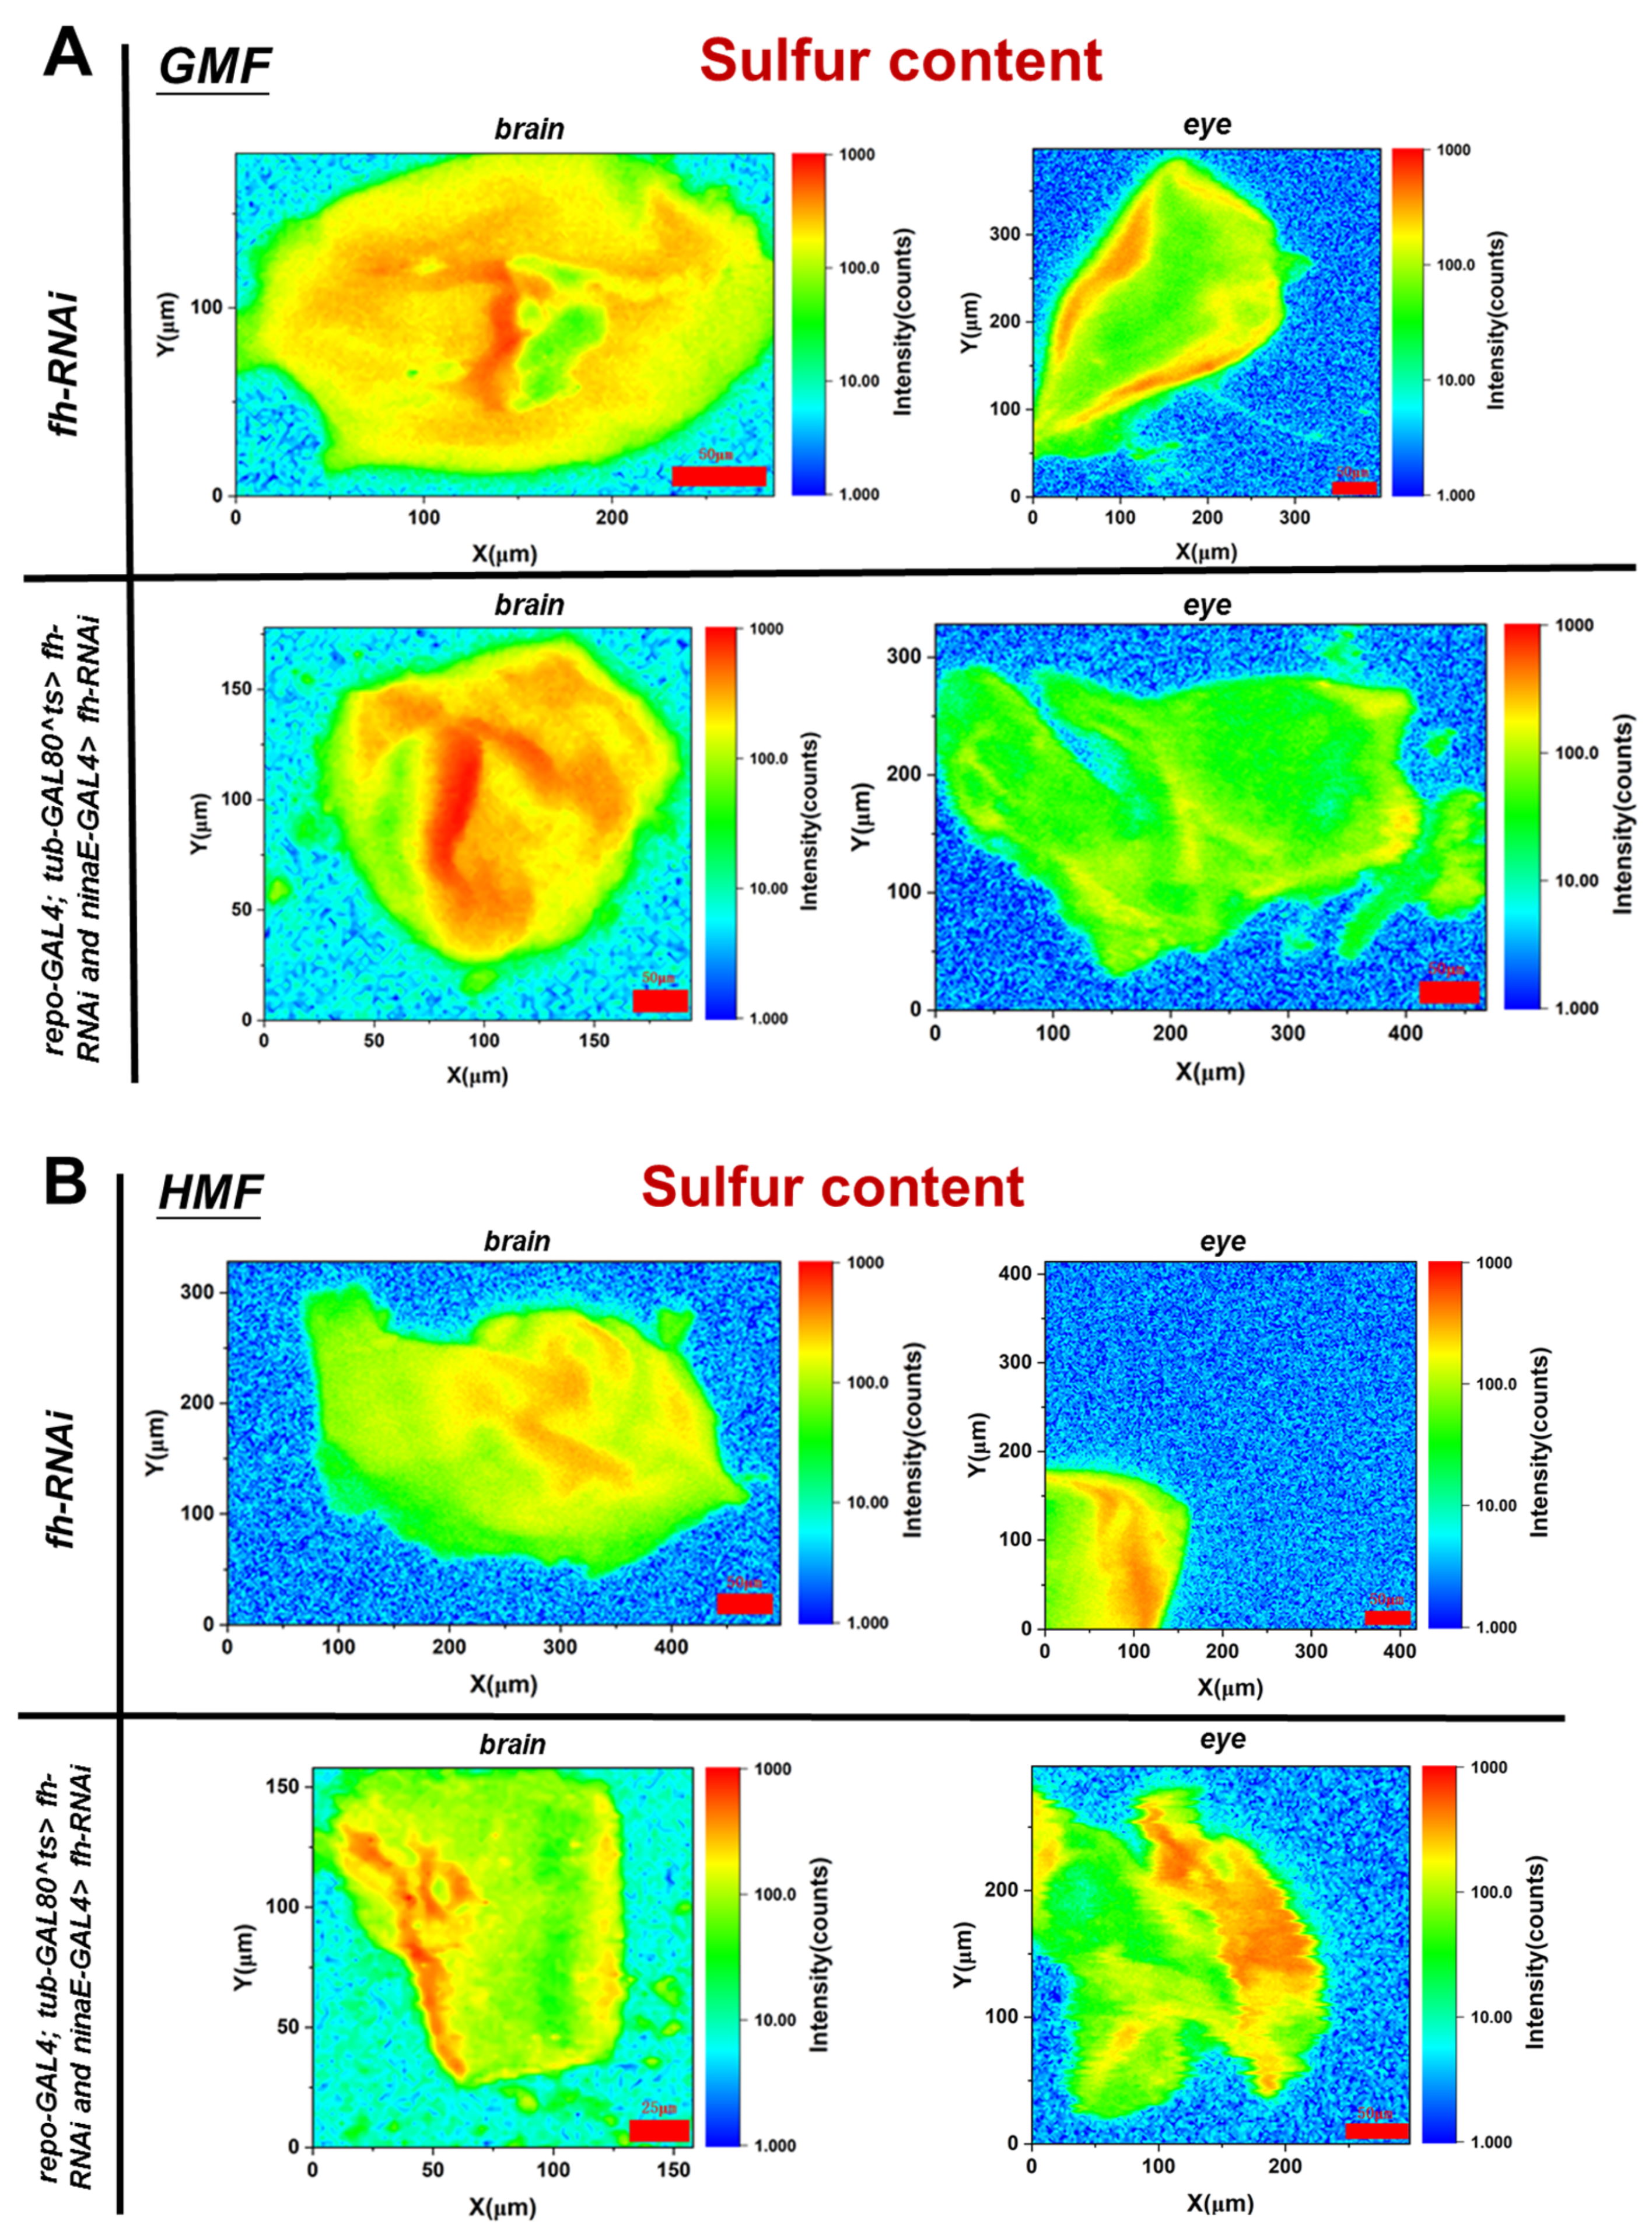
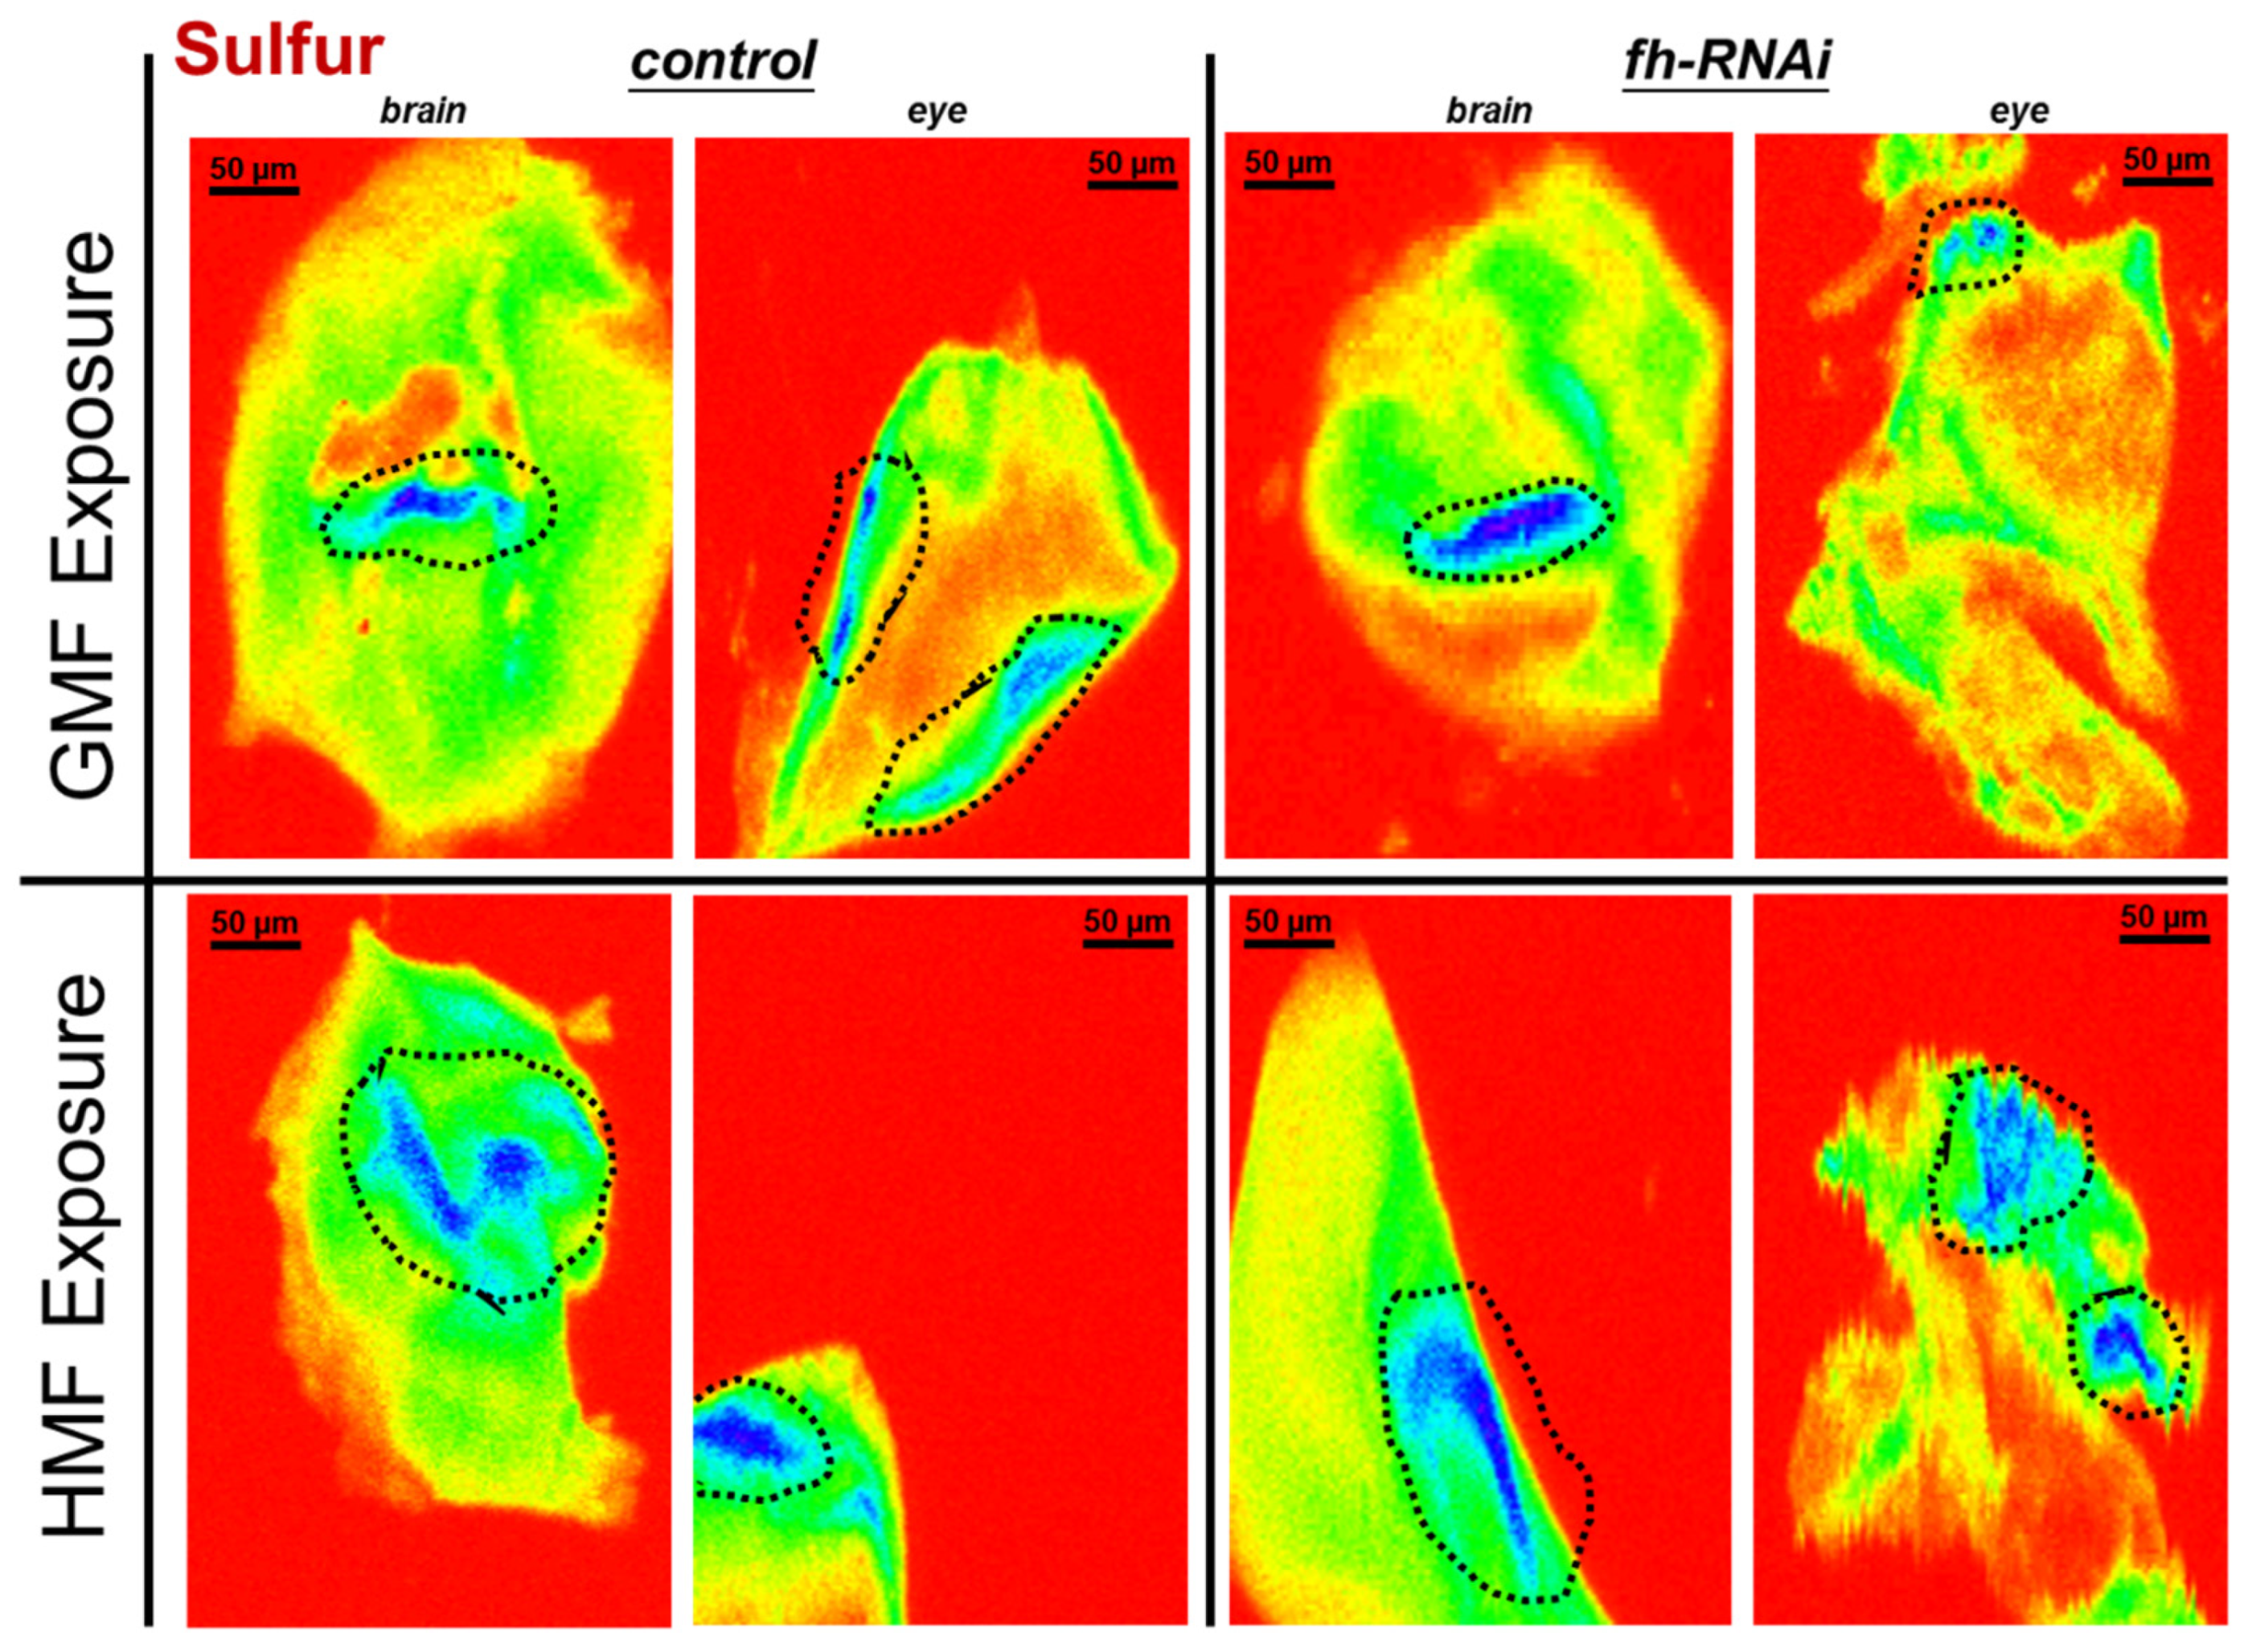
Compared with the control group, the frataxin-silenced group showed no significant difference in sulfur signal-positive area (distribution proxy) in brain or eye tissues (p > 0.05) and no significant difference in signal-positive area in either tissue (p > 0.05). Compared with GMF exposure, frataxin silencing either in brain or eye tissues showed no significant difference in sulfur elemental distribution (p > 0.05) or fluorescence area (p > 0.05) under HMF exposure (Figure 5).
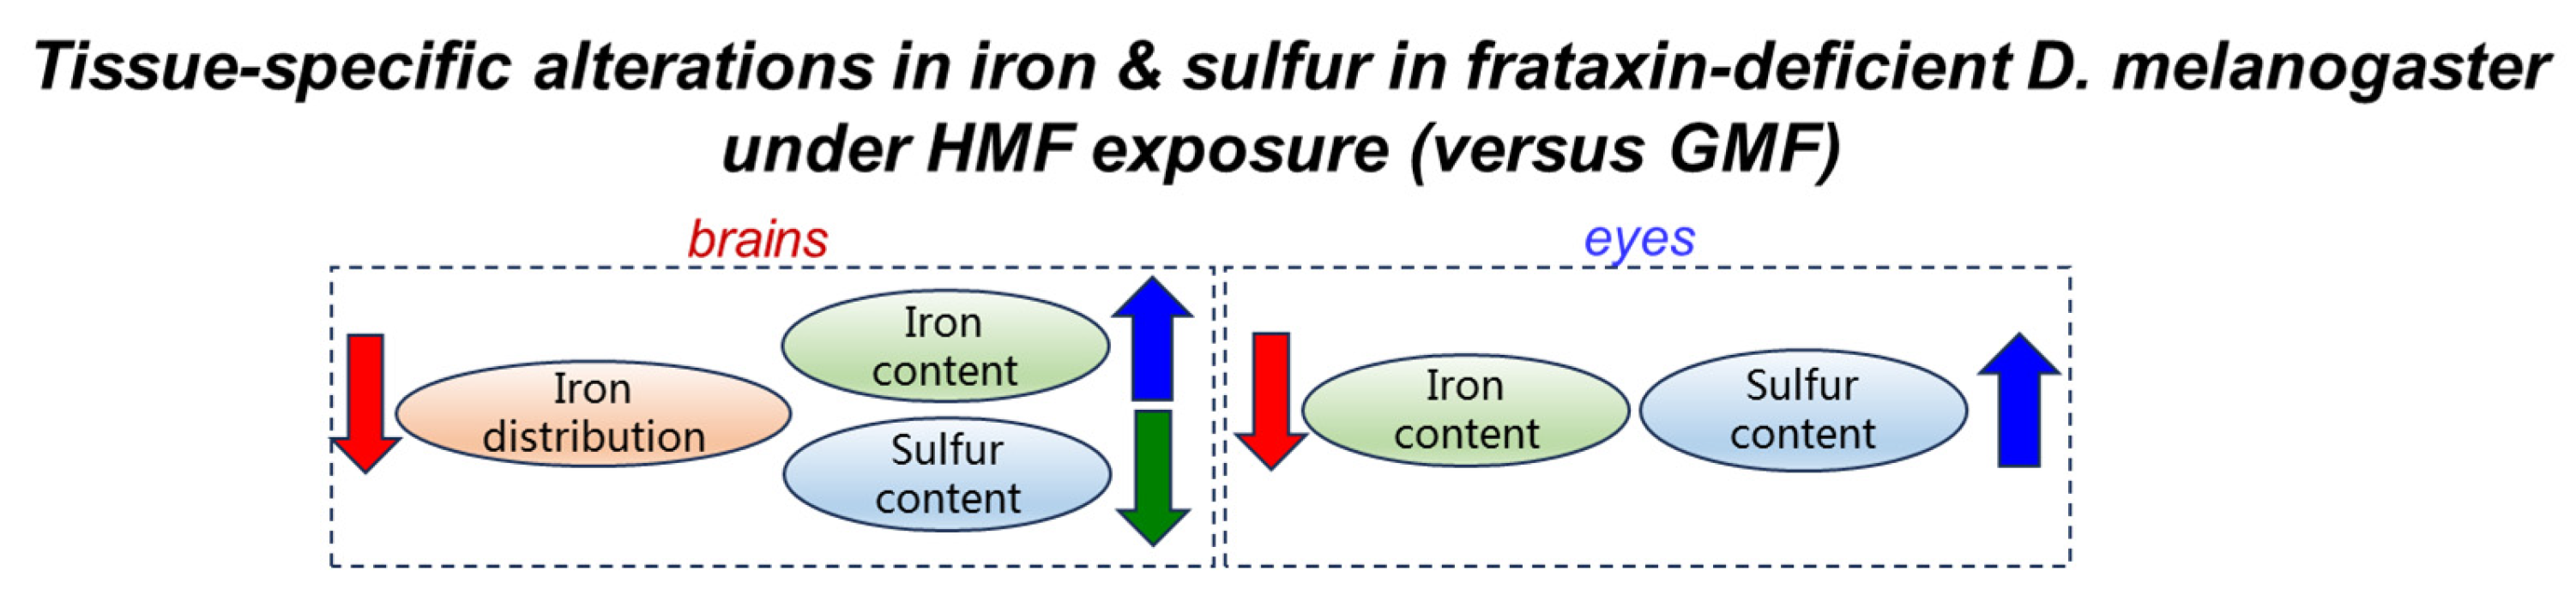
Compared with the control group, the sulfur content in eye tissues after frataxin silencing decreased by 18.76% (p < 0.05), and no significant difference in sulfur content in brain tissues was observed with the frataxin-silenced group (p > 0.05) (Figure 6A). Compared with GMF exposure, the sulfur content in brain tissues after frataxin silencing was reduced by 40.48% (p < 0.05), and that in eye tissues in the frataxin-silenced group was elevated by 65.05% (p < 0.05) under HMF exposure (Figure 6B). Together, these data demonstrate that HMF exposure induces tissue-specific alterations in iron/sulfur elemental distribution and total elemental content in a frataxin-deficient insect system (Figure 7), suggesting that magnetic environmental stress may exacerbate iron/sulfur dyshomeostasis through certain mechanisms not yet fully resolved.

3.2. ROS Detection Using DHE Staining

DHE is a lipophilic, cell-permeable probe that is itself non-fluorescent. Upon oxidation by intracellular oxidants, it is converted into fluorescent oxidation products. In the present study, DHE fluorescence was used as an indicator of oxidative-stress-associated signal, rather than as a specific readout of any single ROS. Ethidium then binds to DNA, producing red fluorescence (excitation/emission 520/610 nm) that serves as an indicator of intracellular ROS levels. For samples stained with DHE, the mean fluorescence intensity provides a more appropriate measurement of ROS levels.
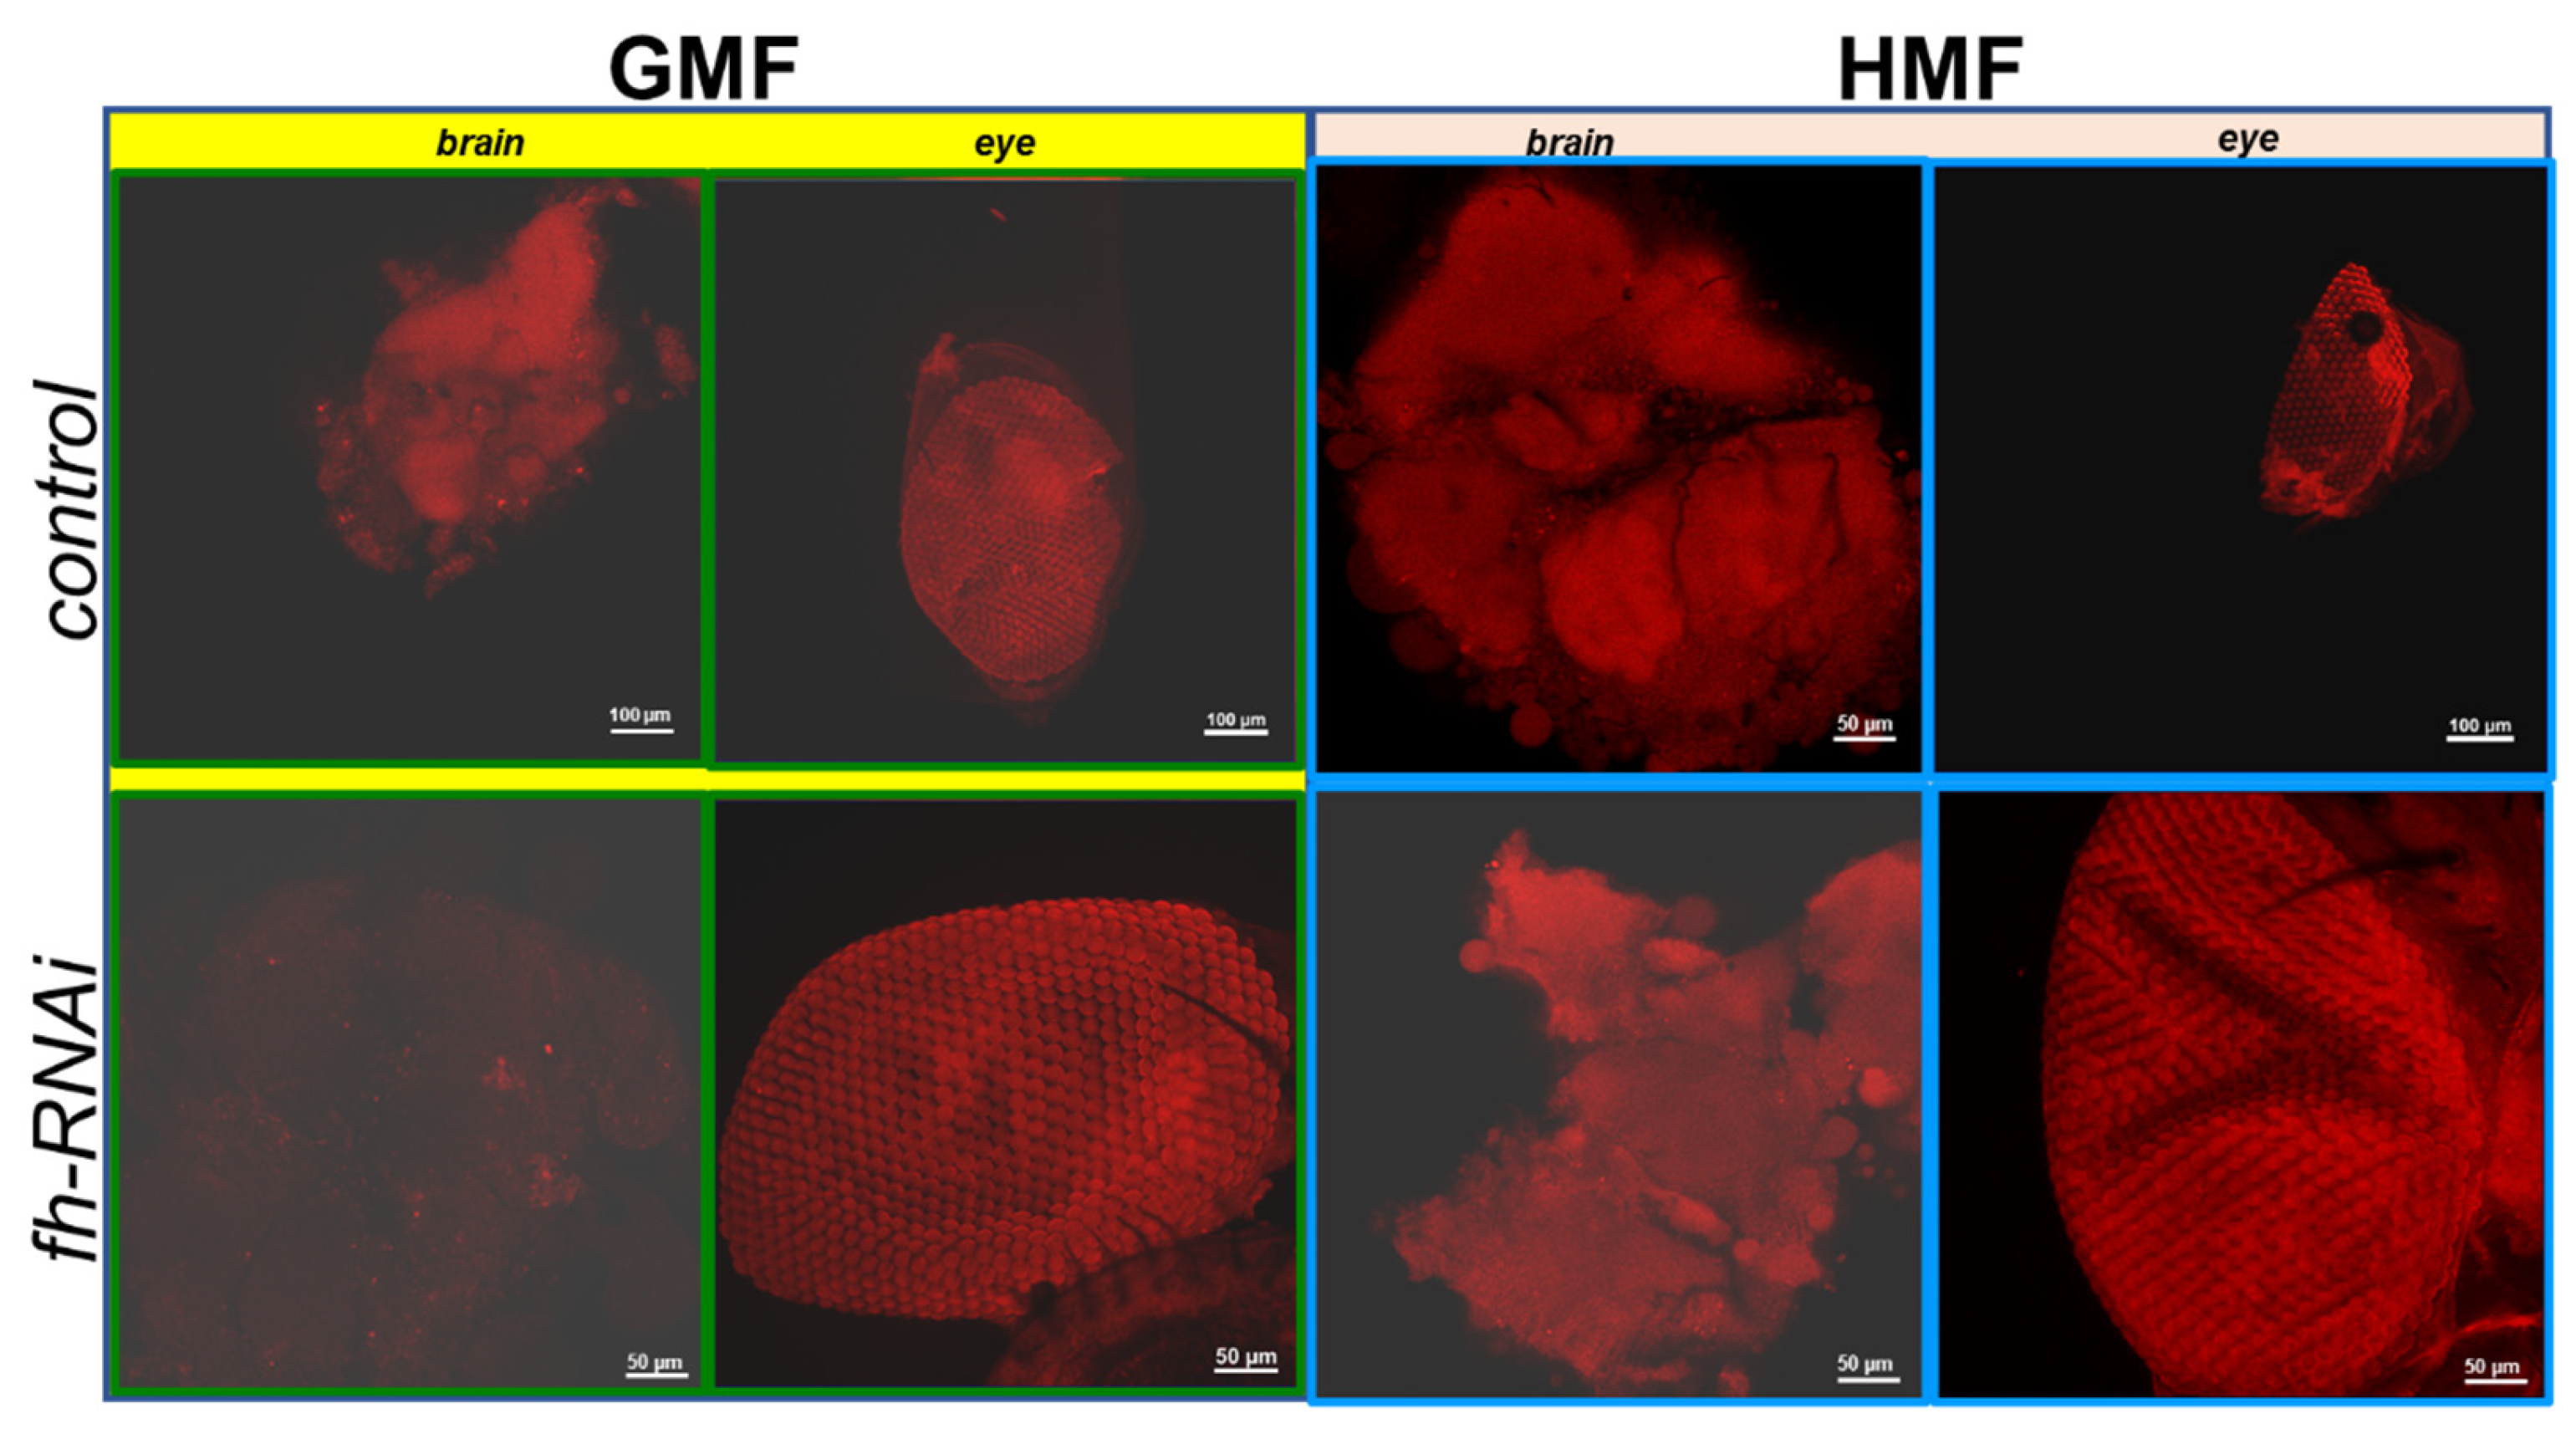
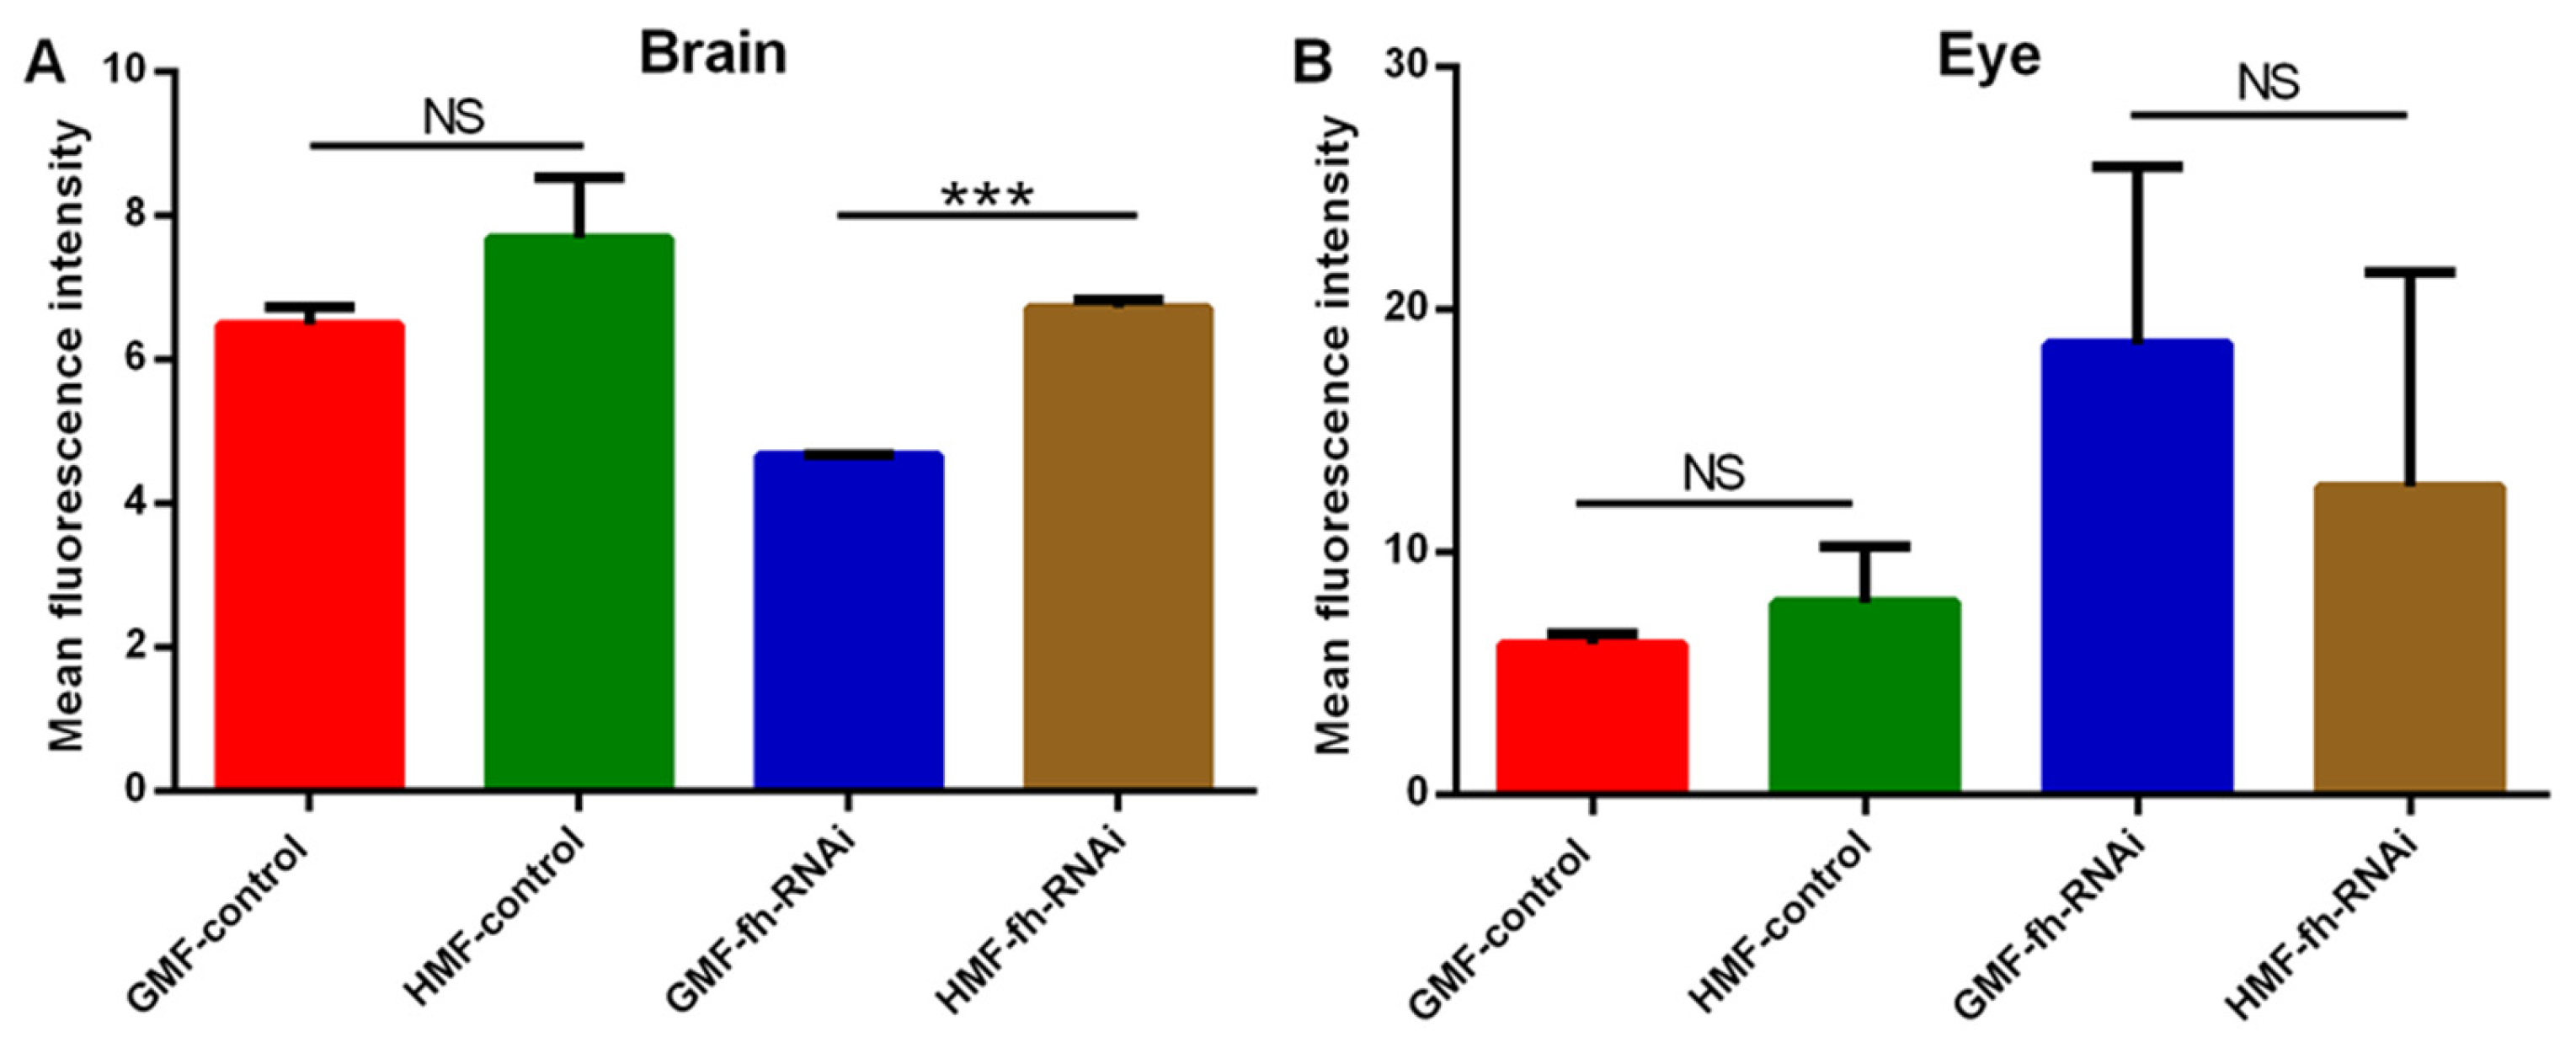
As shown in brain tissues (Figure 8 and Figure 9), no significant difference in ROS levels was discovered between the GMF control and the HMF control groups (p > 0.05). However, compared with GMF exposure, ROS levels were significantly elevated in frataxin-silenced brain samples under HMF conditions (p < 0.001; Figure 9). Corresponding confocal images showed this rise as more intense red fluorescence (Figure 5). In contrast to brain samples, it was found that in eye tissues, compared with GMF exposure, ROS levels revealed no significant difference either with the control group (p > 0.05) or with the frataxin-silenced group under HMF exposure (p > 0.05) (Figure 9), which was further confirmed by corresponding confocal microscopy (Figure 8).

3.3. Analysis of DEGs Under HMF Exposure Specifically in Iron Metabolism, ROS Production and Antioxidation

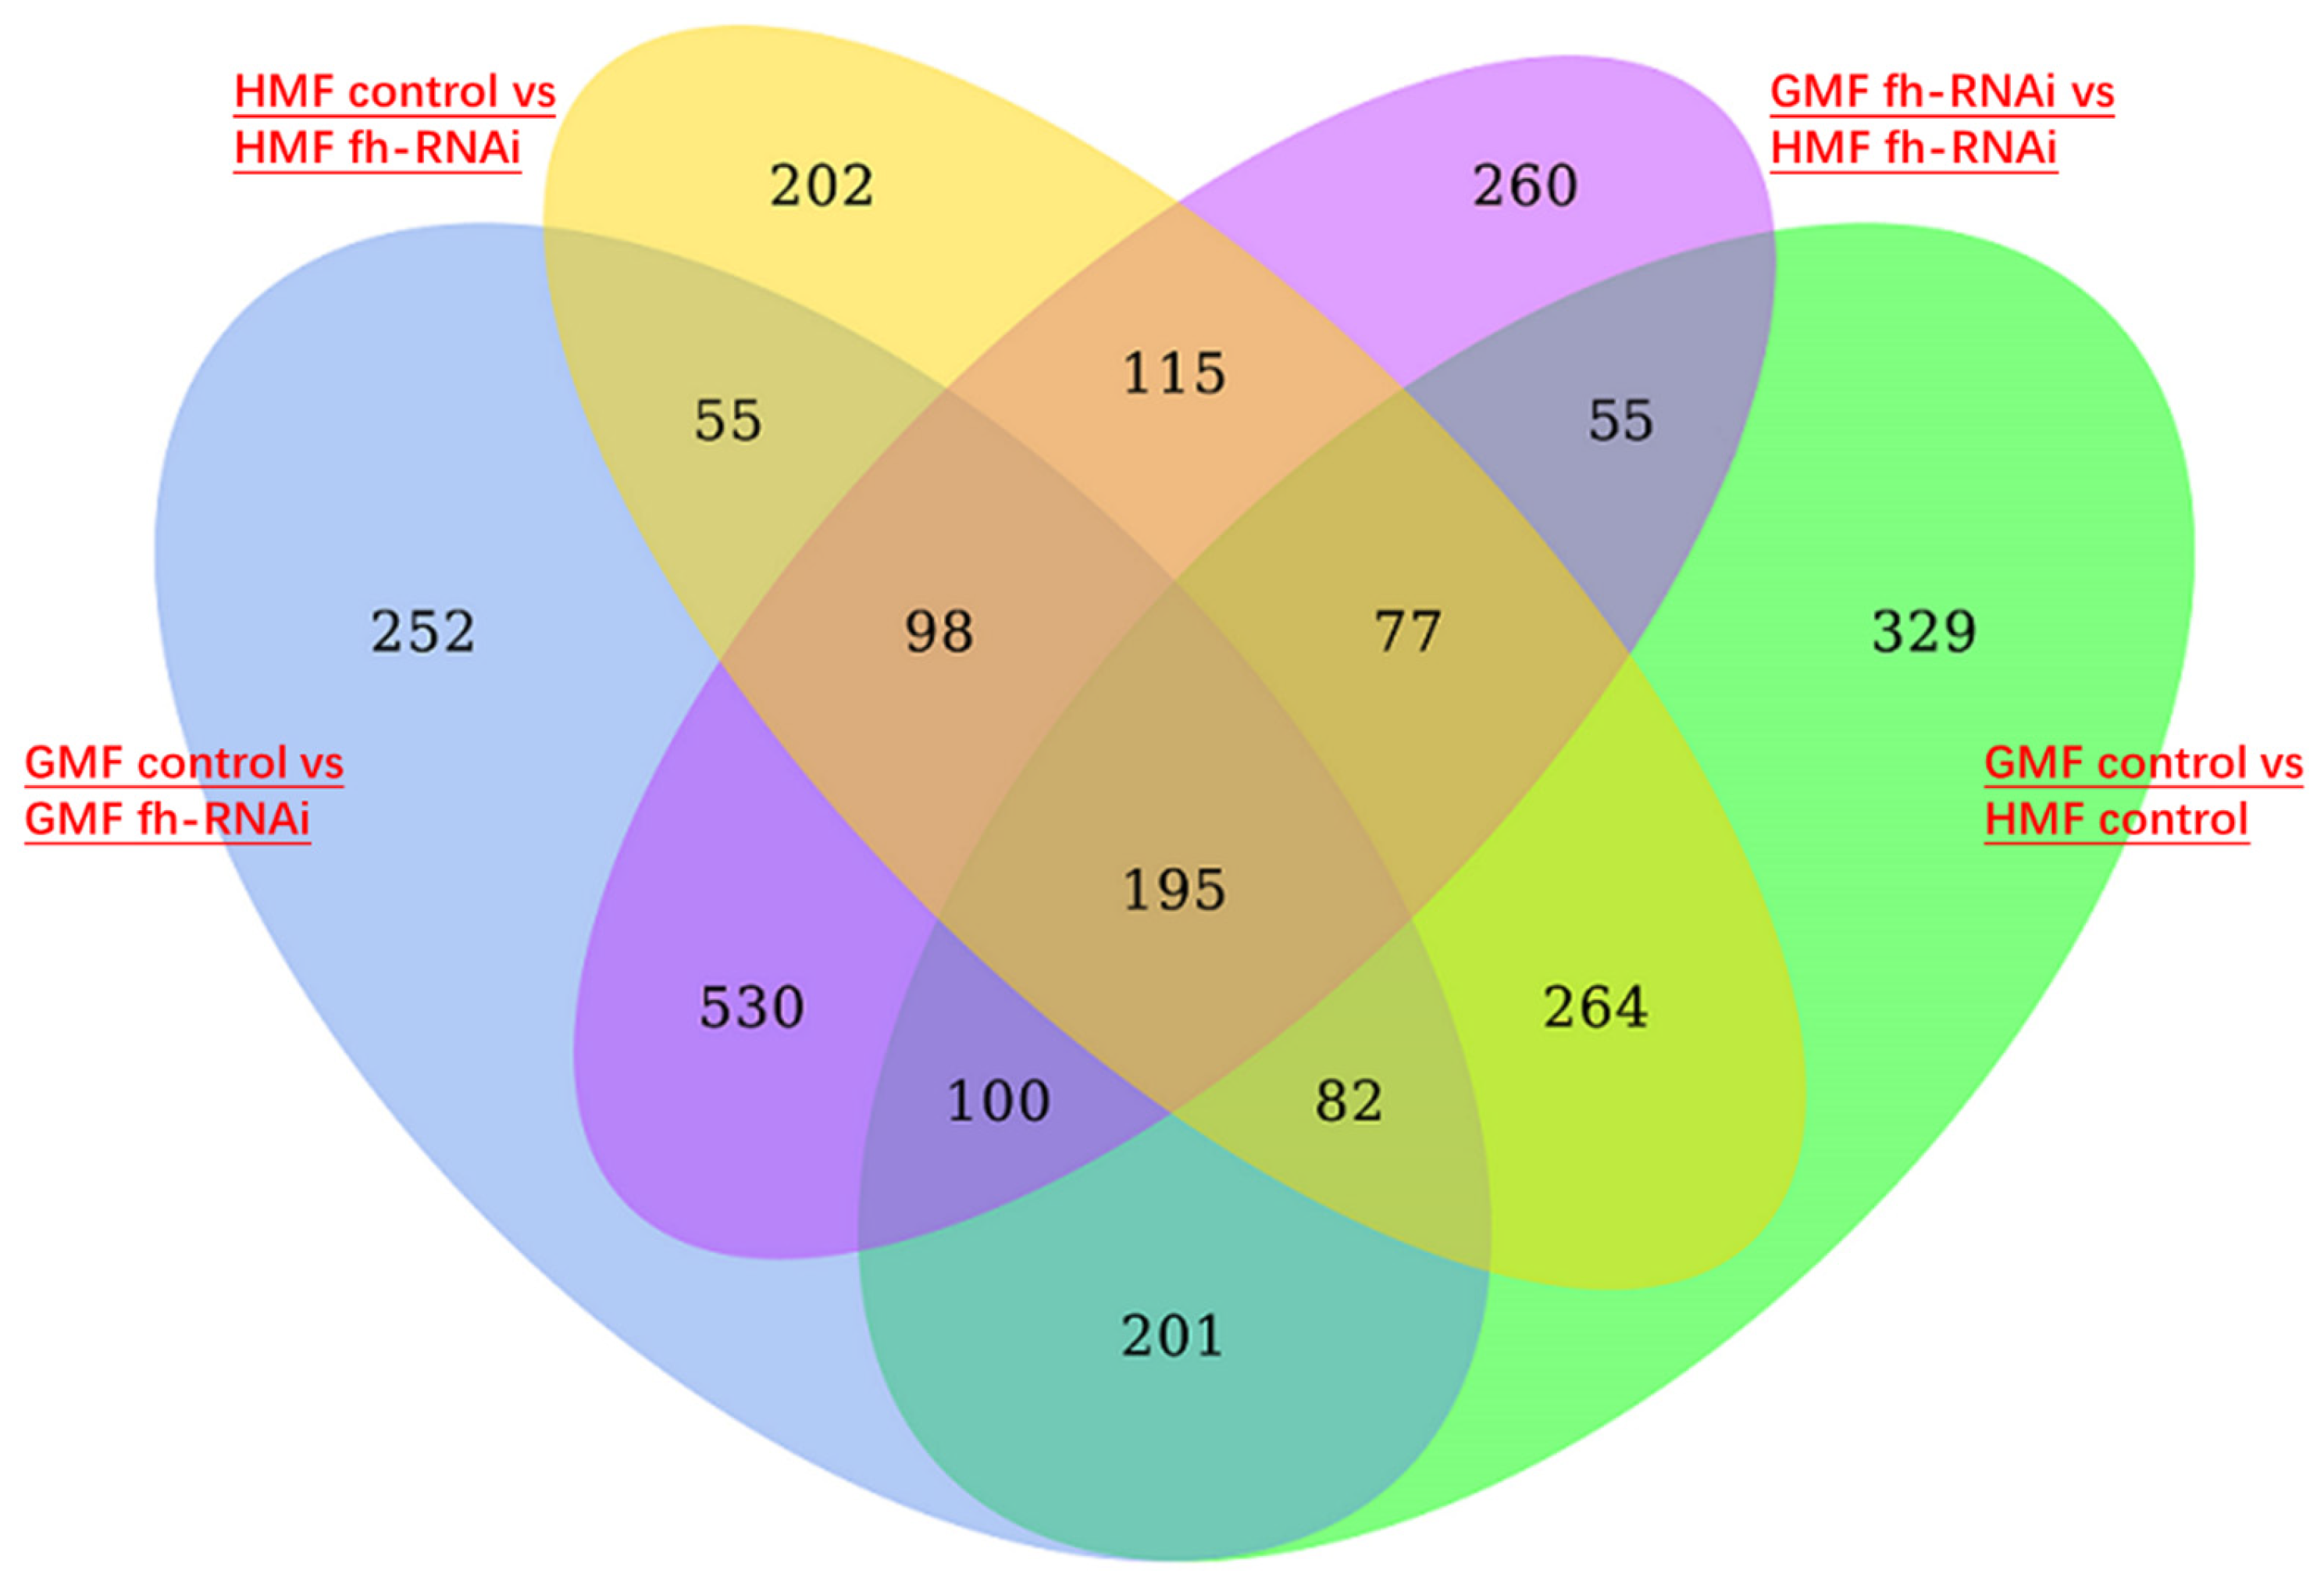
A comparison of frataxin-silenced and control flies under HMF exposure identified 202 differentially expressed genes (DEGs), whereas 252 DEGs were identified under GMF exposure (Figure 10). In addition, 260 DEGs were detected between the two frataxin-silenced groups (GMF fh-RNAi vs. HMF fh-RNAi), and 329 DEGs were detected between the two control groups under different magnetic field conditions (Figure 10). Together, these results indicate that HMF exposure is associated with broad transcriptional shifts in this experimental system. However, these changes may include both primary responses to HMF exposure and secondary downstream stress responses.
Exposure to HMF prompted remodeling of pathways related to iron metabolism and oxidative stress. In the control group, key DEGs involved in iron metabolic regulation, such as cytochrome P450 molecules (6w1/304a1/6d2), were upregulated. ROS sources, including NADPH oxidase and quiescin sulfhydryl oxidase, were also increased, alongside activation of antioxidants like glutathione S-transferase, superoxide dismutase, and peroxidase (Table 1). In contrast, the frataxin-silenced group under HMF showed downregulation of DEGs encoding heme-binding (CG5157) and ferroxidase activities (multicopper oxidase 1/3), as well as reduced ROS-producing enzymes (NADPH oxidase and dual oxidase) (Table 2). Despite the downregulation of peroxiredoxin, antioxidants such as glutathione S-transferase and catalase were upregulated, indicating a transcriptional stress-response pattern. However, these changes should not be interpreted as evidence of functional compensation in the absence of corresponding physiological or biochemical validation (Table 2). To provide a more systematic view of the transcriptomic response, we summarized the major enriched GO and KEGG categories associated with iron metabolism, oxidative stress responses, and related metabolic processes, rather than relying exclusively on selected representative DEGs.

4. Discussion

In D. melanogaster, frataxin is suggested to maintain mitochondrial Fe-S cluster synthesis and iron metabolic homeostasis, and its deficiency leads to impaired energy metabolism, oxidative stress, and neurodegenerative phenotypes [7,8,19,20,21,22,23]. The discovery of iron deposits in the hearts of FRDA patients in the late seventies [24,25] was the first indication of an association between frataxin and this transition metal, and increased iron content has been reported in critical brain areas of FRDA patients [26,27]. In D. melanogaster, Chen et al. showed that iron accumulates in the nervous system in fh1 mutants [11]. In this study, the role of frataxin in iron metabolism and oxidative stress under environmental stressors such as a hypomagnetic field was investigated primarily using SR-XRF spectroscopy. After frataxin silencing, no significant change either in iron/sulfur elemental distribution or fluorescence area was revealed (Figure 3 and Figure 5). After HMF exposure, however, significant changes happened in iron elemental distribution in frataxin-silenced brain tissues. Moreover, after frataxin silencing, the iron content in both target tissues decreased (Figure 4A), while the iron content in brain and eye tissues of frataxin-silenced flies increased and decreased under HMF exposure, respectively (Figure 4B). The sulfur content showed a similar trend of changes within frataxin silencing (Figure 5), except for the opposite trend of changes in sulfur content in frataxin-silenced tissues after HMF exposure (Figure 6B). Even though total sulfur measurements provide a useful indicator of cellular sulfur status, it should be noted that they do not directly demonstrate Fe–S cluster integrity, as sulfur may exist in various pools including free sulfide, cysteine, and other sulfur-containing metabolites. Nevertheless, these findings suggest that HMF is associated with tissue-specific alterations in iron- and sulfur-associated signals in a frataxin-deficient D. melanogaster model. In this context, HMF is best interpreted as an experimental environmental perturbation that modifies elemental readouts in a metabolically vulnerable background, rather than as direct evidence of disease progression in Friedreich’s ataxia.
The knockdown or mutation of D. melanogaster frataxin (dfh) leads to decreased activity of Fe-S-dependent enzymes (e.g., cis-aconitase, complexes I-III), and it also leads to iron metabolic variations and elevated ROS, especially in neural and muscular tissues [28,29,30]. In D. melanogaster, using the fh-RNAi line and the actin GAL4-driver line [31,32], the flies with tissue-specific frataxin deficiency in the PNS (C96) or glial cells (repo) showed increased sensitivity to external oxidative stressors such as hyperoxia or H2O2 treatment [23,31,33]. However, the ROS hypothesis has been questioned in several studies, reporting that loss of FXN leads to hypersensitivity to ROS rather than elevated ROS levels [1,8,28,34,35]. In our study, although a significant change in ROS levels in brain tissues of the control group was not determined under HMF exposure, elevated ROS levels were discovered in the frataxin-silenced group under HMF conditions (Figure 8 and Figure 9). Combined, these data suggest that ROS appears to be more of a tissue-specific “provider of feedback” for HMF rather than a prominent player in model organisms.
A large number of DEGs between frataxin-silenced and control flies under both GMF and HMF conditions further support the strong influence of frataxin deficiency on gene expression related to iron metabolism and oxidative stress. Notably, 260 DEGs were identified between the two frataxin-silenced groups and 329 DEGs between the two control groups under different magnetic field conditions, indicating that HMF exposure is associated with broad transcriptional shifts in this experimental system. These transcriptional changes likely include both primary responses to HMF exposure and secondary downstream stress responses. Although several DEGs related to iron metabolism, ROS production, and antioxidant defense were altered, these findings should be interpreted as evidence of altered transcriptional states rather than proof of functional compensation or a specific protective mechanism.
The proposed methodology of using SR-XRF spectroscopy on live tissues of D. melanogaster is a standout feature and improvement over traditional approaches. The ability to perform real-time, quantitative analysis of both iron/sulfur content and distribution at a mutant/parent-type level in a living organism is powerful in this context [17]. This approach promises to move beyond snapshots and provide a “movie” of metabolic alterations, directly testing the gatekeeper hypothesis by observing how the absence of frataxin disrupts the precise choreography of iron and sulfur under stress conditions.
Moreover, we used the pan-glial driver repo-GAL4 instead of the pan-neuronal driver elav-GAL4 to achieve targeted frataxin knockdown because the repo-GAL4 is widely expressed in glial cells, allowing us to simulate frataxin deficiency in nervous system-related tissues while avoiding systemic knockout that could lead to severe developmental defects or fatal outcomes from elav-GAL4–driven neuronal knockdown [36]. As elav-GAL4 drives broad expression early in nervous system development and as fh is a core mitochondrial gene, widespread neuronal impairment during development may alter circuit formation, baseline activity, feeding, and developmental rate. In addition, tissue-specific knockdown reduces the risk of developmental mortality that may result from general silencing. Nevertheless, pan-neuronal knockdown could be informative and will be addressed in future work to dissect cell-type contributions.

5. Conclusions

In conclusion, our study shows that hypomagnetic field exposure can serve as an environmental perturbation that modifies tissue-specific iron- and sulfur-associated signals, oxidative-stress-associated responses, and gene-expression patterns in a frataxin-deficient insect system. These findings support the use of HMF as an experimental facility for investigating how reduced magnetic field conditions interact with an intrinsically vulnerable metabolic background. Rather than indicating a direct patient-relevant exposure scenario, the present results provide a framework for studying how environmental factors influence redox balance, mitochondrial-associated function, and iron-related homeostasis in the context of frataxin deficiency. By combining a D. melanogaster model with live-tissue SR-XRF analysis, this work offers a useful platform for probing gene–environment interactions underlying metabolic fragility.

Author Contributions

Conceptualization, W.-D.P. and H.-M.K.; methodology, H.-M.K., S.Y. and L.-L.Z.; formal analysis, H.-M.K. and S.Y.; investigation, H.-M.K. and B.L.; resources, S.Y. and J.-Z.Z.; data curation, H.-M.K. and J.-Z.Z.; writing—original draft preparation, H.-M.K. and W.-D.P.; writing—review and editing, W.-D.P. and G.-J.W.; supervision, W.-D.P. and J.-Z.Z.; project administration, W.-D.P.; funding acquisition, W.-D.P., G.-J.W. and L.-L.Z. All authors have read and agreed to the published version of the manuscript.

Funding

This research was supported by the National Natural Science Foundation of China (32271286, 32172414), the National Key Research and Development Program of China (SQ2023YFA1600106), the Natural Science Foundation of Jiangsu Province (BK20221510) and the Chongming Project of HeYe Health Technology (HYCMP-2025019).

Data Availability Statement

The original contributions presented in this study are included in the article. Further inquiries can be directed to the corresponding author.

Acknowledgments

We thank our technical group for their assistance in keeping insect stocks and maintaining the exposure equipment.

Conflicts of Interest

The authors declare no conflicts of interest. The funders had no role in the design of the study; in the collection, analyses, or interpretation of data; in the writing of the manuscript; or in the decision to publish the results.

Abbreviations

The following abbreviations are used in this manuscript:
fhFrataxin
SR-XRFSynchrotron radiation-based X-ray fluorescence
GAL4GAL gene activator 4
UASUpstream activating sequence
GMFGeomagnetic fields
HMFHypomagnetic fields
DHEDihydroethidium
DEGsDifferentially expressed genes

References

  1. Babcock, M.; de Silva, D.; Oaks, R.; Davis-Kaplan, S.; Jiralerspong, S.; Montermini, L.; Pandolfo, M.; Kaplan, J. Regulation of mitochondrial iron accumulation by Yfh1p, a putative homolog of frataxin. Science 1997, 276, 1709–1712. [Google Scholar] [CrossRef] [PubMed]
  2. Gerber, J.; Mühlenhoff, U.; Lill, R. An interaction between frataxin and Isu1/Nfs1 that is crucial for Fe/S cluster synthesis on Isu1. EMBO Rep. 2003, 4, 906–911. [Google Scholar] [CrossRef] [PubMed]
  3. Schmucker, S.; Martelli, A.; Colin, F.; Page, A.; Wattenhofer-Donzé, M.; Reutenauer, L.; Puccio, H. Mammalian frataxin: An essential function for cellular viability through an interaction with a preformed ISCU/NFS1/ISD11 iron-sulfur assembly complex. PLoS ONE 2011, 6, e16199. [Google Scholar] [CrossRef] [PubMed]
  4. Vaubel, R.A.; Isaya, G. Iron-sulfur cluster synthesis, iron homeostasis and oxidative stress in Friedreich ataxia. Mol. Cell. Neurosci. 2013, 55, 50–61. [Google Scholar] [CrossRef]
  5. Maio, N.; Jain, A.; Rouault, T.A. Mammalian iron–sulfur cluster biogenesis: Recent insights into the roles of frataxin, acyl carrier protein and ATPase-mediated transfer to recipient proteins. Curr. Opin. Chem. Biol. 2020, 55, 34–44. [Google Scholar] [CrossRef]
  6. Campbell, C.J.; Pall, A.E.; Naik, A.R.; Thompson, L.N.; Stemmler, T.L. Molecular details of the frataxin–scaffold interaction during mitochondrial Fe–S cluster assembly. Int. J. Mol. Sci. 2021, 22, 6006. [Google Scholar] [CrossRef]
  7. Anderson, P.R.; Kim, K.; Hilliker, A.J.; Phillips, J.P. RNAi-mediated suppression of the mitochondrial iron chaperone, frataxin, in Drosophila melanogaster. Hum. Mol. Genet. 2005, 14, 3397–3405. [Google Scholar] [CrossRef]
  8. Llorens, J.V.; Navarro, J.A.; Martínez-Sebastián, M.J.; Baylies, M.K.; Schneuwly, S.; Botella, J.A.; Moltó, M.D. Causative role of oxidative stress in a Drosophila model of Friedreich ataxia. FASEB J. 2007, 21, 333–344. [Google Scholar] [CrossRef]
  9. Amandine, P.; David, L.; Joëlle, C.T.; Hervé, T.; Véronique, M. Frataxin inactivation leads to steroid deficiency in flies and human ovarian cells. Hum. Mol. Genet. 2015, 24, 2615–2626. [Google Scholar] [CrossRef]
  10. Rawat, S.; Kondapalli, K.C.; Rodrigues, A.V.; Stemmler, T.L. Backbone resonance assignments and secondary structure of the apo-Drosophila melanogaster frataxin homolog (Dfh). Biomol. NMR Assign. 2019, 13, 377–381. [Google Scholar] [CrossRef]
  11. Chen, K.; Ho, T.S.Y.; Lin, G.; Tan, K.L.; Rasband, M.N.; Bellen, H.J. Loss of frataxin activates the iron/sphingolipid/PDK1/Mef2 pathway in mammals. eLife 2016, 5, e20732. [Google Scholar] [CrossRef] [PubMed]
  12. Bradley, J.L.; Blake, J.C.; Chamberlain, S.; Thomas, P.K.; Cooper, J.M.; Schapira, A.H.V. Clinical, biochemical and molecular genetic correlations in Friedreich’s ataxia. Hum. Mol. Genet. 2000, 9, 275–282. [Google Scholar] [CrossRef] [PubMed]
  13. De Samber, B.; Meul, E.; Laforce, B.; De Paepe, B.; Smet, J.; De Bruyne, M.; De Rycke, R.; Bohic, S.; Cloetens, P.; Van Coster, R.; et al. Nanoscopic X-ray fluorescence imaging and quantification of intracellular key-elements in cryofrozen Friedreich’s ataxia fibroblasts. PLoS ONE 2018, 13, e0190495. [Google Scholar] [CrossRef] [PubMed]
  14. Villanueva, J.E.; Livelo, C.; Trujillo, A.S.; Chandran, S.; Woodworth, B.; Andrade, L.; Le, H.D.; Manor, U.; Panda, S.; Melkani, G.C. Time-restricted feeding restores muscle function in Drosophila melanogaster models of obesity and circadian-rhythm disruption. Nat. Commun. 2019, 10, 2700. [Google Scholar] [CrossRef]
  15. Ryan, C.G.; Cousens, D.R.; Sie, S.H.; Griffin, W.L. Quantitative analysis of PIXE spectra in geoscience applications. Nucl. Instrum. Methods Phys. Res. Sect. B Beam Interact. Mater. At. 1990, 49, 271–276. [Google Scholar] [CrossRef]
  16. Solé, V.A.; Papillon, E.; Cotte, M.; Walter, P.; Susini, J. A multiplatform code for the analysis of energy-dispersive X-ray fluorescence spectra. Spectrochim. Acta Part B At. Spectrosc. 2007, 62, 63–68. [Google Scholar] [CrossRef]
  17. Zhang, L.; Yan, S.; Jiang, S.; Yang, K.; Wang, H.; He, S.; Liang, D.; Zhang, L.; He, Y.; Lan, X.; et al. Hard X-ray micro-focusing beamline at SSRF. Nucl. Sci. Tech. 2015, 26, 3–10. [Google Scholar]
  18. Schindelin, J.; Arganda-Carreras, I.; Frise, E.; Kaynig, V.; Longair, M.; Pietzsch, T.; Preibisch, S.; Rueden, C.; Saalfeld, S.; Schmid, B.; et al. Fiji: An open-source platform for biological-image analysis. Nat. Methods 2012, 9, 676–682. [Google Scholar] [CrossRef]
  19. Runko, A.P.; Griswold, A.J.; Min, K.T. Overexpression of frataxin in the mitochondria increases resistance to oxidative stress and extends lifespan in Drosophila melanogaster. FEBS Lett. 2008, 582, 715–719. [Google Scholar] [CrossRef]
  20. Calap-Quintana, P.; Navarro, J.A.; González-Fernández, J.; Martínez-Sebastián, M.J.; Moltó, M.D.; Llorens, J.V. Drosophila melanogaster models of Friedreich’s ataxia. BioMed Res. Int. 2018, 2018, 5065190. [Google Scholar] [CrossRef]
  21. Cabiscol, E.; Tamarit, J.; Ros, J. Oxidative stress in bacteria and protein damage by reactive oxygen species. Int. Microbiol. Off. J. Span. Soc. Microbiol. 2000, 3, 3–8. [Google Scholar]
  22. Edenharter, O.; Clement, J.; Schneuwly, S.; Navarro, J.A. Overexpression of Drosophila melanogaster frataxin triggers cell death in an iron-dependent manner. J. Neurogenet. 2017, 31, 189–202. [Google Scholar] [CrossRef] [PubMed]
  23. Navarro, J.A.; Ohmann, E.; Sanchez, D.; Botella, J.A.; Liebisch, G.; Molto, M.D.; Ganfornina, M.D.; Schmitz, G.; Schneuwly, S. Altered lipid metabolism in a Drosophila melanogaster model of Friedreich’s ataxia. Hum. Mol. Genet. 2010, 19, 2828–2840. [Google Scholar] [CrossRef] [PubMed]
  24. Sanchez-Casis, G.; Cote, M.; Barbeau, A. Pathology of the heart in Friedreich’s ataxia: Review of the literature and report of one case. Can. J. Neurol. Sci. 1976, 3, 349–354. [Google Scholar] [CrossRef]
  25. Lamarche, J.B.; Cote, M.; Lemieux, B. The cardiomyopathy of Friedreich’s ataxia morphological observations in 3 cases. Can. J. Neurol. Sci. 1980, 7, 389–396. [Google Scholar] [CrossRef]
  26. Harding, I.H.; Raniga, P.; Delatycki, M.B.; Stagnitti, M.R.; Corben, L.A.; Storey, E.; Georgiou-Karistianis, N.; Egan, G.F. Tissue atrophy and elevated iron concentration in the extrapyramidal motor system in Friedreich ataxia: The IMAGE-FRDA study. J. Neurol. Neurosurg. Psychiatry 2016, 87, 1260–1263. [Google Scholar] [CrossRef]
  27. Boddaert, N.; Le Quan Sang, K.H.; Rötig, A.; Leroy-Willig, A.; Gallet, S.; Brunelle, F.; Sidi, D.; Thalabard, J.C.; Munnich, A.; Cabantchik, Z.I. Selective iron chelation in Friedreich ataxia: Biologic and clinical implications. Blood 2007, 110, 401–408. [Google Scholar] [CrossRef]
  28. Shidara, Y.; Hollenbeck, P.J. Defects in mitochondrial axonal transport and membrane potential without increased reactive oxygen species production in a Drosophila melanogaster model of Friedreich ataxia. J. Neurosci. 2010, 30, 11369–11378. [Google Scholar] [CrossRef]
  29. Lupoli, F.; Vannocci, T.; Longo, G.; Niccolai, N.; Pastore, A. The role of oxidative stress in Friedreich’s ataxia. FEBS Lett. 2018, 592, 718–727. [Google Scholar] [CrossRef]
  30. Edenharter, O.; Schneuwly, S.; Navarro, J.A. Mitofusin-dependent ER stress triggers glial dysfunction and nervous system degeneration in a Drosophila melanogaster model of Friedreich’s ataxia. Front. Mol. Neurosci. 2018, 11, 38. [Google Scholar] [CrossRef]
  31. Calap-Quintana, P.; Soriano, S.; Llorens, J.V.; Al-Ramahi, I.; Botas, J.; Moltó, M.D.; Martínez-Sebastián, M.J. TORC1 inhibition by rapamycin promotes antioxidant defences in a Drosophila melanogaster model of Friedreich’s ataxia. PLoS ONE 2015, 10, e0132376. [Google Scholar] [CrossRef]
  32. Soriano, S.; Calap-Quintana, P.; Llorens, J.V.; Al-Ramahi, I.; Gutierrez, L.; Martínez-Sebastián, M.J.; Botas, J.; Moltó, M.D. Metal homeostasis regulators suppress FRDA phenotypes in a Drosophila melanogaster model of the disease. PLoS ONE 2016, 11, e0159209. [Google Scholar] [CrossRef]
  33. Anderson, P.R.; Kirby, K.; Orr, W.C.; Hilliker, A.J.; Phillips, J.P. Hydrogen peroxide scavenging rescues frataxin deficiency in a Drosophila melanogaster model of Friedreich’s ataxia. Proc. Natl. Acad. Sci. USA 2008, 105, 611–616. [Google Scholar] [CrossRef]
  34. Macevilly, C.J.; Muller, D.P. Oxidative stress does not appear to be involved in the aetiology of Friedreich’s ataxia. Restor. Neurol. Neurosci. 1997, 11, 131–137. [Google Scholar] [CrossRef]
  35. Seznec, H.; Simon, D.; Bouton, C.; Reutenauer, L.; Hertzog, A.; Golik, P.; Procaccio, V.; Patel, M.; Drapier, J.C.; Koenig, M.; et al. Friedreich ataxia: The oxidative stress paradox. Hum. Mol. Genet. 2005, 14, 463–474. [Google Scholar] [CrossRef]
  36. Monnier, V.; Llorens, J.V.; Navarro, J.A. Impact of Drosophila melanogaster models in the study and treatment of Friedreich’s ataxia. Int. J. Mol. Sci. 2018, 19, 1989. [Google Scholar] [CrossRef]
Figure 1. D. melanogaster mutants with frataxin silencing in glial and retinal cells.
Insects 17 00373 g001
Figure 2. The Helmholtz coil system used to generate hypomagnetic fields (HMF). The system consists of three independent coil pairs, and each pair of coils is individually powered. The external diameter of the apparatus is 1200 mm. The effective area of HMF is generated in the center space, with dimensions of 300 × 300 × 300 mm3. Insects are placed on the wooden table in the middle of the Helmholtz coils.
Insects 17 00373 g002
Figure 3. Iron elemental distribution (A) and corresponding fluorescence area quantification (B) using SR-XRF mapping in brain and eye tissues of D. melanogaster under GMF or HMF exposure. The genetic control was UAS-fh RNAi, and frataxin silencing in brain and eye tissues were lines of repo-GAL4; tub-GAL80ts > fh-RNAi and ninaE-GAL4 > fh-RNAi, respectively. Pixel size in the images is 2 μm; scan time is 50 ms. The independent-samples t-test (* p < 0.05; NS, not significant) was performed to evaluate the effects of different genotypes on fluorescence area in brain and eye tissues under GMF or HMF exposure. Elemental maps were measured in “2D F1Y Scan” mode and normalized to dead time. Note areas with iron hotspots (blue stippled circles) and brain tissue borders (white stippled lines).
Insects 17 00373 g003
Figure 4. Iron content in brain and eye tissues of D. melanogaster after GMF exposure (A) or HMF exposure (B). The genetic control was UAS-fh RNAi, while frataxin silencing in brain and eye tissues was achieved using repo-GAL4; tub-GAL80ts > fh-RNAi and ninaE-GAL4 > fh-RNAi, respectively. Scale bar: 50 μm. Color code indicates background-corrected intensity of scanned iron in counts.
Insects 17 00373 g004
Figure 5. Sulfur elemental distribution in brain and eye tissues of D. melanogaster under GMF or HMF exposure. The genetic control was UAS-fh RNAi and frataxin silencing in brain and eye tissues were lines of repo-GAL4; tub-GAL80ts > fh-RNAi and ninaE-GAL4 > fh-RNAi, respectively. Pixel size in the images is 2 μm; scan time is 50 ms. Black striped circles indicate areas with sulfur hotspots (blue ROIs).
Insects 17 00373 g005
Figure 6. Sulfur content in brain (A) and eye (B) tissues of D. melanogaster under GMF or HMF exposure. The genetic control was UAS-fh RNAi and frataxin silencing in brain and eye tissues were lines of repo-GAL4; tub-GAL80ts > fh-RNAi and ninaE-GAL4 > fh-RNAi, respectively. Scale bar indicates the background-corrected intensity of scanned sulfur in counts.
Insects 17 00373 g006
Figure 7. A schematic illustrating tissue-specific alterations in iron and sulfur under GMF vs. HMF conditions. The blue arrow represents the up-regulation, while the red and green arrows represent the down-regulation.
Insects 17 00373 g007
Figure 8. ROS examination of brain and eye tissues of D. melanogaster using laser scanning confocal immunofluorescence with dihydroethidium staining. Intracellular ROS levels were visualized as red fluorescence excited from oxidized ethidium. The mean fluorescence intensity serves as an indicator of ROS levels. The genetic control was UAS-fh RNAi and frataxin silencing in brain and eye tissues were lines of repo-GAL4; tub-GAL80ts > fh-RNAi and ninaE-GAL4 > fh-RNAi, respectively.
Insects 17 00373 g008
Figure 9. ROS levels of brain (A) and eye tissues (B) of D. melanogaster as indicated by mean fluorescence intensity. The genetic control was UAS-fh RNAi and frataxin silencing in brain and eye tissues were lines of repo-GAL4; tub-GAL80ts > fh-RNAi and ninaE-GAL4 > fh-RNAi, respectively. The independent-samples t-test (*** p < 0.001; NS, not significant) was performed to evaluate the effects of different magnetic fields or genotypes on ROS levels in brain and eye tissues. Data are presented as the means ± SEM.
Insects 17 00373 g009
Figure 10. Venn diagram showing four lists of differentially expressed genes in heads of frataxin-silenced flies and in flies exposed to hypomagnetic fields. The genetic control was UAS-fh RNAi and frataxin silencing in brain tissues of heads was line of repo-GAL4; tub-GAL80ts > fh-RNAi.
Insects 17 00373 g010
Table 1. Selected differentially expressed genes (DEGs) that are involved in iron metabolism, ROS production and antioxidation in heads of UAS-fh RNAi (control) flies after HMF exposure.
Gene_IDlog2FoldChangepvalpadjGene_Description
FBgn00330652.41836370800Cytochrome P450 6w1(Iron metabolism)
FBgn00380954.8776575989.40 × 10−2001.10 × 10−197Cytochrome P450 304a1 (Iron metabolism)
FBgn00347563.3552330712.80 × 10−1282.05 × 10−126Cytochrome P450 6d2 (Iron metabolism)
FBgn00854281.0239456.22 × 10−072.93 × 10−06NADPH oxidase (ROS production)
FBgn00389191.032.40 × 10−071.19 × 10−06Quiescin sulfhydryl oxidase 2 (ROS production)
FBgn00100412.7732128.10 × 10−104.92 × 10−09Glutathione S-transferase D5 (Antioxidation)
FBgn00100402.76115.87 × 10−050.0002194Glutathione S-transferase D4 (Antioxidation)
FBgn00510281.6822231.37 × 10−076.91 × 10−07Related to SOD (Antioxidation)
FBgn00045773.1869464.77 × 10−050.0001803Peroxidase (Antioxidation)
Criteria for differentially expressed genes: |log2(FoldChange)| > 1 & padj < 0.05.
Table 2. Selected differentially expressed genes (DEGs) that are involved in iron metabolism, ROS production and antioxidation in heads of repo-GAL4; tub-GAL80ts > fh-RNAi (fh-RNAi) flies after HMF exposure.
Gene_IDlog2FoldChangepvalpadjGene_Description
FBgn0036575−2.68452.45 × 10−071.18 × 10−06CG5157 (Iron metabolism)
FBgn0032116−1.899321.27 × 10−1046.46 × 10−103Multicopper oxidase 1 (Iron metabolism)
FBgn0039387−3.358591.75 × 10−078.53 × 10−07Multicopper oxidase 3 (Iron metabolism)
FBgn0085428−1.923473.01 × 10−182.88 × 10⁻¹⁷NADPH oxidase (ROS production)
FBgn0283531−1.183722.70 × 10−314.12 × 10⁻³⁰Dual oxidase (ROS production)
FBgn0033520−1.36590.00031420.0010317Peroxiredoxin 6b (Antioxidation)
FBgn00100411.9886939.08 × 10−115.71 × 10⁻¹⁰Glutathione S transferase D5 (Antioxidation)
FBgn00100422.8806745.37 × 10−050.0001985Glutathione S transferase D6 (Antioxidation)
FBgn00384651.2719175.63 × 10−3071.22 × 10−304Immune-regulated catalase (Antioxidation)
Criteria for differentially expressed genes: |log2(FoldChange)| > 1 & padj < 0.05.
Disclaimer/Publisher’s Note: The statements, opinions and data contained in all publications are solely those of the individual author(s) and contributor(s) and not of MDPI and/or the editor(s). MDPI and/or the editor(s) disclaim responsibility for any injury to people or property resulting from any ideas, methods, instructions or products referred to in the content.