Article

Evaluation of Spatial Distribution of Pulse Blue Butterfly (Lampides boeticus), Pest of Legume Crops, in Response to Climate Change

1
Wetland Center, National Institute of Ecology, Changnyeong 50303, Republic of Korea
2
Department of Smart Agriculture Systems, Chungnam National University, Daejeon 34134, Republic of Korea
3
Department of Smart Agriculture Systems Machinery Engineering, Chungnam National University, Daejeon 34134, Republic of Korea
*
Author to whom correspondence should be addressed.
Insects 2025, 16(8), 826; https://doi.org/10.3390/insects16080826
Submission received: 7 July 2025 / Revised: 4 August 2025 / Accepted: 5 August 2025 / Published: 8 August 2025
(This article belongs to the Section Insect Pest and Vector Management)

Simple Summary

Lampides boeticus, commonly known as the pulse blue butterfly, is a significant pest of legume crops. Its habitat is shifting as a direct consequence of climate change, which necessitates an assessment of its potential future distribution. This study investigated the potential distribution of L. boeticus using MaxEnt, random forest, and ensemble models. The predicted distributions aligned well with the species’ recorded occurrences. Results showed that climate change is projected to broaden its habitat, an effect primarily driven by the minimum temperature of the coldest month as shown in variable contribution. As a tropical and subtropical species, it is assumed that cold temperatures are the main factor limiting its habitat range. The models predict that the species’ potential range will overlap with major pulse cultivation areas, regardless of climate change. This finding underscores the urgent need to establish a sustainable pest management strategy for this pest.

Abstract

The potential distribution of the pulse blue butterfly, Lampides boeticus (Lepidoptera: Lycaenidae), was determined using MaxEnt, random forest, and ensemble models. The results indicate that most tropical, subtropical, and some temperate regions are suitable habitats. Climate change is projected to expand the species’ habitat northward in the Northern Hemisphere. Predicted distributions aligned well with the known occurrence records for the species. The minimum temperature of the coldest month was the climatic variable that most strongly influenced the distribution of L. boeticus. As a tropical and subtropical species, it is assumed that cold temperatures are the main factor limiting its habitat range. Because the potential distribution of this pest covers major pulse cultivation areas under both current and future climate scenarios, these findings highlight the urgent need for developing a sustainable pest management strategy.

1. Introduction

The pulse blue butterfly (Lampides boeticus Linnaeus, 1767) is distributed across Africa, Eurasia, and Oceania, as well as on islands in the Pacific, Atlantic, and Indian Oceans. Its range spans tropical to temperate zones, covering nearly all continents except the Americas [1]. This butterfly feeds on more than 100 plant species, primarily legumes, and is a rare example within the Lycaenidae family known for its exceptional migratory abilities [1,2,3,4]. Consequently, with few non-climatic habitat limitations, its potential to impact local agriculture is significant.
Research on this butterfly has primarily been conducted in India, where it is a recognized pest of legume crops like cowpeas and field peas. However, damage has also been reported in Iran, Iraq, Egypt, Kenya, Nigeria, Thailand, Vietnam, France, and Japan [5,6,7,8,9,10,11,12,13]. In severe cases, this species can cause over 50% of damage to legume crop production [14,15]. In South Korea, for instance, it was designated a climate change bioindicator species by the Ministry of Environment following its recent establishment in the southern region and subsequent damage to Lablab purpureus (L.) [16]. Similarly, in the UK, more frequent sightings are attributed to the northward expansion of its distribution range as a result of climate change [17]. The documented damage to agriculture and habitat shifts driven by climate change necessitate a predictive assessment of this pest’s potential distribution to develop effective countermeasures against its spread [18,19].
Species distribution modeling (SDM) is a common method for assessing potential habitats and their shifts in response to environmental factors. Among various SDM approaches, machine learning-based (or correlative) models are widely used. Their advantages over mechanistic models include their reliance on occurrence-only data, the ability to incorporate diverse environmental layers, and the use of objective evaluation metrics [20]. Although several SDM algorithms exist, MaxEnt is a well-known tool for evaluating potential distributions using only occurrence data [21]. Based on the principle of maximum entropy, the model identifies environmental conditions at known occurrence locations and extrapolates to predict other suitable areas. MaxEnt has demonstrated strong performance even with relatively small occurrence datasets [22,23]. Consequently, recent SDM studies have utilized MaxEnt to evaluate potential risks from crop pests, including those attacking legumes [18,19]. Another powerful tool is the random forest (RF) algorithm, a machine learning classifier known for its high performance and robust identification of potential species distributions in computational ecology [24,25].
L. boeticus is a damaging pest of legume crops, and its impact is expected to increase as climate change expands its suitable habitat and potentially its population density. However, to the best of our knowledge, no previous study has evaluated the global distribution and habitat suitability of this species. Therefore, this study aimed to model the occurrence probability and map the potential distribution of L. boeticus under current and future climate scenarios to identify areas at risk. These results can serve as crucial data for understanding the threats posed by L. boeticus and for developing management strategies to mitigate its impact.

2. Materials and Methods

2.1. Occurrence and Background Data Processing

Occurrence records for L. boeticus were obtained from two publicly available databases. The Centre for Agriculture and Bioscience International (CABI) reports the species’ distribution across Afro-Eurasia, Oceania, and the Pacific Islands [26]. The Global Biodiversity Information Facility (GBIF) provided georeferenced coordinates for model development, with a distribution largely consistent with that reported by CABI [27].
A total of 44,341 coordinates were initially obtained from GBIF [27]. Records from the American continents were removed, as they could not be cross validated with data from CABI or a previous study [1,26]. Then, to eliminate redundant records and sampling bias resulting from uneven sampling density, spatial filtering was applied with a 25 km radius buffer, taking into account the climate heterogeneity at the occurrence points. This was accomplished using the SDM toolbox in ArcGIS version 10.4.1 (ESRI). This process resulted in a final dataset of 3669 points for model development (Figure 1) [28,29]. For background data (pseudo-absence points), we generated a biased background file using the kernel density function provided by the R software [30,31,32]. This was performed to weigh occurrence records that could account for uneven sampling density [33].

2.2. Model Variables and Their Selection

Assuming that several decades represent an insufficient timeframe for significant evolutionary adaptation, we used historical bioclimatic data to model the current potential distribution of L. boeticus [34]. The historical climate data (the average maximum temperature, average minimum temperature, and precipitation) spanned 1992–2021 and elevation data was obtained from WorldClim (www.worldclim.org, accessed on 30 January 2024) [35,36,37]. The historical climate data collected was transformed into nineteen bioclimatic variables utilizing the “biovars” function within the “dismo” package of R software (version 4.2.2) [31,38]. Following the extraction of environmental variables at the occurrence coordinates of L. boeticus, Spearman’s correlation coefficient was computed using IBM SPSS Statistics (version 21, IBM Statistics, Armonk, NY, USA) [39]. For variable selection, those with correlation coefficients exceeding ±0.7 were removed in favor of key variables that contributed significantly to the default MaxEnt model, which incorporated 20 environmental variables [40]. Subsequently, bioclimatic variables associated with high temperature, humidity, and precipitation were taken into account, as these factors influence L. boeticus populations [1,41,42]. Nine environmental variables (Bio2, 6, 8, 13, 14, 15, 18, and 19, and elevation) were selected for L. boeticus. The relative importance of these variables was assessed using the percentage contribution (for MaxEnt) and the mean decrease in Gini (for RF) [43]. To model climate change scenarios, the Shared Socioeconomic Pathway (SSP) 5-8.5 for the period 2081–2100 from the MIROC-6 sourced from WorldClim at a 10 arc minute resolution [35,44]. The SSP5-8.5 scenario was employed to construct the models under the assumption of an extreme simulation, which forecasts a global mean temperature increase of up to 5.1 °C, alongside variable precipitation patterns [45]. The timeframe of 2081–2100 was selected because it provides an appropriate duration for observing changes in future pest distribution, being neither excessively short nor overly extended.

2.3. Optimal Model Operating Conditions

An optimal model operation is required to develop a high-performance model along with the selection of variables [46]. Therefore, we determined the ideal operational parameters for both MaxEnt and RF. For MaxEnt, we used the ENMeval package in R to identify the optimal regularization multiplier (RM) and feature combination (FC) based on environmental data [47]. The optimal RM and FC for L. boeticus were determined to be 2.5 and the linear-quadratic-hinge-product (LQHP) feature, respectively, which showed the smallest AICc (delta corrected Akaike information criterion). Following the identification of the optimal parameters for the MaxEnt operation, we implemented models for L. boeticus using 10-fold cross-validation with 10,000 background points [21].
For the RF algorithm, pseudo-absence data were generated at a 1:1 ratio with presence data using the mopa package [48]. The data were partitioned into a 70% training set and a 30% testing set. The number of variables randomly sampled at each split (mtry) was set to 3 (the square root of the number of environmental variables), and the number of trees (ntree) was set to 500, a value at which the out-of-bag (OOB) error rate stabilized [25,49].

2.4. Model Performance Test

Model performance was assessed using three standard metrics: accuracy, the area under the receiver operating characteristic curve (AUC), and the true skill statistic (TSS). Accuracy represents the proportion of correct predictions. AUC values were interpreted using a standard scale: 0.5–0.6 (fail), 0.6–0.7 (poor), 0.7–0.8 (fair), 0.8–0.9 (good), and >0.9 (excellent) [50]. TSS is a prevalence-independent metric of accuracy; its values were interpreted as follows: 0–0.2 (no better than random), 0.2–0.4 (poor), 0.4–0.6 (fair), 0.6–0.8 (good), and >0.8 (excellent) [51,52]. The TSS was calculated using the maximum training sensitivity plus specificity logistic threshold, which provides a robust and prevalence-independent cutoff [53].

3. Results

3.1. Results of Model Performance Test for L. boeticus

The developed models demonstrated fair predictive performance, though their metrics and spatial predictions varied (Table 1). The RF model consistently achieved higher performance values (AUC, accuracy, and TSS > 0.8) compared to the MaxEnt model. This difference may be attributed to RF’s more constrained predictions around known occurrence points, resulting in higher specificity on the test data. In contrast, MaxEnt predicted a broader potential distribution, which, despite having a similar sensitivity to RF, led to lower overall performance scores.

3.2. Occurrence, Variables, and Potential Distribution of L. boeticus by Single Model Algorithm

The total L. boeticus dataset of 3669 points for model development were used with nine environmental variables (Bio2, 6, 8, 13, 14, 15, 18, and 19, and elevation). As a result of percent contribution, the minimum temperature in the coldest month was the most significant factor across the models (Table 2).
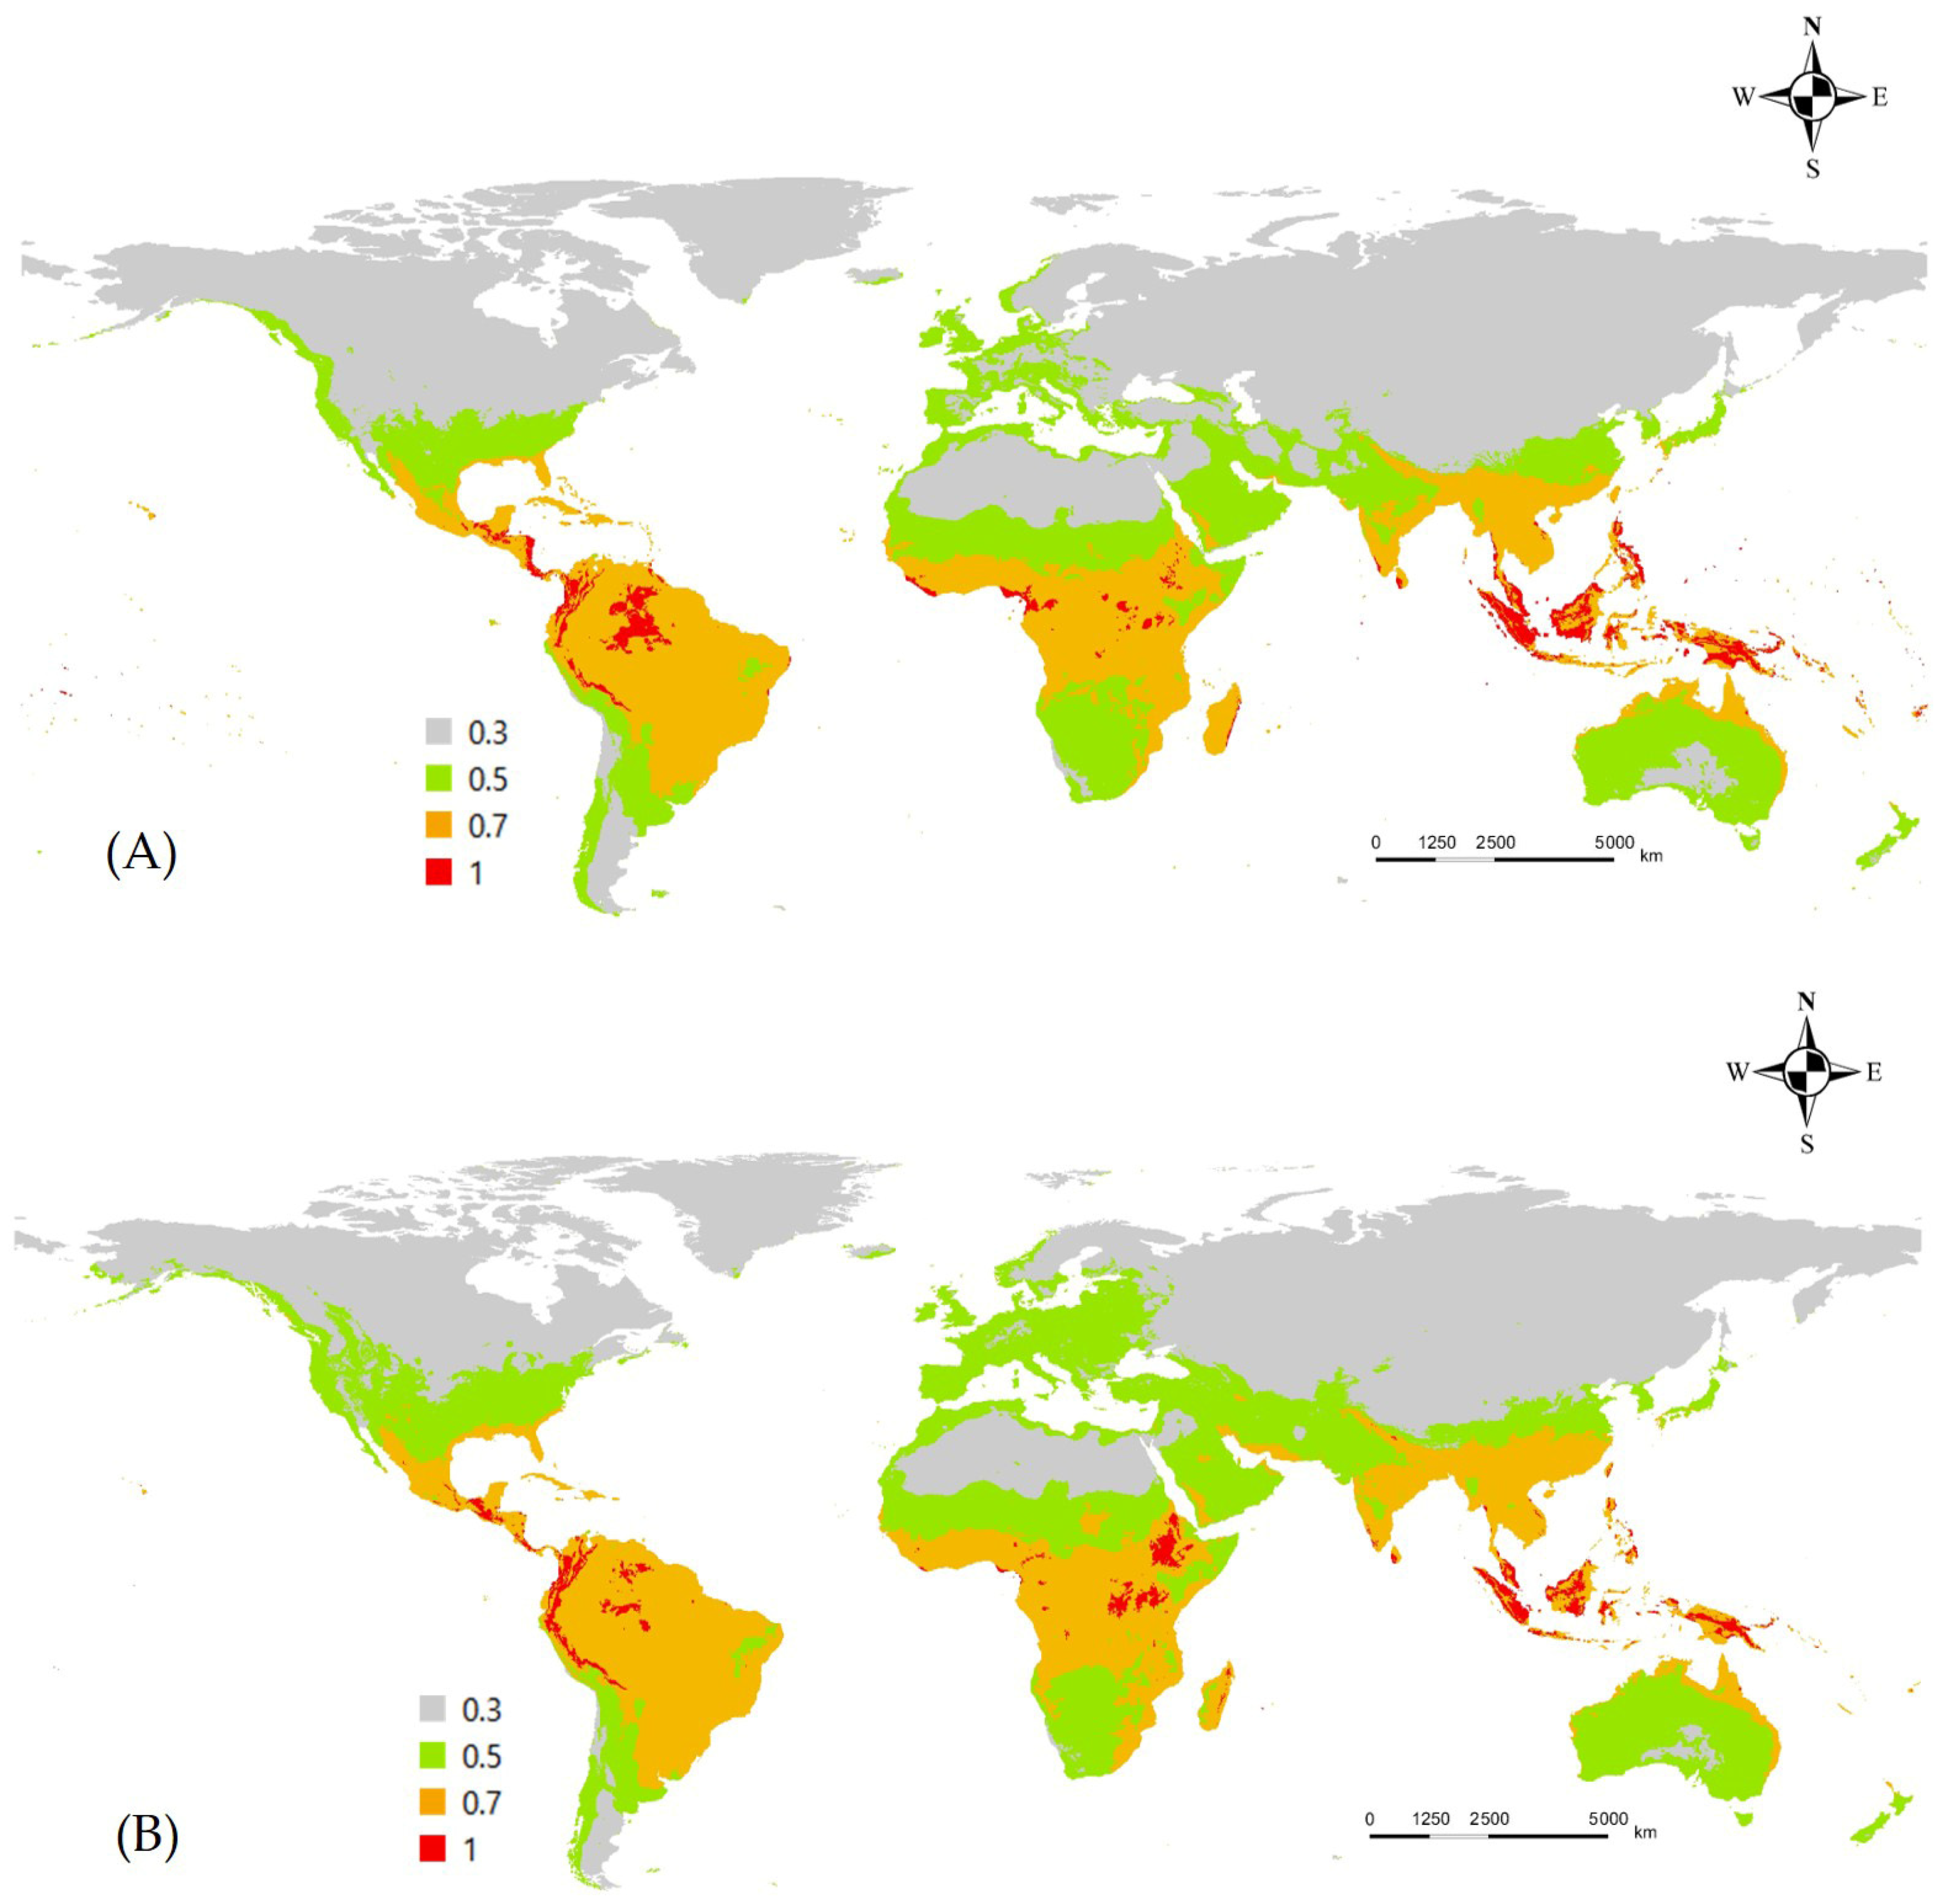
The MaxEnt model predicted high habitat suitability for L. boeticus across most tropical and subtropical regions, as well as some temperate zones. The primary contributing environmental factors were the minimum temperature of the coldest month (bio6), precipitation of the wettest month (bio13), and precipitation of the warmest quarter (bio16) identified as the key contributing environmental factors. The optimal habitat latitude range was identified as approximately −15 to 15 degrees, encompassing Central and South America where its occurrence has not been previously reported. Under the SSP5-8.5 climate scenario, the potential distribution of the pest is projected to expand northward in the Northern Hemisphere (Figure 2).
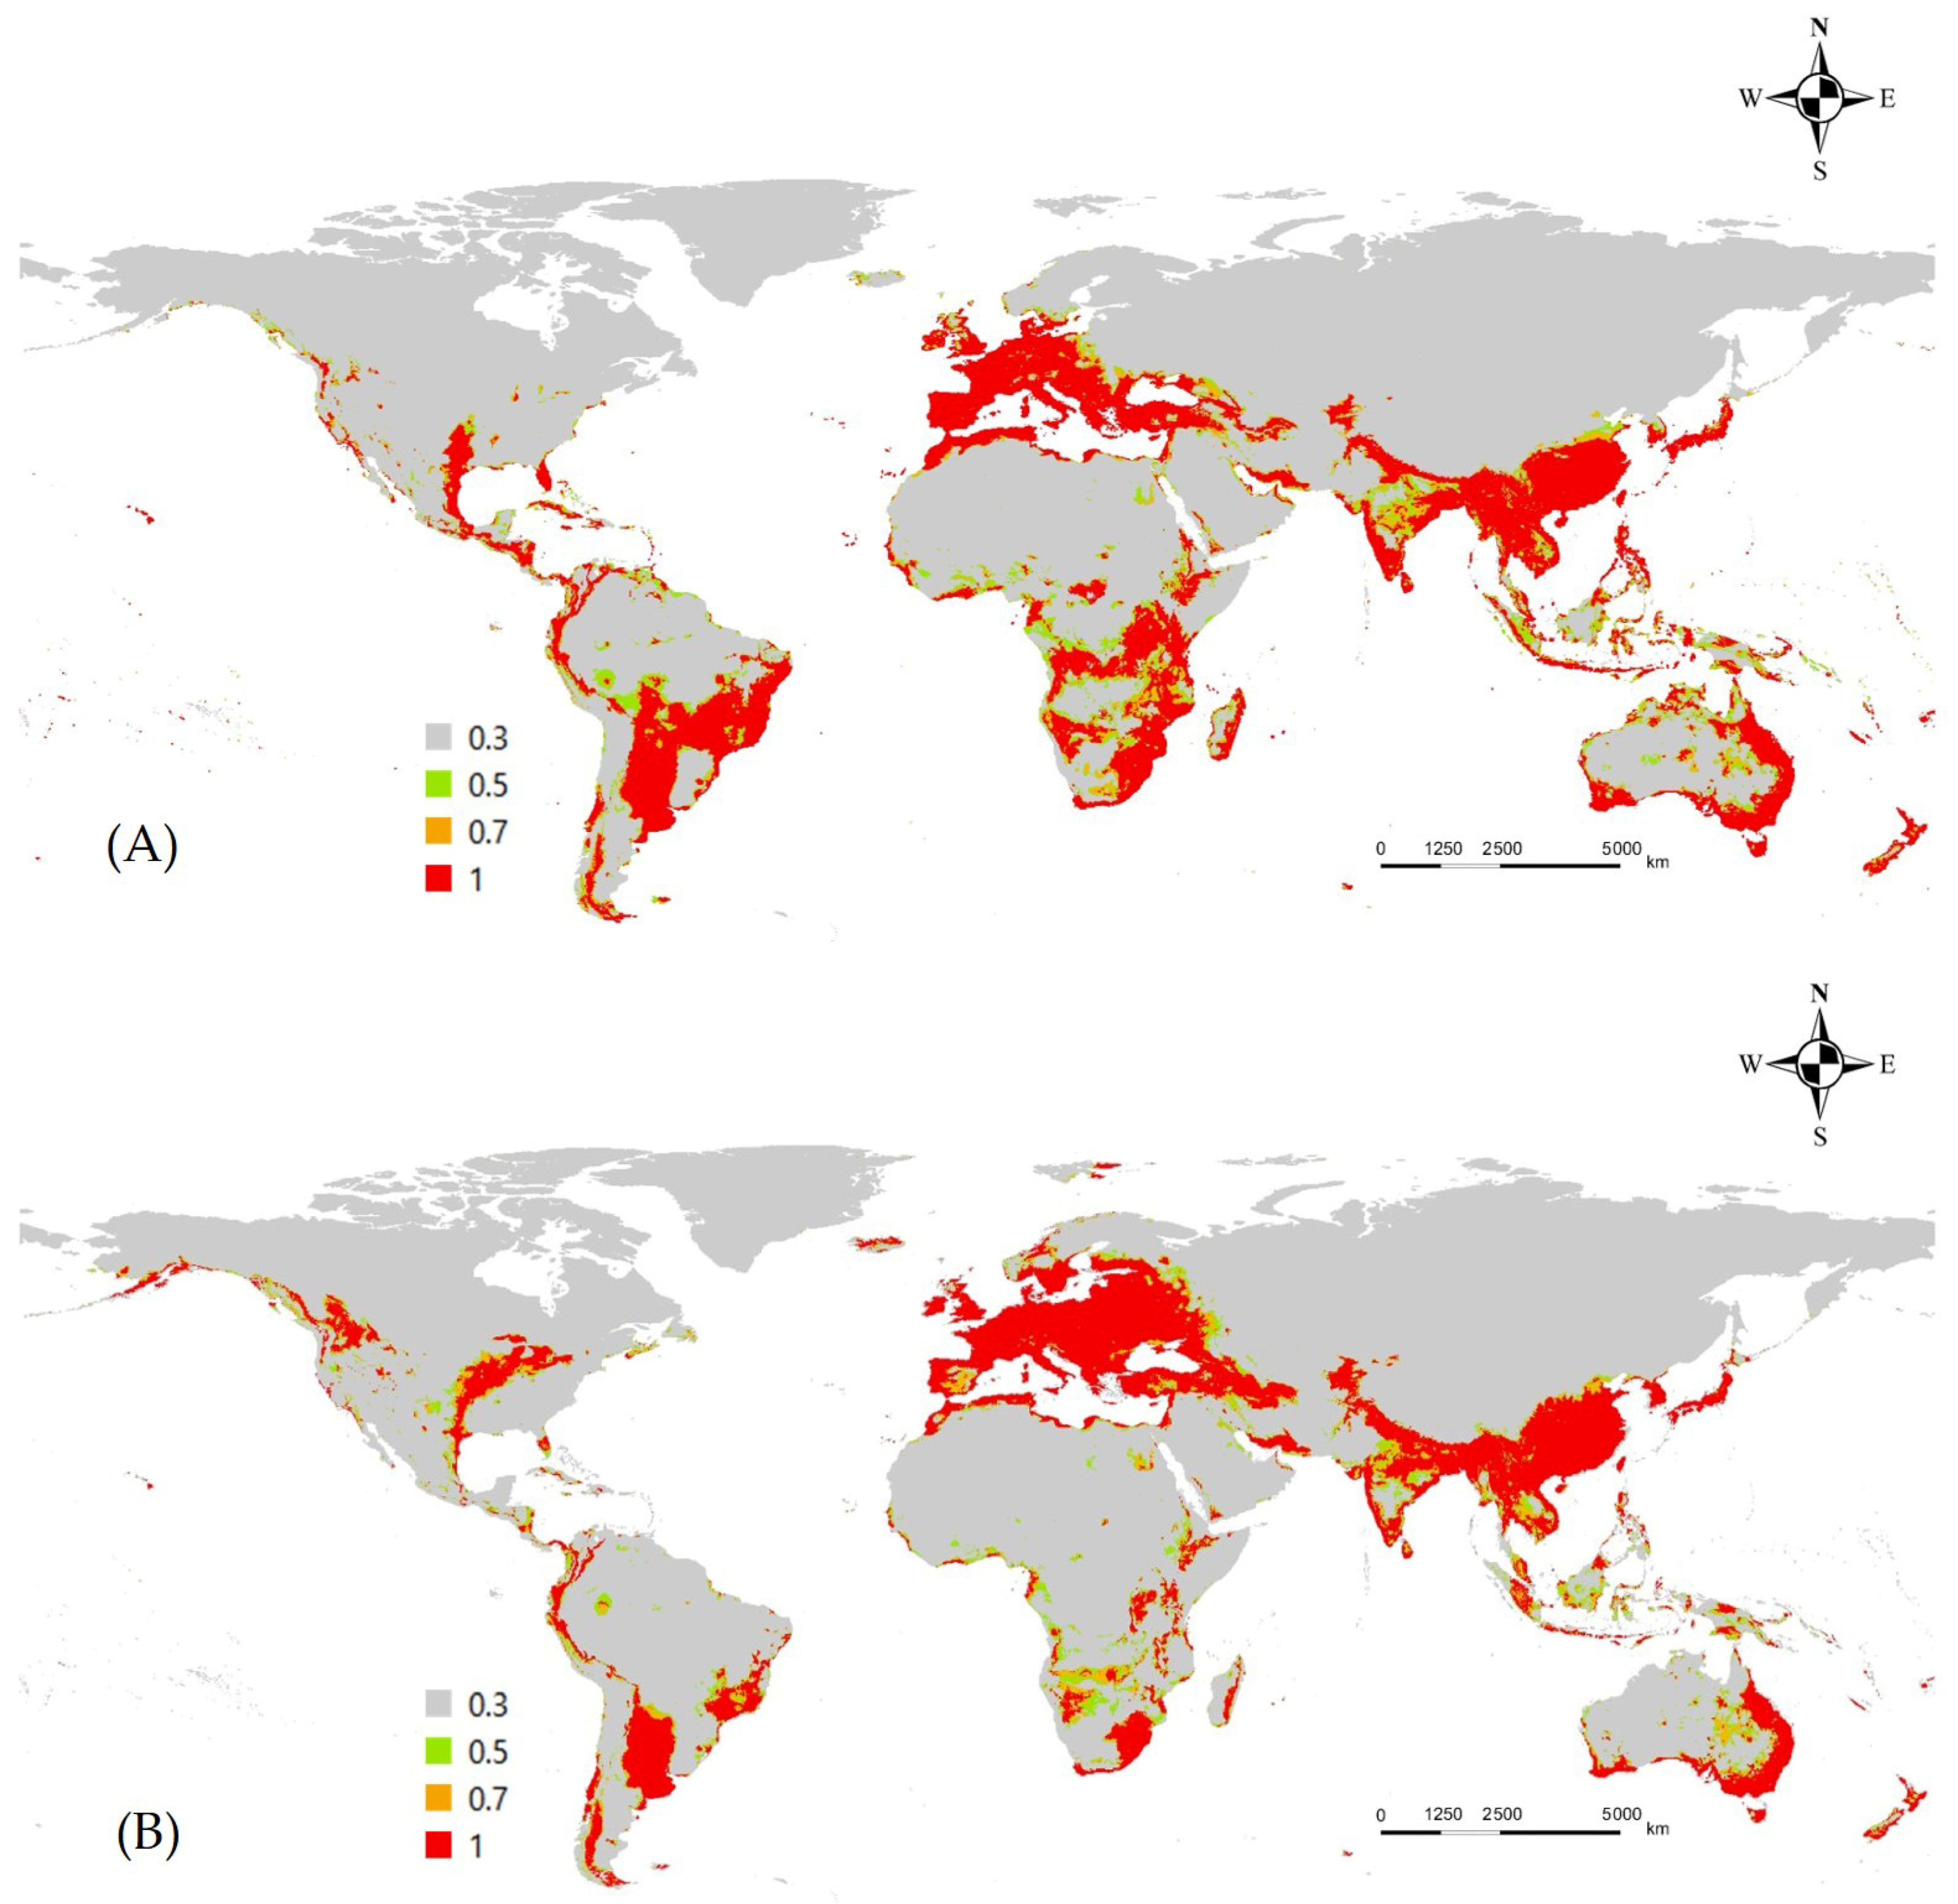
The RF model also predicted high suitability in tropical, subtropical, and temperate regions. However, the key contributing factors were slightly different: the minimum temperature of the coldest month (bio6), precipitation of the coldest quarter (bio19), and the mean diurnal range (bio2). Compared to MaxEnt, the predicted optimal habitat range was much narrower. Notably, some equatorial regions (e.g., Borneo) and the Australian Outback showed low suitability, creating clearer boundaries between suitable and unsuitable areas. Conversely, RF predicted notably higher suitability across Europe and an extensive suitable region in the southwestern United States. Under the SSP5-8.5 scenario, the model projected a similar northward expansion in the Northern Hemisphere, but also a decline in habitat suitability in parts of South America and Southern Africa (Figure 3).

3.3. Ensemble Prediction of L. boeticus Potential Distribution with Consideration of Host Production and Global Pulse-Crop Production Area with Potential Risk Area Assessment

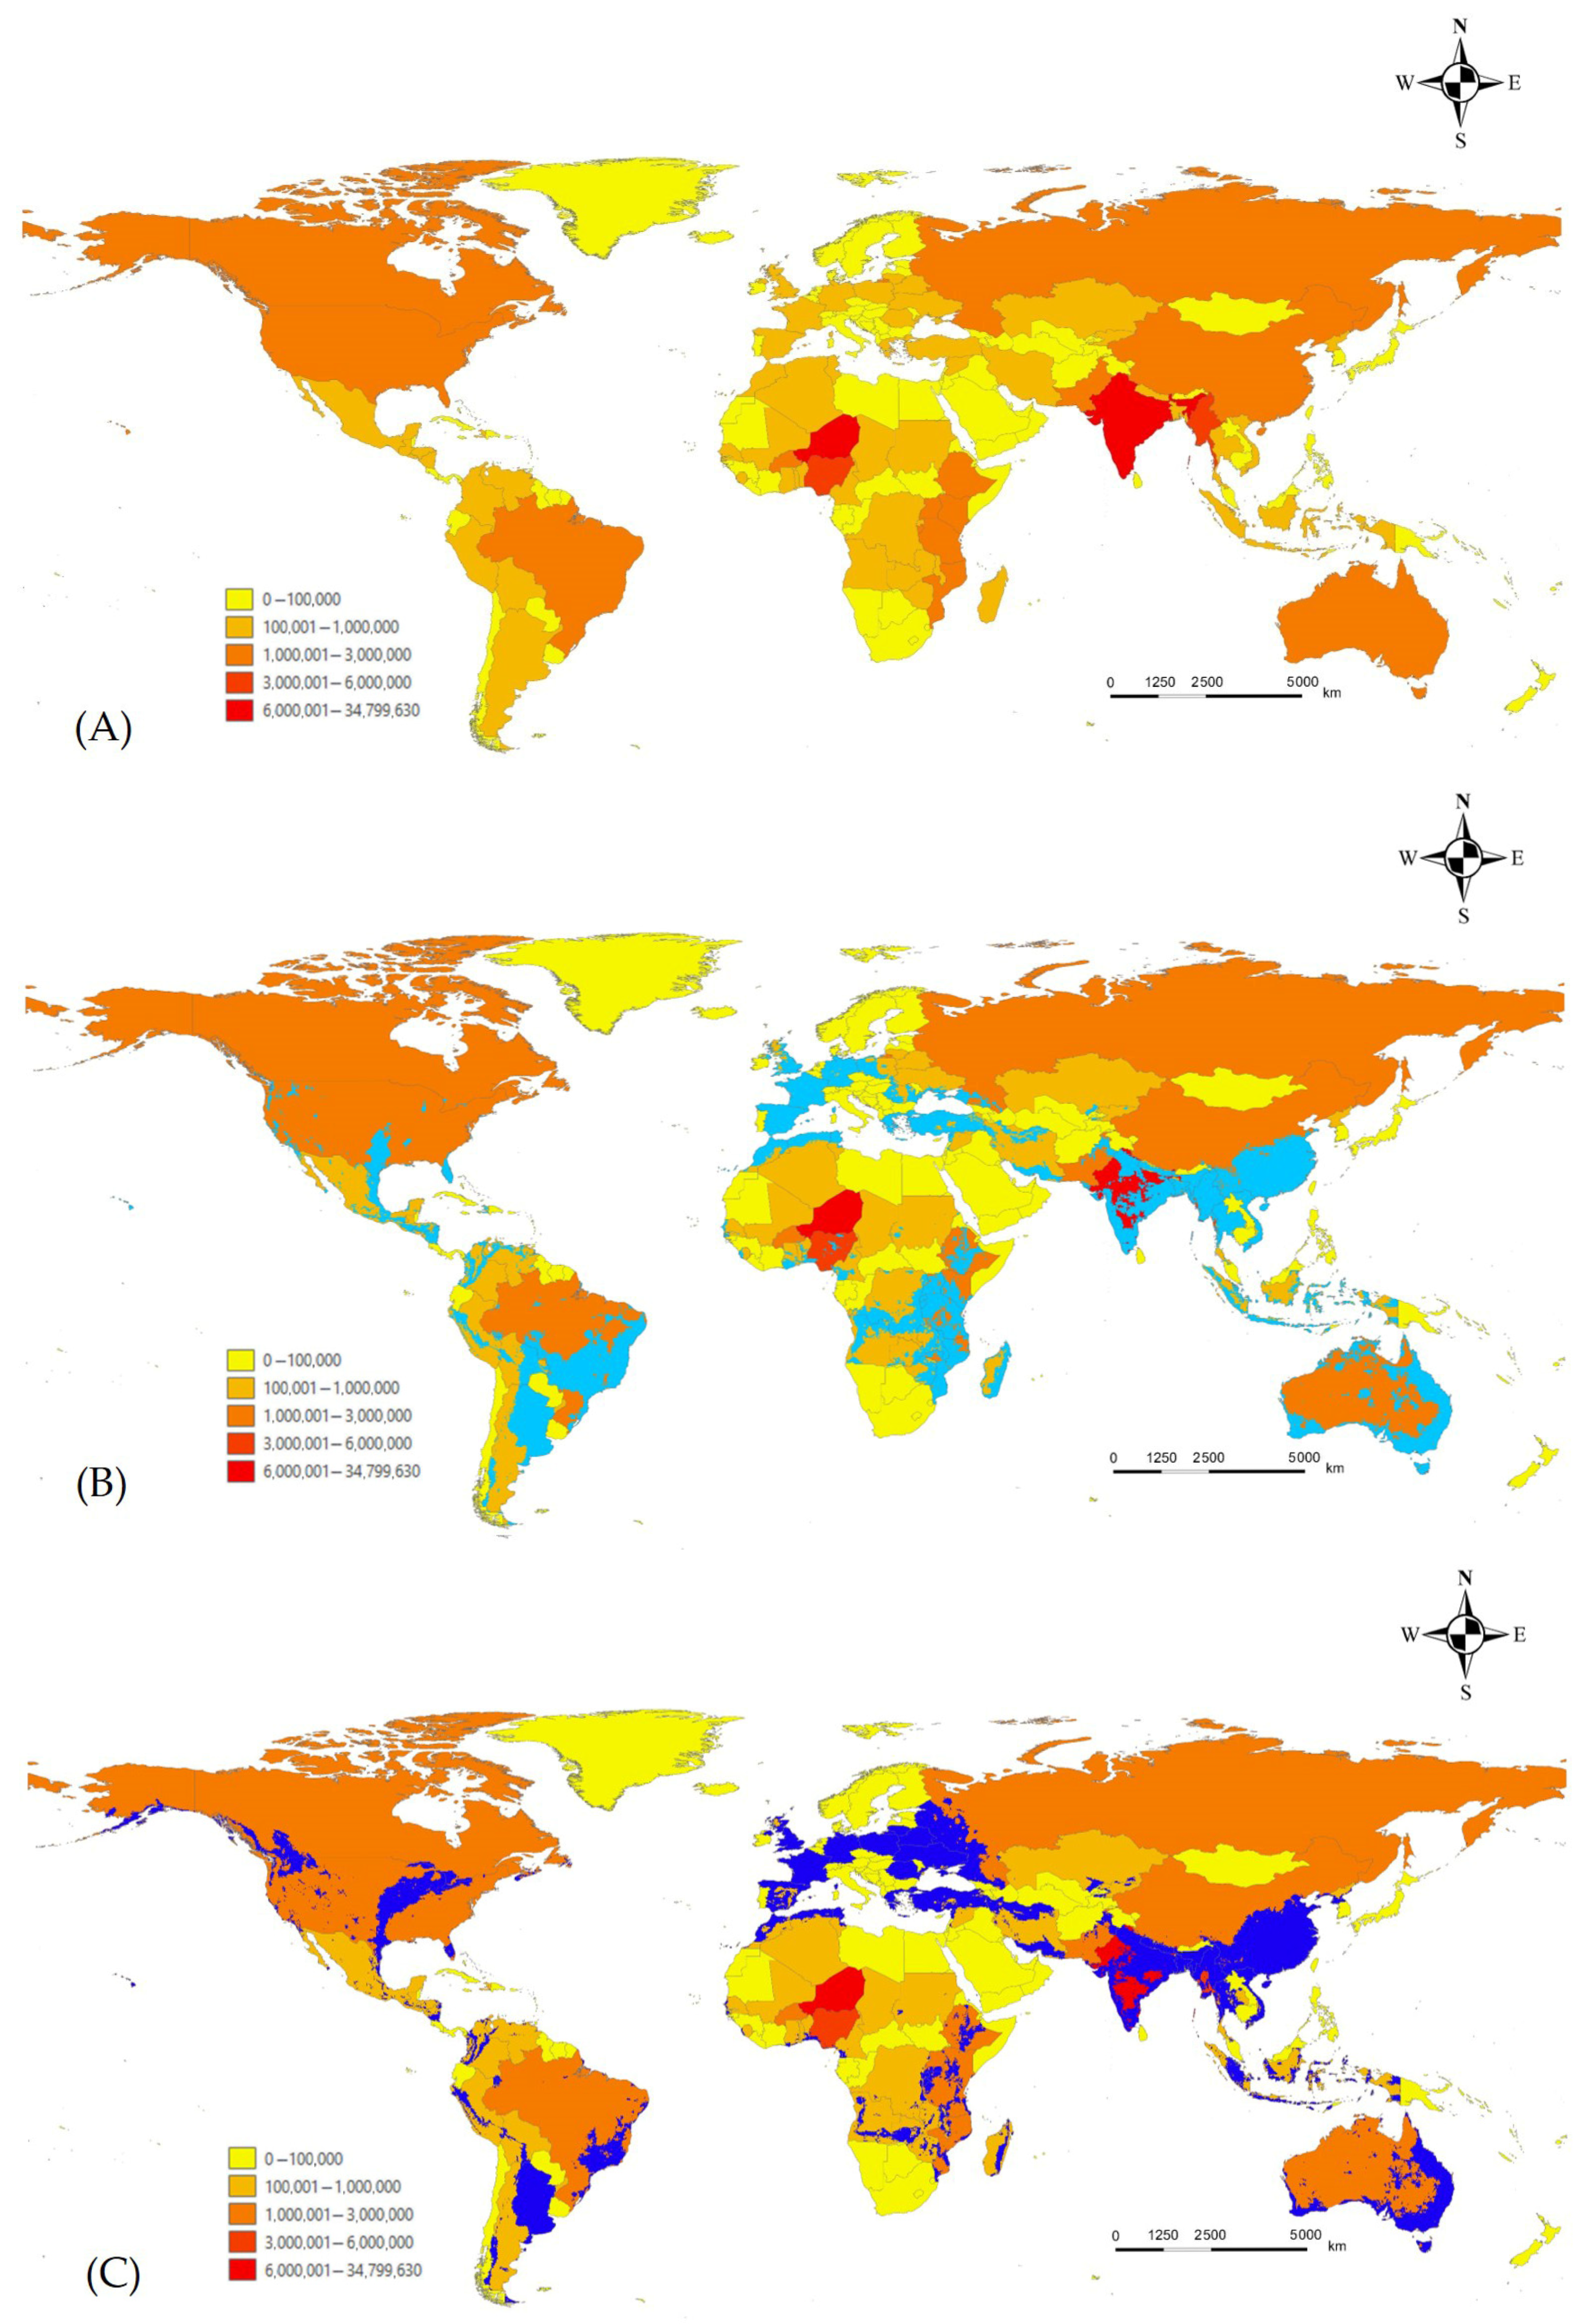
The ensemble model, which averages the predictions, showed a reduction in the area classified as “very highly suitable” (suitability > 0.7) but an increase in “high” (0.5–0.7) and “medium” (0.3–0.5) suitability areas. This smoothing effect was particularly evident in Europe, reflecting the broader predictions of the MaxEnt model. According to the ensemble model, the primary risk areas for this pest include India, China, Southeast Asia, parts of Australia and New Zealand, most of Europe, and parts of Africa and the Americas. While most of these areas are predicted to remain suitable under climate change, regions in South America and Africa may see a decline. Conversely, the Baltic countries, Ukraine, and several U.S. states (Kansas, Missouri, Iowa, Illinois, and Michigan) are projected to become significantly more suitable in the future (Figure 4).
To evaluate agricultural risk, we overlaid the predicted potential distribution (ensemble model; suitability > 0.5) with data on pulse-crop cultivation. Countries with over 1 million hectares of pulse cultivation that also fall within areas of high habitat suitability for L. boeticus include India, Pakistan, China, Myanmar, Australia, the United States, Brazil, and several African nations [54]. Under the future climate scenario, these risk areas are projected to expand northward in North America and Eurasia. In contrast, a significant reduction in risk is projected for southeastern South America and parts of Africa (Figure 5).

4. Discussion

In this study, we developed and compared MaxEnt and RF models for L. boeticus and projected their potential distributions according to climate change. The model performance metrics of AUC and TSS showed fair effectiveness in predicting the target species, meeting the standard criteria for the metrics. This suggests that the developed models adequately explain the possibility of the occurrence of the species. However, the RF model showed much better performance in terms of AUC, accuracy, and TSS than the MaxEnt model. As the occurrence coordinates of L. boeticus were relatively abundant in Europe, the MaxEnt model was influenced more by data bias, even with spatial filtering. In contrast, the performance index of the RF model, which effectively utilized pseudo-absence data, demonstrated a comparatively superior performance level. Regardless of the evaluation index employed, several island areas (Ascension, Saipan, Chuuk, Marshall, and Norfolk) that exhibit high habitat suitability despite the absence of coordinates used in the model have been confirmed in the literature, allowing for the verification of model performance in areas without coordinates [55,56,57,58].
Among the environmental variables, the minimum temperature in the coldest month was the most influential regardless of the model. This finding aligns with the ecological profile of L. boeticus, a species primarily found in tropical and subtropical zones and have limitations in northern and southern areas whose range is constrained by its thermal developmental thresholds [41,42]. It was assumed that variables other than the minimum temperature of the coldest month, which had the greatest influence, showed different results owing to differences in the model algorithms. The precipitation of the wettest month or warmest/coldest quarter also considerably influenced the models, which is consistent with previous studies indicating substantial impacts of precipitation and humidity on L. boeticus species [42,59,60,61]. Additionally, the mean diurnal range considerably influenced the RF model, which is consistent with the results of other lepidoptran species distribution studies [62,63,64]. The survival of a butterfly is substantially impacted by body temperature requiring them to regulate their body temperature within an appropriate range [63,65]. As small ectothermic animals, butterflies are highly reliant on their environment for thermoregulation, making them particularly sensitive to fluctuations in temperature [63,66].
Spatially, both models identified high suitability across a broad spectrum of tropical, subtropical, and temperate regions, largely aligning with the coordinates of L. boeticus, CABI, and the distribution literature [1,26,27]. Suitability was highest in India, where the pest causes the most reported damage. However, it also exhibited high suitability in some regions of China and Southeast Asia. The MaxEnt model tended to underestimate suitability in Europe and overestimate it in Australia. In contrast, the RF model appears to underestimate the suitability in the equatorial regions. The limitations of each model were addressed through an average-based ensemble approach, resulting in a model that reflected a more realistic suitability pattern.
Given its strong migratory ability, this species is expected to encounter minimal habitat restrictions, aside from climatic factors, owing to its diverse range of host plants. Notably, it predominantly feeds on legumes as its primary food source among the various available host plants. India is one of the world’s top pulse-producing countries, along with China, Myanmar, the United States, and Brazil, which exhibit high habitat suitability for L. boeticus [54]. Within the Old Continent, where L. boeticus is distributed, China, Myanmar, and India are countries with high-pulse cultivation. However, instances of damage have not been reported as much as in India [67,68]. In Myanmar and China, which have favorable climatic conditions, the population of L. boeticus is believed to be regulated by interspecific competition, natural enemies, and other biological factors to a different degree than in India. If this species were to invade countries with high-pulse cultivation areas, such as the United States, Brazil, Argentina, and Mexico, where it is not currently present, the potential for significant damage is high. Particularly in Central America, including the south-central United States (Florida, Texas, Oklahoma), eastern Mexico, and South America, where the habitat is highly suitable, the risk of damage is considerable in parts of Venezuela, Colombia, Ecuador, Peru, Bolivia, Paraguay, eastern Argentina, and southeastern Brazil. In addition, it is important to be cautious when considering the expansion of suitable habitats for L. boeticus to the northeastern United States, northeastern South America, and northeastern Europe, as these areas are likely to be at risk due to climate change. This species, with a serious impact on pulse-crop cultivation, is expected to have more outbreaks because of climate change. Therefore, quarantine is crucial in countries where this species is not present, while countries where it has already established should prepare for management using strategies including the application of pesticides and resistant varieties [9,12,69].
In the present study, we assessed the potential distribution of L. boeticus and identified regions vulnerable to damage in relation to climatic variables. Our analysis indicates specific areas with favorable climatic conditions for this species, highlighting the need for cautious monitoring to prevent invasion. This study provides fundamental data for creating effective management strategies.

Author Contributions

Conceptualization, J.H.H. and W.-H.L.; methodology, J.H.H., S.Y. and W.-H.L.; software, J.H.H., S.Y. and W.-H.L.; validation, J.H.H. and W.-H.L.; formal analysis, J.H.H. and W.-H.L.; investigation, J.H.H. and W.-H.L.; resources, J.H.H. and W.-H.L.; data curation, J.H.H. and S.Y.; writing—original draft preparation, J.H.H. and W.-H.L.; writing—review and editing, J.H.H. and W.-H.L.; visualization, J.H.H.; supervision, W.-H.L.; project administration, J.H.H. and W.-H.L.; funding acquisition, J.H.H. and W.-H.L. All authors have read and agreed to the published version of the manuscript.

Funding

This work was carried out with the support of “Cooperative Research Program for Agriculture Science and Technology Development (Project No. RS-2025-02214176)” Rural Development Administration, Republic of Korea.

Data Availability Statement

Data is contained within the article.

Conflicts of Interest

The authors declare no conflicts of interest.

References

  1. Lohman, D.J.; Peggie, D.; Pierce, N.E.; Meier, R. Phylogeography and genetic diversity of a widespread Old World butterfly, Lampides boeticus (Lepidoptera: Lycaenidae). BMC Evol. Biol. 2008, 8, 301. [Google Scholar] [CrossRef]
  2. Barbudo, J.; González, J.R.; Haeger, J.F. Capparis spinosa (Capparidaceae): An oviposition substrate for Lampides boeticus Linnaeus, in southern Spain (Lepidoptera: Lycaenidae). Nota Lepidopterol. 1987, 10, 218–223. [Google Scholar]
  3. Jordano, D.; Rodríguez, J. Nuevas citas de plantas nutricias para tres especies de ropalóceros. Shilap Revta. Lepid. 1987, 10, 218–223. [Google Scholar]
  4. Natural History Museum (NHM). HOSTS—A Database of the World’s Lepidopteran Hostplants. Available online: https://data.nhm.ac.uk/dataset/hosts/resource/877f387a-36a3-486c-a0c1-b8d5fb69f85a (accessed on 25 May 2024).
  5. Abdallah, Y.E. Effect of plant traps and sowing dates on population density of major soybean pests. J. Basic Appl. Zool. 2012, 65, 37–46. [Google Scholar] [CrossRef]
  6. Askari, A.; Zare, N. Effect of foliar application of four insecticides on the yield of cowpea affected by the bean butterfly, Lycaena boetica L. (Lepidoptera: Lycaenidae). Indian J. Agric. Sci. 1975, 45, 470–472. [Google Scholar]
  7. Dialoke, S.A.; Akparobi, S.O.; Abraham, N.; Kennedy, O.; Frank, O.O.; Christopher, E. Effect of Color Sticky Traps on the Population of Major Pests of Improved Pigeon Pea (Cajanus cajan (L.) Millsp) Cultivar and Its Yield in Owerri, Imo State, Nigeria. Int. J. Sci. Technoledge 2019, 7, 12–20. [Google Scholar] [CrossRef]
  8. Hiroshi, H.; Tetsuro, S.; Yoshiharu, M. Oviposition and Larval Feeding Habits of the Pea Blue, Lampides boeticus L. (Lepidoptera: Lycaenidae) on the Lablab Bean, Dolichos lablab L. Jpn. J. Appl. Entomol. Zool. 1985, 29, 26–30. [Google Scholar]
  9. Khidher, K.Q. Susceptibility of Cowpea varieties to infestation by Pea blue Butterfly, Lampides boeticus (Linnaeus) (Lepidoptera: Lycaenidae). Tikrit J. Agric. Sci. 2024, 24, 1–8. [Google Scholar] [CrossRef]
  10. Marchal, P. Report on injurious insects in France during the year 1913. Rev. De. Phytopathol. Appl. 1914, 19, 9–13. [Google Scholar]
  11. Minja, E.M.; Shanower, T.G.; Silim, S.N.; Karuru, O. Efficacy of different insecticides for pigeonpea pest management in Kenya. Int. Chickpea Pigeonpea Newsl. 2000, 7, 53–55. [Google Scholar]
  12. Muthukrishnan, N. In-Vivo and field evaluation of spinetoram 12 SC against Lampides boeticus on pigeonpea. Legume Res. Int. J. 2017, 40, 1126–1132. [Google Scholar] [CrossRef][Green Version]
  13. Schreinemachers, P.; Srinivasan, R.; Wu, M.H.; Bhattarai, M.; Patricio, R.; Yule, S.; Quang, V.H.; Hop, B.T.H. Safe and sustainable management of legume pests and diseases in Thailand and Vietnam: A situational analysis. Int. J. Trop. Insect Sci. 2014, 34, 88–97. [Google Scholar] [CrossRef]
  14. Durairaj, C. Evaluation of certain Neem formulations and insecticides against pigon pea pod fly. Indian J. Pulses Res. 2006, 19, 269–270. [Google Scholar]
  15. AL-Janabi, N.H.; Al-Karboli, H.H. Damage assessment of the pea blue butterfly Lampides boeticus L. (Lepidoptera: Lycaenidae) on cowpea (Vignaung uiculata). J. Biodivers. Environ. Sci. 2017, 11, 268–273. [Google Scholar]
  16. National Institute of Biological Resources (NIBR). Available online: https://species.nibr.go.kr/home/mainHome.do?cont_link=009&subMenu=009002&contCd=009002&ktsn=120000034429 (accessed on 25 May 2024).
  17. Colvin, M. Rearing the Long-Tailed Blue—Personal Observations. Available online: http://www.dispar.org/reference.php?id=5 (accessed on 25 January 2024).
  18. Ma, G.; Peng, Q.; Pan, X.; Xie, M.; Liao, J.; Wu, C.; Yang, M. Maximum Entropy Model Prediction of the Distributions of Two Sympatric Bean Weevil Species, Megabruchidius dorsalis (Fahraeus, 1839) and Bruchidius coreanus (Chûjô, 1937), under Various Climate Scenarios in Guizhou Province, China. Forests 2024, 15, 300. [Google Scholar] [CrossRef]
  19. Yang, M.; Wang, Y.; Ding, W.; Li, H.; Zhang, A. Predicting habitat suitability for the soybean pod borer Leguminivora glycinivorella (Matsumura) using optimized MaxEnt models with multiple variables. J. Econ. Entomol. 2024, 117, 1796–1808. [Google Scholar] [CrossRef]
  20. Byeon, D.H.; Jung, S.; Lee, W.H. Review of CLIMEX and MaxEnt for studying species distribution in South Korea. J. Asia Pac. Biodivers. 2018, 11, 325–333. [Google Scholar] [CrossRef]
  21. Phillips, S.J.; Anderson, R.P.; Schapire, R.E. Maximum entropy modeling of species geographic distributions. Ecol. Modell. 2006, 190, 231–259. [Google Scholar] [CrossRef]
  22. Wei, J.; Zhang, H.; Zhao, W.; Zhao, Q. Niche shifts and the potential distribution of Phenacoccus solenopsis (Hemiptera: Pseudococcidae) under climate change. PLoS ONE 2017, 12, e0180913. [Google Scholar] [CrossRef]
  23. Wisz, M.S.; Hijmans, R.J.; Li, J.; Peterson, A.T.; Graham, C.H.; Guisan, A. NCEAS predicting species distributions working group. Effects of sample size on the performance of species distribution models. Divers. Distrib. 2008, 14, 763–773. [Google Scholar] [CrossRef]
  24. Evans, J.S.; Murphy, M.A.; Holden, Z.A.; Cushman, S.A. Modeling Species Distribution and Change Using Random Forest; Springer: New York, NY, USA, 2011; pp. 139–159. [Google Scholar]
  25. Lee, W.H.; Song, J.W.; Yoon, S.H.; Jung, J.M. Spatial evaluation of machine learning-based species distribution models for prediction of invasive ant species distribution. Appl. Sci. 2022, 12, 10260. [Google Scholar] [CrossRef]
  26. Centre for Agriculture and Bioscience International (CABI). PlantwisePlus Knowledge Bank. Available online: https://plantwiseplusknowledgebank.org/doi/full/10.1079/pwkb.species.29761 (accessed on 25 May 2024).
  27. Global Biodiversity Information Facility (GBIF). Occurrence Download. Available online: https://doi.org/10.15468/39omei (accessed on 25 May 2024).
  28. Brown, J.L. SDM toolbox: A python-based GIS toolkit for landscape genetic, biogeographic and species distribution model analyses. Methods Ecol. Evol. 2014, 5, 694–700. [Google Scholar] [CrossRef]
  29. McQuillan, M.A.; Rice, A.M. Differential effects of climate and species interactions on range limits at a hybrid zone: Potential direct and indirect impacts of climate change. Ecol. Evol. 2015, 5, 5120–5137. [Google Scholar] [CrossRef]
  30. Mudereri, B.T.; Mukanga, C.; Mupfiga, E.T.; Gwatirisa, C.; Kimathi, E.; Chitata, T. Analysis of potentially suitable habitat within migration connections of an intra-African migrant-the Blue Swallow (Hirundo atrocaerulea). Ecol. Inf. 2020, 57, 101082. [Google Scholar] [CrossRef]
  31. R Core Team. R: A Language and Environment for Statistical Computing; R Foundation for Statistical Computing: Vienna, Austria, 2021. [Google Scholar]
  32. Venables, W.N.; Ripley, B.D. Modern Applied Statistics with S-PLUS; Springer Science & Business Media: Berlin/Heidelberg, Germany, 2013; ISBN 978-038-721-706-2. [Google Scholar]
  33. Kramer-Schadt, S.; Niedballa, J.; Pilgrim, J.D.; Schröder, B.; Lindenborn, J.; Reinfelder, V.; Stillfried, M.; Heckmann, I.; Scharf, A.K.; Augeri, D.M.; et al. The importance of correcting for sampling bias in MaxEnt species distribution models. Divers. Distrib. 2013, 19, 1366–1379. [Google Scholar] [CrossRef]
  34. Hwang, J.H.; Kim, S.H.; Yoon, S.; Jung, S.; Kim, D.H.; Lee, W.H. Evaluation of Spatial Distribution of Three Major Leptocorisa (Hemiptera: Alydidae) Pests Using MaxEnt Model. Insects 2022, 13, 750. [Google Scholar] [CrossRef] [PubMed]
  35. Fick, S.E.; Hijmans, R.J. WorldClim 2: New 1-km spatial resolution climate surfaces for global land areas. Int. J. Climatol. 2017, 37, 4302–4315. [Google Scholar] [CrossRef]
  36. Harris, I.; Osborn, T.J.; Jones, P.; Lister, D. Version 4 of the CRU TS monthly high-resolution gridded multivariate climate dataset. Sci. Data 2020, 7, 109. [Google Scholar] [CrossRef]
  37. Kim, G.Y.; Lee, W.H. Prediction of the spatial distribution of vine weevil under climate change using multiple variable selection methods. Sci. Rep. 2025, 15, 7845. [Google Scholar] [CrossRef]
  38. Hijmans, R.J.; Phillips, S.; Leathwick, J.; Elith, J.; Hijmans, M.R.J. Package ‘dismo’. Circles 2017, 9, 1–68. [Google Scholar]
  39. Zhang, K.; Yao, L.; Meng, J.; Tao, J. Maxent modeling for predicting the potential geographical distribution of two peony species under climate change. Sci. Total Environ. 2018, 634, 1326–1334. [Google Scholar] [CrossRef] [PubMed]
  40. Huercha; Song, R.; Ma, Y.; Hu, Z.; Li, Y.; Li, M.; Wu, L.; Li, C.; Dao, E.; Fan, X.; et al. MaxEnt Modeling of Dermacentor marginatus (Acari: Ixodidae) Distribution in Xinjiang, China. J. Med. Entomol. 2020, 57, 1659–1667. [Google Scholar] [CrossRef] [PubMed]
  41. Saxena, K.; Ujagir, R. Effect of temperature and relative humidity on pod borer in pigeonpea. J. Food Legumes 2007, 20, 121. [Google Scholar]
  42. Subharani, S.; Singh, T.K. Population dynamics of pod borer complex in pigeonpea in relation to abiotic factors. Indian J. Entomol. 2009, 71, 215–218. [Google Scholar]
  43. Amdouni, J.; Conte, A.; Ippoliti, C.; Candeloro, L.; Tora, S.; Sghaier, S.; Hassine, T.B.; Fakhfekh, E.A.; Hammami, S. Culex pipiens distribution in Tunisia: Identification of suitable areas through Random Forest and MaxEnt approaches. Vet. Med. Sci. 2022, 8, 2703–2715. [Google Scholar] [CrossRef]
  44. Tatebe, H.; Ogura, T.; Nitta, T.; Komuro, Y.; Ogochi, K.; Takemura, T.; Sudo, K.; Sekiguchi, M.; Abe, M.; Saito, F.; et al. Description and basic evaluation of simulated mean state, internal variability, and climate sensitivity in MIROC6. Geosci. Model Dev. 2019, 12, 2727–2765. [Google Scholar] [CrossRef]
  45. Guo, J.; Liang, X.; Wang, X.; Fan, Y.; Liu, L. Potential benefits of limiting global warming for the mitigation of temperature extremes in China. Npj Clim. Atmos. Sci. 2023, 6, 106. [Google Scholar] [CrossRef]
  46. Vignali, S.; Barras, A.G.; Arlettaz, R.; Braunisch, V. SDMtune: An R package to tune and evaluate species distribution models. Ecol. Evol. 2020, 10, 11488–11506. [Google Scholar] [CrossRef]
  47. Muscarella, R.; Galante, P.J.; Soley-Guardia, M.; Boria, R.A.; Kass, J.M.; Uriarte, M.; Anderson, R.P. ENM eval: An R package for conducting spatially independent evaluations and estimating optimal model complexity for Maxent ecological niche models. Methods Ecol. Evol. 2014, 5, 1198–1205. [Google Scholar] [CrossRef]
  48. Iturbide, M.; Bedia, J.; Herrera, S.; del Hierro, O.; Pinto, M.; Gutiérrez, J.M. A framework for species distribution modelling with improved pseudo-absence generation. Ecol. Model. 2015, 312, 166–174. [Google Scholar] [CrossRef]
  49. Cutler, D.R.; Edwards Jr, T.C.; Beard, K.H.; Cutler, A.; Hess, K.T.; Gibson, J.; Lawler, J.J. Random forests for classification in ecology. Ecology 2007, 88, 2783–2792. [Google Scholar] [CrossRef] [PubMed]
  50. Li, Y.; Li, M.; Li, C.; Liu, Z. Optimized maxent model predictions of climate change impacts on the suitable distribution of Cunninghamia lanceolata in China. Forests 2020, 11, 302. [Google Scholar] [CrossRef]
  51. Ben Rais Lasram, F.; Guilhaumon, F.; Albouy, C.; Somot, S.; Thuiller, W.; Mouillot, D. The Mediterranean Sea as a ‘cul-de-sac’ for endemic fishes facing climate change. Glob. Change Biol. 2010, 16, 3233–3245. [Google Scholar] [CrossRef]
  52. Allouche, O.; Tsoar, A.; Kadmon, R. Assessing the accuracy of species distribution models: Prevalence, kappa and the true skill statistic (TSS). J. Appl. Ecol. 2006, 43, 1223–1232. [Google Scholar] [CrossRef]
  53. Liu, C.; White, M.; Newell, G. Selecting thresholds for the prediction of species occurrence with presence-only data. J. Biogeogr. 2013, 40, 778–789. [Google Scholar] [CrossRef]
  54. Food and Agriculture Organization of the United Nations (FAO). Crops and Livestock Products. Available online: https://www.fao.org/faostat/en/#data/QCL (accessed on 3 February 2025).
  55. Buden, D.W.; Tennent, W.J. Butterflies (Lepidoptera) of the Republic of the Marshall Islands. Pac. Sci. 2017, 71, 511–522. [Google Scholar] [CrossRef]
  56. Duffey, E. The terrestrial ecology of Ascension Island. J. Appl. Ecol. 1964, 1, 219–251. [Google Scholar] [CrossRef]
  57. Schreiner, I.H.; Nafus, D.M. Butterflies of Micronesia; Agricultural Experiment Station, College of Agriculture and Life Sciences, University of Guam: Guam, GU, USA, 1997; pp. 1–40. [Google Scholar]
  58. Smithers, C.N. A species list and bibliography of the insects recorded from Norfolk Island. Tech. Rep. Aust. Mus. 1998, 13, 1–55. [Google Scholar] [CrossRef][Green Version]
  59. Pungavi, R.; Kandibane, M. Seasonal Abundance of Spotted pod borer Maruca vitrata and Pea blue butterfly Lampides boeticus on Urd bean. Int. J. Res. Anal. Rev. 2021, 8, 463–471. [Google Scholar]
  60. Shantibala, T.; Singh, T.K. Population dynamics of Lampides boeticus (Linnaeus) on pea crop in Manipur. Shashpa 2003, 10, 133–137. [Google Scholar]
  61. Shantibala, T.; Subharani, S.; Singh, T.K. Seasonal incidence of Lampides boeticus (Linnaeus) and influence of weather factors on its abundance on pigeonpea, Cajanus cajan (L.) Millsp. in Manipur. Indian J. Entomol. 2004, 66, 198–201. [Google Scholar]
  62. Mota, J.D.S.; Barbosa, L.R.; Marchioro, C.A. Suitable areas for invasive insect pests in Brazil and the potential impacts for eucalyptus forestry. Pest Manag. Sci. 2022, 78, 2596–2606. [Google Scholar] [CrossRef] [PubMed]
  63. Yang, F.; Liu, Q.; Yang, J.; Liu, B.; Deng, X.; Gan, T.; Liao, X.; Li, X.; Xu, D.; Zhuo, Z. Evaluating the Impact of Climate Change on the Asia Habitat Suitability of Troides helena Using the MaxEnt Model. Insects 2025, 16, 79. [Google Scholar] [CrossRef] [PubMed]
  64. Zhao, H.; Xian, X.; Zhao, Z.; Zhang, G.; Liu, W.; Wan, F. Climate change increases the expansion risk of Helicoverpa zea in China according to potential geographical distribution estimation. Insects 2022, 13, 79. [Google Scholar] [CrossRef]
  65. Ashe-Jepson, E.; Cobo, S.A.; Basset, Y.; Bladon, A.J.; Kleckova, I.; Laird-Hopkins, B.C.; Mcfarlane, A.; Sam, K.; Savage, A.F.; Zamora, A.C.; et al. Tropical Butterflies Use Thermal Buffering and Thermal Tolerance as Alternative Strategies to Cope with Temperature Increase. J. Anim. Ecol. 2023, 92, 1759–1770. [Google Scholar] [CrossRef]
  66. Bonebrake, T.C.; Deutsch, C.A. Climate Heterogeneity Modulates Impact of Warming on Tropical Insects. Ecology 2012, 93, 449–455. [Google Scholar] [CrossRef]
  67. Morris, H.; Waterhouse, D.F. The Distribution and Importance of Arthropod Pests and Weeds of Agriculture in Myanmar; Australian Centre for International Agricultural Research: Canberra, Australia, 2001; p. 73.
  68. Wang, W.L.; Suman, D.O.; Zhang, H.H.; Xu, Z.B.; Ma, F.Z.; Hu, S.J. Butterfly conservation in China: From science to action. Insects 2020, 11, 661. [Google Scholar] [CrossRef]
  69. Quishpe, A.L.C.; Gallegos, P.G. Análisis de riesgo de plagas para la importación de fréjol seco (Phaseolus vulgaris L.) proveniente de China. quito–ecuador. 2007. RUMIPAMBA 2008, 24, 1–14. [Google Scholar]
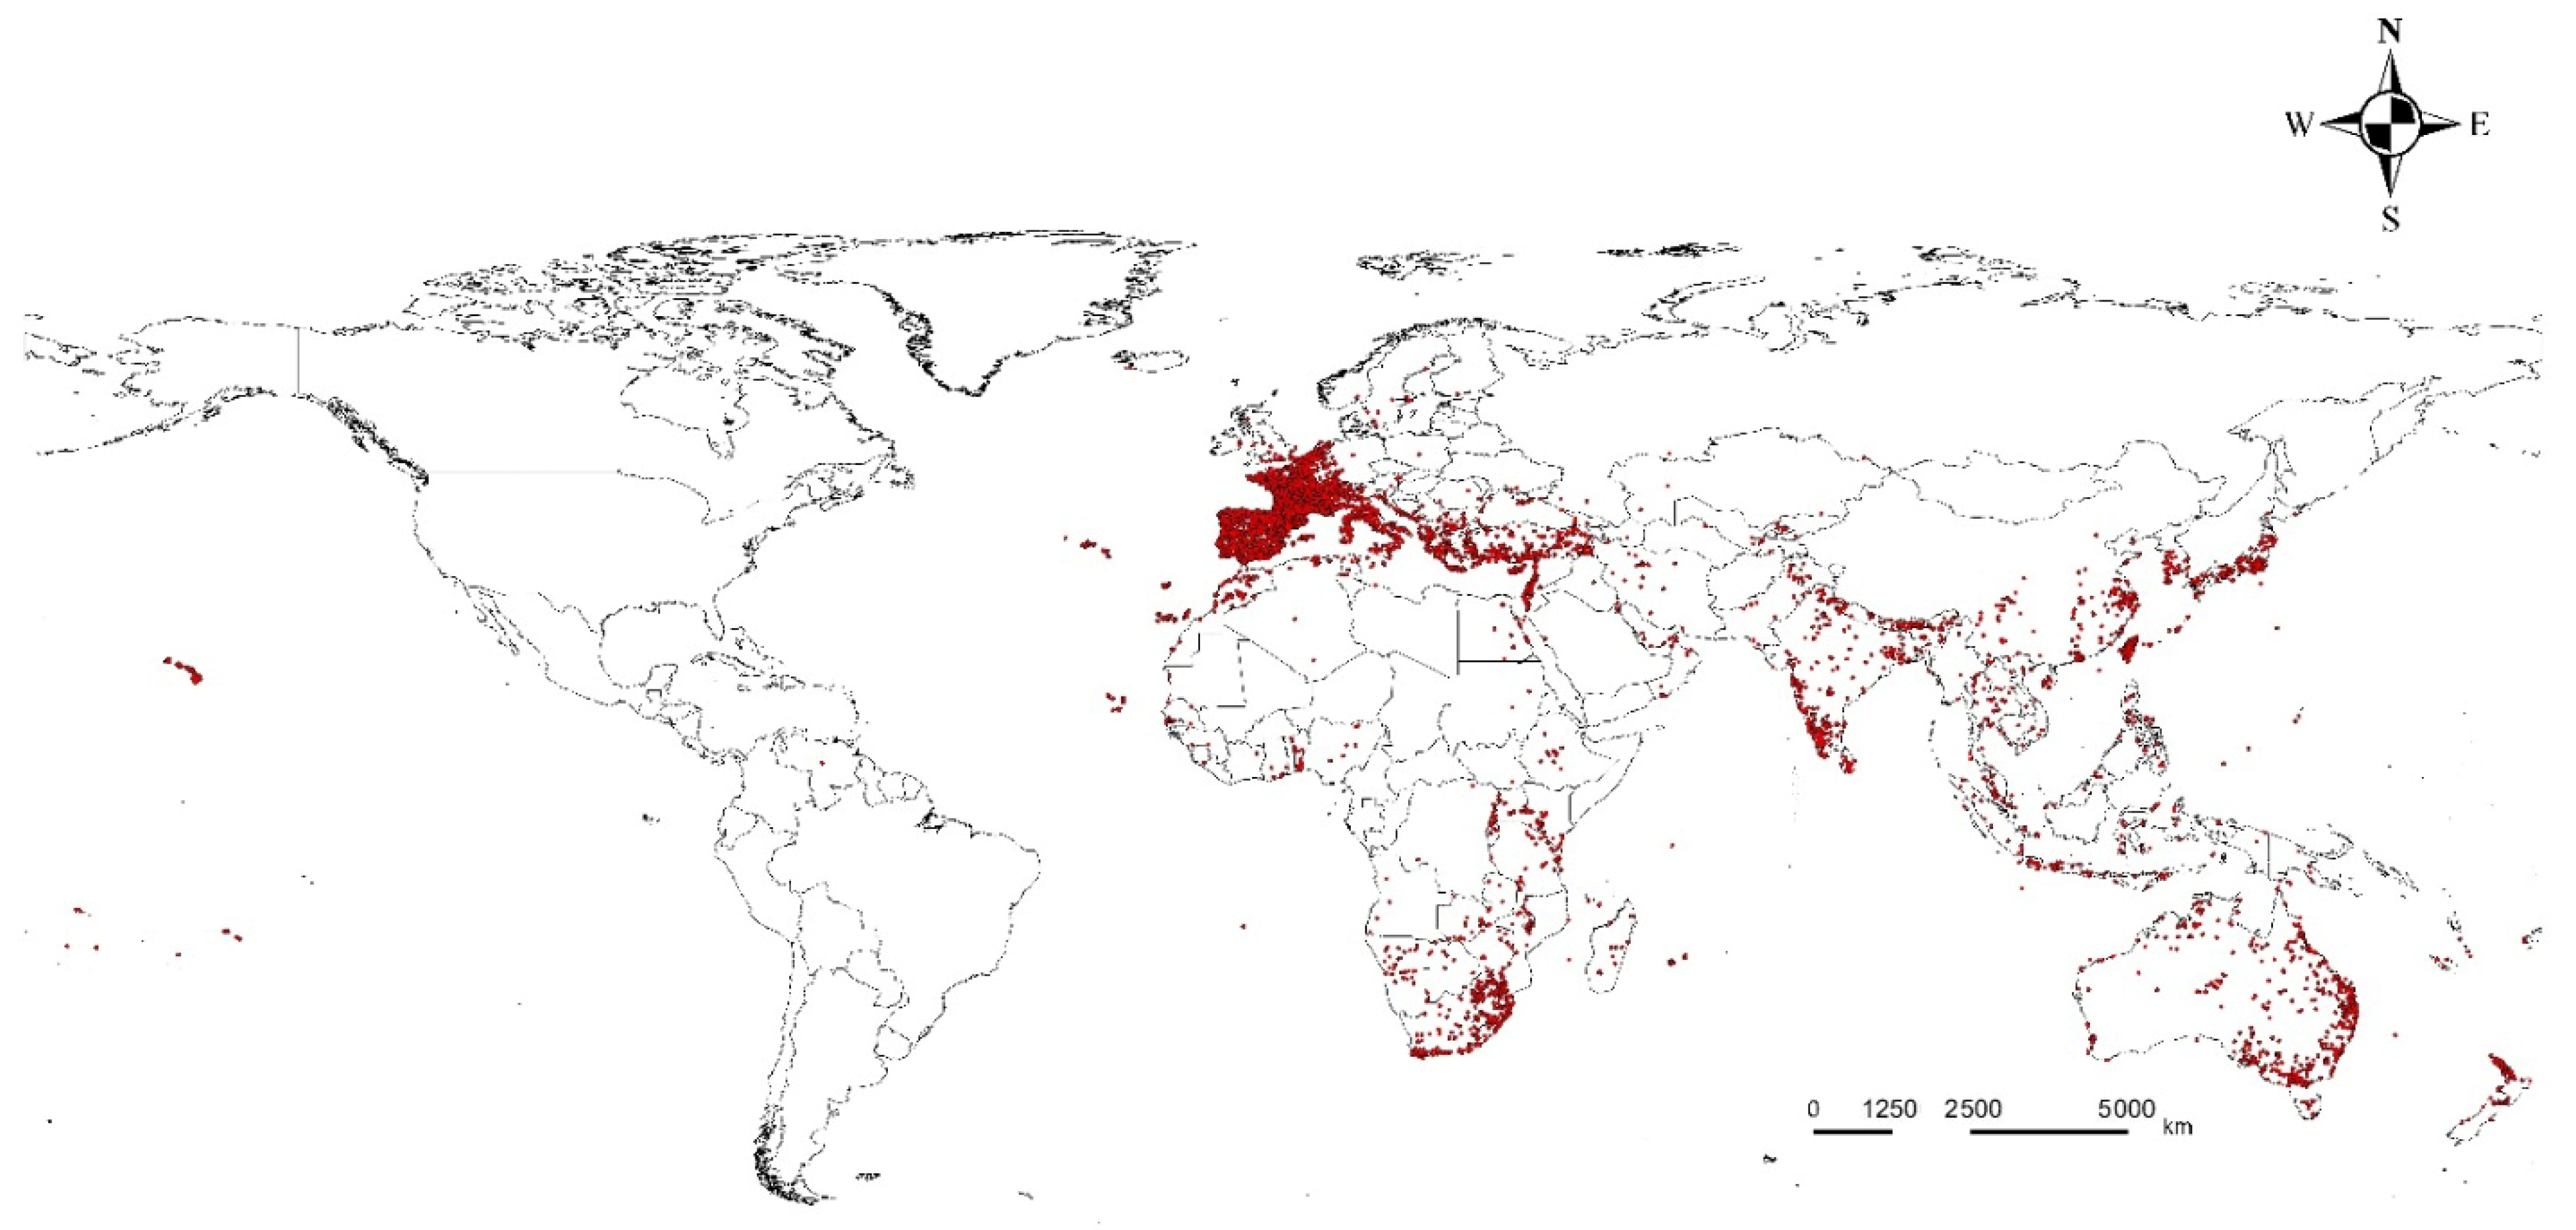
Figure 1. Occurrence records for L. boeticus.
Insects 16 00826 g001
Figure 2. Potential distribution of L. boeticus under current/future climate in MaxEnt model. (A) Current climate, (B) future climate (2081–2100).
Insects 16 00826 g002
Figure 3. Potential distribution of L. boeticus under current/future climate in random forest model. (A) Current climate, (B) future climate (2081–2100).
Insects 16 00826 g003
Figure 4. Average based ensemble model of potential distribution of L. boeticus under current/future climate. (A) Current climate, (B) future climate (2081–2100).
Insects 16 00826 g004
Figure 5. Global pulse-crop production area and potential risk area assessment. (A) Global pulse crop area harvested (ha) in 2023, (B) current suitability areas of L. boeticus with countries have pulse crop harvested areas exceeding 100,000 hectares, and (C) future suitability areas of L. boeticus with countries have pulse crop harvested areas exceeding 100,000 hectares.
Insects 16 00826 g005
Table 1. Measures of the models for L. boeticus.
MeasureMaxEntRandom Forest
Test AUC0.66940.9015
Accuracy0.65450.9012
TSS0.51550.8027
Table 2. List of selected environmental variables for L. boeticus.
Variable Code aDescriptionPercent Contribution
(MaxEnt)
Mean Decrease Gini (Random Forest)
Bio2Mean diurnal range a,b0.3264.94
Bio6Minimum temperature of the coldest month59853.61
Bio8Mean temperature of the wettest quarter2210.48
Bio13Precipitation of wettest month16251.73
Bio14Precipitation of driest month0.2149.53
Bio15Precipitation seasonality (Coefficient of variation)2.8132.13
Bio18Precipitation of warmest quarter15.1182.77
Bio19Precipitation of the coldest quarter1.6375.96
ElevationAltitude data2.9129.76
a Variable codes were obtained from WorldClim (www.worldclim.org). b Mean diurnal range = mean of monthly (maximum temperature–minimum temperature).
Disclaimer/Publisher’s Note: The statements, opinions and data contained in all publications are solely those of the individual author(s) and contributor(s) and not of MDPI and/or the editor(s). MDPI and/or the editor(s) disclaim responsibility for any injury to people or property resulting from any ideas, methods, instructions or products referred to in the content.