Simple Summary
Global climate change has significantly affected species distribution. Understanding the impact of climate change on the distribution of forest pests is essential for effective monitoring and control. Trachypteris picta (Pallas, 1773) is an important forest pest in the family Buprestidae. To explore the impact of climate change on the distribution of T. picta, we simulated suitable habitat under the current conditions and three climate change scenarios (SSP1-2.6, SSP2-4.5, and SSP5-8.5) for the 2050s and 2090s using the maximum entropy (MaxEnt) model. The predicted results suggest that the total area of suitable habitats is expected to increase and shift towards higher latitudes under future climate conditions. The expansion of suitable areas was primarily located in southern Europe, with smaller, fragmented expansion areas concentrated in Northwest China under future climate scenarios.
Abstract
Trachypteris picta (Pallas, 1773) is a significant pest that can cause serious damage to poplars and willows. To assess the impact of climate change on the suitable habitats of T. picta, this study conducted a comparative analysis of its global suitable habitats using climatic factors, global land use type, and global vegetation from different periods, in combination with the maximum entropy (MaxEnt) model. The results indicate that the annual mean temperature (Bio01), mean temperature of the coldest quarter (Bio11), precipitation of the coldest quarter (Bio19), and isothermality (Bio03) are the four most important climate variables determining the distribution of T. picta. Under the current climate conditions, the highly suitable areas are primarily located in southern Europe, covering an area of 2.22 × 10⁶ km2. Under future climate scenarios, the suitable habitat for T. picta is expected to expand and shift towards higher latitudes. In the 2050s, the SSP5-8.5 scenario has the largest suitable area compared to other scenarios, while the SSP2-4.5 scenario has the largest suitable area in the 2090s. In addition, the centroids of the total suitable areas are expected to shift toward higher latitudes under future climate conditions. The results of this study provide valuable data for the monitoring, control, and management of this pest.
1. Introduction
The family Buprestidae, commonly known as jewel beetles, is a significant group within the order Coleoptera, comprising over 15,000 known species worldwide [1]. Some buprestid beetles are renowned for their striking appearance and are collected as ornamental items. However, certain borer species, such as Chrysobothris succedanea Saunders, 1873 [2], Agrilus zanthoxylumi Li, 1989 [3], Agrilus mali Matsumura, 1924 [4], and Agrilus planipennis Fairmaire, 1888 [5,6], are notorious for causing substantial economic damage to agriculture and forestry during outbreaks.
The genus Trachypteris is a member of the family Buprestidae, with its only known species, Trachypteris picta (Pallas, 1773), mainly distributed across the Nearctic, Oriental, and Palaearctic realms [1]. The species exhibits considerable color variation, with some individuals displaying colorless elytra, while others possess five pairs of spots on the elytra. This variability contributes to the existence of multiple synonyms for this species [7]. The primary host plants of T. picta are species within the genera Populus and Salix [8,9,10]. The larvae of this species are borers that overwinter in the larval stage, and the adults primarily emerge in June and July in China [11]. Over the past three decades, T. picta have caused significant economic damage to forestry in the northwest region of China due to their outbreaks, and they are regarded as important forestry pests [8,12,13]. The forestry department attaches great importance to monitoring the risk of pest spread; however, the impact of climate change on the distribution of this pest remains unclear.
Climate change events have been a consistent feature throughout the evolutionary history of the Earth, with most extant species surviving through specific climatic cycles [14,15]. However, studies indicate that the rate of future temperature changes will exceed that of the warming observed during the Pleistocene–Holocene transition [14,16]. According to the sixth assessment report of the Intergovernmental Panel on Climate Change (IPCC), the global surface temperature in 2020 had risen by 1.09 °C compared to the pre-industrial levels (1850–1900). Climate change has significantly impacted the distribution of insects [17,18,19,20].
Currently, the impact of climate change on species’ suitable habitats is primarily studied using species distribution models (SDMs), also known as ecological niche models. Several SDMs have been proposed, including the CLIMEX [21,22,23], maximum entropy modeling (MaxEnt) [24], ecological niche factor analysis (ENFA) [25], Genetic Algorithm for Rule Set Production (GARP) [26], Enphylo [27], and bioclimate analysis and prediction system (BIOCLIM) [28]. Among these, MaxEnt is widely used for predicting species distribution of animals [20,29,30,31,32,33] and plants [34,35] due to its high predictive accuracy and stability.
Some studies have shown that changes in climate conditions significantly impact the distribution ranges of species [36,37,38]. However, due to the differences in ecological habits among various species, their adaptations to climate change vary, and there is no consensus on the effects of global warming on insect distribution. While some studies suggest that rising temperatures will gradually increase the suitable habitat area for insects, others indicate that the suitable habitat range may decrease [18,20,36,39,40].
Research on the suitable habitat of buprestid beetles in relation to climate change is limited [41,42,43]. To investigate the changes in the suitable habitats of T. picta under climate change, this study employed MaxEnt in conjunction with ArcGIS, using 21 bioclimate factors, to conduct a comparative analysis of their potential distribution. The results of this study provide valuable data for the future monitoring and management of T. picta.
2. Materials and Methods
2.1. Obtaining and Processing Occurrence Data
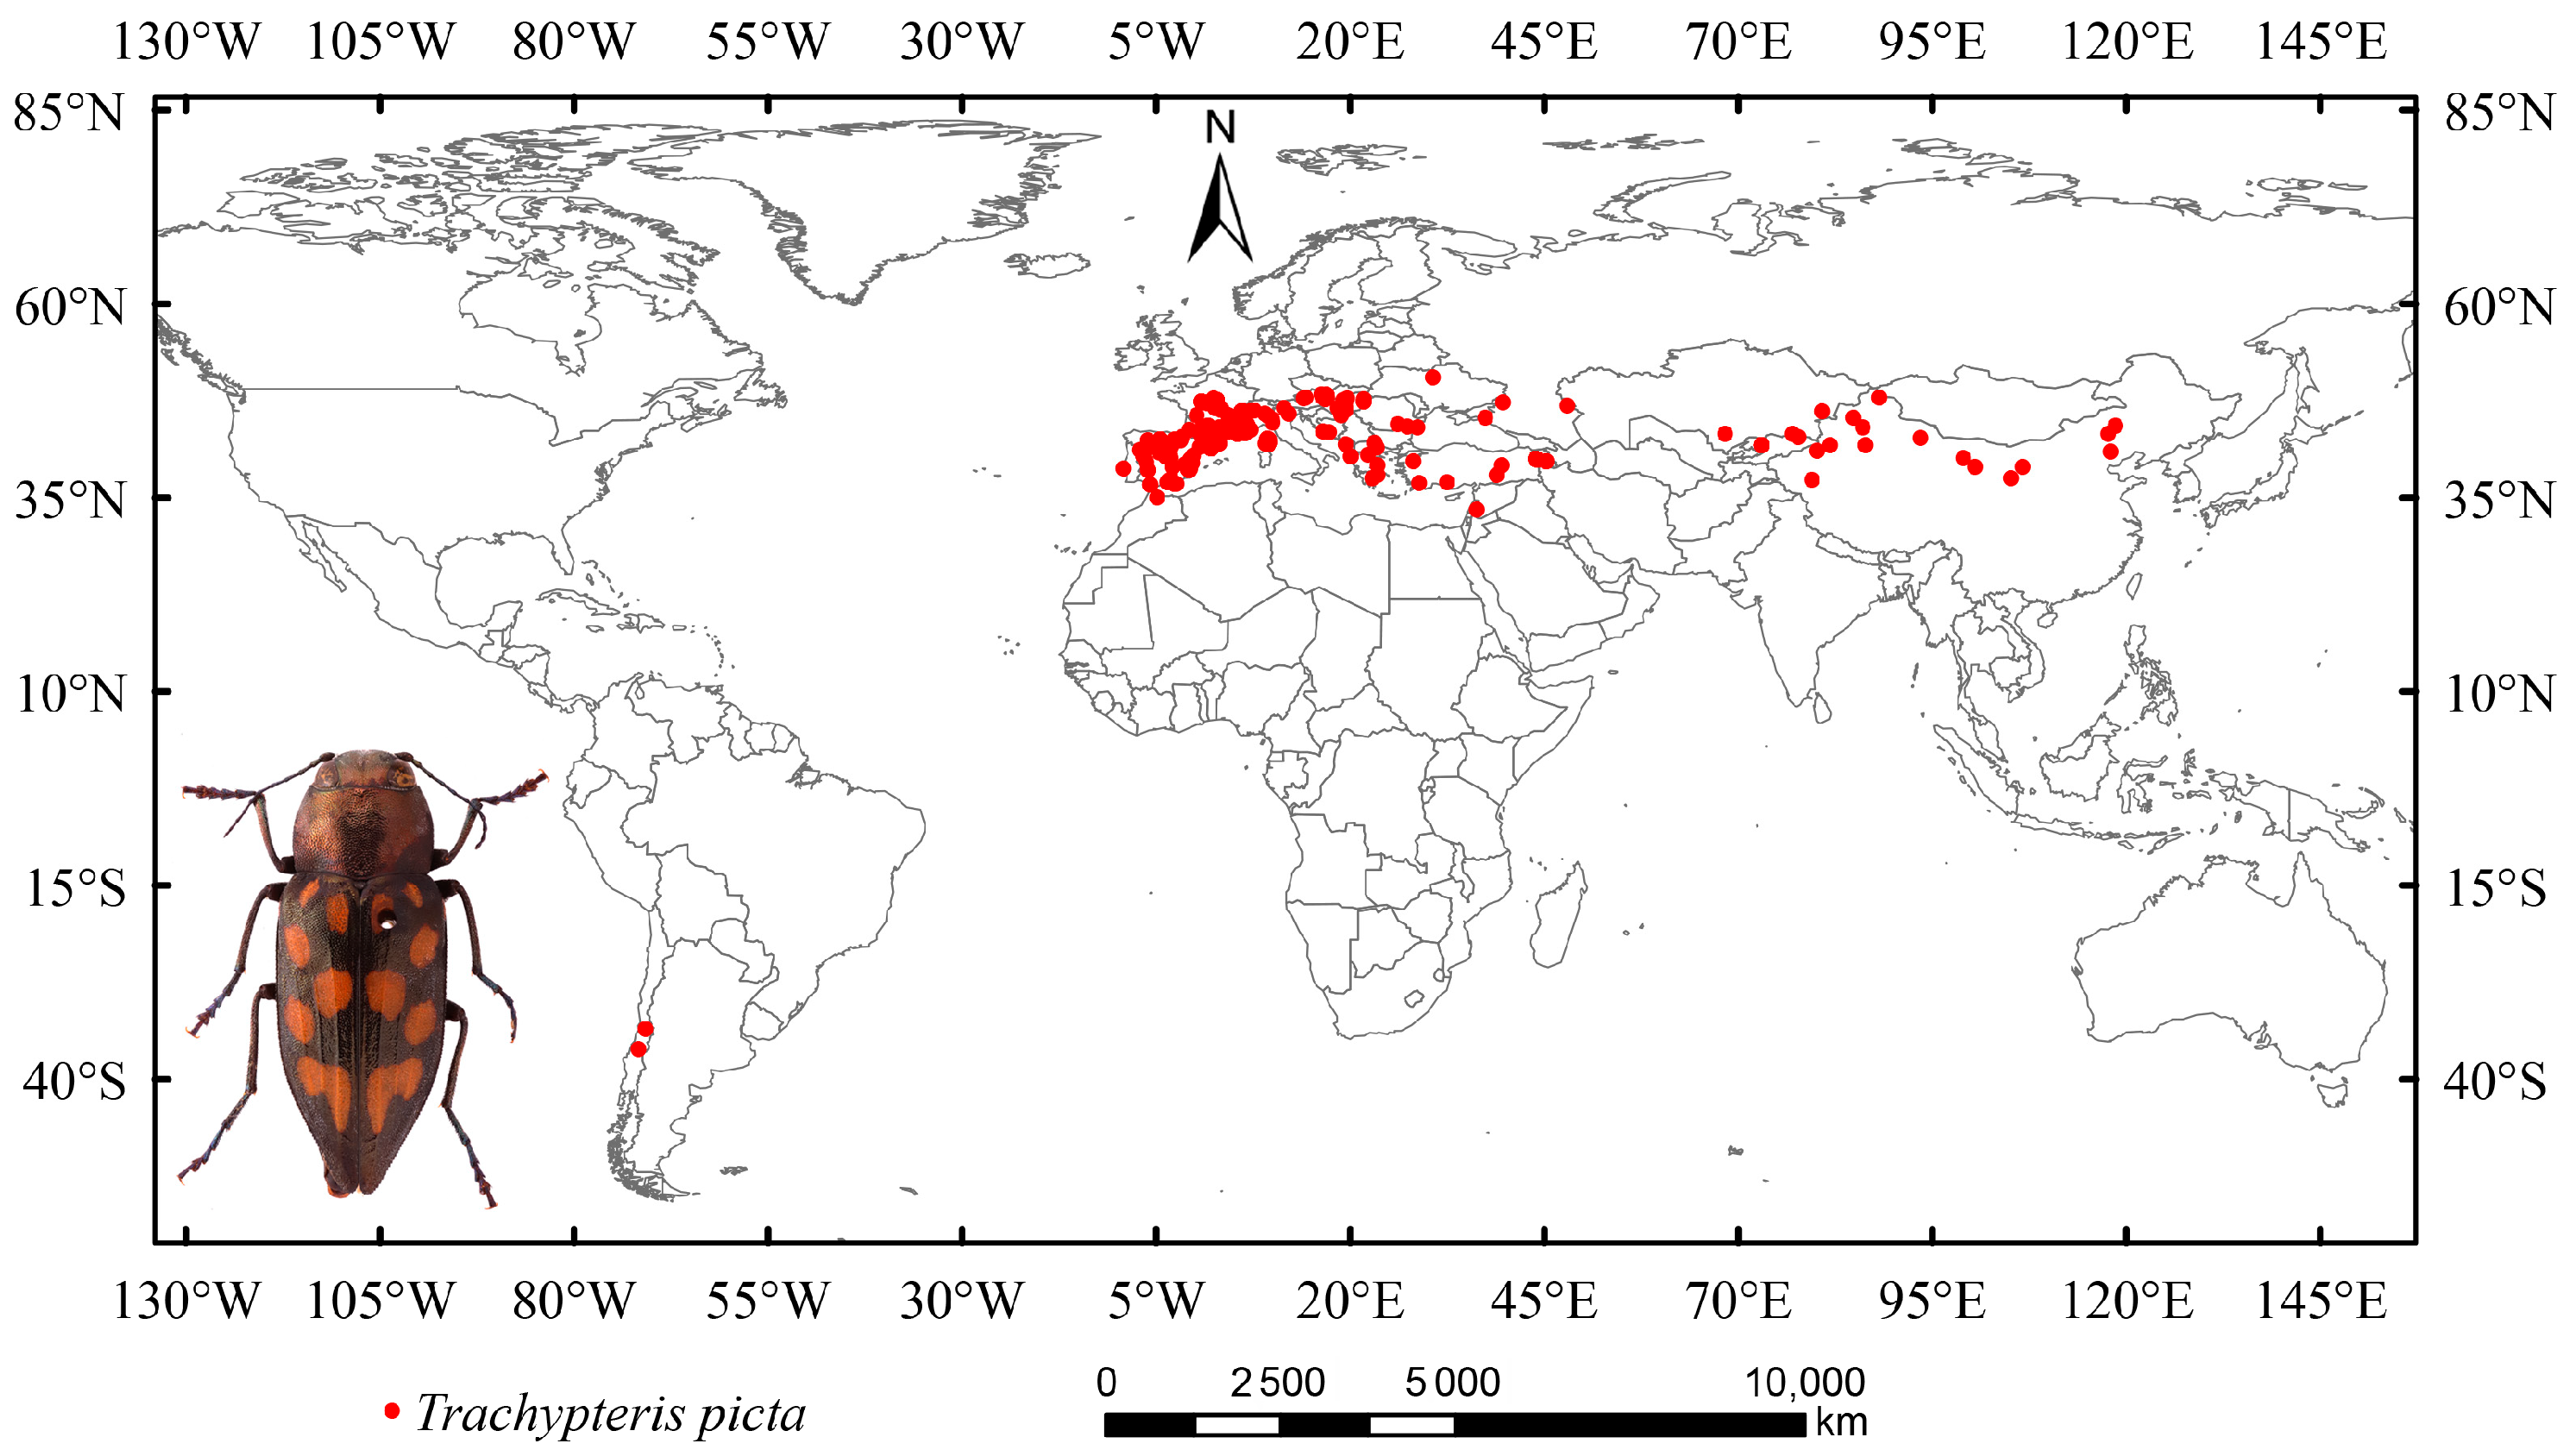
In this study, occurrence data for T. picta were collected from the National Animal Collection Resource Center (http://museum.ioz.ac.cn/, accessed on 18 June 2025), the China National Knowledge Infrastructure (CNKI, https://www.cnki.net/, accessed on 18 June 2025), and the Global Biodiversity Information Facility (GBIF, https://www.gbif.org/, accessed on 18 June 2025). Data that recorded only states or provinces (without latitude and longitude) were excluded, as a recent study indicated that vague data can impact the accuracy of species distribution models [44]. A total of 462 distribution points were initially obtained (Figure 1). Duplicate occurrence data were removed using Excel. Secondary sampling was performed on a 2.5-arc grid to reduce sampling bias and mitigate overfitting, while also addressing spatial autocorrelation effects [45]. After cleaning and filtering, 269 distribution points for T. picta remained and were used for modeling tests.
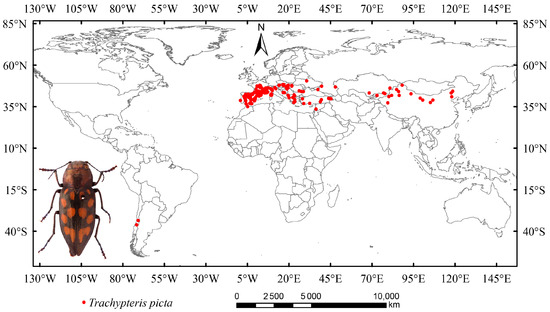
Figure 1.
The global distribution and habitus of Trachypteris picta.
2.2. Environmental Variables
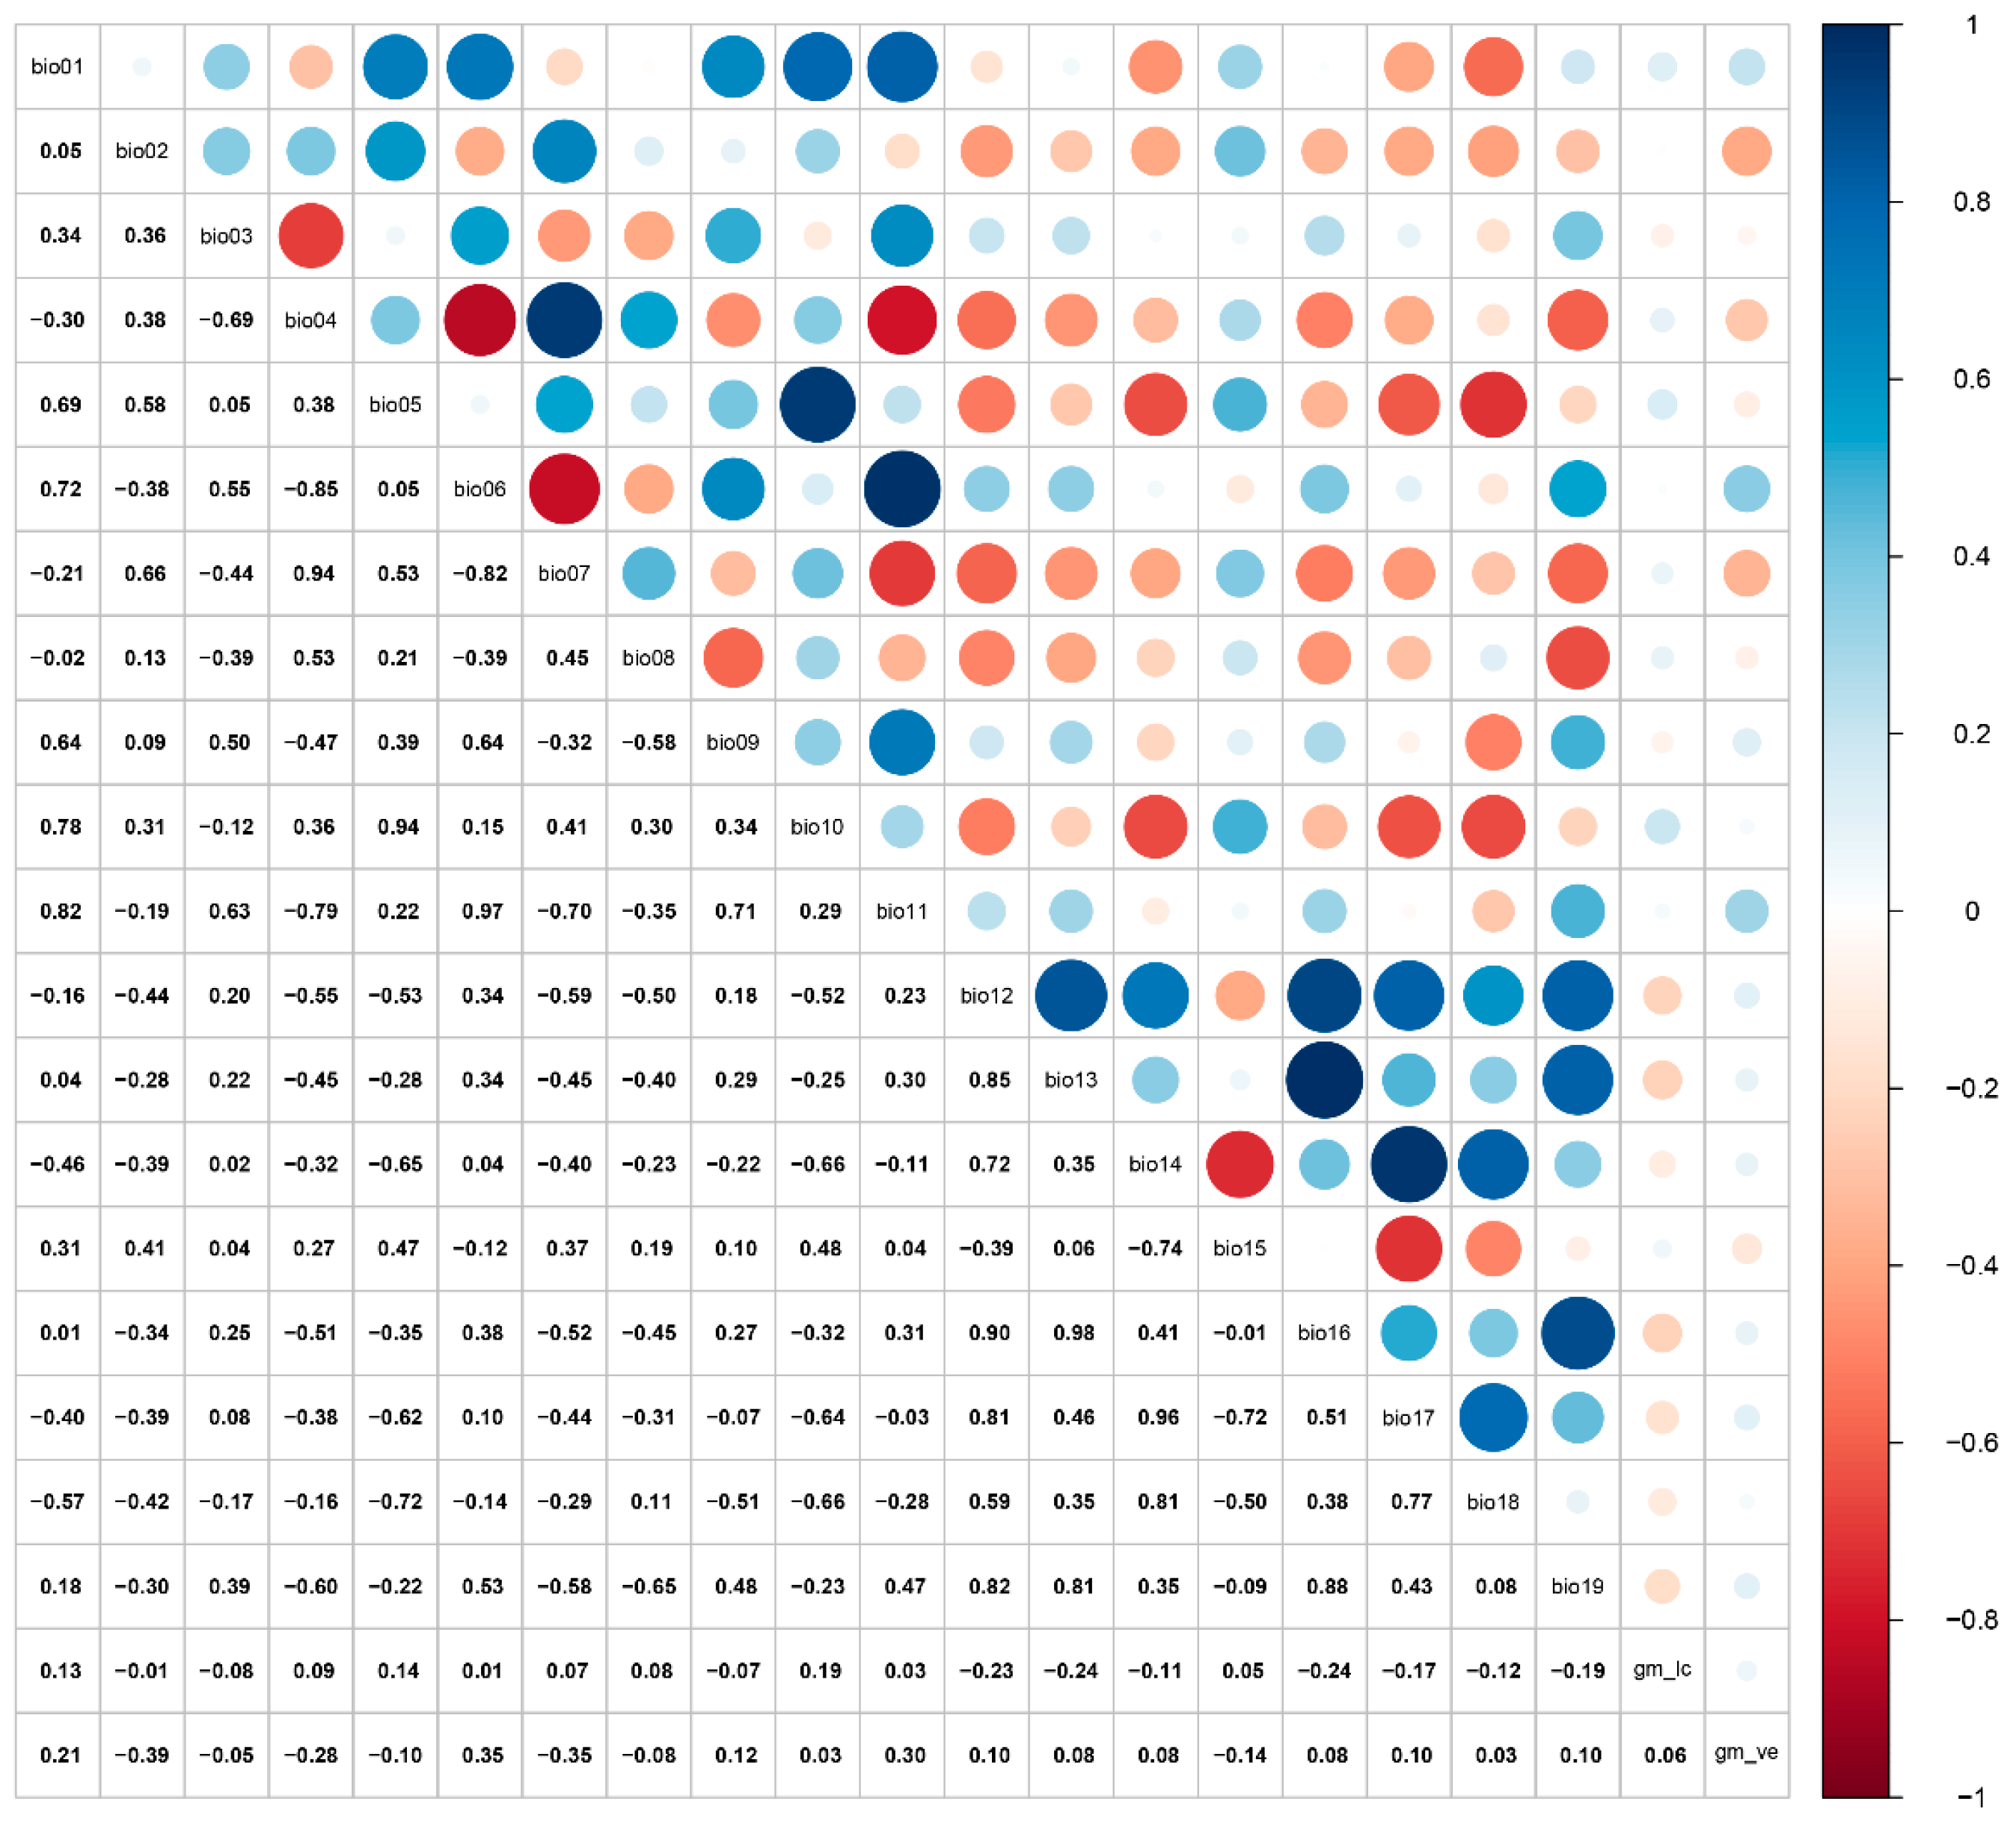
At a large spatial scale, bioclimatic and soil variables are critical factors influencing species distribution models [46]. For this study, climatic variables at a 2.5 arc-minute spatial resolution were obtained from WorldClim (http://www.worldclim.org/, accessed on 18 June 2025). The global land cover type v3 and vegetation (percent tree cover) v2 were downloaded from GitHub (https://globalmaps.github.io/, accessed on 18 June 2025) [47]. For the global land cover type, the data type, data source, and resolution were bytes (16 bits), MODIS data 2013 (Terra and Aqua, National Aeronautics and Space Administration, USA), or 15 arcseconds, respectively. For global vegetation, the data type, data source, and resolution are bytes (8 bits), MODIS data 2008 (Terra and Aqua), and 15 arcseconds, respectively. The environmental variables encompass both current (1970–2000) and future climate projections (2041–2060, 2081–2100). The current climate data span the period 1970–2000, while future projections were derived from the BCC-CSM2-MR model under the Coupled Model Intercomparison Project Phase 6 (CMIP6) [48,49]. Three shared socioeconomic pathways (SSPs) emission scenarios were selected: SSP1-2.6 (low level of greenhouse gas emissions), SSP2-4.5 (intermediate level of greenhouse gas emissions), and SSP5-8.5 (high level of greenhouse gas emissions). Bioclimatic variables were subjected to Pearson correlation analysis to avoid model errors induced by high autocorrelation (Figure 2). The retention criterion was set as |r| > 0.85 for each correlated group, with only the maximally correlated variable being preserved. A final principal component analysis (PCA) transformation was then conducted on the filtered variables. Ultimately, 10 environmental variables were selected to predict the potential suitable habitat (Table 1).
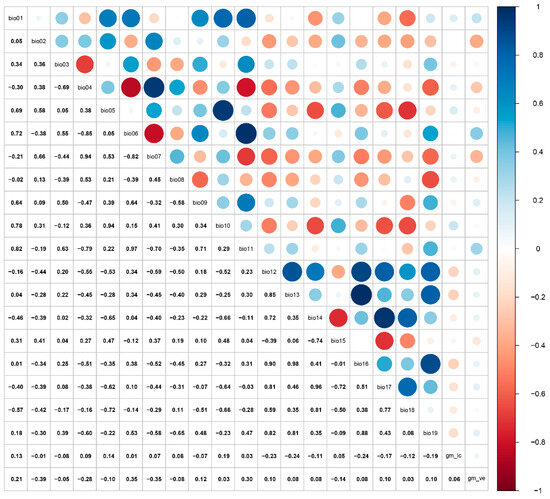
Figure 2.
Pearson correlation analysis of environmental variables.

Table 1.
The selected 10 environmental variables used in the MaxEnt model.
2.3. Modeling Methods
The software MaxEnt v3.4.1 and ArcGIS v10.2 were used to construct the global suitable habitat of Trachypteris picta in the present study. After the variables were determined, a model calibration was conducted using kuenm in R v4.3.2, setting the regularization multiplier from 0.5 to 4, with an interval of 0.5 each time. In this study, the MaxEnt model was run for 500 iterations with 10,000 background points [50]. In the MaxEnt model, 75% of the species distribution points were used for model construction, with 25% reserved for testing. Model performance was evaluated through 10 replicate runs, with the mean area under the receiver operating characteristic (ROC) curve derived from ensemble predictions [51]. The ROC curve was employed to assess the predictive capability of the MaxEnt model. The area under the curve (AUC) is independent of the threshold value and is widely used to evaluate the accuracy of predictive models [52]. The AUC ranges from 0 to 1, where an AUC < 0.5 signifies model failure, 0.5 < AUC < 0.7 indicates low model accuracy, 0.7 < AUC < 0.8 suggests moderate accuracy, 0.8 < AUC < 0.9 indicates high accuracy, and AUC ≥ 0.9 represents excellent accuracy [24,53]. The model performance was also assessed by the omission rate [54], and model complexity was evaluated by AICc [55]. In ArcGIS v10.2, the Jenks natural breaks classification method was applied to classify and visualize the suitable habitats for T. picta. The suitable areas were categorized into four groups: unsuitable area (0–0.133), low suitability area (0.133–0.199), moderate suitability area (0.199–0.438), and high suitability area (0.438–1). The suitable areas were calculated using the SDM Toolbox v2.4 module integrated into ArcGIS.
3. Results
3.1. Accuracy Evaluation and Dominant Environmental Variables
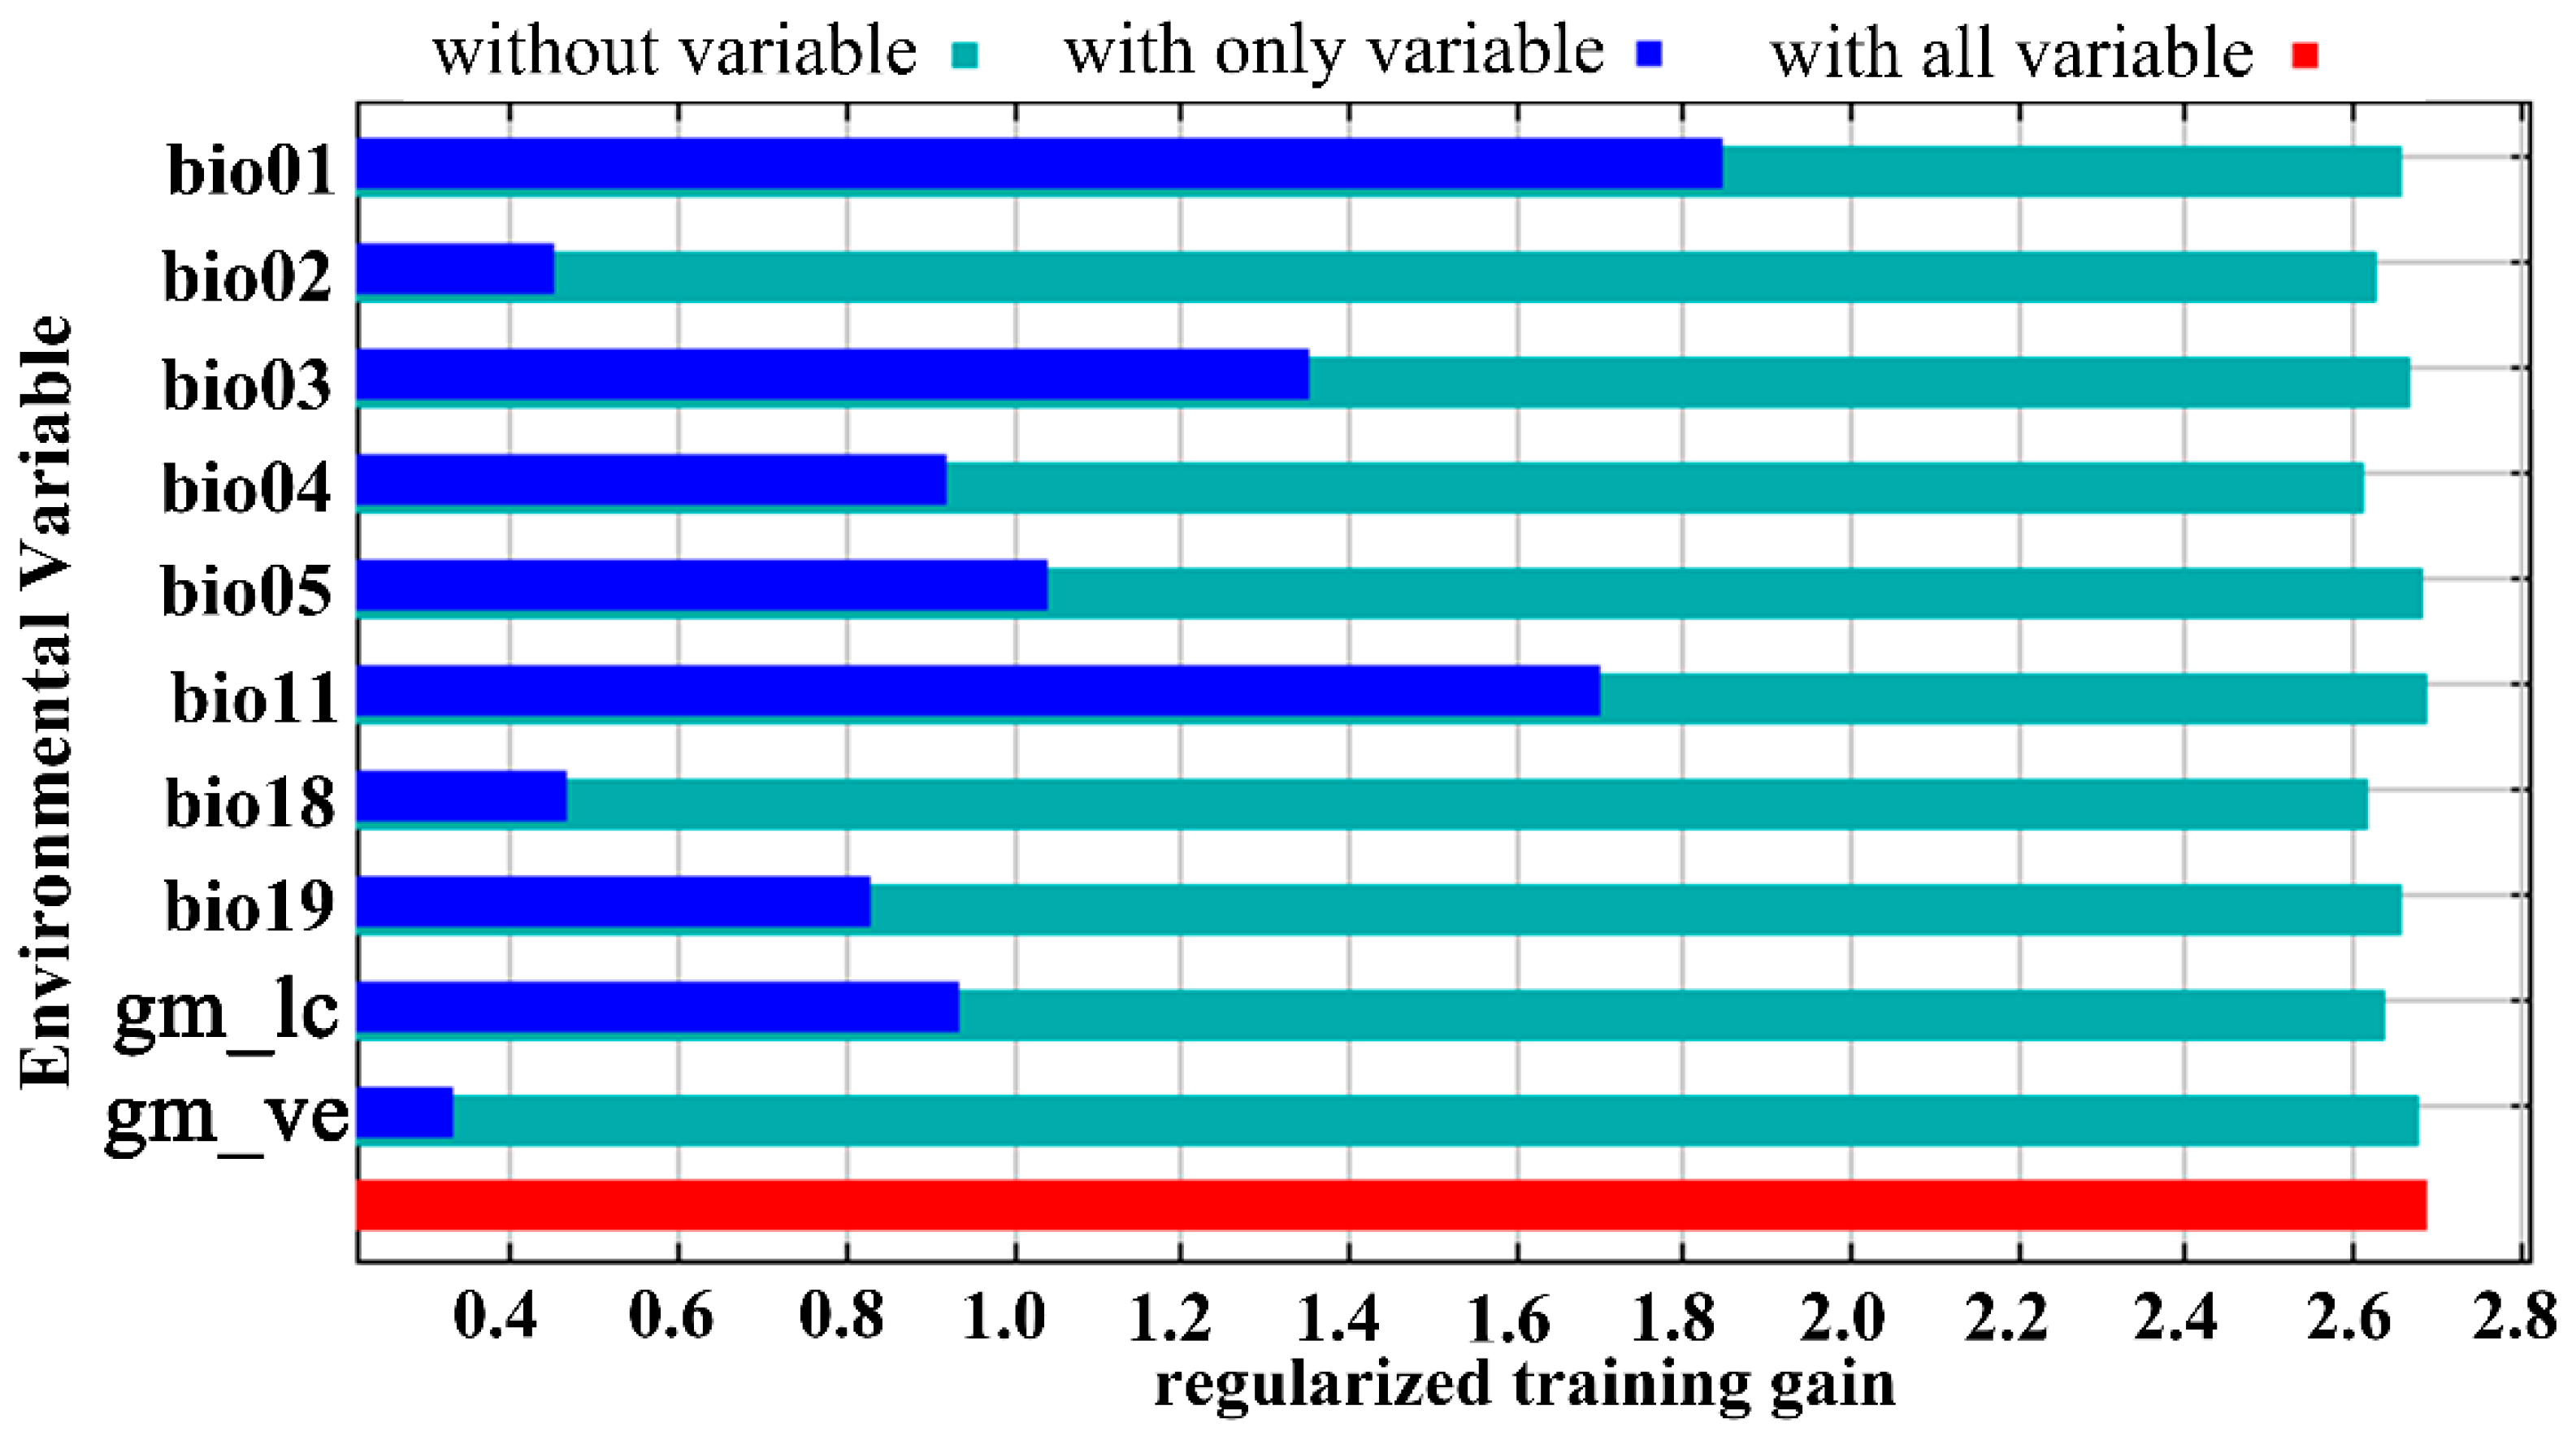
In the present study, 269 distribution points of Trachypteris picta and 10 environmental variables were used to predict the global suitable habitats under the current and future climate conditions. The AUC value for the training data was 0.980 (Figure S1), which is close to 1.0, indicating excellent model performance. The omission rate at 5% for the MaxEnt model is 0.07, and the lowest value of AICc is approximately 3314.1. The jackknife test showed that the annual mean temperature (Bio01, 26.2%), isothermality (Bio03, 10.3%), mean temperature of the coldest quarter (Bio11, 18.6%), and precipitation of the coldest quarter (Bio19, 14.0%) contributed more significantly than other environmental variables (Table 1; Figure 3). Among the selected 10 environmental variables, the maximum temperature of the warmest month (Bio05, 1.4%) had the smallest contribution. Regarding the permutation importance of bioclimatic variables from the jackknife method, the top three most important variables were annual mean temperature (Bio01, 55.5%), Temperature seasonality (Bio04, 11.6%), and maximum temperature of warmest month (Bio05, 11.5%) (Table 1). These results indicate that the primary environmental variables influencing the geographic distribution of T. picta are temperature factors (annual mean temperature, mean temperature of the coldest quarter, isothermality, maximum temperature of the warmest month, and mean temperature of the driest quarter) and precipitation factors (precipitation of the coldest quarter, precipitation of the driest quarter).

Figure 3.
The jackknife test of variables’ importance for Trachypteris picta using the MaxEnt model.
The response curve illustrates the relationship between the value of bioclimatic variables and the probability of presence of Trachypteris picta (Figure S2). For Bio01, the annual mean temperature, at approximately 13.82 °C, resulted in the highest potential distribution probability of 0.66. For Bio03, the isothermality at around 36.41 produced the highest distribution probability of 0.69. For Bio11, the mean temperature of the coldest quarter, ca. 5.87 °C, yielded the highest potential distribution probability of 0.68. For Bio19, the precipitation of the coldest quarter at around 182.67 mm resulted in the highest distribution probability of 0.72.
3.2. Suitable Areas Under the Current Climate Conditions
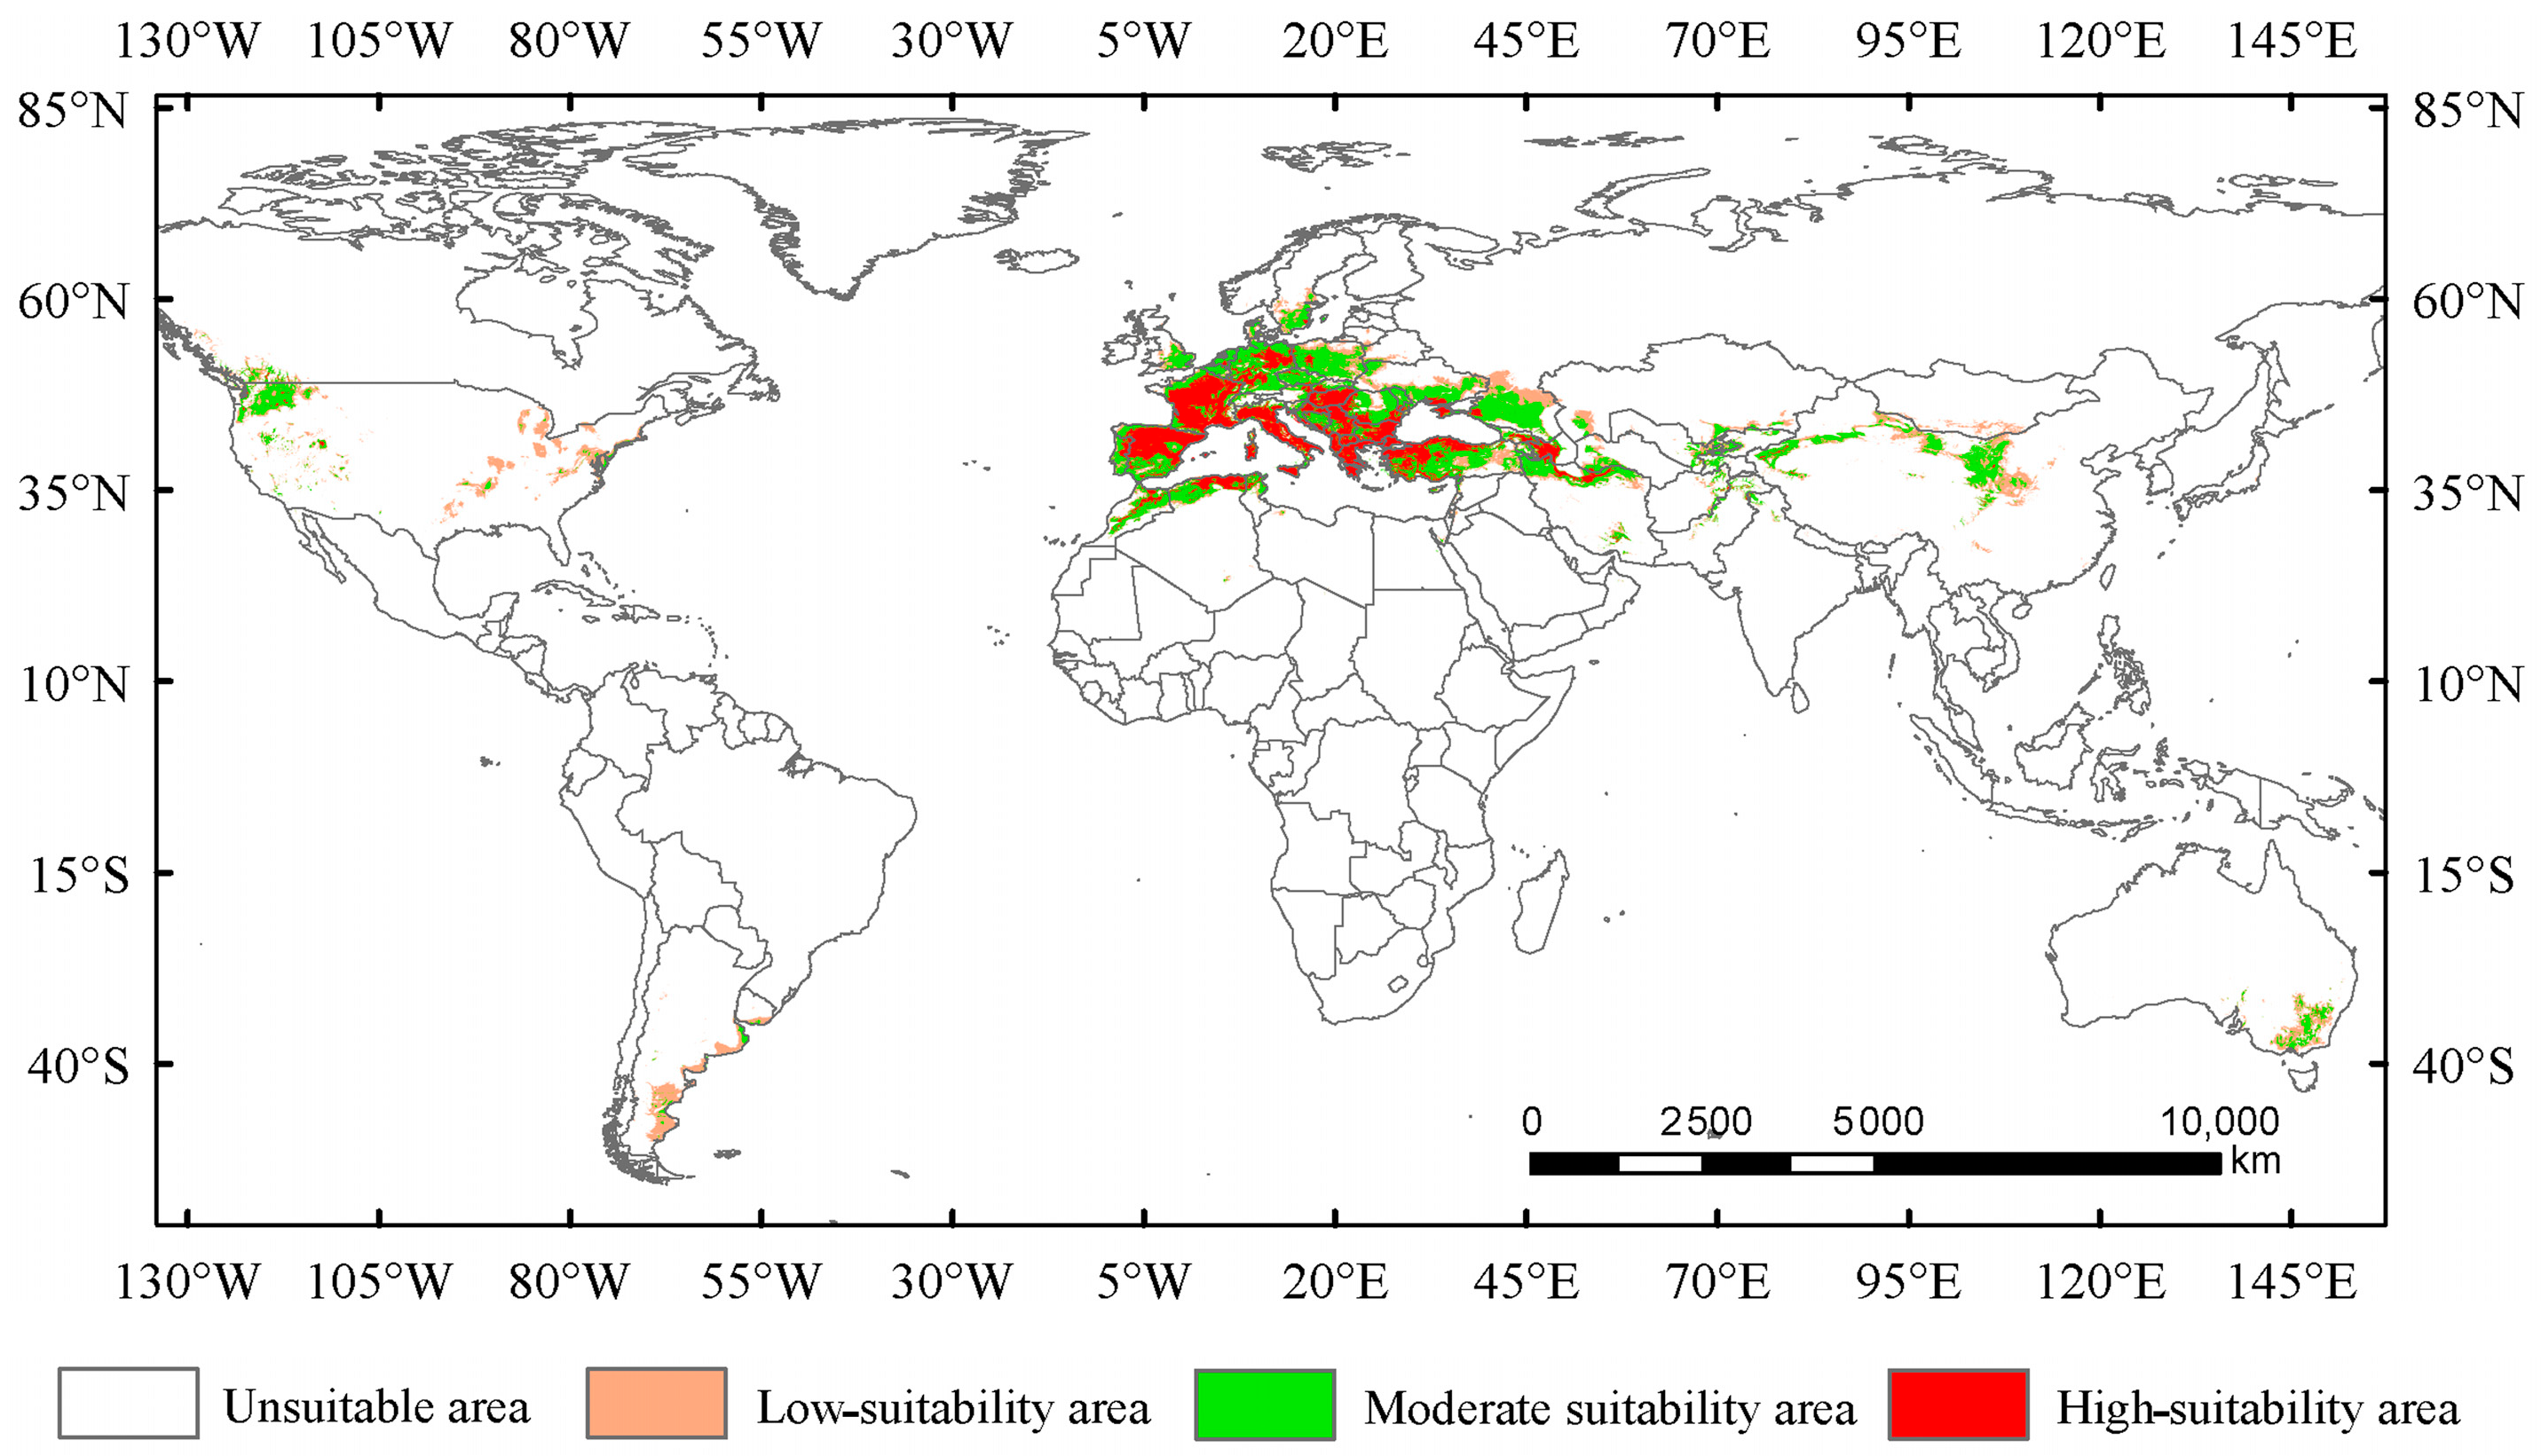
Under the current climate conditions, the total suitable area for Trachypteris picta is approximately 7.95 × 10⁶ km2 (Figure 4). The predicted suitable habitat area is slightly larger than its actual distribution range. The highly suitable habitat area covers 2.26 × 10⁶ km2, accounting for 28.4% of the total suitable area. This area is mainly located in southern Europe (including Portugal, Spain, France, Germany, Italy, Hungary, Greece, Albania, Montenegro, Serbia, and Bulgaria) and northwestern Africa (northern Morocco and Algeria), with fragmented patches of smaller highly suitable areas scattered across parts of Asia (Iran, Azerbaijan, Afghanistan, and Pakistan, also including Xinjiang and Shaanxi provinces of China), southeastern Australia, and the northwestern United States (Figure 4). The moderate-suitability habitat area covers 3.93 × 10⁶ km2, accounting for 49.4% of the total suitable area, while the low-suitability habitat area spans 1.75 × 10⁶ km2, accounting for 22.1% of the total suitable area.

Figure 4.
Suitable areas for Trachypteris picta under the current climate conditions.
3.3. Change of Suitable Areas Under Future Climate Conditions
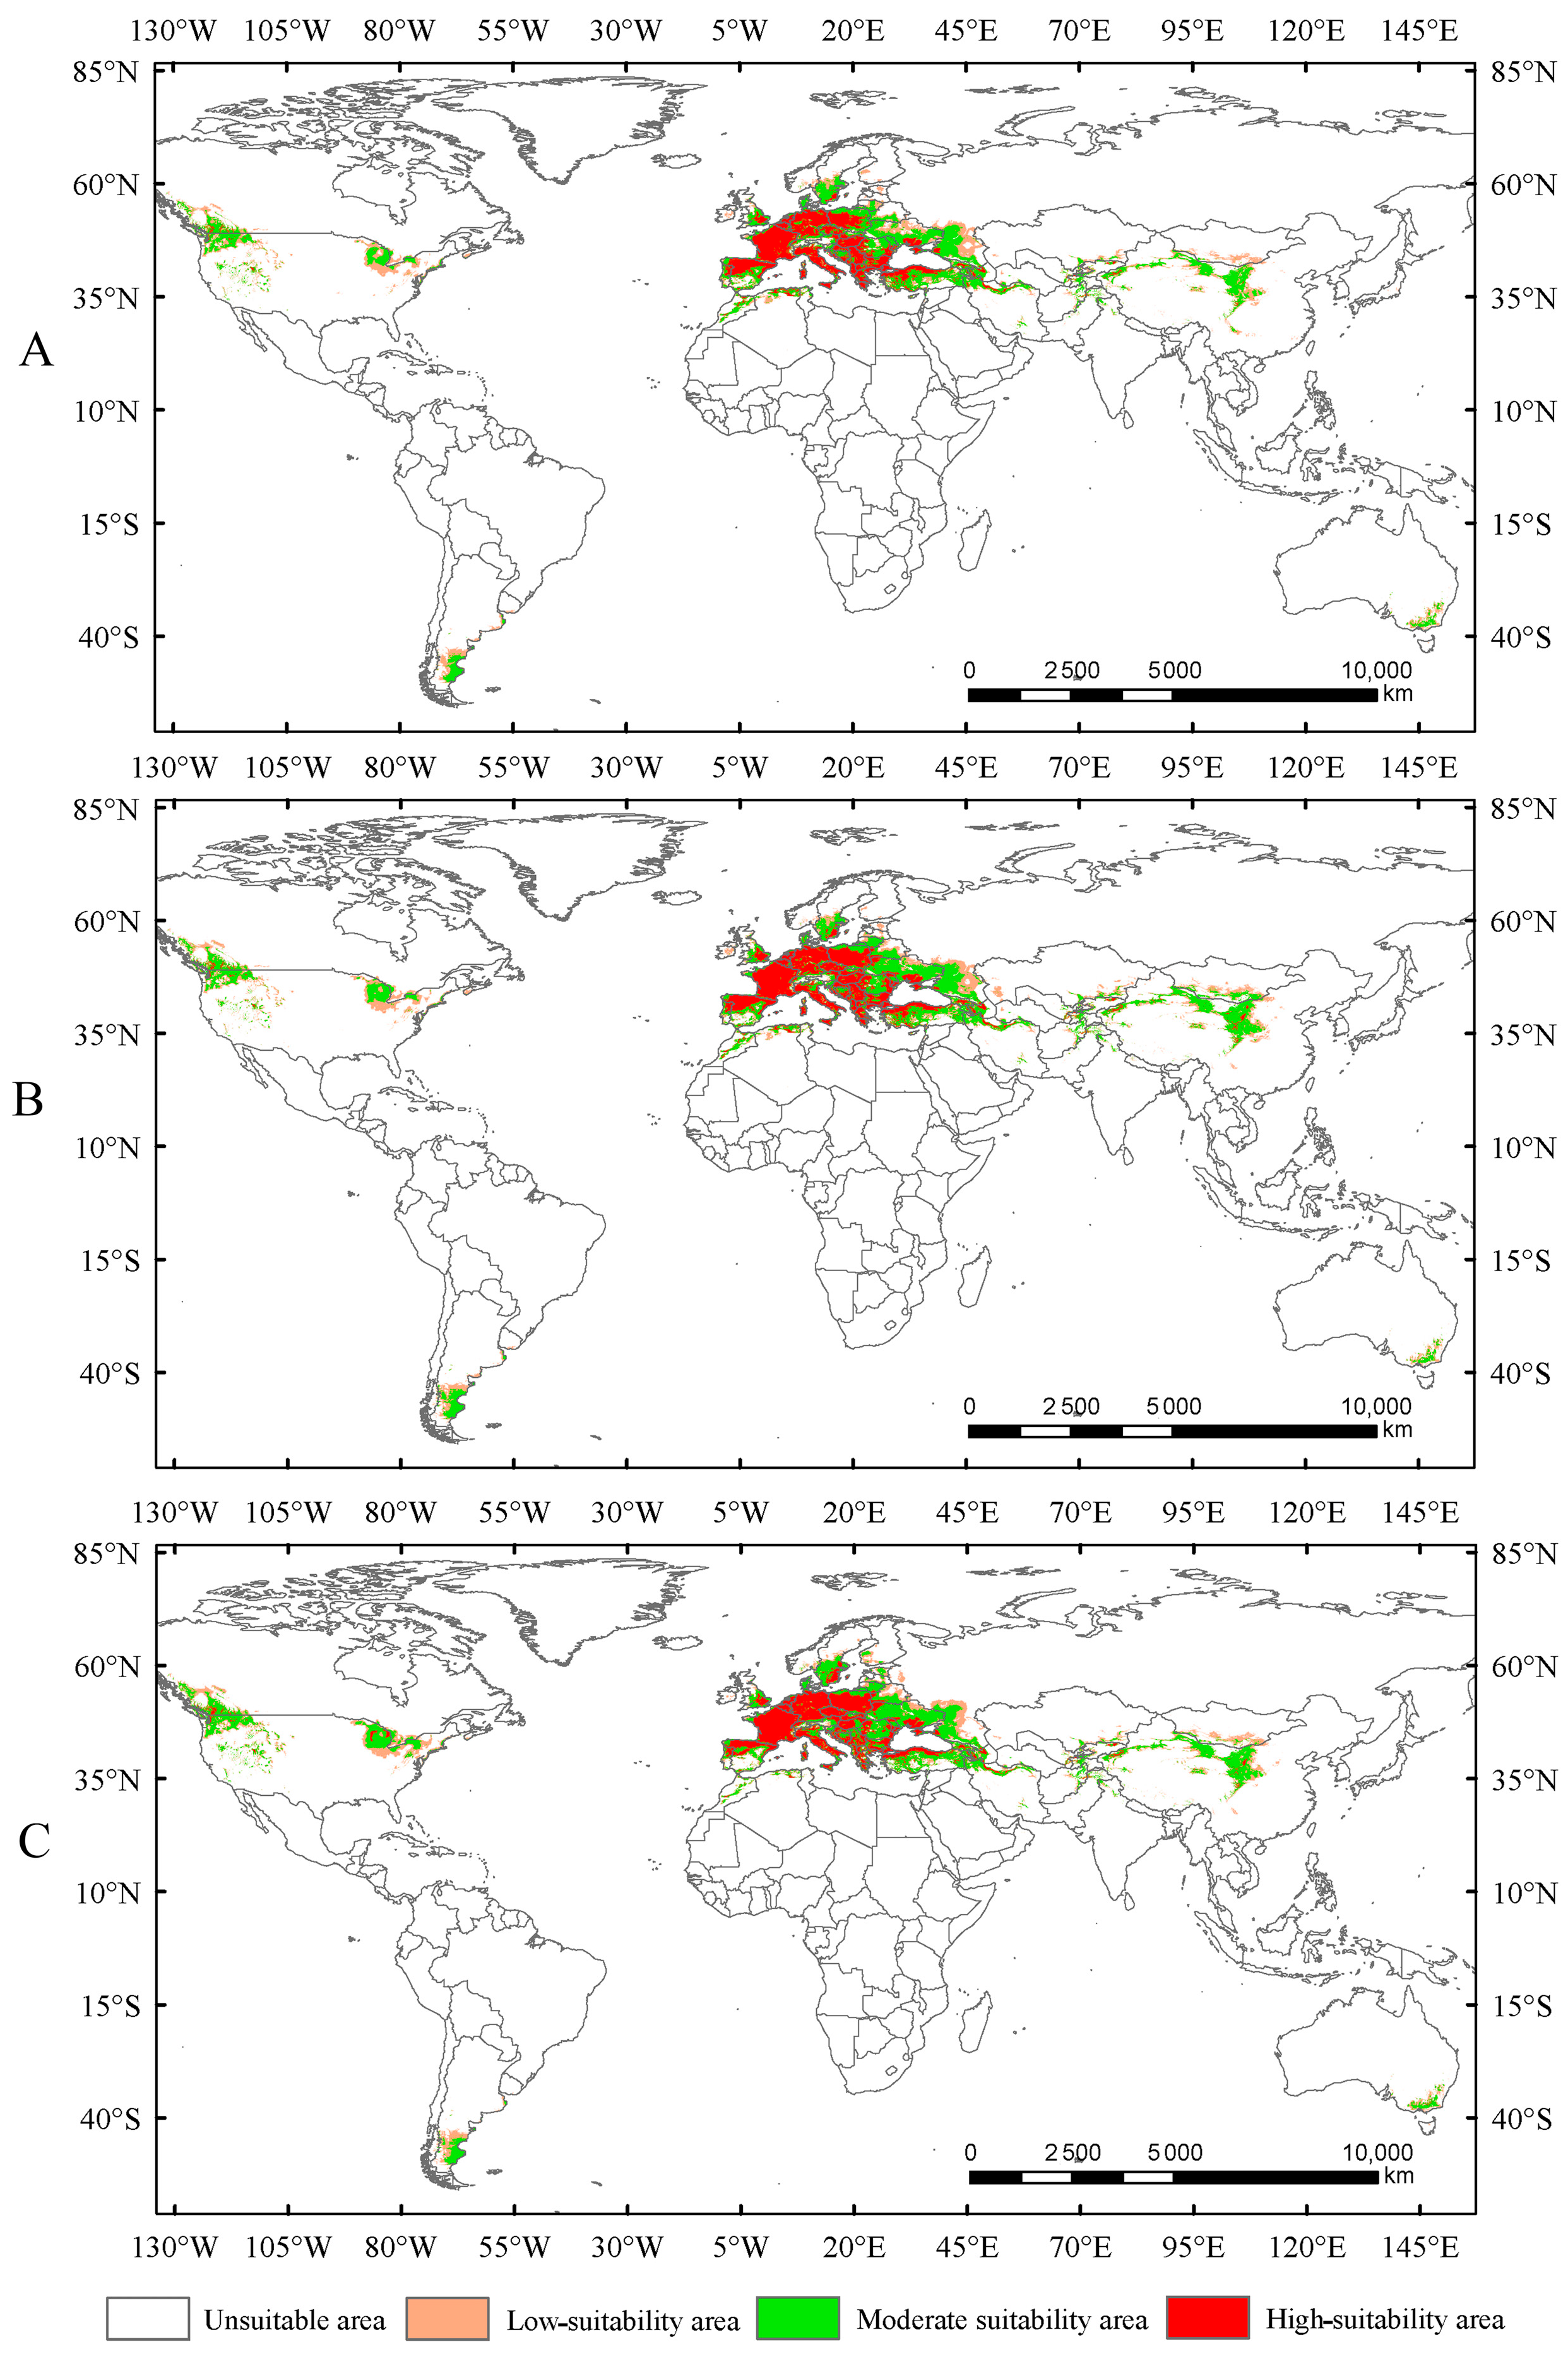
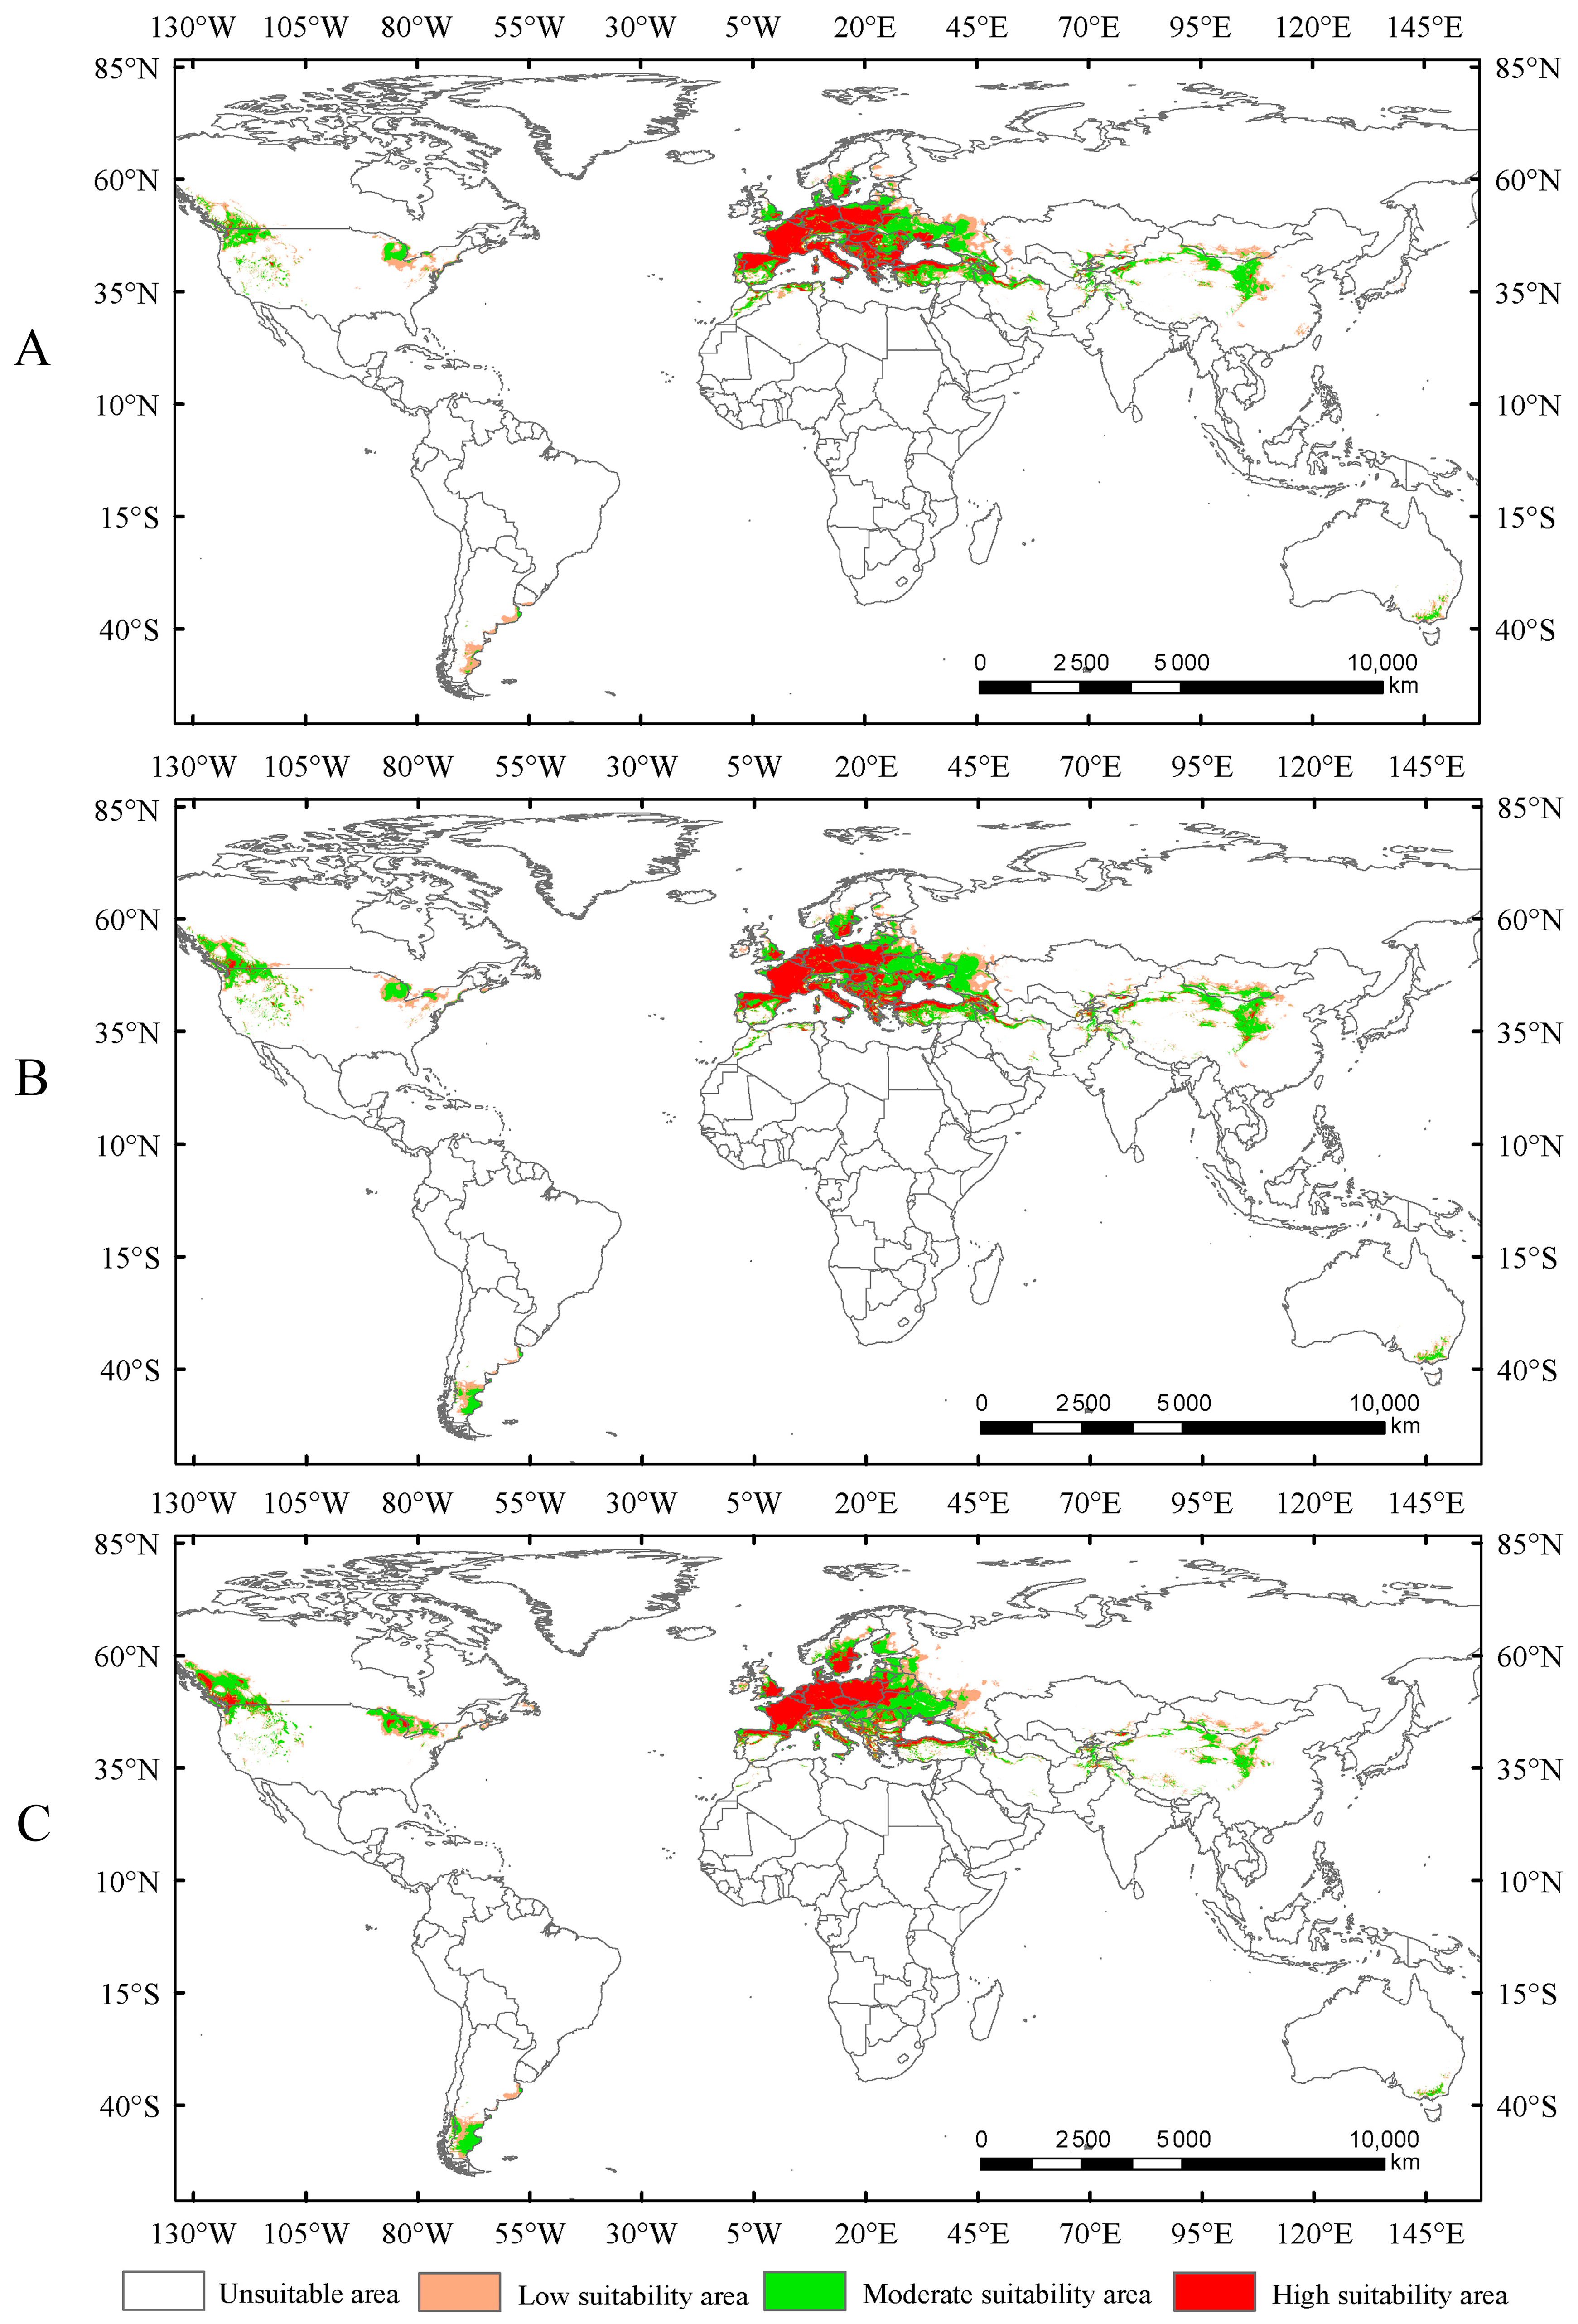
In this study, the potential distribution of Trachypteris picta was predicted for the 2050s and 2090s using the optimized MaxEnt model under three different greenhouse gas emission pathways: SSP1-2.6, SSP2-4.5, and SSP5-8.5. During 2041–2060, the suitable habitat areas are 9.01 × 10⁶ km2, 9.63 × 10⁶ km2, and 9.65 × 10⁶ km2 under the SSP1-2.6, SSP2-4.5, and SSP5-8.5 scenarios, respectively, corresponding to increases of 13.40%, 21.16%, and 21.47% compared to the current suitable area (Figure 5). By 2080–2100, the suitable habitat area for T. picta is projected to expand by 17.49%, 27.49%, and 18.53% under the three scenarios (Figure 6), respectively, compared to the current suitable habitat. Under scenario SSP2-4.5, during 2080–2100, the total suitable habitat area for T. picta demonstrates the highest increase, while the smallest expansion is observed under SSP1-2.6 during 2080–2100, with an increase of 1.39 × 10⁶ km2. For highly suitable areas in the 2050s and 2090s, the maximum increase (26.3%) is projected under SSP2-4.5 for 2041–2060, while the minimum increase (4.7%) is expected under SSP5-8.5 for 2080–2100.
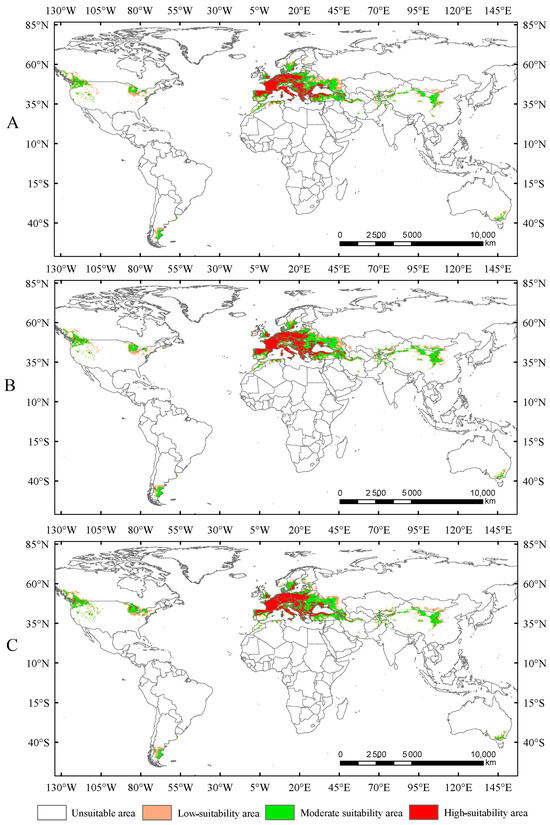
Figure 5.
Suitable areas of Trachypteris picta under SSP1-2.6 (A), SSP2-4.5 (B), and SSP5-8.5 (C) in the 2050s.

Figure 6.
Suitable areas of Trachypteris picta under SSP1-2.6 (A), SSP2-4.5 (B), and SSP5-8.5 (C) in the 2090s.
3.4. Shift of the Centroids Within the Suitable Areas
The centroid refers to the geometric center of a polygon, represented by the average coordinates of the polygon’s vertices. For Trachypteris picta, the centroid of the global suitable area is located in the eastern Mediterranean (18.75697° E, 38.05233° N) under the current climate conditions. Under future climate scenarios, the centroids of global suitable areas are expected to shift to the northwest (Figure S3). The migration distance of the centroid is the longest under SSP5-8.5, followed by SSP2-4.5, with the smallest shift under SSP1-2.6. Overall, the increase in temperature causes the centroids of the global suitable areas to shift towards higher latitudes.
4. Discussion
Some studies have demonstrated that the impact of climate and soil variables on species distribution is more significant than other factors at a large spatial scale [46,52]. Consequently, this study used climate factors, land use type, and vegetation (tree cover percentage) to explore the global suitable distribution of Trachypteris picta. The predicted results from most potential distribution studies align with the current distribution of the species [20,34,35,36], although a few studies do not correspond with the current distribution [56,57]. This discrepancy may arise from the limited number of distribution points in the target area [36,58]. Previous studies have shown that a greater number of species distribution points within a defined range correlates with higher model accuracy [59,60]. However, some scholars also argued that the MaxEnt model is not sensitive to sample size [61]. Recent research has suggested that using imprecise data in species distribution models can lead to inaccurate results [44]. To ensure the accuracy of our findings, distribution points with uncertain location data were excluded from this study. After screening and filtering, 263 distribution points and 10 environmental variables were used for the MaxEnt model. The performance of this model was evaluated using the AUC value, which is 0.980, indicating a high level of accuracy in predicting the suitable habitat for T. picta [24,62]. The values of omission rate and model complexity evaluation metric were also suggestive that the model fits the data well.
Bioclimatic factors, especially temperature and rainfall, have an impact on the physiological activities of insects and can also affect their populations and distribution indirectly by restricting their food sources and habitat conditions [63]. Based on the results of the jackknife test, Bio01, Bio03, Bio11, and Bio19 are four key bioclimatic factors that significantly affect the suitable distribution areas of T. picta. This supports the above perspective. All insects are poikilotherms, and their body temperature changes with the surrounding environmental temperature, which can affect egg hatching rates and larval development [64]. For T. picta, this species overwinters as larvae in the trunks of their host species, with the larvae undergoing diapause from late October to March or April of the following year, while adults appear from April to July [8,12,13]. The temperatures in October and March may play a crucial role in the initiation and termination of diapause. The precipitation in the winter within the distribution area of T. picta is snow, which may affect the host and indirectly impact the larvae [41]. As mentioned above, the larvae of T. picta inhabit the trunks of their host species and can be transported with the wood, allowing them to spread to other areas and potentially become an invasive species. Therefore, strengthening the inspection of wood from willows and poplars could help prevent the spread of this species. In this study, the predicted potential distribution of T. picta is largely consistent with its current distribution. Under the current climate conditions, the highly suitable habitats are primarily concentrated in the southern part of Europe, the northwestern edge of Africa, small scattered areas in China (specifically Xinjiang and Shaanxi), and the northwest of the United States. A small number of suitable habitats for T. picta are also identified in southeastern Australia and the northwest of the United Sates; however, no distribution records of T. picta have been found in these regions to date. This may be attributed to the fact that the habitats in these regions are similar to those of the existing distribution points, which are characterized by a relatively dry climate [65], and T. picta may be present in these regions but has not yet been discovered.
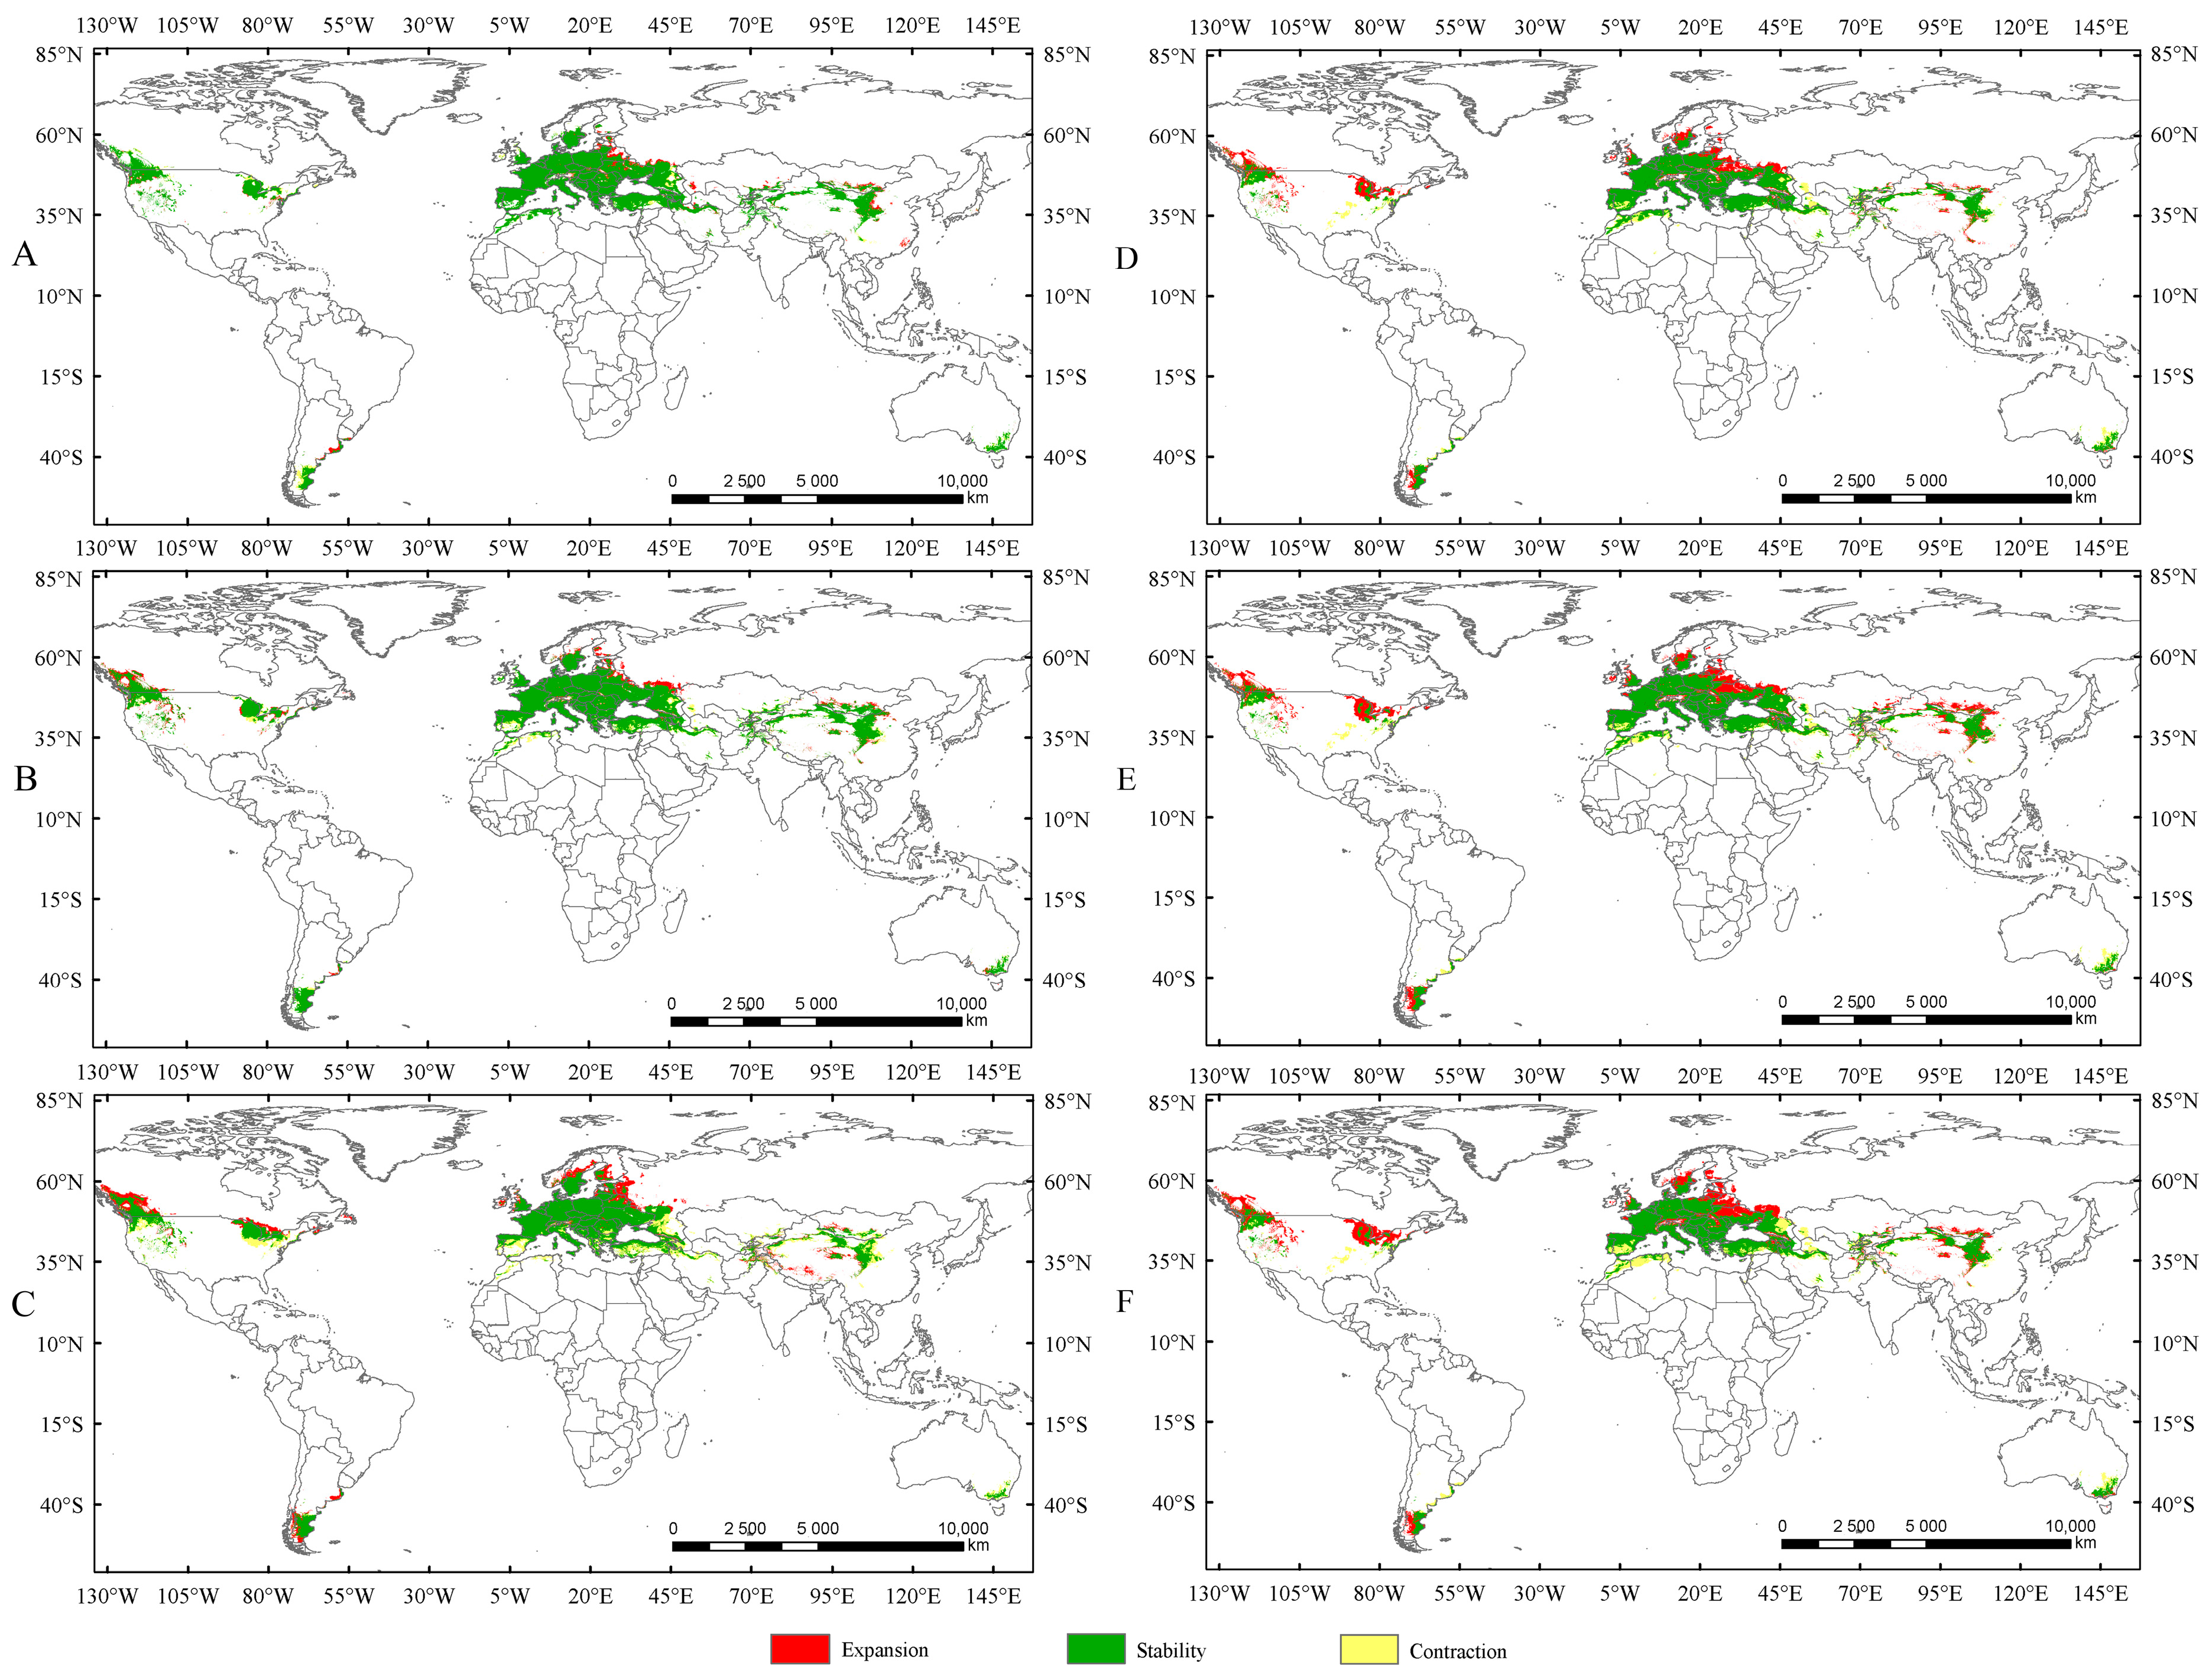
Currently, there is no consistent pattern regarding the impact of rising temperatures on the suitable habitat area of insects. The existing studies indicate that under increasing temperatures, the suitable habitat area of some insects may expand [34,40,42], while for others, it may shrink [18,20,39]. In the present study, the suitable habitat areas of Trachypteris picta under the current climate conditions are significantly smaller than those projected for future climate scenarios. Compared to the current suitable habitat areas, the suitable habitat areas are expected to expand by 13.4%, 21.16%, and 21.47% under SSP1-2.6, SSP2-4.5, and SSP5-8.5 during 2041–2060, respectively (Figure 7). The suitable habitat areas under SSP1-2.6 and SSP2-4.5 in 2081–2100 are also projected to expand by 3.61% and 5.22%, respectively, compared to those in 2041–2060 (Figure 7), while the suitable area under SSP5-8.5 in the 2050s is expected to be larger than that in the 2090s. This phenomenon is similar to previous studies that demonstrated that rising temperatures can increase the suitable habitat area of insects [31,42]. Under future climate conditions, the expanded areas for T. picta primarily extend northward, while a small number of suitable habitats in China expand southward, a trend also observed in other species [18,20,39]. This finding is consistent with most previous studies, which showed that rising temperatures cause the suitable habitats of insects to shift northward [36,42].
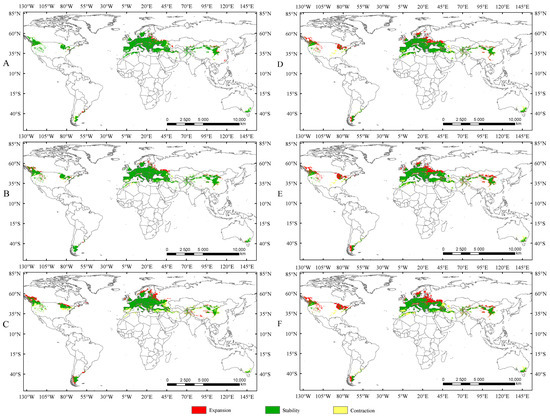
Figure 7.
The changes in suitable areas in the 2050s and 2090s compared to those under the current climate conditions. (A) Suitable areas of T. picta under SSP1-2.6 in the 2050s; (B) suitable areas of T. picta under SSP2-4.5 in the 2050s; (C) suitable areas of T. picta under SSP5-8.5 in the 2050s; (D) suitable areas of T. picta under SSP1-2.6 in the 2090s; (E) suitable areas of T. picta under SSP2-4.5 in the 2090s; (F) suitable areas of T. picta under SSP5-8.5 in the 2090s.
5. Conclusions
In the present study, the global suitable habitats of Trachypteris picta were predicted using the MaxEnt model under the current and future climate conditions. Among the selected environmental variables, the annual mean temperature, mean temperature of the coldest quarter, precipitation of the coldest quarter, and isothermality were found to be more significant than others. Compared to the current distribution, the suitable areas are projected to expand significantly in the periods of 2041–2060 and 2081–2100 under three climate scenarios (SSP1-2.6, SSP2-4.5, and SSP5-8.5). In comparison to the centroid of the current suitable area, the centroids of the suitable areas are shifting towards higher latitudes under future climate scenarios. Based on the suitable areas of T. picta under the current climate conditions, the current monitoring activities and pest management mainly focus on the following countries and regions: Portugal, Spain, France, Germany, Italy, Hungary, Greece, Albania, Montenegro, Serbia, Bulgaria, northern Morocco and Algeria, Iran, Azerbaijan, Afghanistan, Pakistan, and Xinjiang and Shaanxi in China. In the future, the pest monitoring areas will expand to include the western border regions of Russia, southern Mongolia, and western China.
Supplementary Materials
The following supporting information can be downloaded at: https://www.mdpi.com/article/10.3390/insects16080802/s1, Table S1: Potential suitable area of Trachypteris picta under different scenarios; Table S2: Statistical analysis of the changes in the suitable area under different scenarios; Figure S1: Reliability test of the potential distribution for Trachypteris picta; Figure S2: Response curves reflecting the relationship between the suitable habitat of Trachypteris picta and four key environmental variables; Figure S3: Shift in the geometric center of the suitable area under future climate scenarios.
Author Contributions
Conceptualization, Z.W. and A.S.; methodology, Z.W..; software, Z.W. and S.W.; validation, Y.L. and S.W.; formal analysis, Z.W. and S.W.; data curation, Z.W. and S.W.; writing—original draft preparation, H.L. and Z.W.; writing—review and editing, S.D. and Z.W.; visualization, Y.L.; supervision, D.Y.; funding acquisition, A.S. and Z.W. All authors have read and agreed to the published version of the manuscript.
Funding
This work was supported by the Research on Prediction of Potential Habitat Suitability for Invasive Alien Insects in Dazhou City, Sichuan Province (grant No. 2024QD19), the Natural Science Foundation of Sichuan Province (grant Nos. 2024NSFSC0076 and 2025KJLH0100), the Natural Science Special (Special Post) Scientific Research Fund Project of Guizhou University (2023-06), and the Qiankehe Platform Talent (BQW[2024]012).
Data Availability Statement
The original contributions presented in this study are included in the article/Supplementary Material. Further inquiries can be directed to the corresponding authors.
Acknowledgments
We thank Manlu Zhao and Fen Liu (China West Normal University) for collecting distribution points for this study.
Conflicts of Interest
The authors declare no conflicts of interest.
Abbreviations
The following abbreviations are used in this manuscript:
| Trachypteris picta | T. picta |
| Maximum entropy | MaxEnt |
| Receiver operating characteristic | ROC |
| Area under the curve | AUC |
References
- Bellamy, C.L. A World Catalogue and Bibliography of the Jewel Beetles (Coleoptera: Buprestoidea); Pensoft: Sofia, Bulgaria, 2008; Volume 1–4. [Google Scholar]
- Li, Y. Causes and control technology of Chrysobothris succedanea Saunders damages at Robinia pseudoacacia cv. Idaho; in Beinhe New District in Yinchuan City. Ningxia J. Agric. For. Sci. Technol. 2018, 59, 20. [Google Scholar]
- Kelnarova, I.; Jendek, E.; Grebennikov, V.V.; Bocak, L. First molecular phylogeny of Agrilus (Coleoptera: Buprestidae), the largest genus on Earth, with DNA barcode database for forestry pest diagnostics. Bull. Entomol. Res. 2019, 109, 200–211. [Google Scholar] [CrossRef]
- Zhang, P.; Cui, Z.; Xu, H.; Ali, A.; Zhang, X.; Liu, X.; Zhang, Y.; Zhou, X.; Lu, Z. Thirst or malnutrition: The impacts of invasive insect Agrilus mali on the physiological status of wild apple trees. Forests 2020, 11, 440. [Google Scholar] [CrossRef]
- Kovacs, K.F.; Mercader, R.J.; Haight, R.G.; Siegert, N.W.; McCullough, D.G.; Liebhold, A.M. The influence of satellite populations of emerald ash borer on projected economic costs in U.S. Communities, 2010–2020. J. Environ. Manag. 2011, 92, 2170–2181. [Google Scholar] [CrossRef] [PubMed]
- Herms, D.A.; McCullough, D.G. Emerald ash borer invasion of North America: History, biology, ecology, impacts, and management. Ann. Rev. Entomol. 2014, 59, 13–30. [Google Scholar] [CrossRef] [PubMed]
- Obenberger, J. O některých palaearktických druzích rodu Melanophila Eschsch. (Col. Bupr.). De nonnullis generis Melanophila Eschsch. speciebus palaearcticis (Col. Bupr.). Acta Entomol. Mus. Nat. Pra. 1944, 21–22, 147–150. [Google Scholar]
- Qu, B.X.; Chen, H.; Liu, F.D. Study on Melanophila decastigma Fabricius II: Occurring Regularity and Its Control. J. Northwest For. Coll. 1991, 66, 28–33. [Google Scholar]
- Babmorad, M.; Abaei, M.; Zinali, S. Biological study of Melanophila (= Trachypteris) picta (Col.: Buprestidae) in Karaj. Appl. Entomol. Phytopathol. 2008, 75, 55–71. [Google Scholar]
- Makan, N.; Yue, C.Y.; Zhang, X.P.; Maimaiti, A. Risk analysis on invasion of Melanophila decastigma in Xinjiang. Prot. Fores. Sci. Tech. 2013, 6, 25–27. [Google Scholar]
- Uphur, Y. Control Methods for the Trachypteris picta in Korla City. South China Agric. 2015, 9, 64. [Google Scholar]
- Xue, X.Q. The occurrence and control of Melanophila decastigma Fabr. Sci. Silv. Sin. 1978, 2, 37–41. [Google Scholar]
- Yakup, A.; Semiy, K.; Zhang, X.P.; Yue, C.Y.; Liu, A.H. The current situation of the harmful effects of Melanophila decastigma on industrial raw material forests in Karamay and its control measures. Prot. Fores. Sci. Tech. 2014, 9, 76–77. [Google Scholar]
- Trew, B.T.; Maclean, I.M.D.; McGill, B. Vulnerability of global biodiversity hotspots to climate change. Glob. Ecol. Biogeogr. 2021, 30, 768–783. [Google Scholar] [CrossRef]
- Nogués-Bravo, D.; Veloz, S.; Holt, B.G.; Singarayer, J.; Valdes, P.; Davis, B.; Brewer, S.C.; Williams, J.W.; Rahbek, C. Amplified plant turnover in response to climate change forecast by Late Quaternary records. Nat. Clim. Change 2016, 6, 1115–1119. [Google Scholar] [CrossRef]
- Bush, M.B.; Silman, M.R.; Urrego, D.H. 48,000 years of climate and forest change in a biodiversity hot spot. Science 2004, 303, 827–829. [Google Scholar] [CrossRef]
- Halsch, C.A.; Shapiro, A.M.; Fordyce, J.A.; Nice, C.C.; Thorne, J.H.; Waetjen, D.P.; Forister, M.L. Insects and recent climate change. Proc. Natl. Acad. Sci. USA 2021, 118, e2002543117. [Google Scholar] [CrossRef]
- Poloni, R.; Iannella, M.; Fusco, G.; Fattorini, S. Conservation biogeography of high-altitude longhorn beetles under climate change. Insect Conserv. Diver. 2022, 15, 429–444. [Google Scholar] [CrossRef]
- Moguel-Cárdenas, L.I.; León-Cortés, J.L.; Rodríguez-Aguilar, O.; Castillo-Vera, A.; Islebe, G.A. Climate-driven change and conservation of threatened satyrine butterflies in cloud forests of southern Mexico. J. Insect Conserv. 2024, 28, 331–343. [Google Scholar] [CrossRef]
- Yu, Y.L.; Li, Z.Q. Predicting the potential distribution of Cheirotonus jansoni (Coleoptera: Scarabaeidae) under climate change. Insects 2024, 15, 1012. [Google Scholar] [CrossRef] [PubMed]
- Sutherst, R.W.; Maywald, G.E. A computerized system for matching climates in ecology. Agric. Ecosyst. Environ. 1985, 13, 281–299. [Google Scholar] [CrossRef]
- Sutherst, R.W.; Maywald, G.E.; Bottomley, W.; Bourne, A. CLIMEX v2; Hearne Scientific Software: Melbourne, Australia, 2004. [Google Scholar]
- Brook, B.W.; Duncan, R.P. The future of science in species distribution models. J. Biogeogr. 2015, 42, 1–4. [Google Scholar]
- Phillips, S.J.; Anderson, R.P.; Schapirer, E. Maximum entropy modeling of species geographic distributions. Ecol. Model. 2006, 190, 231–259. [Google Scholar] [CrossRef]
- Hirzel, A.H.; Hausser, J.; Chessel, D.; Perrin, N. Ecological-Niche factor analysis: How to compute habitat-suitability maps without absence data? Ecology 2002, 83, 2027–2036. [Google Scholar] [CrossRef]
- Stockwell, D. The GARP modelling system: Problems and solutions to automated spatial prediction. Int. J. Geogr. Inf. Sci. 1999, 13, 143–158. [Google Scholar] [CrossRef]
- Mondanaro, A.; Di Febbraro, M.; Castiglione, S.; Melchionna, M.; Serio, C.; Girardi, G.; Belfiore, A.M.; Raia, P. ENphylo: A new method to model the distribution of extremely rare species. Methods Ecol. Evol. 2023, 14, 911–922. [Google Scholar] [CrossRef]
- Booth, T.H.; Nix, H.A.; Busby, J.R.; Hutchinson, M.F. BIOCLIM: The first species distribution modelling package, its early applications and relevance to most current MaxEnt studies. Divers. Distrib. 2014, 20, 1–9. [Google Scholar] [CrossRef]
- Urbani, F.; D’Alessandro, P.; Biondi, M. Using Maximum Entropy Modeling (MaxEnt) to predict future trends in the distribution of high altitude endemic insects inresponse to climate change. Bull. Insectol. 2017, 70, 189–200. [Google Scholar]
- Fan, S.Y.; Chen, C.; Zhao, Q.; Wei, J.F.; Zhang, H.F. Identifying potentially climatic suitability areas for Arma custos (Hemiptera: Pentatomidae) in China under climate change. Insects 2020, 11, 674. [Google Scholar] [CrossRef]
- Zhang, Y.; Hughes, A.C.; Zhao, Z.H.; Li, Z.H.; Qin, Y.J. Including climate change to predict the global suitable area of an invasive pest: Bactrocera correcta (Diptera: Tephritidae). Glob. Ecol. Conserv. 2022, 34, e02021. [Google Scholar] [CrossRef]
- Wang, S.Y.; Lu, Y.Y.; Han, M.Y.; Li, L.L.; He, P.; Shi, A.M.; Bai, M. Using MaxEnt model to predict the potential distribution of three potentially invasive scarab beetles in China. Insects 2023, 14, 239. [Google Scholar] [CrossRef] [PubMed]
- Zhang, G.L.; Liu, S.; Xu, C.Q.; Wei, H.S.; Guo, K.; Xu, R.; Qiao, H.L.; Liu, P.F. Prediction of potential distribution of Carposina coreana in China under the current and future climate change. Insects 2024, 15, 411. [Google Scholar] [CrossRef]
- Shi, X.D.; Yin, Q.; Sang, Z.Y.; Zhu, Z.L.; Jia, Z.K.; Ma, L.Y. Prediction of potentially suitable areas for the introduction of Magnolia wufengensis under climate change. Ecol. Indic. 2021, 27, 107762. [Google Scholar] [CrossRef]
- Chen, B.G.; Zou, H.; Zhang, B.Y.; Zhang, X.Y.; Jin, X.X.; Wang, C.; Zhang, X.X. Distribution pattern and change prediction of Saposhnikovia divaricata suitable area in China under climate change. Ecol. Indic. 2022, 143, 109311. [Google Scholar] [CrossRef]
- Pecl, G.T.; Araújo, M.B.; Bell, J.D.; Blanchard, J.; Bonebrake, T.C.; Chen, I.C.; Clark, T.D.; Colwell, R.K.; Danielsen, F.; Evengård, B.; et al. Biodiversity redistribution under climate change: Impacts on ecosystems and human well-being. Science 2017, 355, eaai9214. [Google Scholar] [CrossRef]
- Warren, R.; Price, J.; Graham, E.; Forstenhaeusler, N.; VanDerWal, J. The projected effect on insects, vertebrates, and plants of limiting global warming to 1.5°C rather than 2°C. Science 2018, 360, 791–795. [Google Scholar] [CrossRef]
- Kwon, T.-S.; Lee, C.M.; Kim, S.-S. Prediction of abundance of beetles according to climate warming in South Korea. J. Asia-Pac. Biodivers. 2015, 8, 7–30. [Google Scholar] [CrossRef]
- Zhao, Z.X.; Yang, L.; Long, J.K.; Chang, Z.M.; Chen, X.S. Predicting suitable areas for Metcalfa pruinose (Hemiptera: Flatidae) under climate change and implications for management. J. Insect Sci. 2024, 24, 7. [Google Scholar] [CrossRef]
- Fu, C.; Wen, X.Y.; Huang, T.T.; Wang, Y.L.; Liu, X.; Jiang, N.; Wang, R.L.; Zhao, J.P. Comparison of GARP and MaxEnt in modeling current and future geographic distribution of Ceracris nigricornis Walker (Acrididae, Orthoptera) in China. Ecol. Evol. 2024, 14, e70439. [Google Scholar] [CrossRef]
- Sobek-Swant, S.; Kluza, D.A.; Cuddington, K.; Lyons, D.B. Potential distribution of emerald ash borer: What can we learn from ecological niche models using Maxent and GARP? Forest Ecol. and Manag. 2012, 81, 23–31. [Google Scholar] [CrossRef]
- Zhang, Y.; Yang, H.; Jiamahate, A.; Yang, H.; Cao, L.; Dang, Y.; Lu, Z.; Yang, Z.; Bozorov, T.A.; Wang, X. Potential ecological distribution of the beetle Agrilus mali Matsumura (Coleoptera: Buprestidae) in China under three climate change scenarios, with consequences for commercial and wild apple forests. Biology 2024, 13, 803. [Google Scholar] [CrossRef] [PubMed]
- Sambaraju, K.R.; Powell, K.A.; Beaudoin, A. Multi-model assessments to characterize occurrences of emerald ash borer (Coleoptera: Buprestidae). J. Insect Sci. 2025, 16, 18. [Google Scholar] [CrossRef]
- Koo, K.S.; Lee, K.-H.; Lee, D.; Jiang, Y. Impact of obscured data on species distribution models. Conserv. Biol. 2025; published online. [Google Scholar]
- Verbruggen, H.; Tyberghein, L.; Belton, G.S.; Mineur, F.; Jueterbock, A.; Hoarau, G.; Gurgel, C.F.; Clerk, O.D. Improving transferability of introduced species’ distribution models: New tools to forecast the spread of a highly invasive seaweed. PLoS ONE 2013, 8, e63337. [Google Scholar] [CrossRef] [PubMed]
- Wei, J.F.; Peng, L.F.; He, Z.Q.; Lu, Y.; Wang, F. Potential distribution of two invasive pineapple pests under climate change. Pest. Manag. Sci. 2020, 76, 1652–1663. [Google Scholar] [CrossRef]
- Kobayashi, T.; Tateishi, R.; Alsaaideh, B.; Sharma, R.C.; Wakaizumi, T.; Miyamoto, D.; Bai, X.; Long, B.D.; Gegentana, G.; Maitiniyazi, A. Production of global land cover data–GLCNMO2013. J. Geogr. Geol. 2017, 9, 1–15. [Google Scholar] [CrossRef]
- Eyring, V.; Bony, S.; Meehl, G.A.; Senior, C.A.; Stevens, B.; Stouffer, R.J.; Taylor, K.E. Overview of the Coupled Model Intercomparison Project Phase 6 (CMIP6) experimental design and organization. Geosci. Model Dev. 2016, 9, 1937–1958. [Google Scholar] [CrossRef]
- Riahi, K. The shared socioeconomic pathways and their energy, land use, and greenhouse gas emissions implications: An overview. Glob. Environ. Change 2017, 42, 153–168. [Google Scholar] [CrossRef]
- Zhu, G.P.; Jiao, H.J. Effect of the MaxEnt model’s complexity on the prediction of species potential distributions. Biodivers. Sci. 2016, 24, 1189–1196. [Google Scholar] [CrossRef]
- Elith, J.; Kearney, M.; Phillips, S. The art of modeling range-shifting species. Methods Ecol. Evol. 2010, 1, 330–342. [Google Scholar] [CrossRef]
- Wei, B.; Wang, R.L.; Hou, K.; Wang, X.Y.; Wu, W. Predicting the current and future cultivation regions of Carthamus tinctorius L. using MaxEnt model under climate change in China. Glob. Ecol. Conserv. 2018, 16, e00477. [Google Scholar] [CrossRef]
- Phillips, S.J.; Dudík, M. Modeling of species distributions with Maxent: New extensions and a comprehensive evaluation. Ecography 2008, 31, 161–175. [Google Scholar] [CrossRef]
- Anderson, R.P.; Lew, D.; Peterson, A.T. Evaluating predictive models of species’ distributions: Criteria for selecting optimal models. Ecol. Model. 2003, 162, 211–232. [Google Scholar] [CrossRef]
- Warren, D.L.; Seifert, S.N. Ecological niche modeling in Maxent: The importance of model complexity and the performance of model selection criteria. Ecol. Appl. 2011, 21, 335–342. [Google Scholar] [CrossRef]
- Rödder, D.; Schmidtlein, S.; Veithm, M.; Lötters, S. Alien invasive slider turtle in unpredicted habitat: A matter of niche shift or of predictors studied? PLoS ONE 2009, 4, e7843. [Google Scholar] [CrossRef] [PubMed]
- Chen, X.F.; Lu, Y.Y.; Li, P.P. Prediction of potential geographic distribution for common snapping turtle (Chelydra serpentina) based on MaxEnt modelling. Chin. J. Wildlife 2017, 38, 467–472. [Google Scholar]
- Wisz, M.S.; Hijmans, R.J.; Li, J.; Peterson, A.T.; Graham, C.H.; Guisan, A. NCEAS Predicting Species Distributions Working Group. Effects of sample size on the performance of species distribution models. Divers. Distrib. 2008, 14, 763–773. [Google Scholar] [CrossRef]
- Stockwell, D.R.B.; Peterson, A.T. Effects of sample size on accuracy of species distribution models. Ecol. Model 2002, 148, 1–13. [Google Scholar] [CrossRef]
- Ji, Q.Z.; Wang, R.X.; Huang, Z.P.; Yuan, J.H.; Ren, G.P.; Xiao, W. Effects of sample size and study range on accuracy of MaxEnt in predicting species distribution: A case study of the black-and-white snub-nosed monkey. Acta Theriol. Sin. 2019, 39, 126–133. [Google Scholar]
- Elith, J.; Graham, C.H.; Anderson, R.P.; Dudik, M.; Ferrier, S.; Guisan, A.; Hijmans, R.J.; Huettmann, F.; Leathwick, J.R.; Lehmann, A.; et al. Novel methods improve prediction of species’ distributions from occurrence data. Ecography 2006, 29, 129–151. [Google Scholar] [CrossRef]
- Janitza, S.; Strobl, C.; Boulesteix, A.L. An AUC-based permutation variable importance measure for random forests. BMC Bioinform. 2013, 14, 119. [Google Scholar] [CrossRef]
- Ye, G.; You, L.; Lu, C.; Lin, W.; Luo, M.; Tan, F. Global climate change and adaptive management of forest ecosystem. World For. Res. 2015, 28, 145–167. [Google Scholar]
- Speight, M.R.; Hunter, M.D.; Watt, A.D. Ecology of Insects: Concepts and Applications; Wiley-Blackwell Hoboken: Hoboken, NJ, USA, 2008. [Google Scholar]
- Deo, R.C. Links between native forest and climate in Australia. Weather 2011, 66, 64–69. [Google Scholar] [CrossRef]
Disclaimer/Publisher’s Note: The statements, opinions and data contained in all publications are solely those of the individual author(s) and contributor(s) and not of MDPI and/or the editor(s). MDPI and/or the editor(s) disclaim responsibility for any injury to people or property resulting from any ideas, methods, instructions or products referred to in the content. |
© 2025 by the authors. Licensee MDPI, Basel, Switzerland. This article is an open access article distributed under the terms and conditions of the Creative Commons Attribution (CC BY) license (https://creativecommons.org/licenses/by/4.0/).