
Real-Time Integrative Mapping of the Phenology and Climatic Suitability for the Spotted Lanternfly, Lycorma delicatula


Simple Summary
Abstract
1. Introduction
2. Methods
2.1. Modeling Overview
2.2. Climate Data
2.3. Phenology Model Development
2.3.1. Life Cycle and Overwintering Stage
2.3.2. Thresholds, Stage Durations, and Phenological Events
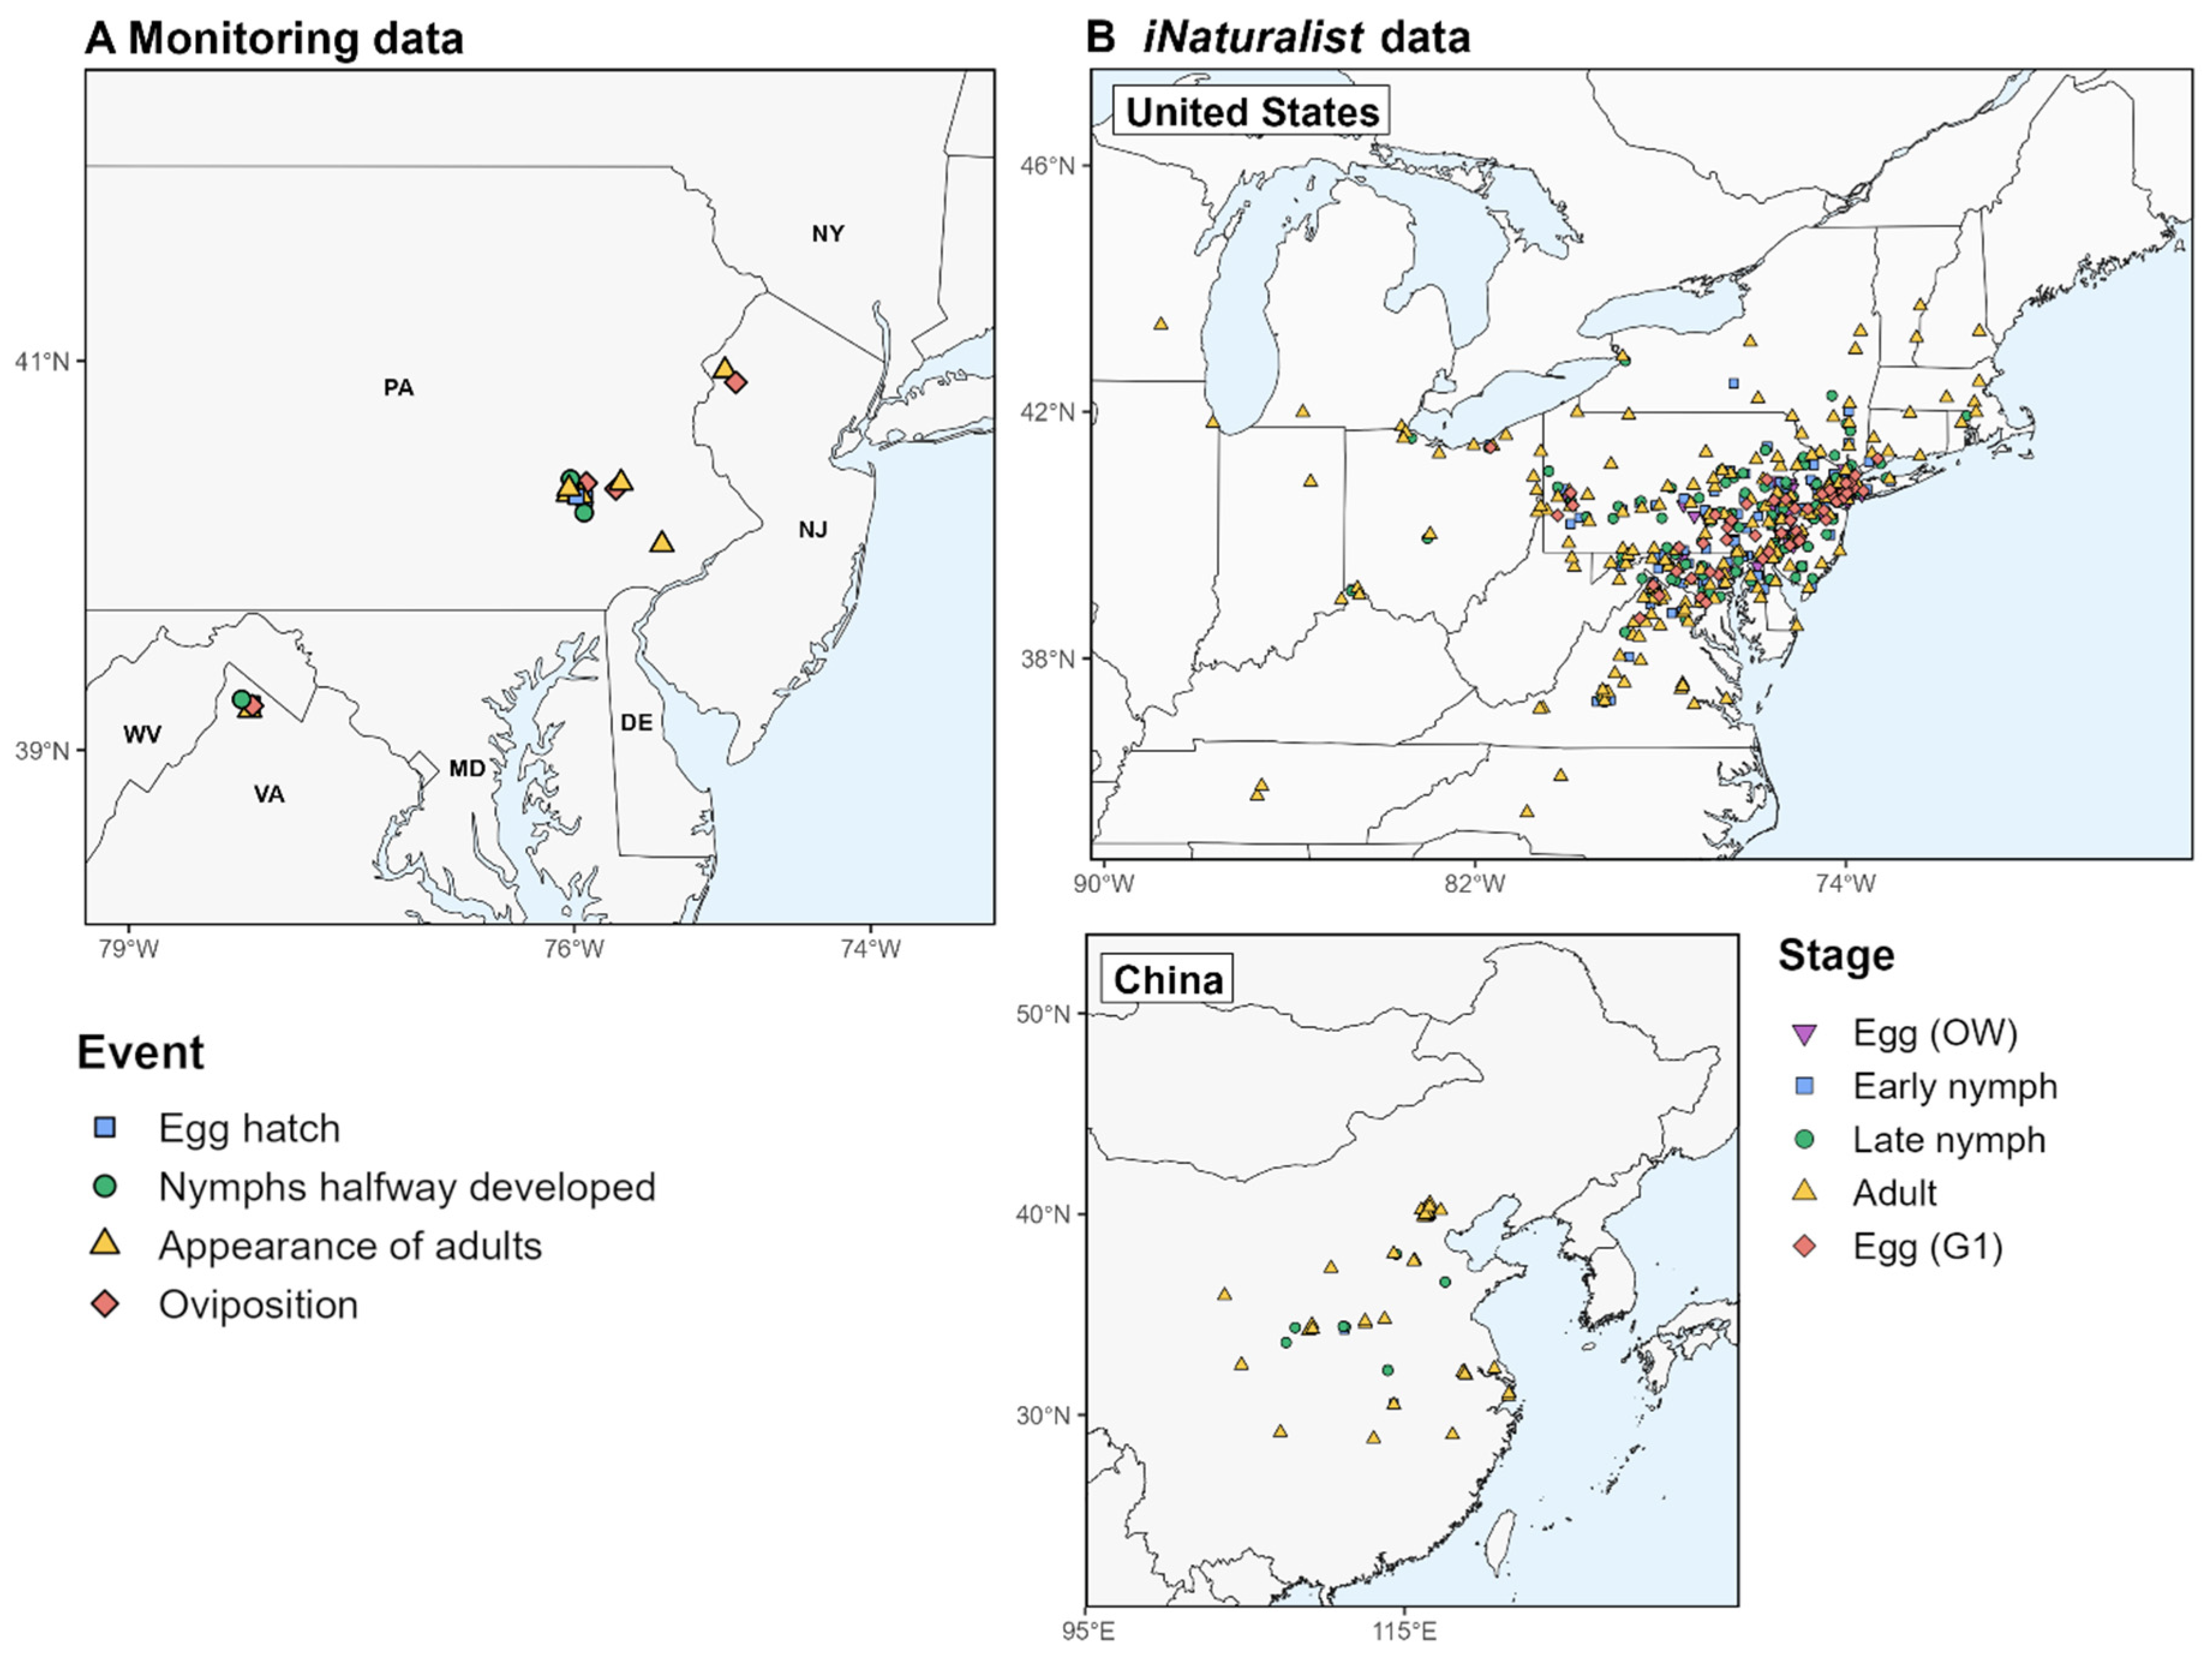
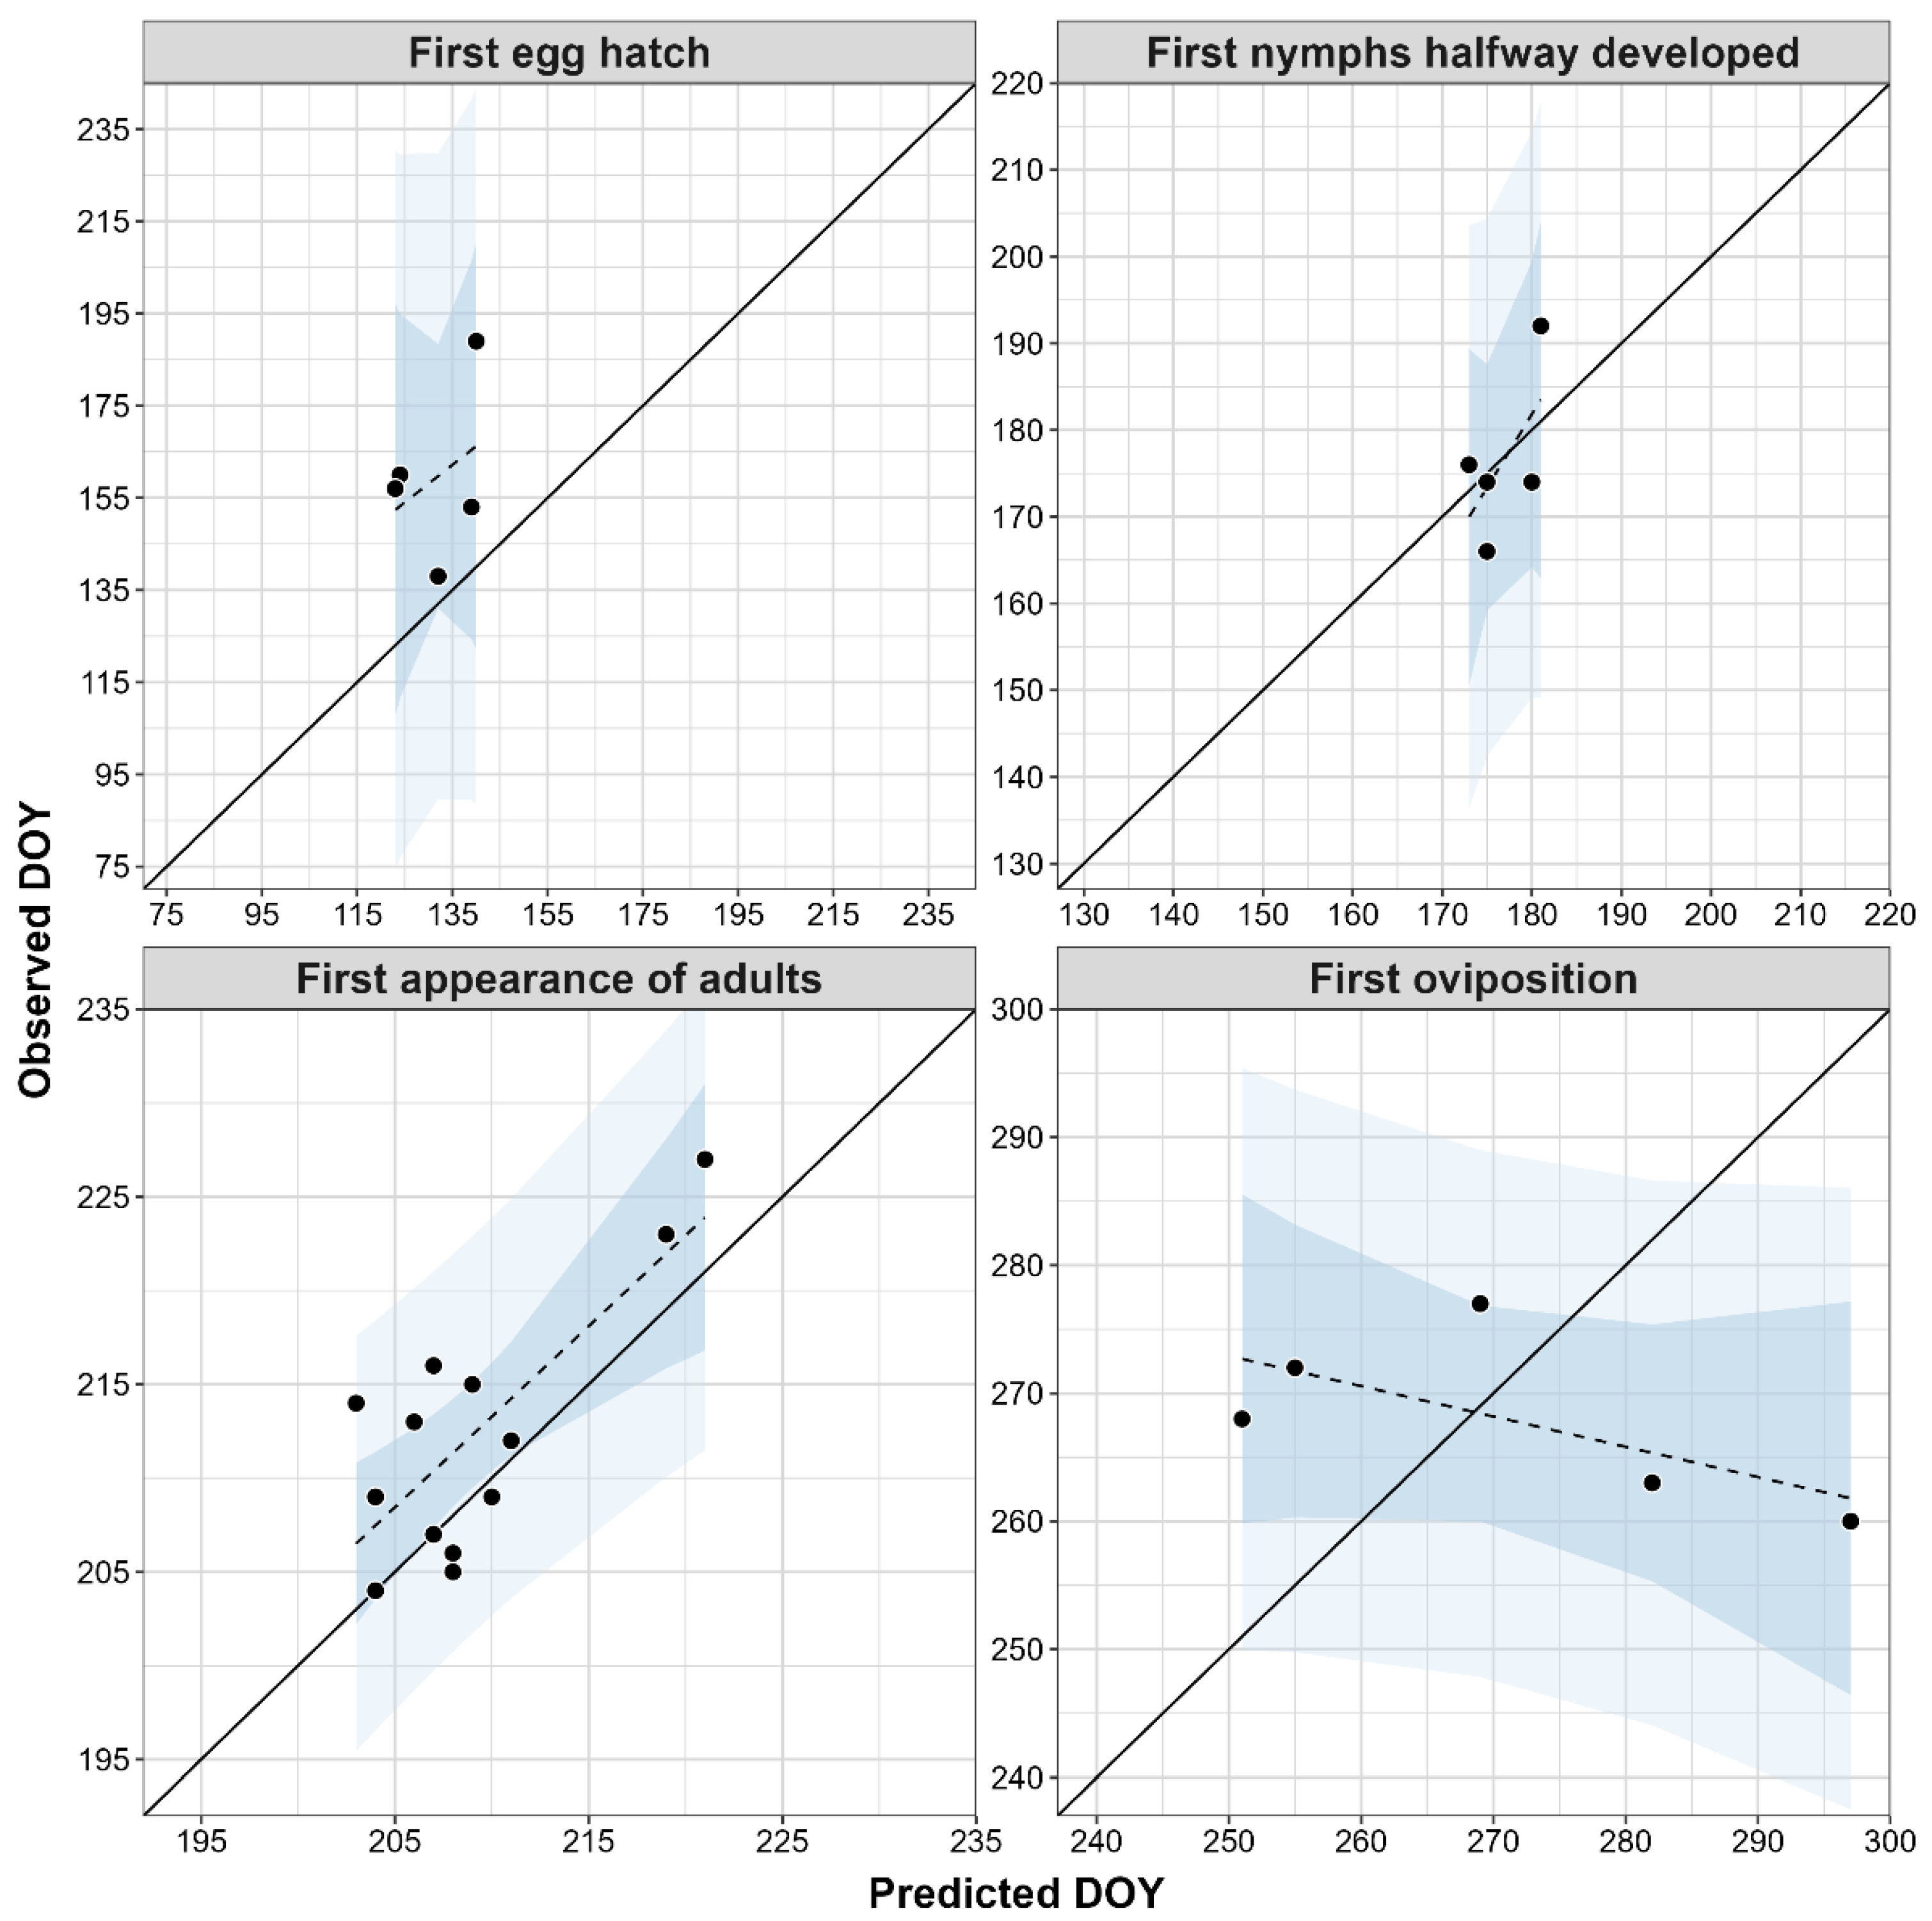
2.3.3. Phenology Model Validation
2.4. Climatic Suitability Model Development
2.4.1. Cold Stress Parameters
2.4.2. Heat Stress Parameters
2.4.3. Climatic Suitability Model Validation
2.5. Model Demonstration
3. Results
3.1. Phenology
3.2. Climatic Suitability
3.3. Predictions for North America and Europe for 2023
4. Discussion
4.1. Phenology Model
4.2. Climatic Suitability Model
4.3. Near-Real-Time Forecasts for Decision Support
4.4. Other Applications
5. Conclusions
Supplementary Materials
Author Contributions
Funding
Data Availability Statement
Acknowledgments
Conflicts of Interest
References
- Chu, H.J. Notes on the life-history of Lycorma delicatula White in Nanking. Peking Nat. Hist. Bull. 1930, 5, 33–35. [Google Scholar]
- Dara, S.K.; Barringer, L.; Arthurs, S.P. Lycorma delicatula (Hemiptera: Fulgoridae): A new invasive pest in the United States. J. Integr. Pest Manag. 2015, 6, 20. [Google Scholar] [CrossRef]
- Urban, J.M.; Leach, H. Biology and management of the spotted lanternfly, Lycorma delicatula (Hemiptera: Fulgoridae), in the United States. Annu. Rev. Entomol. 2023, 68, 151–167. [Google Scholar] [CrossRef]
- NYSIPM New York State Integrated Pest Management: Spotted Lanternfly Known Distribution (Updated 24 April 2025). Available online: https://cals.cornell.edu/new-york-state-integrated-pest-management/outreach-education/whats-bugging-you/spotted-lanternfly/spotted-lanternfly-reported-distribution-map (accessed on 1 May 2025).
- Murman, K.; Setliff, G.P.; Pugh, C.V.; Toolan, M.J.; Canlas, I.; Cannon, S.; Abreu, L.; Fetchen, M.; Zhang, L.; Warden, M.L.; et al. Distribution, survival, and development of spotted lanternfly on host plants found in North America. Environ. Entomol. 2020, 49, 1270–1281. [Google Scholar] [CrossRef]
- EPPO Pest Risk Analysis for Lycorma delicatula. EPPO, Paris, France. 2016. Available online: http://www.eppo.int/QUARANTINE/Pest_Risk_Analysis/PRA_intro.htm (accessed on 17 April 2025).
- Barringer, L.; Ciafré, C.M. Worldwide feeding host plants of spotted lanternfly, with significant additions from North America. Environ. Entomol. 2020, 49, 999–1011. [Google Scholar] [CrossRef]
- Lee, D.H.; Park, Y.L.; Leskey, T.C. A review of biology and management of Lycorma delicatula (Hemiptera: Fulgoridae), an emerging global invasive species. J. Asia Pac. Entomol. 2019, 22, 589–596. [Google Scholar] [CrossRef]
- Urban, J.M. Perspective: Shedding light on spotted lanternfly impacts in the USA. Pest Manag. Sci. 2020, 76, 10–17. [Google Scholar] [CrossRef] [PubMed]
- Harper, J.K.; Stone, W.; Kelsey, T.W.; Kime, L.F. Potential Economic Impact of the Spotted Lanternfly on Agriculture and Forestry in Pennsylvania; Center for Rural Pennsylvania: Harrisburg, PA, USA, 2019; pp. 1–84.
- Jones, C.; Skrip, M.M.; Seliger, B.J.; Jones, S.; Wakie, T.; Takeuchi, Y.; Petras, V.; Petrasova, A.; Meentemeyer, R.K. Spotted lanternfly predicted to establish in California by 2033 without preventative management. Commun. Biol. 2022, 5, 558. [Google Scholar] [CrossRef]
- Jung, J.M.; Jung, S.; Byeon, D.H.; Lee, W.H. Model-based prediction of potential distribution of the invasive insect pest, spotted lanternfly Lycorma delicatula (Hemiptera: Fulgoridae), by using CLIMEX. J. Asia-Pac. Biodivers 2017, 10, 532–538. [Google Scholar] [CrossRef]
- Chartois, M.; Fried, G.; Rossi, J.P. Climate and host plant availability are favourable to the establishment of Lycorma delicatula in Europe. Agric. For. Entomol. 2025, 27, 316–328. [Google Scholar] [CrossRef]
- Maino, J.L.; Schouten, R.; Lye, J.C.; Umina, P.A.; Reynolds, O.L. Mapping the life-history, development, and survival of spotted lantern fly in occupied and uninvaded ranges. Biol. Invasions 2022, 24, 2155–2167. [Google Scholar] [CrossRef]
- Lewkiewicz, S.M.; Seibold, B.; Helmus, M.R. Quantifying population resistance to climatic variability: The invasive spotted lanternfly grape pest is buffered against temperature extremes in California. Ecol. Modell. 2024, 497, 110841. [Google Scholar] [CrossRef]
- Wakie, T.T.; Neven, L.G.; Yee, W.L.; Lu, Z. The establishment risk of Lycorma delicatula (Hemiptera: Fulgoridae) in the United States and globally. J. Econ. Entomol. 2019, 113, 306–314. [Google Scholar] [CrossRef]
- Zhao, Z.; Yang, L.; Chen, X. Globally suitable areas for Lycorma delicatula based on an optimized Maxent model. Ecol. Evol. 2024, 14, e70252. [Google Scholar] [CrossRef]
- Huron, N.A.; Behm, J.E.; Helmus, M.R. Paninvasion severity assessment of a U.S. grape pest to disrupt the global wine market. Commun. Biol. 2022, 5, 655. [Google Scholar] [CrossRef] [PubMed]
- Vose, R.S.; Easterling, E.R.; Kunkel, K.E.; LeGrande, E.N.; Wehner, M.F. Temperature changes in the United States. In Climate Science Special Report: Fourth National Climate Assessment, Volume I; Wuebbles, D.J., Fahey, D.W., Hibbard, K.A., Dokken, D.J., Stewart, B.C., Maycock, T.K., Eds.; U.S. Global Change Research Program: Washington, DC, USA, 2017; Volume I, pp. 185–206. [Google Scholar] [CrossRef]
- Reidmiller, D.R.; Avery, C.W.; Easterling, D.R.; Kunkel, K.E.; Lewis, K.L.M.; Maycock, T.K.; Stewart, B.C.; U.S. Global Change Research Program; National Oceanic and Atmospheric Administration; National Aeronautics and Space Administration. Impacts, Risks, and Adaptation in the United States: Fourth National Climate Assessment, Volume II; NOAA: Washington, DC, USA, 2017; Volume II, p. 1515.
- Wuebbles, D.; Meehl, G.; Hayhoe, K.; Karl, T.R.; Kunkel, K.; Santer, B.; Wehner, M.; Colle, B.; Fischer, E.M.; Fu, R.; et al. CMIP5 climate model analyses: Climate extremes in the United States. Bull. Am. Meteorol. Soc. 2014, 95, 571–583. [Google Scholar] [CrossRef]
- Lee, J.S.; Kim, I.K.; Koh, S.H.; Cho, S.J.; Jang, S.J.; Pyo, S.H.; Choi, W.I.L. Impact of minimum winter temperature on Lycorma delicatula (Hemiptera: Fulgoridae) egg mortality. J. Asia Pac. Entomol. 2011, 14, 123–125. [Google Scholar] [CrossRef]
- Calvin, D.D.; Rost, J.; Keller, J.; Crawford, S.; Walsh, B.; Bosold, M.; Urban, J. Seasonal activity of spotted lanternfly (Hemiptera: Fulgoridae), in Southeast Pennsylvania. Environ. Entomol. 2023, 52, 1108–1125. [Google Scholar] [CrossRef]
- Keena, M.A.; Hamilton, G.; Kreitman, D.; Morey, A. The potential climatic range of spotted lanternfly may be broader than previously predicted. Front. Insect Sci. 2023, 3, 1092189. [Google Scholar] [CrossRef]
- Zhang, Y.; Bao, K.; Xin, B.; Cao, L.; Wei, K.; Dang, Y.; Yang, Z.; Lv, Z.; Wang, X. The biology and management of the invasive pest spotted lanternfly, Lycorma delicatula White (Hemiptera: Fulgoridae). J. Plant Dis. Prot. 2023, 130, 1155–1174. [Google Scholar] [CrossRef]
- Hajek, A.E.; Clifton, E.H.; Stefanik, S.E.; Harris, D.C. Batkoa major infecting the invasive planthopper Lycorma delicatula. J. Invertebr. Pathol. 2022, 194, 107821. [Google Scholar] [CrossRef]
- Hajek, A.; Everest, T.; Clifton, E. Accumulation of fungal pathogens infecting the invasive spotted lanternfly, Lycorma delicatula. Insects 2023, 14, 912. [Google Scholar] [CrossRef]
- Bielski, J.T. Management of Spotted Lanternfly (Lycorma delicatula) Overwintering Egg Masses and Multiple State Records of Aculops ailanthi, the Potential Biological Control Agent of Tree-of-Heaven (Ailanthus altissima). Ph.D. Thesis, Virginia Polytechnic Institute, Blackburg, VA, USA, 2024. [Google Scholar]
- Leach, H.; Biddinger, D.J.; Krawczyk, G.; Smyers, E.; Urban, J.M. Evaluation of insecticides for control of the spotted lanternfly, Lycorma delicatula, (Hemiptera: Fulgoridae), a new pest of fruit in the Northeastern U.S. Crop Prot. 2019, 124, 104833. [Google Scholar] [CrossRef]
- Smyers, E.C.; Urban, J.M.; Dechaine, A.C.; Pfeiffer, D.G.; Crawford, S.R.; Calvin, D.D. Spatio-temporal model for predicting spring hatch of the spotted lanternfly (Hemiptera: Fulgoridae). Environ. Entomol. 2021, 50, 126–137. [Google Scholar] [CrossRef]
- Takeuchi, Y.; Tripodi, A.; Montgomery, K. SAFARIS: A spatial analytic framework for pest forecast systems. Front. Insect Sci. 2023, 3, 1198355. [Google Scholar] [CrossRef] [PubMed]
- Takeuchi, Y.; Fowler, G.A. Spotted Lanternfly (Lycorma delicatula (White)) Nymph and Adult Emergence Forecast Methods. 2018. Available online: https://safaris.cipm.info/safarispestmodel/peststaticfiles/SLF_Nymph_Emergence_Forecast_Methods_20180302.pdf (accessed on 2 May 2025).
- Barker, B.S.; Coop, L.; Wepprich, T.; Grevstad, F.S.; Cook, G. DDRP: Real-time phenology and climatic suitability modeling of invasive insects. PLoS ONE 2020, 15, e0244005. [Google Scholar] [CrossRef] [PubMed]
- R Foundation for Statistical Computing. R Development Core Team R: A Language and Environment for Statistical Computing; R Foundation for Statistical Computing: Vienna, Austria, 2023. [Google Scholar]
- Hijmans, R.J.; Bivand, R.; Pebesma, E.; Sumner, M.D. Package “Terra”: Spatial Data Analysis. R Package Version 1.7–55. 2023. Available online: https://cran.r-project.org/web/packages/terra/index.html (accessed on 7 December 2023).
- Wickham, H. Ggplot2: Elegant Graphics for Data Analysis; Springer: New York, NY, USA, 2016. [Google Scholar]
- Barker, B.S.; Coop, L.; Duan, J.J.; Petrice, T.R. An integrative phenology and climatic suitability model for emerald ash borer. Front. Insect Sci. 2023, 3, 1239173. [Google Scholar] [CrossRef]
- Kreitman, D.; Keena, M.A.; Nielsen, A.L.; Hamilton, G. Effects of temperature on development and survival of nymphal Lycorma delicatula (Hemiptera: Fulgoridae). Environ. Entomol. 2021, 50, 183–191. [Google Scholar] [CrossRef] [PubMed]
- Coop, L.B.; Barker, B.S. Advances in understanding species ecology: Phenological and life cycle modeling of insect pests. In Integrated Management of Insect Pests: Current and Future Developments; Kogan, M., Heinrichs, E., Eds.; Burleigh Dodds Science Publishing: Sawston, UK, 2020; pp. 43–96. [Google Scholar]
- Fang, S.; Mao, K.; Xia, X.; Wang, P.; Shi, J.; Bateni, S.M.; Xu, T.; Cao, M.; Heggy, E.; Qin, Z. Dataset of daily near-surface air temperature in China from 1979 to 2018. Earth Syst. Sci. Data 2022, 14, 1413–1432. [Google Scholar] [CrossRef]
- Thornton, M.M.; Strestha, R.; Wei, Y.; Thornton, P.E.; Kao, S.-C.; Wilson, B.E. Daymet: Daily Surface Weather Data on a 1-Km Grid for North America, Version 4; Oak Ridge National Laboratory Distributed Active Archive Center: Oak Ridge, TN, USA, 2020.
- Thornton, P.E.; Shrestha, R.; Thornton, M.; Kao, S.C.; Wei, Y.; Wilson, B.E. Gridded daily weather data for North America with comprehensive uncertainty quantification. Sci. Data 2021, 8, 190. [Google Scholar] [CrossRef]
- Keena, M.A.; Nielsen, A.L. Comparison of the hatch of newly laid Lycorma delicatula (Hemiptera: Fulgoridae) eggs from the United States after exposure to different temperatures and durations of low temperature. Environ. Entomol. 2021, 50, 410–417. [Google Scholar] [CrossRef]
- Shim, J.K.; Lee, K.Y. Molecular characterization of heat shock protein 70 cognate cDNA and its upregulation after diapause termination in Lycorma delicatula eggs. J. Asia. Pac. Entomol. 2015, 18, 709–714. [Google Scholar] [CrossRef]
- Nixon, L.J.; Leach, H.; Barnes, C.; Urban, J.; Kirkpatrick, D.M.; Ludwick, D.C.; Short, B.; Pfeiffer, D.G.; Leskey, T.C. Development of behaviorally based monitoring and biosurveillance tools for the invasive spotted lanternfly (Hemiptera: Fulgoridae). Environ. Entomol. 2020, 49, 1117–1126. [Google Scholar] [CrossRef]
- Dechaine, A.C. Phenology, Impact, and Rearing of Lycorma delicatula (White) (Spotted Lanternfly) in Virginia. Master’s Thesis, Virginia Polytechnic Institute and State University, Blacksburg, VA, USA, 2021. [Google Scholar]
- Leach, H.; Leach, A. Seasonal phenology and activity of spotted lanternfly (Lycorma delicatula) in eastern US vineyards. J. Pest Sci. 2020, 93, 1215–1224. [Google Scholar] [CrossRef]
- Liu, H. Oviposition substrate selection, egg mass characteristics, host preference, and life history of the spotted lanternfly (Hemiptera: Fulgoridae) in North America. Environ. Entomol. 2019, 48, 1452–1468. [Google Scholar] [CrossRef] [PubMed]
- Sevacherian, V.; Stern, V.M.; Mueller, A.J. Heat accumulation for timing Lygus control measures in a safflower-cotton complex. J. Econ. Entomol. 1977, 70, 399–402. [Google Scholar] [CrossRef]
- Park, M. Overwintering Ecology and Population Genetics of Lycorma delicatula (Hemiptera: Fulgoridae) in Korea. Ph.D. Thesis, Seoul National University, Seoul, Republic of Korea, 2015. [Google Scholar]
- Dechaine, A.C.; Sutphin, M.; Leskey, T.C.; Salom, S.M.; Kuhar, T.P.; Pfeiffer, D.G. Phenology of Lycorma delicatula (Hemiptera: Fulgoridae) in Virginia, USA. Environ. Entomol. 2021, 50, 1267–1275. [Google Scholar] [CrossRef] [PubMed]
- Deecher, E.M. Monitoring and Cold Tolerance of the Invasive Spotted Lanternfly, Lycorma delicatula (Hemiptera: Fulgoridae). Master’s Thesis, Pennsylvania State University, University Park, PA, USA, 2023. [Google Scholar]
- Cooperband, M.F.; Murman, K. Responses of adult spotted lanternflies to artificial aggregations composed of all males or females. Front. Insect Sci. 2022, 2, 981832. [Google Scholar] [CrossRef]
- Baker, T.C. Progression of Seasonal Activities of Adults of the Spotted Lanternfly, Lycorma delicatula, During the 2017 Season of Mass Flight Dispersal Behavior in Eastern Pennsylvania. Ph.D. Thesis, Pennsylvania State University, University Park, PA, USA, 2019. [Google Scholar]
- Rosemartin, A.H.; Crimmins, T.M.; Enquist, C.A.F.; Gerst, K.L.; Kellermann, J.L.; Posthumus, E.E.; Denny, E.G.; Guertin, P.; Marsh, L.; Weltzin, J.F. Organizing phenological data resources to inform natural resource conservation. Biol. Conserv. 2014, 173, 90–97. [Google Scholar] [CrossRef]
- Rosemartin, A.H.; Chamberlain, S.; Marsh, L.; Wong, K. Package “rnpn”: Interface to the National Phenology Network API. 2022. Available online: https://cran.r-project.org/package=rnpn (accessed on 30 January 2024).
- Barve, V.; Hart, E. Package “rinat”: Access “iNaturalist” Data Through APIs. 2022. Available online: https://github.com/ropensci/rinat (accessed on 6 December 2023).
- Kreitman, D.; Keena, M.A.; Nielsen, A.L.; Hamilton, G. The impact of host plant species on instar duration and body weight of nymphal Lycorma delicatula. Front. Insect Sci. 2023, 2, 1110480. [Google Scholar] [CrossRef]
- GBIF Occurrence Download. Available online: https://doi.org/10.15468/dl.qenx7u (accessed on 1 November 2024).
- EDDMapS Early Detection & Distribution Mapping System. The University of Georgia—Center for Invasive Species and Ecosystem Health. 2024. Available online: https://www.eddmaps.org (accessed on 20 November 2024).
- Lee, Y.S.; Jang, M.J.; Kim, J.Y.; Kim, J.R. The effect of winter temperature on the survival of lantern fly, Lycorma delicatula (Hemiptera: Fulgoridae) eggs. Korean J. Appl. Entomol. Entomol. 2014, 53, 311–315. [Google Scholar] [CrossRef]
- Turbelin, A.J.; Sinclair, B.J.; Rost, J.; Roe, A.D. Cold tolerance strategy and lower temperature thresholds of Lycorma delicatula egg masses. Environ. Entomol. 2025, nvaf007. [Google Scholar] [CrossRef] [PubMed]
- Liu, T.; Fan, S.T.; Yang, Y.M.; Ai, J.; Liu, Y.X. Investigation on occurrence regularity and integrated control of diseases and pests in grape garden of Ji’an. Sino-Overseas Grapevine Wine 2015, 2, 49–51. [Google Scholar]
- Xin, B.; Zhang, Y.L.; Wang, X.Y.; Cao, L.M.; Hoelmer, K.A.; Broadley, H.J.; Gould, J.R. Exploratory survey of spotted lanternfly (Hemiptera: Fulgoridae) and its natural enemies in China. Environ. Entomol. 2021, 50, 36–45. [Google Scholar] [CrossRef]
- Zandi-Sohani, N.; Keena, M.A.; Gallagher, M.R.; Cullen, A. Heat treatments to kill eggs of two invasive forest insects: Lycorma delicatula (Hemiptera: Fulgoridae) and Lymantria dispar (Lepidoptera: Erebidae). J. Econ. Entomol. 2025, 118, 614–624. [Google Scholar] [CrossRef]
- Tobias, M.M. Classifying American Viticultural Areas based on environmental data. Int. Arch. Photogramm. Remote Sens. Spat. Inf. Sci.—ISPRS Arch. 2022, 48, 479–486. [Google Scholar] [CrossRef]
- American Viticultural Areas Digitizing Project Team American Viticultural Areas Digitizing Project—Avas.Geojson. 2023. Available online: https://github.com/UCDavisLibrary/ava (accessed on 22 November 2024).
- GBIF Occurrence Download. Available online: https://doi.org/10.15468/dl.r8a9aa (accessed on 20 November 2024).
- Cornes, R.C.; van der Schrier, G.; van den Besselaar, E.; Jones, P.D. An ensemble version of the E-OBS temperature and precipitation data sets. J. Geophys. Res. 2018, 123, 9391–9409. [Google Scholar] [CrossRef]
- Pinto, A.F.; Eshenaur, B.C.; Acevedo, F.E.; Calixto, A.A.; Centinari, M.; Gómez, M.I. Assessing the potential economic impacts of spotted lanternfly (Hemiptera: Fulgoridae) infestations on grape production in New York State. J. Integr. Pest Manag. 2025, 16, 2. [Google Scholar] [CrossRef]
- Koo, K.S.; Oh, J.M.; Park, S.J.; Im, J.Y. Accessing the accuracy of citizen science data based on iNaturalist data. Diversity 2022, 14, 316. [Google Scholar] [CrossRef]
- Capinha, C.; Ceia-Hasse, A.; de-Miguel, S.; Vila-Viçosa, C.; Porto, M.; Jarić, I.; Tiago, P.; Fernández, N.; Valdez, J.; McCallum, I.; et al. Using citizen science data for predicting the timing of ecological phenomena across regions. Bioscience 2024, 74, 383–392. [Google Scholar] [CrossRef]
- Capinha, C.; Monteiro, A.T.; Ceia-Hasse, A. Supporting early detection of biological invasions through short-term spatial forecasts of detectability. NeoBiota 2024, 210, 191–210. [Google Scholar] [CrossRef]
- Uyi, O.; Keller, J.A.; Swackhamer, E.; Hoover, K. Performance and host association of spotted lanternfly (Lycorma delicatula) among common woody ornamentals. Sci. Rep. 2021, 11, 15774. [Google Scholar] [CrossRef] [PubMed]
- Uyi, O.; Keller, J.A.; Johnson, A.; Long, D.; Walsh, B.; Hoover, K. Spotted lanternfly (Hemiptera: Fulgoridae) can complete development and reproduce without access to the preferred host, Ailanthus altissima. Environ. Entomol. 2020, 49, 1185–1190. [Google Scholar] [CrossRef]
- Madalinska, K.; Nielsen, A.L. Effects of host plants on spotted lanternfly (Hemiptera: Fulgoridae) nymphal survival and development. Environ. Entomol. 2024, 53, 480–486. [Google Scholar] [CrossRef]
- Elsensohn, J.E.; Nixon, L.J.; Urban, J.; Jones, S.K.; Leskey, T.C. Survival and development of Lycorma delicatula (Hemiptera: Fulgoridae) on common secondary host plants differ by life stage under controlled conditions. Front. Insect Sci. 2023, 3, 1134070. [Google Scholar] [CrossRef]
- Singh, S.; Smith, C.; Acevedo, F.E. The spotted lanternfly’s ability to reproduce is significantly reduced when fed exclusively on grapevines. Environ. Entomol. 2025, 54, 523–531. [Google Scholar] [CrossRef] [PubMed]
- Elsensohn, J.E.; Nixon, L.J.; Kloos, A.; Leskey, T.C. Development and survivorship of Lycorma delicatula (Hemiptera: Fulgoridae) on cultivated and native Vitis spp. (Vitales: Vitaceae) of the Eastern United States. J. Econ. Entomol. 2023, 116, 2207–2211. [Google Scholar] [CrossRef]
- Mason, C.J.; Walsh, B.; Keller, J.; Couture, J.J.; Calvin, D.; Urban, J.M. Fidelity and timing of spotted lanternfly (Hemiptera: Fulgoridae) attack patterns on ornamental trees in the suburban landscape. Environ. Entomol. 2020, 49, 1427–1436. [Google Scholar] [CrossRef]
- Liu, H. Seasonal development, cumulative growing degree-days, and population density of spotted lanternfly (Hemiptera: Fulgoridae) on selected hosts and substrates. Environ. Entomol. 2020, 49, 1171–1184. [Google Scholar] [CrossRef]
- Canadian Food Inspection Agency RMD–22-03: Pest Risk Management Decision Document: Risk Management for Spotted Lanternfly (Lycorma delicatula White). Available online: https://inspection.canada.ca/en/plant-health/invasive-species/directives/pest-risk-management/rmd-22-03#a4_4 (accessed on 2 June 2025).
- Šajn, N. The EU Wine Sector. 2023. Available online: https://www.europarl.europa.eu/thinktank/en/document/EPRS_BRI(2023)751399 (accessed on 16 May 2025).
- Levine, B.A.; Moffiit, A.; Mendez, R., III. Invasive spotted lanternflies (Lycorma delicatula) are larger in more urban areas. Integr. Comp. Biol. 2025, icaf013. [Google Scholar] [CrossRef] [PubMed]
- Nakashita, A.; Wang, Y.; Lu, S.; Shimada, K.; Tsuchida, T. Ecology and genetic structure of the invasive spotted lanternfly Lycorma delicatula in Japan where its distribution is slowly expanding. Sci. Rep. 2022, 12, 1543. [Google Scholar] [CrossRef] [PubMed]
- Crimmins, T.M.; Gerst, K.L.; Huerta, D.G.; Marsh, R.L.; Posthumus, E.E.; Rosemartin, A.H.; Switzer, J.; Weltzin, J.F.; Coop, L.B.; Dietschler, N.; et al. Short-term forecasts of insect phenology inform pest management. Ann. Entomol. Soc. Am. 2020, 113, 139–148. [Google Scholar] [CrossRef]
- Zhuang, Y.; Bao, K.; Wang, X. Functional response of the native natural enemy of Dryinus sinicus (Hymenoptera: Dryinidae) to different instars of spotted lanternfly (Lycorma delicatula, Hemiptera: Fulgoridae). J. Econ. Entomol. 2025, 118, 1320–1327. [Google Scholar] [CrossRef]
- Gould, J.R.; Losch, C.; Sullivan, L.; Wu, Y.; Wang, X.; Cao, L.; Broadley, H.J. Lifecycle of Anastatus orientalis (Hymenoptera: Eupelmidae) and synchrony with its host, the spotted lanternfly, Lycorma delicatula (Hemiptera: Fulgoridae). Environ. Entomol. 2024, 53, 954–965. [Google Scholar] [CrossRef]
- Kamiyama, M.T.; Takahashi, M.; Broadley, H.J.; Gómez-Marco, F.; Hoddle, M.S.; Matsuura, K. Evaluating the origin and spread of spotted lanternfly (Lycorma delicatula) in Japan. Popul. Ecol. 2024, 67, 162–179. [Google Scholar] [CrossRef]
- Menne, M.J.; Durre, I.; Korzeniewski, B.; McNeill, S.; Thomas, K.; Yin, X.; Anthony, S.; Ray, R.; Vose, R.S.; Gleason, B.E.; et al. Global Historical Climatology Network—Daily (GHCN-Daily), Version 3. NOAA National Climatic Data Center. 2012. Available online: https://doi.org/10.7289/V5D21VHZ (accessed on 17 April 2025).
- Jones, C.M.; Jones, S.; Petrasova, A.; Petras, V.; Gaydos, D.; Skrip, M.M.; Takeuchi, Y.; Bigsby, K.; Meentemeyer, R.K. Iteratively forecasting biological invasions with PoPS and a little help from our friends. Front. Ecol. Environ. 2021, 19, 411–418. [Google Scholar] [CrossRef]
- De Bona, S.; Barringer, L.; Kurtz, P.; Losiewicz, J.; Parra, G.R.; Helmus, M.R. Lydemapr: An R package to track the spread of the invasive spotted lanternfly (Lycorma delicatula, White 1845) (Hemiptera, Fulgoridae) in the United States. NeoBiota 2023, 86, 151–168. [Google Scholar] [CrossRef]
- Cook, R.T.; Ward, S.F.; Liebhold, A.M.; Fei, S. Spatial dynamics of spotted lanternfly, Lycorma delicatula, invasion of the Northeastern United States. NeoBiota 2021, 70, 23–42. [Google Scholar] [CrossRef]
- Strömbom, D.; Sands, A.; Graham, J.M.; Crocker, A.; Cloud, C.; Tulevech, G.; Ward, K. Modeling human activity-related spread of the spotted lanternfly (Lycorma delicatula) in the US. PLoS ONE 2024, 19, e0307754. [Google Scholar] [CrossRef]
- Ladin, Z.S.; Eggen, D.A.; Trammell, T.L.E.; D’Amico, V. Human-mediated dispersal drives the spread of the spotted lanternfly (Lycorma delicatula). Sci. Rep. 2023, 13, 1098. [Google Scholar] [CrossRef] [PubMed]
- Owen, H.L.; Meng, F.; Winchell, K.M. Urbanization and environmental variation drive phenological changes in the spotted lanternfly, Lycorma delicatula (Hemiptera: Fulgoridae). Biol. J. Linn. Soc. 2024, 143, blae099. [Google Scholar] [CrossRef]

| Parameter | Code | Value |
|---|---|---|
| Lower developmental thresholds (°C) | ||
| Eggs | eggLDT | 10 |
| First- and second-instar nymphs | larvaeLDT | 10 |
| Third- and fourth-instar nymphs | pupaeLDT | 10 |
| Adults | adultLDT | 10 |
| Upper developmental thresholds (°C) | ||
| Eggs | eggUDT | 35 |
| Larvae | larvaeUDT | 35 |
| Pupae | pupaeUDT | 35 |
| Adults | adultUDT | 35 |
| Stage durations (°C degree-days) | ||
| Egg | eggDD | 202 |
| Larval (L1–L4) | larvaeDD | 890 |
| Pupal (pre-oviposition adult) | pupDD | 630 |
| Adult (50% oviposition) | adultDD | 146 |
| Phenological events (°C degree-days) | ||
| Egg hatch | OWEventDD | varies |
| Nymphs halfway developed | larvaeEventDD | 442 |
| Appearance of adults | pupaeEventDD | 1 |
| Oviposition | adultEventDD | 1 |
| Diapausing eggs | eggEventDD | 100 |
| Cold stress | ||
| Cold stress temperature threshold (°C) | coldstress_threshold | −16 |
| Cold stress degree-day (°C) limit when most individuals die | coldstress_units_max1 | 300 |
| Cold stress degree-day (°C) limit when all the individuals die | coldstress_units_max2 | 475 |
| Heat stress | ||
| Heat stress temperature threshold (°C) | heatstress_threshold | 37 |
| Heat stress degree-day (°C) limit when most individuals die | heatstress_units_max1 | 115 |
| Heat stress degree-day (°C) limit when all the individuals die | heatstress_units_max2 | 175 |
| Cohorts | ||
| Degree-days (°C) to complete egg development (average) | distro_mean | 190 |
| Degree-days (°C) to complete egg development (variation) | distro_var | 15,000 |
| Minimum degree-days (°C) to complete egg development | xdist1 | 135 |
| Maximum degree-days (°C) to complete egg development | xdist2 | 360 |
| Shape of the distribution | distro_shape | normal |
| Other | ||
| Order of stages | stgorder | OE, L, P, A, E |
| Obligate diapause (1 = TRUE) | obligate_diapause | 1 |
| Degree-day calculation method | calctype | triangle |
| Country | Life Stage | Nobs | Nyears |
|---|---|---|---|
| United States | Egg (OW) | 334 | 6 |
| United States | Early nymph | 2561 | 9 |
| United States | Late nymph | 2065 | 7 |
| United States | Adult | 7806 | 9 |
| United States | Egg (G1) | 161 | 7 |
| China | Early nymph | 4 | 4 |
| China | Late nymph | 10 | 6 |
| China | Adult | 41 | 10 |
| Modeled Event | Observed Event | Nobs | MAE | Bias | SD | Range | Length |
|---|---|---|---|---|---|---|---|
| First egg hatch | First nymphs | 5 | 28 | −28 | 17 | −49 to −6 | 151 |
| First nymphs halfway developed | First appearance of third instars | 5 | 6 | 0 | 8 | −11 to 9 | 65 |
| First appearance of adults | First appearance of adults | 13 | 4 | −3 | 4 | −11 to 3 | 22 |
| First oviposition | First oviposition | 5 | 20 | 3 | 24 | −17 to 37 | 44 |
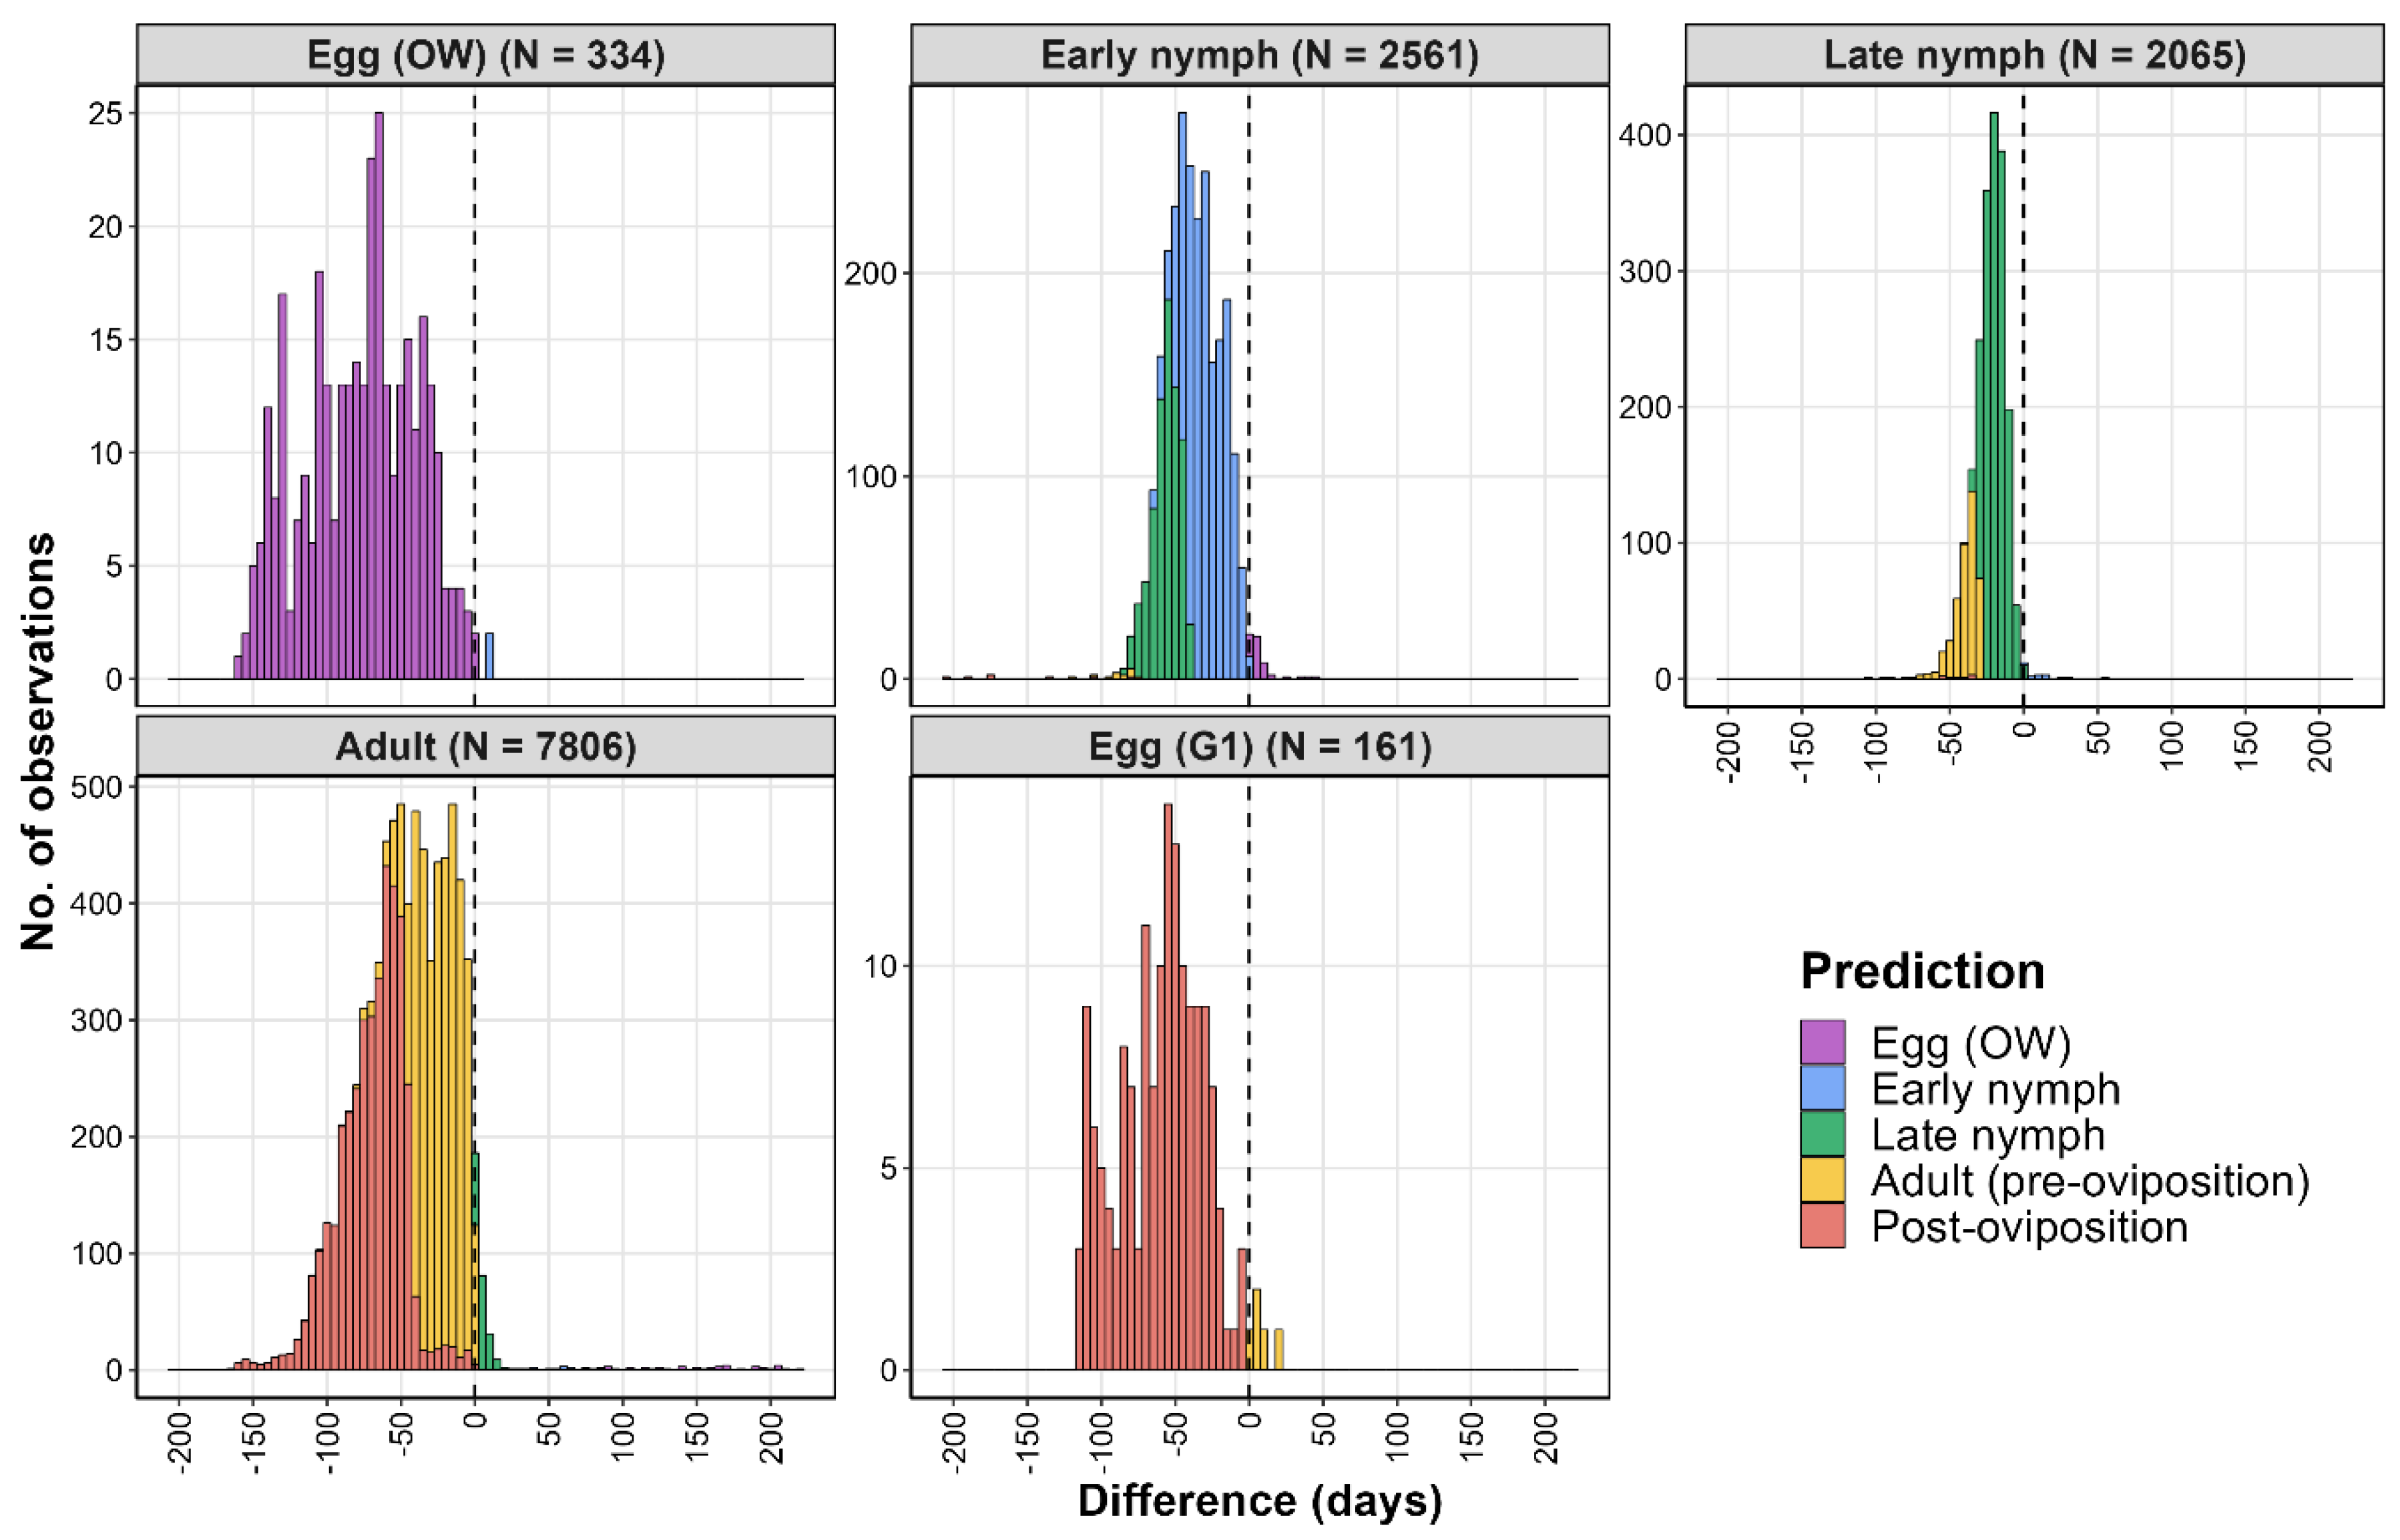
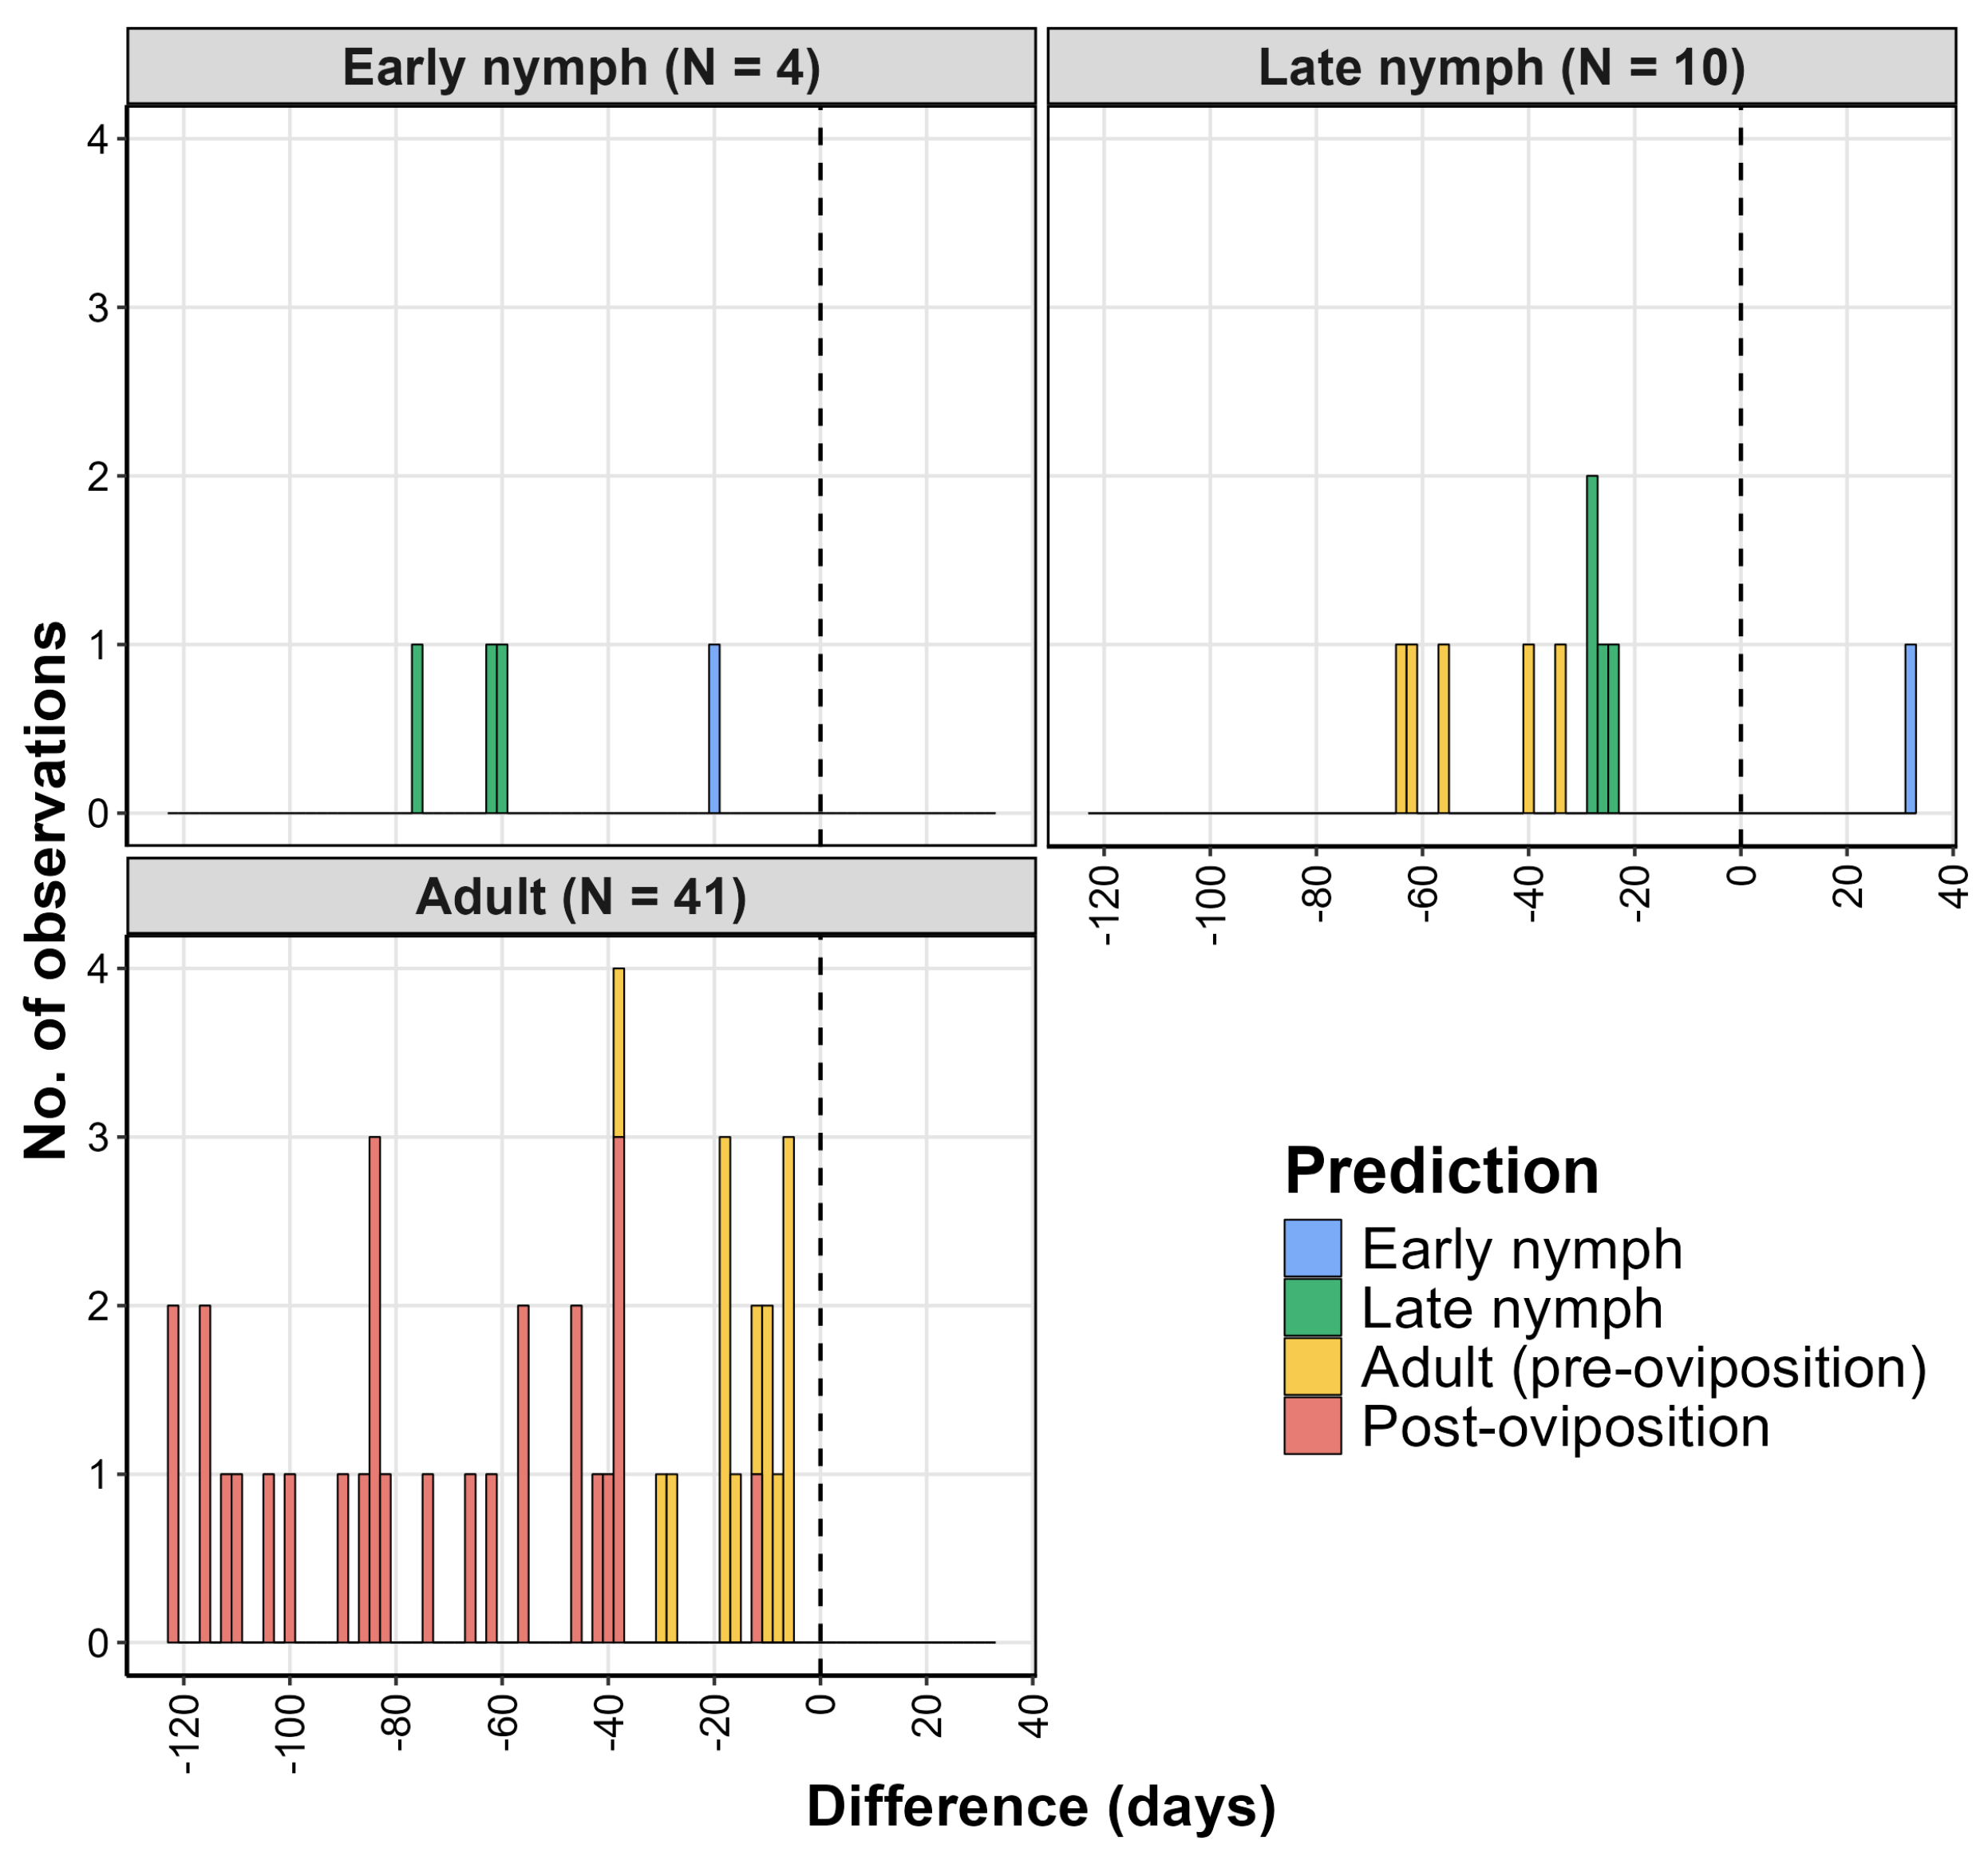
| Region | Observed Event | Nobs | DOYpred | DOYobs | % Observations |
|---|---|---|---|---|---|
| United States | Egg (OW) | 334 | 151 *** | 78 | 99.4 |
| United States | Early nymph | 2561 | 126 *** | 165 | 98.2 |
| United States | Late nymph | 2065 | 176 *** | 198 | 99.4 |
| United States | Adult | 7806 | 206 *** | 255 | 96.9 |
| United States | Egg (G1) | 161 | 250 *** | 308 | 93.1 |
| China | Early nymph | 4 | 110 * | 159 | 100 |
| China | Late nymph | 10 | 156 ** | 189 | 90.0 |
| China | Adult | 41 | 178 *** | 230 | 100 |
Disclaimer/Publisher’s Note: The statements, opinions and data contained in all publications are solely those of the individual author(s) and contributor(s) and not of MDPI and/or the editor(s). MDPI and/or the editor(s) disclaim responsibility for any injury to people or property resulting from any ideas, methods, instructions or products referred to in the content. |
© 2025 by the authors. Licensee MDPI, Basel, Switzerland. This article is an open access article distributed under the terms and conditions of the Creative Commons Attribution (CC BY) license (https://creativecommons.org/licenses/by/4.0/).
Share and Cite
Barker, B.S.; Beyer, J.; Coop, L. Real-Time Integrative Mapping of the Phenology and Climatic Suitability for the Spotted Lanternfly, Lycorma delicatula. Insects 2025, 16, 790. https://doi.org/10.3390/insects16080790
Barker BS, Beyer J, Coop L. Real-Time Integrative Mapping of the Phenology and Climatic Suitability for the Spotted Lanternfly, Lycorma delicatula. Insects. 2025; 16(8):790. https://doi.org/10.3390/insects16080790
Chicago/Turabian StyleBarker, Brittany S., Jules Beyer, and Leonard Coop. 2025. "Real-Time Integrative Mapping of the Phenology and Climatic Suitability for the Spotted Lanternfly, Lycorma delicatula" Insects 16, no. 8: 790. https://doi.org/10.3390/insects16080790
APA StyleBarker, B. S., Beyer, J., & Coop, L. (2025). Real-Time Integrative Mapping of the Phenology and Climatic Suitability for the Spotted Lanternfly, Lycorma delicatula. Insects, 16(8), 790. https://doi.org/10.3390/insects16080790