
Geographic Distribution of Phosphine Resistance and Frequency of Resistance Genes in Two Species of Grain Beetles, Tribolium castaneum and Rhyzopertha dominica, in North America


Simple Summary
Abstract
1. Introduction
2. Materials and Methods
2.1. Insects
2.2. Discriminating Dose Bioassay
2.3. Generating PCR Markers for PH3 Resistant
2.4. Statistical Analyses
3. Results
3.1. Percentages Resistant to PH3 in T. castaneum and R. dominica
3.2. R Allele Frequencies in the Populations of T. castaneum and R. dominica
4. Discussion
Author Contributions
Funding
Data Availability Statement
Acknowledgments
Conflicts of Interest
References
- Champ, B.R.; Dyte, C.E. Report of the FAO global survey of pesticide susceptibility of stored grain pests. In FAO Plant Production and Series; FAO: Rome, Italy, 1976; Volume 5. [Google Scholar]
- Tyler, P.S.; Taylor, R.W.; Rees, D.P. Insect resistance to phosphine fumigation in food warehouses in Bangladesh. Int. Pest Control 1983, 25, 10–13. [Google Scholar]
- Zettler, J.L.; Cuperus, G.W. Pesticide resistance in Tribolium castaneum (Coleoptera: Tenebrionidae) and Rhyzopertha dominica (Coleoptera: Bostrichidae) in wheat. J. Econ. Entomol. 1990, 83, 1677–1681. [Google Scholar] [CrossRef]
- Rajendran, S. Phosphine resistance in stored grain insect pests in India. In Proceedings of the 7th International Working Conference on Stored-Product Protection, Beijing, China, 14–19 October 1998; Jin, Z., Liang, Q., Liang, Y., Tan, X., Guan, L., Eds.; Publishing House of Science and Technology: Chengdu, China, 1999; pp. 635–641. [Google Scholar]
- Cao, Y.; Son, Y.; Sun, G.Y. A survey of psocid species infesting stored grain in China and Resresistance to phosphine in feld populations of Liposcelis entomophila (Enderlein) (Psocoptera: Liposcelididae). In Proceedings of the 8th International Working Conference on Stored Product Protection, York, UK, 22–26 July 2002; Credland, P.F., Armitage, D.M., Bell, C.H., Cogan, P.M., Highley, E., Eds.; CAB International: Wallingford, UK, 2003; pp. 662–667. [Google Scholar]
- Benhalima, H.; Chaudhry, M.Q.; Mills, K.A.; Price, N.R. Phosphine resistance in stored-product insects collected from various grain storage facilities in Morocco. J. Stored Prod. Res. 2004, 40, 241–249. [Google Scholar] [CrossRef]
- Pimentel, M.A.; Faroni, L.R.; Silva, F.H.; Batista, M.D.; Guedes, R.N. Spread of phosphine resistance among Brazilian populations of three species of stored product insects. Neotrop. Entomol. 2010, 39, 101–107. [Google Scholar] [CrossRef] [PubMed]
- Opit, G.P.; Phillips, T.W.; Aikins, M.J.; Hasan, M.M. Phosphine resistance in Tribolium castaneum and Rhyzopertha dominica from Stored Wheat in Oklahoma. J. Econ. Entomol. 2012, 105, 1107–1114. [Google Scholar] [CrossRef] [PubMed]
- Ahmad, A.; Ahmed, M.; Nourullah, A.G.M.; Abbas, M.; Arif, S. Monitoring of resistance against phosphine in stored grain insect pests in Sindh. Middle-East J. Sci. Res. 2013, 16, 1501–1507. [Google Scholar]
- Jittanun, C.; Chongrattanameteekul, W. Phosphine resistance in Thai local strains of Tribolium castaneum (Herbst) and their response to synthetic pheromone. Kasetsart J. Nat. Sci. 2014, 48, 9–16. [Google Scholar]
- Chen, Z.; Schlipalius, D.; Opit, G.; Subramanyam, B.; Phillips, T.W. Diagnostic Molecular Markers for Phosphine Resistance in U.S. Populations of Tribolium castaneum and Rhyzopertha dominica. PLoS ONE 2015, 10, e0121343. [Google Scholar] [CrossRef] [PubMed]
- Koçak, E.; Schlipalius, D.I.; Kaur, R.; Tuck, A.; Ebert, P.R.; Collins, P.J.; Yilmaz, A. Determining phosphine resistance in rust red four beetle, Tribolium castaneum (Herbst.) (Coleoptera: Tenebrionidae) populations from Turkey. Türk Entomol Derg. 2015, 39, 129–136. [Google Scholar] [CrossRef]
- Cato, A.; Elliott, B.; Nayak, M.K.; Phillips, T.W. Geographic variation in phosphine resistance among North American populations of the red flour beetle (Coleoptera: Tenebrionidae). J. Econ. Entomol. 2017, 110, 1359–1365. [Google Scholar] [CrossRef] [PubMed]
- Konemann, C.E.; Hubhachen, Z.; Opit, G.P.; Gautam, S.; Bajracharya, N.S. Phosphine resistance in Cryptolestes ferrugineus (Coleop tera: Laemophloeidae) collected from grain storage facilities in Oklahoma, USA. J. Econ. Entomol. 2017, 110, 1377–1383. [Google Scholar] [CrossRef] [PubMed]
- Afful, E.; Elliott, B.; Nayak, M.K.; Phillips, T.W. Phosphine resistance in North American field populations of the lesser grain borer, Rhyzopertha dominica (Coleoptera: Bostrichidae). J. Econ. Entomol. 2018, 111, 463–469. [Google Scholar] [CrossRef] [PubMed]
- Nayak, M.K.; Daglish, G.J.; Phillips, T.W.; Ebert, P.R. Resistance to the fumigant phosphine and its management in insectpPests of stored products: A global perspective. Annu. Rev. Entomol. 2020, 65, 333–350. [Google Scholar] [CrossRef] [PubMed]
- Collins, P.J.; Daglish, G.J.; Bengston, M.; Lambkin, T.M.; Pavic, H. Genetic resistance to phosphine in Rhyzopertha dominica (Coleoptera: Bostrichidae). J. Econ. Entomol. 2002, 95, 862–869. [Google Scholar] [CrossRef] [PubMed]
- Schlipalius, D.I.; Chen, W.; Collins, P.J.; Nguyen, T.; Reilly, P.E.B.; Ebert, P.R. Gene interactions constrain the course of evolution of phosphine resistance in the lesser grain borer. Rhyzopertha dominica. Heredity. 2008, 100, 506–516. [Google Scholar] [CrossRef] [PubMed]
- Schlipalius, D.I.; Valmas, N.; Tuck, A.G.; Jagadeesan, R.; Ma, L.; Kaur, R.; Goldinger, A.; Anderson, C.; Kuang, K.; Zuryn, K.; et al. A core metabolic enzyme mediates resistance to phosphine gas. Science 2012, 338, 807–810. [Google Scholar] [CrossRef] [PubMed]
- Hubhachen, Z.; Jiang, H.; Schlipalius, D.I.; Park, Y.; Guedes, R.C.; Oppert, B.S.; Opit, G.; Phillips, T.W. A CAPS marker for determination of strong phosphine resistance in Tribolium castaneum from Brazil. J. Pest Sci. 2019, 93, 127–134. [Google Scholar] [CrossRef]
- Jagadeesan, R.; Collins, P.J.; Daglish, G.J.; Ebert, P.E.; Schlipalius, D.I. Phosphine resistance in the rust red flour beetle, Tribolium castaneum (Coleoptera: Tenebrionidae): Inheritance, gene interactions and fitness costs. PLoS ONE 2012, 7, e31582. [Google Scholar] [CrossRef] [PubMed]
- Schlipalius, D.I.; Cheng, Q.; Reilly, P.E.B.; Collins, P.J.; Ebert, P.R. Genetic linkage analysis of the lesser grain borer Rhyzopertha dominica identifies two loci that confer high-level resistance to the fumigant phosphine. Genetics 2002, 161, 773–782. [Google Scholar] [CrossRef] [PubMed]
- Konieczny, A.; Ausubel, F.M. A procedure for mapping Arabidopsis mutations using co-dominant ecotype-specific PCR-based markers. Plant J. 1993, 4, 403–410. [Google Scholar] [CrossRef] [PubMed]
- Food and Agriculture Organization. Recommended methods for the detection and measurement of resistance of agricultural pests to pesticides. Tentative method for adults of some major pest species of stored cereals with methyl bromide and phosphine—FAO method no. 16. FAO Plant Prot. Bulletin. 1975, 23, 12–25. Available online: https://www.fao.org/plant-production-protection/en (accessed on 18 July 2025).
- SAS Institute. SAS User’s Guide, v. 8; SAS Institute: Cary, NC, USA, 2002.
- Daglish, G.J.; Collins, P.J. Improving the relevance of assays for phosphine resistance. In Proceedings of the 7th International Working Conference of Stored Product Protection, Beijing, China, 14–19 October 1998; Zuxun, J., Quan, L., Yongsheng, L., Xianchang, T., Langhua, G., Eds.; Sichuan Publishing House of Science and Technology: Chengdu, China, 1999; pp. 584–593. [Google Scholar]

| Population # | Locality | GPS Coordinates | % Resistance via Bioassay | % R Allele Frequency | |
|---|---|---|---|---|---|
| State/Province | City 1 | (n) | |||
| 1 | CA | Princeton # | N39.24W122.03 | 71 | 10 (21) |
| 2 | CA | Williams # | N39.92W122.86 | 53 | 33 (16) |
| 3 | CA | Colusa # | N39.21W122.01 | 3 | 36 (18) |
| 4 | CA | Parlier-1 # | N36.36W119.31 | 97 | 60 (16) |
| 5 | CA | Parlier-2 # | N36.36W119.31 | 72 | 24 (18) |
| 6 | KS | Manhattan (LabS) | N39.11W96.34 | 0 | 0 (16) |
| 7 | KS | Abilene-1 # | N38.55W97.11 | 93 | 94 (16) |
| 8 | KS | Garden City # | N37.58W97.13 | 74 | 25 (16) |
| 9 | KS | Abilene-2 # | N38.53W97.13 | 90 | 44 (16) |
| 10 | KS | Hudson * | N38.62W98.39 | 65 (12) | |
| 11 | KS | Clifton # | N39.34W97.16 | 80 | 28 (16) |
| 12 | KS | Junction City | N39.15W100.52 | 97 | 100 (16) |
| 13 | KS | Manhattan USDA | N39.11W96.34 | 66 | 87 (16) |
| 14 | KS | Konza * | N39.92W96.35 | 3 (15) | |
| 15 | OK | Stillwater | N36.66W97.33 | 65 | 6 (16) |
| 16 | OK | Garfield $ | N36.26W97.52 | 97 | 69 (16) |
| 17 | OK | Logan $ | N36.34W100.13 | 90 | 78 (16) |
| 18 | TX | Victoria # | N28.48W97.01 | 67 | 44 (16) |
| 19 | TX | Burleson # | N32.32W97.19 | 87 | 56 (16) |
| 20 | AR | Jonesboro | N35.50W90.42 | 79 | 76 (16) |
| 21 | AL | Uniontown # | N32.27W87.31 | 89 | 82 (16) |
| 22 | GA | Tifton | N31.27W83.30 | 0 | 0 (16) |
| 23 | GA | Nashville | N31.12W83.15 | 0 | 0 (16) |
| 24 | FL | Belle Glade # | N26.41W80.40 | 87 | 100 (16) |
| 25 | Alberta | Lethbridge # | N49.41W112.50 | 4 | 0 (18) |
| 26 | Alberta | Stirling # | N49.31W112.31 | 14 | 0 (18) |
| 27 | Saskatchewan | Carnduff # | N49.10W101.47 | 0 | 0 (18) |
| 28 | Saskatchewan | Coronach # | N49.65W105.31 | 19 | 0 (18) |
| Population # | Locality | GPS Coordinates | % Resistance via Bioassay | % R Allele Frequency | |
|---|---|---|---|---|---|
| State/Province | City 1 | (n) | |||
| 1 | CA | Williams # | N.39.09W122.09 | 0 | 0 (18) |
| 2 | CA | Arbuckle # | N39.01W122.03 | 0 | 0 (17) |
| 3 | CA | Davis # | N38.32W121.44 | 0 | 0 (18) |
| 4 | AZ | Arizona | N/A | 0 | 0 (16) |
| 5 | KS | Manhattan (LabS) | N39.11W96.34 | 0 # | 0 (16) |
| 6 | KS | Washington # | N39.50W97.03 | 15 | 0 (16) |
| 7 | KS | Minneapolis # | N39.07W97.42 | 93 | 83 (16) |
| 8 | KS | Mitchel | N38.23W98.06 | 95 | 47 (16) |
| 9 | KS | Russell | N38.53W98.50 | 45 | 29 (16) |
| 10 | KS | McPherson | N38.22W97.40 | 47 | 30 (16) |
| 11 | KS | Abilene-1 # | N38.55W97.11 | 41 | 4 (16) |
| 12 | KS | Abilene-2 | N38.53W97.13 | 52 | 15 (16) |
| 13 | KS | Manhattan USDA # | N39.11W96.34 | 15 | 16 (16) |
| 14 | OK | Garfield $ | N36.26W97.52 | 90 | 50 (16) |
| 15 | OK | Logan $ | N36.34W100.13 | 93 | 31 (16) |
| 16 | OK | Stillwater $ | N36.66W97.33 | 18 | 0 (16) |
| 17 | OK | Miami | N36.52W94.52 | 0 | 0 (16) |
| 18 | TX | Victoria # | N28.48W97.01 | 2 | 0 (18) |
| 19 | IL | Chicago | N41.51W87.39 | 0 | 0 (16) |
| 20 | MO | Excelsior Springs # | N39.20W94.13 | 0 | 0 (18) |
| 21 | AR | Jonesboro # | N35.50W90.42 | 20 | 6 (16) |
| 22 | AL | Centre | N34.10W85.40 | 0 | 3 (16) |
| 23 | AL | Pratville * | N32.28W86.27 | 16 (16) | |
| 24 | AL | Uniontown # | N32.27W87.31 | 31 | 17 (14) |
| 25 | AL | Red Level # | N31.18W86.30 | 100 | 100 (16) |
| 26 | AL | Ozark # | N31.27W85.38 | 98 | 93 (16) |
| 27 | KY | HI KY | N/A | 0 | 0 (16) |
| 28 | GA | Nashville # | N31.12W83.15 | 22 | 36 (22) |
| 29 | GA | Tifton # | N31.27W83.30 | 0 | 0 (16) |
| 30 | FL | Walnut Hill # | N30.54W87.30 | 88 | 47(17) |
| 31 | Alberta | Calgary # | N51.2W114.03 | 0 | 0 (16) |
| 32 | Saskatchewan | Saskatoon # | N52.8W106.40 | 0 | 0 (16) |
| 33 | Manitoba | Winnipeg # | N49.54W97.08 | 0 | 0 (16) |
| 34 | Quebec | St. Agathe # | N46.23W71.24 | 0 | 0 (16) |
| Species | Variables | Equation | R2 | F-Statistic | p-Value |
|---|---|---|---|---|---|
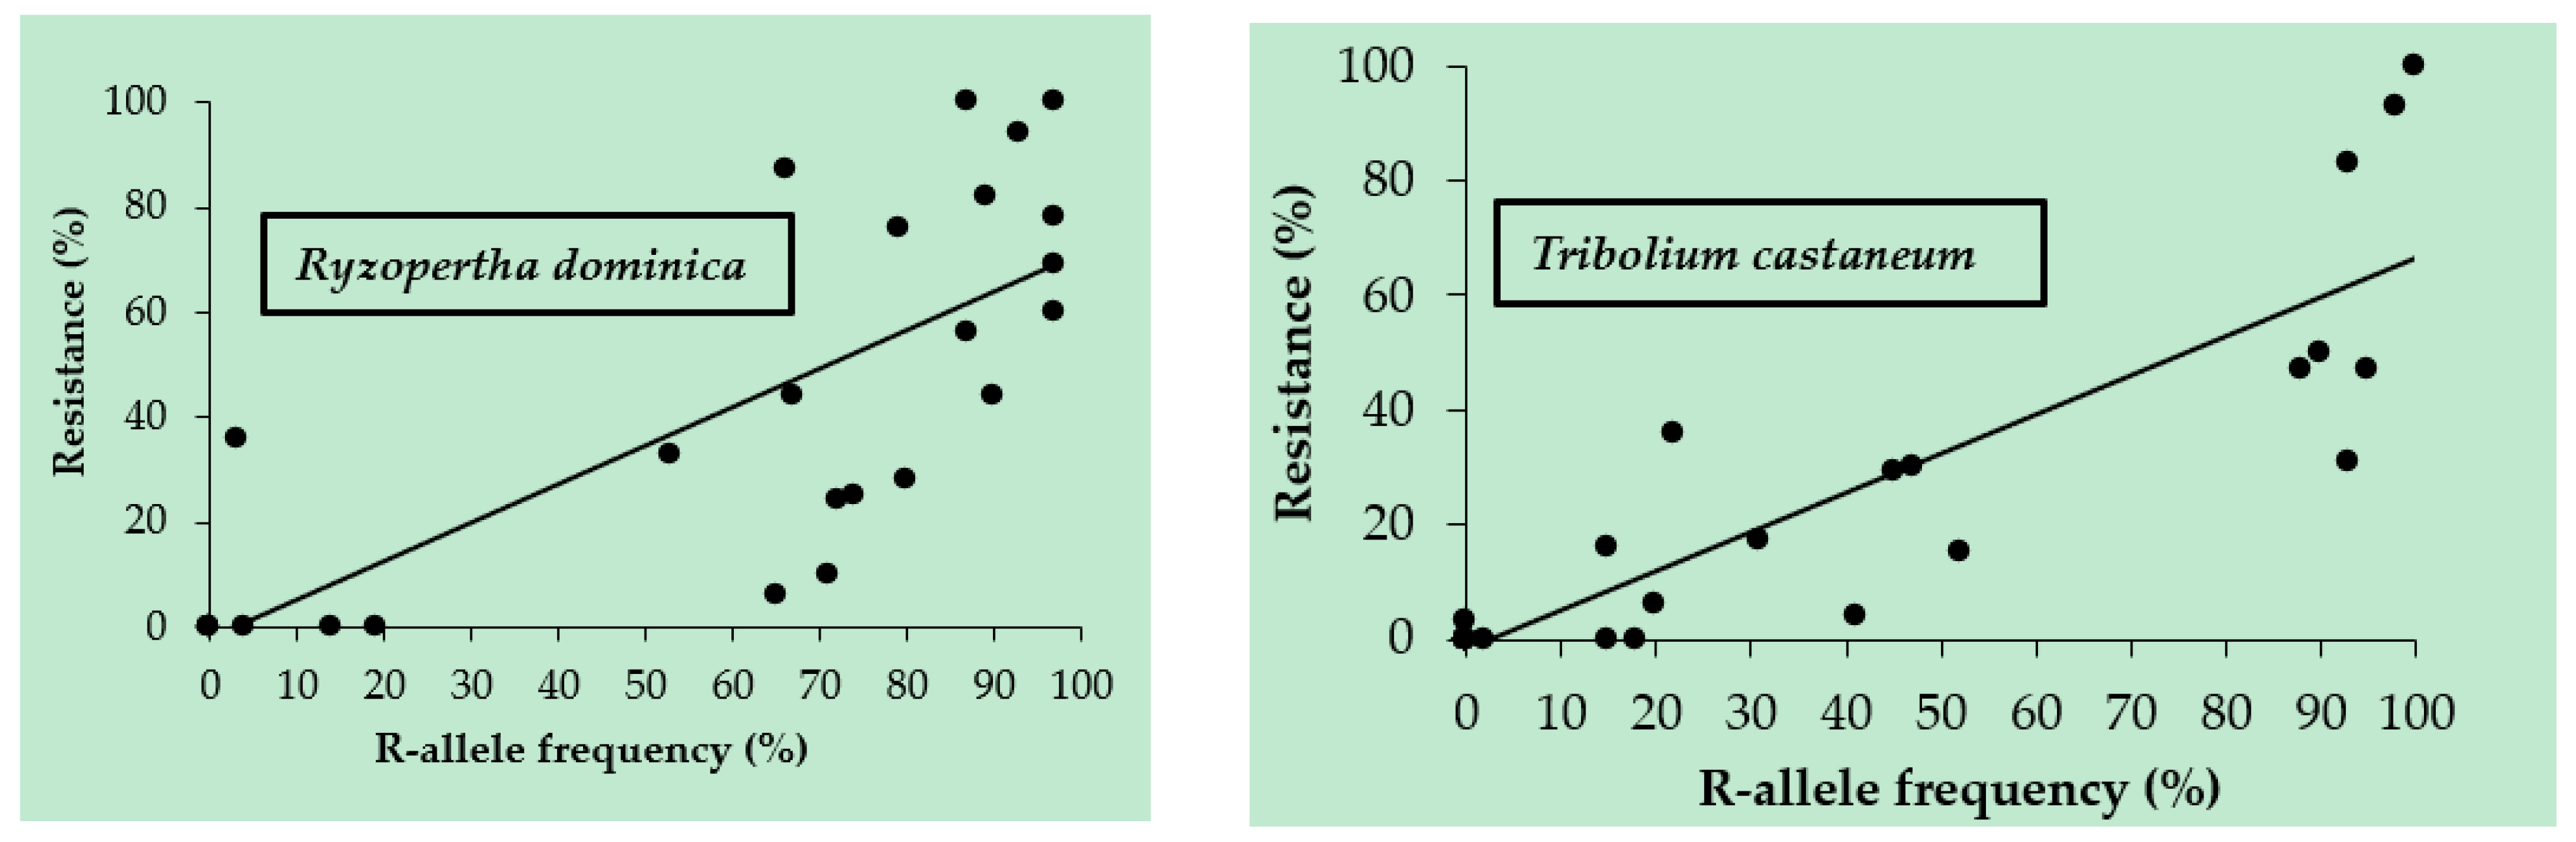
| R. dominica | % resistance vs. R-allele frequency | y = 0.7329x – 1.85 | 0.592 | 0.810044 | <0.001 |
| R-allele frequency vs. Latitude | y = −2.6476x + 140.82 | 0.203 | 5.15863 × 10⁻¹³ | 0.361 | |
| R-allele frequency vs. Longitude | y = −0.9637x + 138.86 | 0.121 | 2.68436 × 10⁻⁶ | <0.001 | |
| R-allele frequency vs. Latitude × Longitude | y = −0.0169x + 107.85 | 0.205 | 1.49053 × 10⁻²⁸ | <0.001 | |
| T. castaneum | % resistance vs. R-allele frequency | y = 0.6798x − 1.53 | 0.787 | 0.143403 | <0.001 |
| R-allele frequency vs. Latitude | y = −1.8806x + 91.10 | 0.147 | 3.26431 ×10⁻⁹ | 0.002 | |
| R-allele frequency vs. Longitude | y = −0.6448x + 82.00 | 0.068 | 3.60977 × 10⁻⁶ | <0.001 | |
| R-allele frequency vs. Latitude × Longitude | y = −0.0129x + 67.23 | 0.146 | 2.48567 × 10−41 | <0.001 |
Disclaimer/Publisher’s Note: The statements, opinions and data contained in all publications are solely those of the individual author(s) and contributor(s) and not of MDPI and/or the editor(s). MDPI and/or the editor(s) disclaim responsibility for any injury to people or property resulting from any ideas, methods, instructions or products referred to in the content. |
© 2025 by the authors. Licensee MDPI, Basel, Switzerland. This article is an open access article distributed under the terms and conditions of the Creative Commons Attribution (CC BY) license (https://creativecommons.org/licenses/by/4.0/).
Share and Cite
Hubhachen, Z.; Cato, A.; Afful, E.; Nayak, M.; Phillips, T.W. Geographic Distribution of Phosphine Resistance and Frequency of Resistance Genes in Two Species of Grain Beetles, Tribolium castaneum and Rhyzopertha dominica, in North America. Insects 2025, 16, 749. https://doi.org/10.3390/insects16080749
Hubhachen Z, Cato A, Afful E, Nayak M, Phillips TW. Geographic Distribution of Phosphine Resistance and Frequency of Resistance Genes in Two Species of Grain Beetles, Tribolium castaneum and Rhyzopertha dominica, in North America. Insects. 2025; 16(8):749. https://doi.org/10.3390/insects16080749
Chicago/Turabian StyleHubhachen, Zhaorigetu, Aaron Cato, Edwin Afful, Manoj Nayak, and Thomas W. Phillips. 2025. "Geographic Distribution of Phosphine Resistance and Frequency of Resistance Genes in Two Species of Grain Beetles, Tribolium castaneum and Rhyzopertha dominica, in North America" Insects 16, no. 8: 749. https://doi.org/10.3390/insects16080749
APA StyleHubhachen, Z., Cato, A., Afful, E., Nayak, M., & Phillips, T. W. (2025). Geographic Distribution of Phosphine Resistance and Frequency of Resistance Genes in Two Species of Grain Beetles, Tribolium castaneum and Rhyzopertha dominica, in North America. Insects, 16(8), 749. https://doi.org/10.3390/insects16080749