Simple Summary
Mosquitoes have an exquisite olfactory system, with which they locate bloodmeal hosts, nectar sources, and sites for egg-laying. Elucidating the mechanisms that underlie the perception of and response to chemicals in the environment is crucial for our understanding of the biology of mosquitoes that are vectors of many deadly pathogens. Olfaction is primarily mediated by large families of odorant receptors and ionotropic receptors, collectively encoding more than 200 tuning receptors, each of which recognizes one or more volatile odorants. As ligand-gated ion channels, tuning receptors of each family form complexes with the odorant receptor co-receptor (Orco), or one of few ionotropic receptor co-receptors (Irco), respectively. In this study, we evaluated the hypothesis that co-receptors are necessary for tuning receptor expression. To this end, we compared antennal transcriptomes of wildtype adult female Aedes aegypti with Orco−/− and Ir8a−/− mutant strains. We show that the tuning receptor transcripts in the antennae are broadly dysregulated in both mutants. We discuss two possible explanations for these observations and suggest ways this knowledge can be applied to vector control strategies.
Abstract
Olfaction has been extensively studied in the yellow fever mosquito, Aedes aegypti. This species uses its sense of smell to find blood hosts and other resources, contributing to its impact as a vector for human pathogens. Two major families of protein-coding genes, the odorant receptors (Ors) and the ionotropic receptors (Irs), provide the mosquito with sensitivities to distinct classes of volatile compounds in the antennae. Individual tuning receptors in both families require co-receptors for functionality: Orco for all Ors, and Ir8a for many Irs, especially ones that are involved in carboxylic acid detection. In Drosophila melanogaster, disruptions of Orco or Ir8a impair receptor function, tuning receptor expression, and membrane localization, leading to general anosmia. We reasoned that Orco and Ir8a might also be important for coordinated chemosensory receptor expression in the antennal sensory neurons of Ae. aegypti. To test this, we performed RNAseq and differential expression analysis in wildtype versus Orco−/− and Ir8a−/− mutant adult female antennae. Our analyses revealed Or and Ir tuning receptors are broadly under-expressed in Orco−/− mutants, while a subset of tuning Irs are under-expressed in Ir8a mutants. Other chemosensory and non-chemosensory genes are also dysregulated in these mutants. Furthermore, we identify differentially expressed transcription factors including homologs of the Drosophila melanogaster Mip120 gene. These data suggest a previously unknown pleiotropic role for the Orco and Ir8a co-receptors in the coordination of expression of chemosensory receptors within the antennae of Ae. aegypti by participating in a feedback loop involving amos and members of the MMB/dREAM complex.
1. Introduction
Our understanding of fly behavior, physiology, and olfaction has been largely influenced by studies of the genetic model, Drosophila melanogaster, with more recent contributions in the disease vector, Aedes aegypti [1,2,3,4,5,6,7]. Ae. aegypti is primarily responsible for the spread of arboviruses such as Dengue, yellow fever, Chikungunya, and Zika [8]. Dengue fever alone accounted for an estimated 6.5 million cases, with more than 7300 deaths globally in 2023 [9,10]. These mosquitoes spread pathogens via hematophagous behavior, and they locate their blood hosts predominantly via olfaction [11,12,13]. Therefore, understanding mosquito olfaction not only answers questions about the basic biology of insects but also informs vector surveillance and control strategies that target host-seeking behavior.
Mosquitoes detect semiochemicals in their environment via an elegant olfactory system [13]. Though the antennae are the major olfactory organs, the maxillary palp, labellum, and tarsi also contribute to olfaction [14]. On the surface of each olfactory organ are hairlike sensilla, each of which contains one or more dendrites of olfactory sensory neurons (OSNs) [2]. These neurons characteristically express odorant receptors (Ors) or ionotropic receptors (Irs), the two major chemosensory receptor families involved in olfaction. Recent analysis has demonstrated co-expression of these classes of chemoreceptors [2]. Gustatory receptors (Grs) are a different class of chemosensory receptor that are involved in taste and carbon dioxide detection [15,16,17]. These three chemoreceptor classes are used in coordination by the insect to detect semiochemicals and thus locate resources in their niche environments, including potential blood hosts [18,19].
Ors were the first insect chemoreceptor genes to be discovered and have been extensively studied [2,5,20,21]. Irs were discovered more recently but appear to be the more ancient gene family as they are found in the genomes of protostomes [20,21,22]. Not only are these two classes of receptors understood to be distinct in their evolutionary lineages, but they are also expressed in different types of sensilla and respond to different classes of volatile compounds [23]. Ors typically respond to floral odors including indoles and alcohols, among others [24], while Irs respond predominantly to aldehydes, carboxylic acids, amines, and ketones [25,26,27,28,29]. For this reason, Ors have been implicated in mosquitoes as mediating behaviors such as nectar feeding, while Irs are considered responsible for mediating host-seeking and oviposition behaviors [24,25,30].
Ors and Irs each comprise ligand-gated ion channels, where the cognate volatile compound binds to the receptor and opens the channel [31,32]. For each chemoreceptor family, one or more co-receptors cooperates with a tuning receptor to form a functional ion channel [29]. Stoichiometrically, three odorant receptor co-receptor (Orco) polypeptide subunits form a complex with a single tuning receptor (Orx) [31,32]. The tuning receptors contribute to the specificity of the ligand-gated ion channel by binding to cognate ligands [24,33]. In contrast, co-receptors for the Irs include Ir8a, Ir25a, Ir76b, and Ir93a [34,35]. These co-receptors function in a similar way to Orco, where the Ir co-receptor must be present in complex with a tuning receptor to form a functional channel, although their exact stoichiometry remains unresolved [23]. Ir8a seems to be required for the formation of carboxylic acid-sensitive ion channels that are activated by acetic, lactic, and nonanoic acids [6,27,29].
In D. melanogaster and Ae. aegypti, several studies have demonstrated behavioral deficits in flies lacking the Orco or Ir8a co-receptors [6,27,36,37,38]. In Orco mutants, Or tuning receptor trafficking from the endoplasmic reticulum to the dendrite surface was impaired [36,39]. Thus, Orco may coordinate the subcellular localization of tuning Ors. Similarly, in an Ir8a mutant, expression of the Ir64a tuning receptor was absent in the sensilla of the antennal sacculus. Instead, low levels of the protein were found in the ER [38]. Notably, not only was transport of Ir64a affected in the Ir8a mutant, but the overall abundance of Ir64a in the antennae was significantly reduced [38]. Another study indicated that some but not all tuning receptor localization to the cilia was disrupted in an Ir8a mutant [40]. Odorant receptor neuron degeneration has also been observed in the maxillary palps of Orco mutants [41,42,43]. Furthermore, a recent study demonstrated that knockouts of Orco and Ir8a in D. melanogaster lead to disrupted transcription of chemoreceptors, including Ors and Irs [44].
In D. melanogaster, transcription factors and cis-regulatory elements determine Or expression in OSNs, whereas Or expression in mouse OSNs is more stochastic [45,46,47]. Several transcription factors are known to regulate the expression of Ors. For example, in D. melanogaster, RNAi-mediated knockdown of seven unique transcription factors, (acj6, E93, Fer1, onecut, sim, xbp1, and zf30c) significantly influenced the expression or repression of 30 Or genes, with acj6 and xbp1 potentially playing larger roles due to their broad expression in all sensillar OSN classes [48,49]. Furthermore, HOX and POU motif binding proteins are an integral part of the pathway regulating OSN class-specific Or59b expression in Drosophila, which allows binding of transcription factors like Fer1, acj6, or pdm3, the latter of which was previously found to regulate Or expression in a specific class of OSNs in the maxillary palps [50,51]. Motif clustering seems to drive expression of Or59b, with differing ratios of acj6 and Pdm3 modulating Or59b expression, which is limited to two OSN classes [50]. This information was used to assemble a mathematical framework to correctly predict RNA polymerase interactions with transcription factors based on altered chromatin states [52]. Repression-specific transcription factors like Scalloped also mediate expression of Or59c [53]. In contrast to Ors, transcriptional regulation of Irs in D. melanogaster is not as well understood, and is largely unexplored in Ae. aegypti [22]. Transcription factor E93, which was implicated in Or regulation, was shown to promote expression of Ir75a and Ir75b, while suppressing Ir75c in D. melanogaster [54]. The same study demonstrated that Pdm3 represses Ir75b [54].
Genetic disruptions of Orco and Ir8a in Ae. aegypti lead to broad deficits in volatile odor detection, especially for distinct classes of chemical compounds [27,37]. Given our understanding of chemoreceptor gene regulation in D. melanogaster, we hypothesized that Orco−/− or Ir8a−/− disruptions in Ae. aegypti might also lead to reduced expression of tuning receptors in the antennae compared to the wildtype, resulting from dysregulated transcription, a neurodegenerative process, or a combination of the two. To test this prediction, we analyzed the antennal transcriptomes of Ae. aegypti Orco−16 and Ir8adsRED/dsRED mutant strains [27,37] and compared them to the background wildtype Orlando strain.
2. Materials and Methods
2.1. Knockout Strains
The Orco−/− mutant was produced via zinc finger mutagenesis [37]. The mutant has a 16 base pair deletion in the first exon, a frameshift mutation leading to premature stop codons, and a phenotype of general anosmia [37]. The Ir8a−/− strain was produced via CRISPR/Cas9 mutagenesis and displays a phenotype of reduced ability to detect carboxylic acids and reduced host-seeking behavior [27]. The Ir8a−/− strain contains a knock-in cassette in the second exon, with a polyubiquitin promoter upstream of the dsRED fluorescent gene, leading to the production of dsRED in all tissues of the body [27]. Primers were designed to confirm that the cassette was inserted into the second exon of the Ir8a gene in the Ir8a−/− strain. One set of primers was designed to anneal to regions flanking the dsRED insertion site and to amplify a 238 bp region in the wildtype strain: forward primer (5′-GTTCATGAACGTGAACAACCGG-3′) and reverse primer (5′-CGCTGACTCCTCGATTCAATG-3′). When the cassette is present in the mutant strain, the distance between these primers is 2.64 kb. An alternative reverse primer (5′-CCTACCCTTCGTGTATATGGC-3′) was designed to be used with the exon 2 forward primer, and to anneal to the polyubiquitin promoter contained within the dsRED cassette, amplifying a 439bp region in the Ir8a−/− mutant. Pooled genomic DNA was extracted from the carcasses of Orlando and Ir8a−/− mosquitoes (n = 16 per strain) using the DNeasy Blood and Tissue Kit (Qiagen, Germantown, MD, USA). Separate PCR reactions were performed using the flanking primers and the dsRED cassette-specific primers for each strain. PCR was carried out using the following parameters: 1—Initial denaturation (95 °C, 2 min); 2—denaturation (95 °C, 15 s); 3—annealing (56 °C, 15 s); 4—extension (72 °C, 31 s); 5—cycling (steps 2–4, 35×); 6—final elongation (72 °C, 5 min). The PCR products were analyzed by electrophoresis on a 1% agarose gel, stained with GelRed, and visualized with the Gel Doc EZ Gel Documentation System (BioRad, Hercules, CA, USA).
2.2. Mosquitoes
Mosquitoes were reared under controlled conditions (12:12 LD, 27 °C, 70% RH, 10% sucrose ad libitum), with all strains kept in the same incubator. Eggs were hatched in distilled water (diH2O) under vacuum for approximately 1–3 h. Larvae were reared in clean diH2O and were fed a mixture of ground koi fish-food mixed with baker’s yeast ad libitum. Larval pan water was filtered regularly to limit the growth of fungus or bacteria. Pupae were separated from larvae and placed into a cup of distilled H2O inside a mesh cage (BugDorm-1; MegaView Sci. Co., Ltd., Taichung, Taiwan). Adults were allowed to eclose for two days before pupae cups were moved to a new BugDorm, ensuring all adults had eclosed within a two-day window. Each enclosure contained between 200 and 400 adults of both sexes. Adults were allowed to mature and feed ad libitum on 10% sucrose until all mosquitoes were 5 to 7 days post eclosion (DPE). Male and female adults were not separated after eclosion; therefore, we assume that females were mated.
2.3. Antennal Dissections
At ZT = 0, the entire cage of mosquitoes was brought to −20 °C for approximately 1 h, to ensure that all mosquitoes were killed. All surfaces were treated with RNase-away (Thermo Scientific, Waltham, MA, USA) before dissections. Adult females were then transferred to a chilling table at −4 °C, and antennae were dissected directly into 500 µL of TRIzol reagent (Invitrogen, Waltham, MA, USA) on ice in a 1.5 mL RNase-free microcentrifuge tube. Using surgical forceps, both antennae were resected such that the Johnston’s organ and all thirteen segments of antennae were collected. Each biological replicate consisted of a cage of mosquitoes that were reared to adulthood starting from a separate larval pan. Six replicates were collected for Orlando, four for Orco−/−, and five for Ir8a−/−. Each sample contained between 100 and 250 pairs of antennae. The tissue was stored at −20 °C prior to RNA extraction.
2.4. RNA Extractions
RNA was extracted according to the phenol/chloroform extraction method, using TRIzol reagent and substituting 1-bromo-3-chloropropane for chloroform [55]. The tissue was disrupted via repeated cycles of flash freezing and mechanical disruption with an RNase-free pestle. Another 500 μL TRIzol reagent was then mixed into each tube. After a 5 min incubation at room temperature, 200 μL of 1-bromo-3-chloropropane was added. The mixture was vortexed vigorously, followed by a 15 min incubation at room temperature and subsequent centrifugation at 12,000 rcf for 15 min at 4 °C. The aqueous phase was then carefully pipetted into a new RNase-free tube, and an equal volume of 100% isopropanol and 3.0 μL of glycogen (5 mg/mL; Ambion, Austin, TX, USA) were added. The samples were stored at −20 °C overnight, after which they were centrifuged at 12,000 rcf for 15 min at 4 °C. The liquid was carefully removed via pipetting without disturbing the pellet of RNA. The pellet was washed with ice-cold 70% ethanol, followed by centrifugation at 7500 rcf for 10 min at 4 °C. The ethanol was carefully removed via pipetting, without disturbing the pellet, and allowed to dry at room temperature in a biosafety cabinet for ~5 min. The pellet was resuspended in 30 µL of RNase-free H2O, passed through an RNAase-free MicroBiospin-30 column (BioRad, Hercules, CA, USA), and subjected to SpeedVac (ThermoFisher, Waltham, MA, USA) evaporation of residual ethanol for 5 min. RNA was quantified via NanoDrop (ThermoFisher, Waltham, MA, USA) and then stored at −80 °C. The first samples (Orlando, Orco, and Ir8a samples 1 and 2) were treated with DNaseI during library preparation, leading to low RNA yield. The remaining samples were treated with DNaseI using the Monarch Total RNA Miniprep Kit (NEB #T2010) according to the manufacturer’s instructions (New England Biolabs, Ipswich, MA, USA). Following DNaseI treatment, samples were again stored at −80 °C until they were sent for RNAseq.
2.5. RNAseq
RNAseq was outsourced to Psomagen, Inc. (Rockville, MD, USA). Briefly, samples were preserved in 30 µL of 10 mM Tris. Sample concentration and purity were assessed in a Bioanalyzer (Agilent, Santa Clara, CA, USA). The mRNA library was constructed using the Truseq stranded mRNA library prep kit (Illumina, San Diego, CA, USA). RNA was fragmented for paired-end sequencing (150 bp). Sequencing was conducted on the NovaSeq X Plus (Illumina, San Diego, CA, USA) sequencing system at 40× coverage. Samples were delivered via an FTP link for download and analysis. Raw reads were submitted the NCBI Sequence Read Archive (SRA) under the accession number PRJNA1249520.
2.6. Data Analysis
2.6.1. RNAseq Data Preparation
Raw reads were processed by Trimmomatic to remove the Illumina Universal Adapter and filter out reads with an average quality of <30 across 4 bases using the sliding window trimming approach [56,57]. Trimming and filtering were confirmed via FastQC [58]. A separate annotated transcriptome was constructed for each mutant organism (Supplementary Files S8 and S9), with appropriate mutations in the Orco or Ir8a genes representing alterations in the mutant animals. Salmon was used to perform a pseudoalignment of forward and reverse reads for each sample to the annotated transcriptomes [59]. TxImport was used to transform the output from Salmon into count data and compile it into a matrix for DESeq2 analysis [60]. DESeq2 was performed comparing all three strains to each other, and subsequently, comparisons were made between each mutant strain and Orlando [61,62]. TxImport and DESeq2 were performed in R (4.4.2), and scripts were written with the help of ChatGPT (-4o/-4o mini, OpenAI, San Francisco, CA, USA). All R scripts are provided in the Supplementary File S10. The workflow for RNAseq processing and analysis is shown in Figure 1.
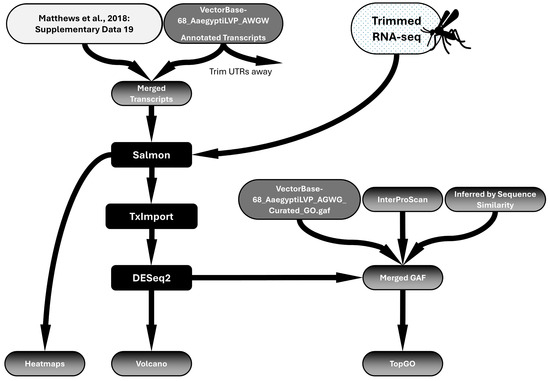
Figure 1.
Workflow of RNAseq differential expression analysis. A transcriptome, updated to include chemoreceptor annotations, was constructed by merging the publicly available annotated transcriptome (VectorBase) with the supplementary file provided in Matthews et al. (2018) [19] entitled “Supplementary Data 19—Figure 2—ChemoreceptorCodingSequences.fasta”. An updated GAF file was also constructed by adding chemoreceptor GAF annotations (from InterProScan and Sequence Similarity Inference) to the publicly available VectorBase GAF file. Salmon pseudoalignment was performed to align trimmed reads to the transcriptome. TxImport and DESeq2 analysis were performed to identify differentially expressed genes. Heatmaps, volcano plots, and TopGO anlysis were performed to visualize data.
2.6.2. Annotation Files Preparation
The most recent annotation of the Ae. aegypti chemoreceptor gene families was published in 2018 [19]. Since these updated receptors are not found in the L5 genome assembly, we compiled a new file to include them. The GFF file describing chemoreceptor genes [19] was compared to publicly available VectorBase file using GFFCompare [63]. This tool provided a mapping file, which identified 203 chemoreceptor genes that were common to both GFFs. A total of 3 additional chemosensory genes present in the VectorBase GFF, which were not discovered via GFFCompare were also included. In total, 206 unique chemosensory genes, including all isoforms, were identified by this process (Supplementary File S1). To ensure uniformity, UTRs were trimmed using a custom python (3.12) script (Supplementary File S2) from all transcripts (Figure 1). Ae. aegypti cDNA, 5′UTRs, and 3′UTRs were all extracted using Ensemble Metazoa BioMart. These files were placed into the working directory with the .py script, and a trimmed transcriptome was produced. In addition to generating a new GFF file to include the updated chemoreceptor annotations [19], a new GAF file (Supplementary File S3) and annotated transcripts file (Supplementary File S4) were also produced, utilizing the same process used to create the GFF file. Because Gene IDs were not assigned novel chemosensory genes in the new annotation [19], Vectorbase IDs were replaced with gene descriptions. Therefore, all R scripts to utilize these files call chemosensory genes by their gene descriptors.
GO terms were assigned automatically to chemosensory genes in the GAF file first by providing peptide sequences to the InterProScan tool (5.72-103.0) [64]. However, InterProScan did not assign GO terms to all the new genes. Subsequently, Clustal Omega (1.2.4) was used to align peptide sequences and produce a phylogenetic tree rooted to alpha tubulin for each chemosensory receptor class (Supplementary Files S5–S7). Genes without GO terms were assigned by sequence similarity based on the closest neighbor in each phylogenetic tree (Figure 1). The GAF file was used in subsequent TopGO analysis.
2.6.3. RNAseq Analysis
Scripts for RNAseq analysis were written in R (4.4.2) with the aid of ChatGPT (-4o/-4o mini). RNAseq data was not provided to ChatGPT, and the AI system was only used to create and modify scripts, which are provided in the supplemental data. Code was developed to (1) generate heatmaps of the various chemosensory genes to compare transcript abundance across strains, (2) make Venn diagrams to summarize significant differences across strains in DESeq2 analysis, (3) make volcano plots with chemosensory genes and transcription factors (TFs) highlighted, and (4) perform TopGO analysis of the differentially expressed genes (DEGs) to identify enriched gene ontology terms that were over-expressed or under-expressed in each mutant strain. All R scripts are included in Supplementary File S10.
Visualization of the transcript abundance of chemosensory genes was created by plotting the Log10 (avgTPM + 1) of each transcript. For visualization in the heatmap, genes with lower expression in all strains were filtered to highlight transcripts that may be biologically relevant in the antennal transcriptome. This clearly shows the expression of chemosensory genes in the Ae. aegypti antennae and allows for direct comparisons across strains.
Volcano plots were constructed using the results from DESeq2 at the gene level, and extreme log2 fold change values (absolute value > 20) were excluded after they were identified as outliers (high variability within strains, with 0 read count in multiple samples leading to inflated log2 fold change values).
2.7. Transcription Factor Analysis
To identify regulatory genes that may coordinate with the co-receptors to promote chemoreceptor expression, we queried the DESeq2 dataset to identify transcription factors (TFs) and chromatin remodelers that were differentially expressed. First, a list of 1131 Ae. aegypti transcription factors was obtained from the CIS-BP Database, Ensembl Metazoa BioMart, and from a literature search for TFs associated with chemosensory regulation and development [65,66,67,68,69,70,71]. Members from this list were examined to identify TFs that were differentially expressed. The threshold for differential expression was the same as above, with a Log2FoldChange > |1| and a p-Adj < 0.05.
Two homologs for D. melanogaster Mip120 were differentially expressed in opposite directions. These included AAEL020020 and AAEL005893. Sequence alignments showed 33 SNPs in the coding regions, and large differences in the intronic regions. Because AAEL005893 was not mapped to a chromosome, we considered the possibility that there was only one gene in reality, and that AAEL005893 was simply an artifact found in the unmapped scaffold. To test for the presence of two genes, primers were designed such that one primer annealed to an exonic region with no variability, while two gene-specific primers were designed to map to variable intronic regions. Two such pairs of primers were constructed. Primer sequences were as follows: Mip120_Fwd1—5′-CAAACAATG GAGGAGCTTGG-3′; AAEL005893_intron_Rev1—5′-TTGTCCAATACTGTAGGTCC-3′; AAEL020020_intron_Rev1—5′-GCTACGAGGGGAAGTGTAAA-3′; AAEL020020_intron_Fwd2—5′-CCTTCCTAGTCAAGTCTTTATG-3′; AAEL005893_intron_Fwd2—5′-CGTCTAATCTGATCTGAATCTC-3′; Mip120_Rev2—5′-GCTCGAACGAAATTTGCTGG-3′. PCR was carried out using the following parameters. 1—Initial denaturation (95 °C, 2 min); 2—denaturation (95 °C, 15 s); 3—annealing (56 °C—15 s); 4—extension (72 °C, 20 s); 5—cycling (steps 2–4, 35×); 6—final elongation (72 °C—5 min). The PCR products were run on a 1% agarose gel and visualized with the Gel Doc EZ Gel Documentation System (BioRad, Hercules, CA, USA).
Additionally, a Bowtie2 [72] alignment was performed to align RNAseq reads to exon 3 (an exon with a relatively higher abundance of SNPs between the two genes) of AAEL020020 or AAEL005893. Read mapping was visualized in SnapGene to observe proportions of SNPs observed in the reads.
2.8. Upstream Motif Analysis
A python script (Supplementary File S11) was written with the help of ChatGPT to read both the Ae. aegypti genome .fasta file and the updated .gff3 file (see Section 2.6.1), to identify transcription start sites (TSSs) and to extract 2000 bp of DNA sequence upstream (5′) of the TSS. In some cases, less than 2000 bp would be extracted if the TSS was located near the end of the chromosome. From the DESeq2 analysis (see Section 2.6.2), four lists DEGs were generated: Orco−/− under-expressed, Orco−/− over-expressed, Ir8a−/− under-expressed, and Ir8a−/− over-expressed. Promoters were filtered to produce four promoter files, one for each list of DEGs. The web-based tool XSTREME (Motif Discovery and Enrichment Analysis) from the MEME Suite 5.5.7 was used for comprehensive motif analysis on each set of DEGs, using default settings [73]. Briefly, XSTREME limited the search to E-values ≤ 0.05, with a motif width of 6–15. The background was created by shuffling input sequences with a Markov order = 2. Motifs meeting the threshold were automatically subjected to Tomtom, the MEME Suite’s tool to compare discovered motifs to known motifs. The set of known motifs was set to JASPAR (non-redundant) DNA: JASPAR CORE (2022): [74]. After obtaining results from the motif analysis, motifs were compared to identify those that were common between each of the four categories of DEGs.
2.9. qRT-PCR Validation
To confirm the results of RNAseq, qRT-PCR analysis using the ΔΔCt method was conducted on a subset of differentially expressed genes. These included Orco, Or79, Gr4, Ir8a, Ir75e, Ir75g, Mip120a, and Mip120b. Primers were designed for amplification of cDNA only by ensuring that at least one primer in each set spanned an exon–exon junction. Three replicate colonies each of Orlando, Orco−/−, and Ir8a−/− strains were reared under the same conditions described above until adults were 5–7 DPE. At ZT = 0, adult mosquitoes were frozen and female antennae were dissected into Trizol reagent. RNA was extracted as described above. SuperScript IV Reverse Transcriptase (Invitrogen, Waltham, MA, USA) was used to produce cDNA from ~220 ng of RNA from each sample, which were each split equally to perform +RT and −RT reactions.
Power SYBR Green PCR Master Mix (Applied Biosystems, Waltham, MA, USA) was used for qPCR on the QuantStudio5 (Applied Biosystems, Waltham, MA, USA). Briefly, 5 µL of Master Mix, 0.5 µL of cDNA, 0.2 µL each of forward and reverse primer, and 4.1 µL of water (10 µL reaction volume) were added to each well of a 384-well plate. We performed two technical replicates for each test gene for each of the three biological replicates from each strain. Gene expression was normalized to RPS17 as a housekeeping gene, whose expression is consistent across all three strains. The qPCR protocol was performed as follows: 1. Initiation at 50 °C for 2:00 min, followed by 95 °C for 10 min; 2. PCR (40 cycles) of 95 °C for 15 s, followed by 60 °C for 1 min plus data capture; 3. melt curve by repeating one more PCR cycle, followed by a slow ramp from 60 °C to 95 °C at 0.075 °C/s, while collecting fluorescent data for a melt curve analysis.
The ΔΔCt method was used to quantify fold change between the wildtype and mutant strains. Some genes were not expressed in some strains. For example, Mip120b was not expressed in Orlando mosquitoes, coinciding with the results from RNAseq. In these cases, a Ct value was not available. Because the ΔΔCt method only works with numerical data, the R script used for processing the data counted undetermined Ct values as 40, coinciding with the last cycle of the experiment. The R script did not alter the original data table. A t-test was used for each gene set to assess for significance (p < 0.05), and the fold change (2−ΔΔCt) was plotted.
3. Results
3.1. Strain Confirmation
We analyzed differential gene expression in two mutant strains by comparing their transcriptomes to the Orlando wildtype. The Orco−/− strain contains a 16 bp deletion in the first exon, for which there is no read coverage (Figure S1), corresponding to the deletion coordinates [37]. The Ir8a−/− strain includes an inserted cassette with the polyubiquitin promoter, dsRED, and SV40 [27]. As expected, transcript coverage increased dramatically, downstream of the polyubiquitin promoter, with coverage spanning the dsRED sequence and 3′ exons (Figure S2). We further confirmed the identity of the Ir8a−/− strain by examining larvae under a fluorescent microscope (excitation 558 nm, emission 583 nm) to visualize the dsRED expression (Figure S3). Of note, dsRED is observable under visible light in a dissection microscope, allowing for simplified verification of the strain while dissecting antennae. Finally, we confirmed the homozygous nature of the Ir8a mutation via PCR analysis. We used wildtype-specific primers (flanking the insertion site) that would produce a small amplicon (238 bp) in the wildtype genome. The large size of the cassette prevented amplification in the mutant strain as the predicted amplicon size for the dsRED insert was 2.64 kb. We also used primers that were specific for the dsRED cassette, pairing the external forward primer from set 1 with a polyubiquitin promoter specific primer (amplicon size 439 bp). As expected, primer set 1 produced a 238 bp amplicon in the Orlando strain and no amplicon in the Ir8a−/− strain, while primer set 2 produced a 439 bp amplicon in the Ir8a−/− strain and not in the Orlando strain (Figure S10). This confirms the homozygous nature of the Ir8a−/− mutant strain.
3.2. Sample Statistics
We performed antennal RNAseq profiling on mated, non-blood-fed female mosquitoes that were aged 5–7 DPE. Our analysis compared the antennal transcriptome of Orco−/− and Ir8a−/− to the Orlando wildtype. After performing RNAseq for each strain (at least four replicates of each strain), the libraries were subjected to Principal Component Analysis within the DESeq2 platform. The PCA plot revealed a clear separation between the Orlando strain and the two mutant strains, with less separation between the two mutant strains (Figure S4).
3.3. Odorant Receptors Are Under-Expressed in Aedes Aegypti Orco−/−
Heatmaps of the TPM values for the major chemoreceptor families were generated to visualize gene expression comparisons across samples (Figure 2). Potential differences in magnitude in wildtype versus mutant antennae across all three gene families were broadly evident, even before differential expression analysis was performed (Figure 2). DESeq2 comparisons revealed significant differential expression of genes between strains (Supplementary Files S12 and S13). Genes were classified as differentially expressed if p-Adj < 0.05 and absolute log2 fold change was >1 [75]. More than 1700 DEGs were identified across samples (Figure 3). Chemoreceptor genes were significantly under-represented in the Orco−/− strain, supporting our initial hypothesis (Figure 3 and Figure 4). A total of 51 Ors, including Orco, 18 Irs, including Ir8a, and 5 Grs were significantly under-represented, while Or36, Or42, Or72, and Or125 were significantly over-represented (Figure 3 and Figure 4).
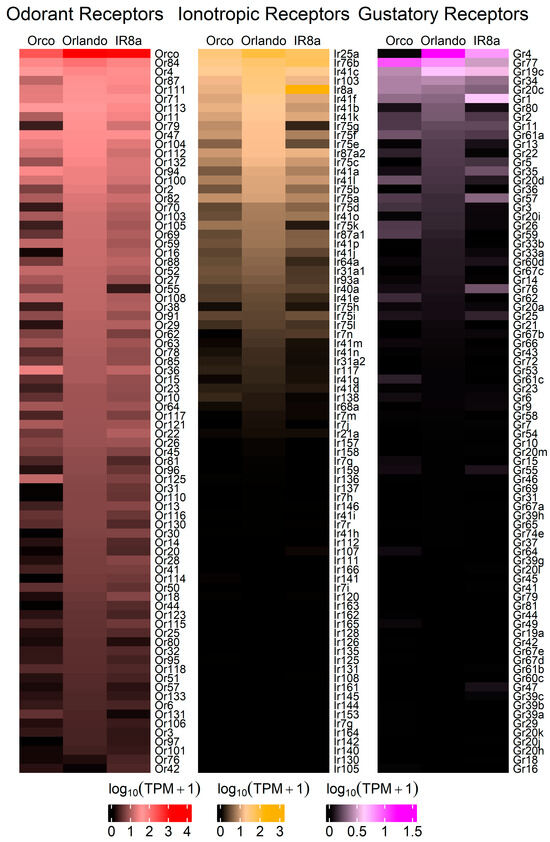
Figure 2.
Heatmaps for each chemosensory gene family. Transcript abundances were compared across strains, showing that tuning Ors are broadly under-expressed in Orco−/−, followed by tuning Irs. In the Ir8a−/− mutant strain, tuning Irs are generally under-expressed, followed by tuning Ors. The log10(TPM + 1) of each transcript was plotted. The top eighty transcripts are represented for each strain. Expanded heatmaps are provided in Figure S7.
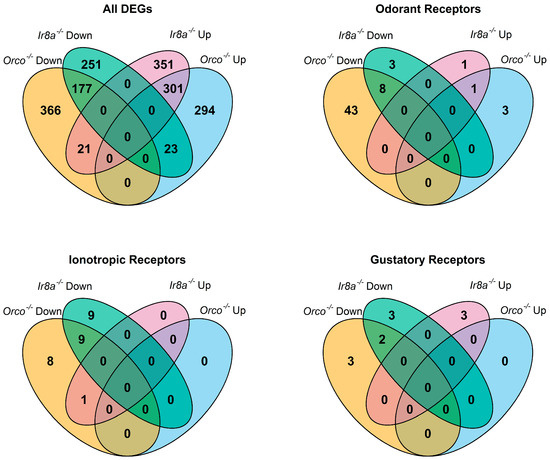
Figure 3.
Venn diagrams showing overlap of DEGs across antennae samples as identified by DESeq2 analysis. In each diagram, the regions are labeled by the mutant strain and whether the genes are significantly over-represented (Up) or under-represented (Down) when compared to wildtype. All DEGs are considered, as well as subsets of chemoreceptor genes including Ors, Irs, and Grs.
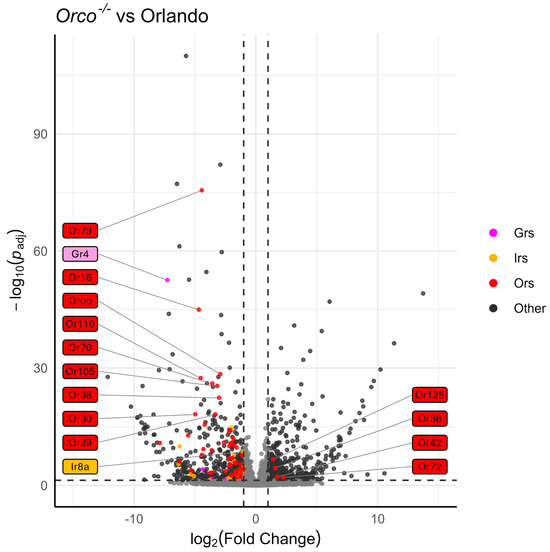
Figure 4.
Volcano plot of DESeq2 analysis, comparing Orlando wildtype with Orco−/−. Tuning chemoreceptors, specifically OrXs, are broadly under-represented in Orco−/−. Odorant receptors are highlighted in red, ionotropic receptors are highlighted in gold, and gustatory receptors are highlighted in magenta. Dotted horizontal and vertical lines represent the thresholds for consideration as DEGs (p-Adj< 0.05, absolute log2(fold change) > 1). The 10 chemoreceptors with the lowest p-Adj values are labeled, as well as any chemoreceptor that is significantly over-represented. Co-receptors Orco and Ir8a are labeled regardless of significance. Labels are colored according to chemoreceptor class.
A TopGO analysis (Supplementary Files S14 and S15) was performed to identify the molecular functions of genes that were significantly under- or over-represented in the Orco−/− strain. Strikingly, among the under-represented GO terms, 17 of 25 with the lowest p-values were descriptive terms for chemoreceptors. These included terms such as “olfactory receptor activity” (p = 1.71 × 10−42), “odorant binding” (p = 2.58 × 10⁻³¹), “ligand-gated channel activity” (p = 3.92 × 10⁻⁸), and “glutamate receptor activity” (p = 3.78 × 10⁻⁴) (Figure 5). This analysis shows that not only are the molecular functions of olfaction significantly reduced in Orco mutants, but that only a few other molecular functions are affected to the same level of significance (p < 0.005). GO terms associated with over-represented DEGs in Orco−/− antennae were associated with peptidases (serine-type endopeptidase activity: p = 1.23 × 10⁻⁶), suggesting that in Orco mutant antennae, proteolytic cleavage is increased (Figure S5).
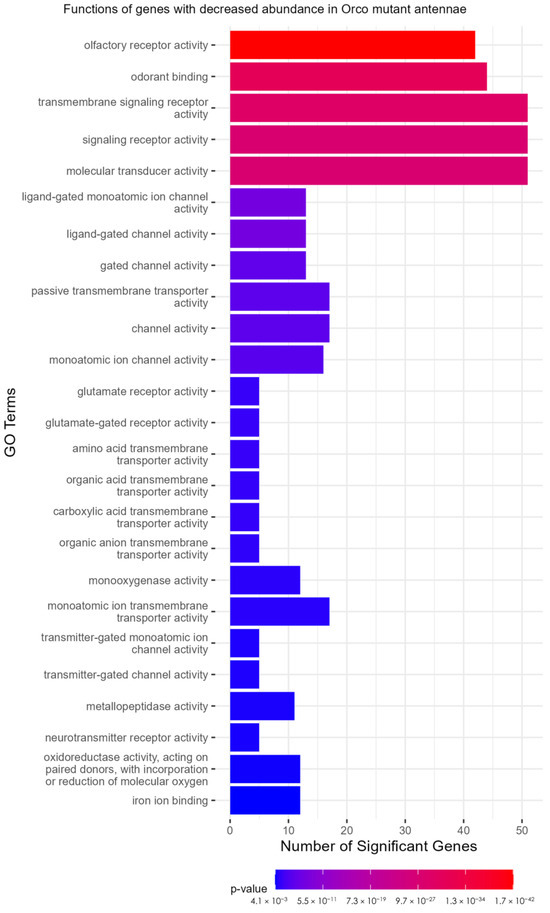
Figure 5.
TopGO analysis of DEGs. Olfactory receptor functions are representative of the under-expressed genes in the Orco mutant antennae. TopGO analysis was performed at the molecular functions level, and the updated GAF file (including the most recently updated chemoreceptor genes) was used to map GO terms to genes. All GO terms with a classic Fisher’s p-value < 0.005 were plotted. The color map from red to blue represents the p-value for the enrichment of each term, with the lowest p-values colored in red.
3.4. Chemoreceptor Dysregulation in Aedes Aegypti Ir8a−/−
Similarly to Orco−/−, under-expression of chemosensory genes and over-expression of peptidases was observed in the Ir8a−/− antennae (Figure 6 and Figure S6). For example, 11 Ors (excluding Orco), 18 Irs, and 5 Grs were under-represented (Figure 3 and Figure 6). Conversely, Or42, Or76, Ir8a, Gr1, Gr57, and Gr76 were over-represented in the Ir8a−/− strain (Figure 3 and Figure 6).
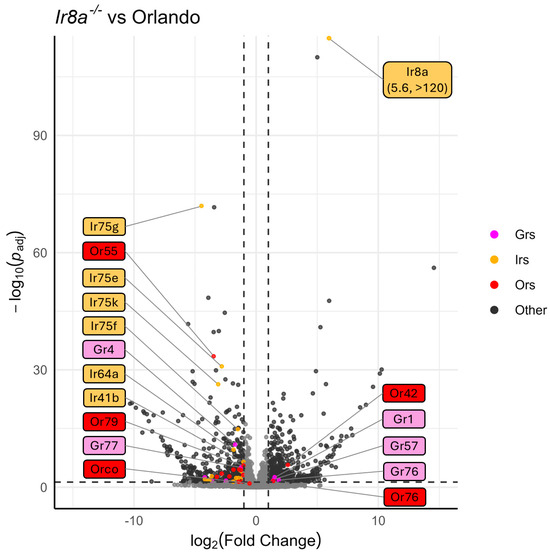
Figure 6.
Volcano plot of DESeq2 analysis, comparing Orlando wildtype with Ir8a−/−. Tuning chemoreceptors, specifically IrXs, are broadly under-represented in Ir8a mutants. Odorant receptors are highlighted in red, ionotropic receptors are highlighted in gold, and gustatory receptors are highlighted in magenta. Dotted horizontal and vertical lines represent the thresholds for consideration as DEGs (p-Adj < 0.05, absolute log2(fold change) > 1). The 10 chemoreceptors with the lowest p-Adj values are labeled, as well as any chemoreceptor that is significantly over-represented. Co-receptors Orco and Ir8a are labeled regardless of significance. Labels are colored according to chemoreceptor class.
Interestingly, in the Ir8a−/− strain, the Ir8a gene was significantly over-expressed compared to the wildtype gene in Orlando (Figure 5). This over-expression of Ir8a is explained by the presence of the polyubiquitin promoter in the dsRED cassette, which drives the expression of downstream genes in all tissues. This promoter thus drives the expression of dsRED, as well as the downstream out-of-frame Ir8a exons (Figure S3).
As in the Orco−/− strain, the TopGO analysis (Supplementary Files S16 and S17) identified peptidase activity as a functional description of genes with increased abundance in Ir8a−/− antennae (Figure S6). In the over-represented Ir8a−/− DEGs, serine-type endopeptidase activity was the most significant GO term (p = 4.18 × 10⁻¹⁴; Figure 7). In the under-represented DEGs, GO terms descriptive of chemoreceptors and ionotropic receptors were identified (Figure 6). Ligand-gated monoatomic ion channel activity was the most significantly enriched GO term in the under-expressed DEGs (p = 1 × 10⁻⁶; Figure 7).
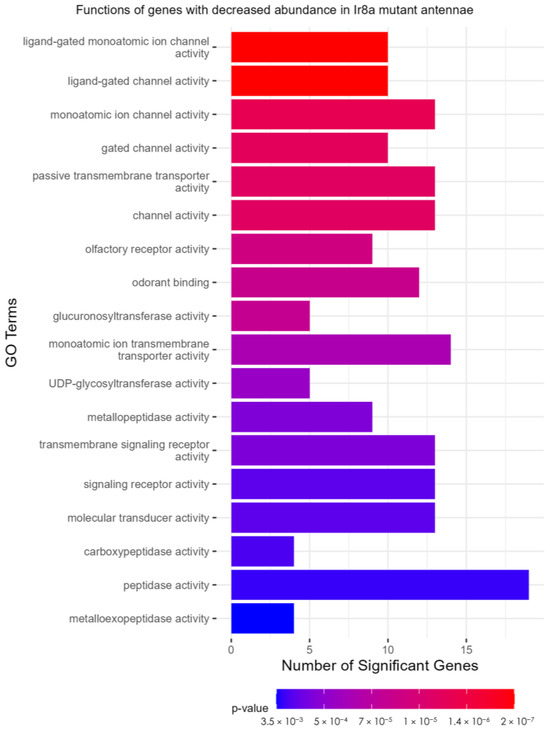
Figure 7.
TopGO analysis of DEGs. Ligand-gated ion channel functions are representative of the under-expressed genes in the Ir8a mutant antennae. TopGO analysis was performed at the molecular functions level, and the updated GAF file (including the most recently updated chemoreceptor genes) was used to map GO terms to genes. All GO terms with a classic Fisher’s p-value < 0.005 were plotted. The color map from red to blue represents the p-value for the enrichment of each term, with the lowest p-values colored in red.
3.5. Molecular Pathways and Transcription Factors Involved in Chemosensory Regulation
To identify molecular pathways involved in chemosensory regulation, various transcription factors (TFs) and chromatin remodeling genes were queried for differential expression from the RNAseq dataset. Genes from the MMB/dREAM complex, the miR-279 pathway, as well as various TFs, were differentially expressed (Figure 8, Table 1).
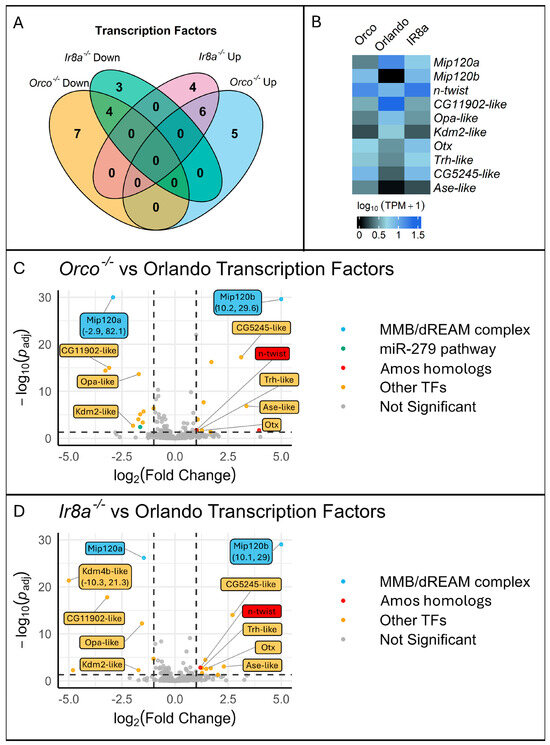
Figure 8.
Visualization of the transcription factor differential expression shows two Mip120 homologs (Mip120a and Mip120b), members of the MMB/dREAM complex, along with other TFs including an n-twist, a neuronal differentiation TF with sequence similarity to the D. melanogaster chemosensory TF amos to be significantly differentially expressed. (A) A Venn diagram shows the overlap between Orco−/− and Ir8a−/− mutants of differentially expressed TFs compared to the wildtype. Each number represents the number of differentially expressed TFs within each category. (B) A heatmap of the relative expression levels for the 10 differentially expressed genes in common to both co-receptor mutants. (C,D) Volcano plots showing differentially expressed TFs in Orco−/− or Ir8a−/− relative to the wildtype. Any datapoints that were not TFs were filtered out prior to visualization. Labels were added to the ten DEG TFs in common to both mutant strains. The Y-axis was confined to 30, and the X-axis was confined to |5.0|. Any points with X or Y values outside of those limits were plotted on the edge of the graph, labels were added, and the X,Y coordinates were included in the label.

Table 1.
Transcription factors and chromatin remodeling genes implicated in chemoreceptor regulation in Aedes aegypti mosquitoes.
Most notably, there were two Ae. aegypti homologs to the D. melanogaster Mip120 gene. Mip120 is part of the MMB/dREAM complex and was previously characterized as a repressor of Gr63a in inappropriate neurons [76]. The MMB/dREAM complex was also implicated as a chemoreceptor regulator for other Ors [76]. Mip120b (AAEL020020), one of the Mip120 homologs, was significantly over-expressed (Log2FoldChange > 10) in both mutant strains (Figure 8, Table 1). An additional Mip120 homolog, Mip120a (AAEL005893) was significantly under-represented. Mip120b was located on chromosome 3, but Mip120a was unmapped to a chromosome and was annotated to the NIGP01000892 scaffold. Therefore, we reasoned that Mip120a may not be a real gene, but merely an artifactual copy of Mip120b. Therefore, we sought to determine if one or two genes were present in the Aedes aegypti genome. The exonic regions of the genes were nearly identical, with only 33 SNPs between the two coding sequences. The annotated introns were however different. We designed two sets of primers. In set 1, a forward primer was designed to anneal to an exonic region shared by both genes. Two separate reverse primers were designed to anneal to gene-specific regions in the introns. In set 2, the reverse primer annealed to a shared exonic regions, while the forward primers annealed to gene-specific primers. When the genes were PCR amplified, bands were present for all primer sets, confirming the presence of both genes (Figure S8).
We found it remarkable that in Orlando wildtype expression results, Mip120b had no read counts that were mapped to the gene, while hundreds of reads were mapped to Mip120a (Figure 8B), since the transcript sequences were nearly identical. In the mutant strains, reads were mapped to both genes (Figure 8B). With only 33 SNPs found in the coding regions between both genes, we doubted Salmon’s ability to accurately map reads between these ambiguous transcripts. We ran a Bowtie2 alignment of reads to either Mip120a or Mip120b exon 3 (a region with relatively more SNPs). We then visualized the read alignment in SnapGene. In Orlando wildtype, all of the reads that were mapped to Mip120a/b only contained Mip120a specific SNPs. No Mip120b polymorphisms were observed in Orlando transcripts. When examining mutant strains, the reads contained both Mip120a and Mip120b polymorphisms. This confirmed our findings that, though Mip120a and Mip120b are similar at the transcript level, Salmon was able to accurately map reads to each transcript. This verifies that both genes exist in the genome and that they are differentially expressed in opposite directions in both mutant strains. In Ae. aegypti, these genes had not yet been given a name. We therefore named the AAEL005893 and AAEL020020 genes Mip120a and Mip120b, respectively.
Additionally, an Esg homolog was significantly under-represented in Orco−/− mutants, implicating the miR-279 pathway in chemoreceptor regulation (Figure 8, Table 1). Two Amos homologs, amos-like (AAEL001637) and n-twist (AAEL007814), were significantly over-represented in Orco−/− alone and in both mutants, respectively (Figure 8, Table 1). Kdm2 and Oc homologs were identified as DEGs in both mutant strains and were under- or over-represented, respectively (Table 1). Ets96B was significantly over-represented in Orco−/− mutants, and TFs Fd96Ca, Kdm4b, Srp, Dfd, and Odd were identified as DEGs in Ir8a−/− mutants (Table 1).
3.6. Motifs Identified Upstream of Differentially Expressed Genes
The XSTREME motif discovery and enrichment algorithm was used to identify potential cis-regulatory elements in the regions 2000 bp upstream of the TSS for DEGs. Within these promoter regions, eight motifs were identified in Orco−/− under-expressed DEGs, ten in Orco−/− over-expressed DEGs, three in Ir8a−/− under-expressed DEGs, and twenty-five in Ir8a−/− over-expressed DEGs. Enriched motifs were compared between DEG categories. While the threshold for XSTREME analysis was set at E < 0.005, the algorithm also returned the top three motifs identified by SEA (Simple Enrichment Analysis), even if the E values were greater. Five motifs are highlighted below for further consideration. Two motifs, the first similar to those recognized by achi and vis in D. melanogaster and the second with no known TFs associated, were found in the upstream regions of Orco−/− under-expressed DEGs and Ir8a−/− over-expressed DEGs (Figure 9). Three motifs were enriched in the upstream regions of over-expressed DEGs in both mutants. These motifs are identical to the D. melanogaster motifs recognized by CG4328-RA, Clamp, and su(Hw).
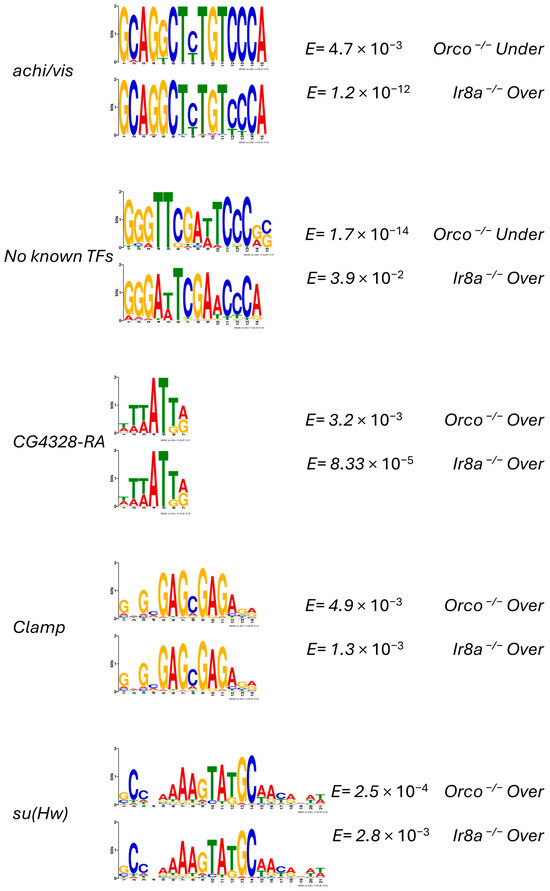
Figure 9.
XSTREME motif analysis reveals that similar motifs are enriched in both co-receptor mutants. Motifs that are significantly (E < 0.05) enriched and are represented in both mutants are displayed. If an insect TF is known to bind to a motif, the name of the TF is printed to the right. The E values from the XSTREME analysis are provided to the right, as well as the set of DEG upstream regions from which the motif was discovered.
3.7. qRT-PCR Validates RNAseq
To independently validate our RNAseq results, we used quantitative RT-PCR (qRT-PCR) to assess differential expression of a subset of genes in Orco−/− and Ir8a−/− antennae. Expression of each gene in the mutants was compared to the wildtype and normalized against the ribosomal protein gene, RPS17. As discovered in our RNAseq analysis, Orco, Or79, Gr4, and Mip120a were each significantly under-expressed in the Orco−/− antennae compared to wildtype, validating our RNAseq results (Figure 10; p = 8.3 × 10⁻⁴, 1.9 × 10⁻⁴, 4.7 × 10⁻³, and 1.5 × 10⁻⁴, respectively). In Ir8a−/− mutants, Ir8a was significantly over-expressed (p = 2.0 × 10⁻⁵), while Ir75g was significantly under-expressed (p = 0.009). In both mutants, the Mip120b transcription factor was significantly over-expressed, while in Orco−/− mutants, Mip120a was under-expressed, also confirming our RNAseq data (Figure 10). Interestingly, Ir8a was over-expressed in Orco−/− mutants although with a p-value that was just below significance (Figure 10; p = 0.042). This conflicts with the under-expression of Ir8a that we observed in Orco−/− antennae in RNAseq, although the p-value in that case was also just above the threshold for significance (Figure 4; Supplementary Files S18 and S19).
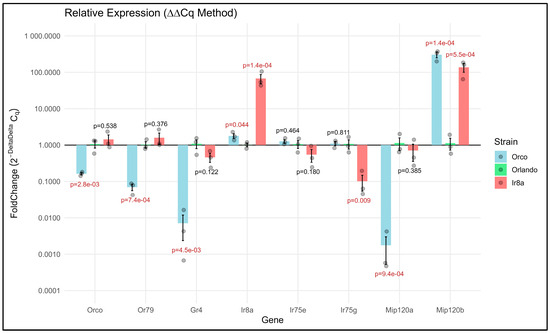
Figure 10.
Validation of a subset of differentially expressed genes via qRT-PCR (ΔΔCt method) indicates broad agreement with RNAseq data. Bars originate at 1, which is the baseline expression of the gene in the Orlando strain and extend up or down to indicate over- and under-expression, respectively. Normalization was performed using the ribosomal protein gene, RPS17. T-tests were performed at the ΔCt level, with significant p-values (p < 0.05) displayed in red.
4. Discussion
In this study, we examined the expression of chemosensory genes in the antennae of female Ae. aegypti, comparing a wildtype strain with two co-receptor mutant strains, Orco−/− and Ir8a−/−. Our analysis reveals that tuning receptors are under-expressed in mutant antennae compared to a wildtype strain and provides evidence in support of the hypothesis that functional co-receptors are required for expression of tuning receptors. We further validated the RNAseq data using qRT-PCR for a subset of genes. These data confirmed the results from the RNAseq experiment broadly. There were a few instances where a significantly dysregulated gene from the RNAseq data was not significantly dysregulated in the qRT-PCR data. We attribute this to the lower number of biological replicates used in the qRT-PCR experiments. Three biological replicates were used for the qRT-PCR experiment, while at least four (Orlando n = 6, Orco−/− n = 4, Ir8a−/− n = 5) were used for RNAseq, leading to a higher sensitivity for the RNAseq experiment. This expands our understanding of chemoreceptor regulation in insects.
In mammals and insects, olfactory sensory/receptor neurons express chemoreceptors, which recognize and bind to semiochemicals in the environment and initiate an action potential to the brain [77]. The canonical understanding of insect olfaction indicates that one ORN expresses a single chemoreceptor [78,79], although this viewpoint has been challenged by recent findings [2,43]. Axons from the same types of ORNs extend to a glomerulus in the antennal lobe dedicated to the detection of that compound [78,79]. Similarly, in mice, a single Or is expressed in each OSN and the same types of axons converge to a single glomerulus in the olfactory bulb [80].
Although parallels between the olfactory systems of insects and mammals exist, there are also substantial differences that complicate direct comparisons [77]. For example, Ors in mammals function as G protein-coupled receptors (GPCRs), while insect Ors are ligand-gated ion channels [80]. The mouse genome encodes a repertoire of >1200 Or genes, and each OSN expresses a single allele of a single gene [81], while insect genomes encode dozens to hundreds of Ors, with single ORNs capable of expressing multiple Ors [2,3,4,5,45,48,49,50,51,52,53,54]. The selection of which Or an OSN expresses may be stochastic, but once an Or is successfully expressed as a protein, it prevents the expression of any other Or within the same neuron [82]. Non-transcribed Or genes in mice are localized in heterochromatin near the center of the nucleus and have H4K20me3 and H3K9me3 histone methylation [47,81]). A single Or gene is derepressed while the ORN is still immature by the action of LSD1. Once a single Or is successfully expressed as a protein in the ER, a feedback loop is activated that represses LSD1, preventing any other Ors from activation [81].
In insects, the initiation of expression chemoreceptor expression is far from stochastic but is restricted by TF binding motifs through combinatorial TF regulation [50]. Insect Ors are expressed biallelically contrasting with the monoallelic expression of mammalian Ors [50]. In Anopheles gambiae, the forced expression of a single tuning receptor leads to the repression of other tuning receptors [83], suggestive of a feedback mechanism similar to mouse olfaction. Interestingly, expression is not static but is also adaptable to external cues [84]. When D. melanogaster is exposed to extremely high concentrations of an odorant, the expression of the chemoreceptor associated with sensing that compound was altered in some cases [85].
Most insect ORNs will only express a single tuning Or, along with the requisite co-receptor [80]. Mammals need not express a co-receptor in each ORN, unlike insect systems. Recently, it has been shown in D. melanogaster that Orco and Ir8a play a role in coordinating transport of cognate tuning receptors from the ER to the dendritic surface [39,40]. It has also been shown that when these co-receptors are functionally knocked out, that expression levels of associated tuning receptors is reduced [39,40,44]. Here, we explored the effects of knocking out co-receptors Orco and Ir8a in the yellow fever mosquito Ae. aegypti.
Two non-exclusive explanatory models may account for our observations of reduced expression of tuning receptors in co-receptor knockout mutants. First, the evidence may indicate pleiotropic roles for co-receptors, namely that of coordinating expression of their cognate tuning receptors. Alternatively, the under-representation of tuning receptors could be the result of the degeneration of neurons expressing either Orco or Ir8a due to physiological inactivity. Here, we contextualize these two models within the body of literature on this subject and propose future directions for research.
In D. melanogaster, when Orco or Ir8a are functionally disrupted, the transport of cognate tuning receptors from the endoplasmic reticulum to the dendritic surface is impaired and expression of the cognate tuning receptors is reduced [36,38,39,44]. Furthermore, when Ir8a is knocked out, Ir64a protein abundance is reduced in the antennae [38]. When we performed RNAseq differential expression analysis in Ae. aegypti antennae, we observed significantly reduced levels of chemoreceptor transcripts. This could indicate that the co-receptors, in addition to directing the transport of tuning receptors, also coordinate their transcription. Such pleiotropy was observed in D. melanogaster, where transcript abundance of the cognate co-receptors was reduced, even in neurons that did not undergo neurodegeneration [44]. Our study in Ae. aegypti indicates that this phenomenon may not be specific to D. melanogaster.
Studies in D. melanogaster have also demonstrated that co-receptor expression is required for sensory neuron development or maintenance, as neurodegeneration is observed within the OSNs in early adulthood [43]. In contrast, a large population of OSNs survive, even when the co-receptor is abolished [44]. In Ae. aegypti, OSN neurodegeneration has not been observed, though this has not been extensively studied [43]. Follow-up studies should evaluate the extent and timing of potential neurodegeneration in Orco−/− and Ir8a−/− mutant mosquitoes. To do this, the T2A-QF2 in-frame fusions for Orco and Ir8a could be utilized [86]. Though these insertions are in-frame, the authors posited that producing a homozygous driver line could result in a loss-of-function phenotype. If such a phenotype is produced, then the homozygous in-frame fusion would be sufficient to track neuronal health. Alternatively, a homozygous driver line for a T2A-QF2 out-of-frame fusion could be created. This would lead to functional knockouts for each co-receptor gene, while enabling visualization of frameshifted transcript expression in ORNs and IRNs as proxies for neuronal health.
Both models provide explanations for the reduced transcript abundance observed in co-receptor knockout mosquitoes and are supported by findings in D. melanogaster [38,39,43,44]. We propose that reduced transcript abundance can be explained by a combination of both models. In such a scenario, a subset of OSNs undergo cell death because of inactivity. Those that survive display a decreased abundance of the cognate transcripts for each co-receptor due to loss of the co-receptor’s coordination of transcription.
We further investigated whether any TFs or chromatin remodeling genes were differentially expressed. We identified a total of 29 regulatory genes that were differentially transcribed. Of these, several TFs had previously been associated with regulation of chemosensory genes, including amos homologs, members of the MMB/dREAM complex, and a member of the miR-279 pathway [65,66,76].
In D. melanogaster, amos and atonal are two basic helix–loop–helix transcription factors that have strong similarity to each other [67]. Amos is involved in the development of olfactory sensilla in Drosophila and together with atonal is responsible for the formation of the ORNs and the antennal lobe [68]. Two amos homologs are differentially expressed in the mutant strains of mosquitoes. First, amos-like (AAEL001637), which shares approximately 38 percent identity with D. melanogaster amos, is significantly over-represented in Orco−/− mutants. Next, n-twist (AAEL007814), which shares approximately 35 percent identity with D. melanogaster amos, is significantly over-represented in both Orco−/− and Ir8a−/− mutants. N-twist is a transcriptional inhibitor, has been shown to affect differentiation of neurons, and shows sequence similarity to amos [69]. Whether it directly regulates chemosensory receptors has not been determined. Over-expression of the n-twist gene could be due to a feedback loop; when regulatory feedback loops detect under-expression of chemoreceptors, they may increase expression of amos homologs in an attempt to increase downstream chemoreceptor expression.
The microRNA-279 pathway has also been implicated in chemosensory gene regulation, where the miRNA works in conjunction with Nerfin-1, Pros, and Esg in D. melanogaster to inhibit the development of CO2 ORNs in the maxillary palp [87]. The expression levels of an Esg homolog were differentially expressed at lower levels in the Orco−/− mutants. Under-expression of this gene does not easily explain the broad under-expression of chemoreceptors in both mutants, but it does implicate a role for this TF in the regulation of ORNs. As posited for the amos homolog, it may be possible that when the mosquito regulatory systems detect broad under-expression of chemosensory genes, they repress the miR-279 pathway to promote expression of receptors and formation of ORNs.
When examining differential expression of regulatory genes, the over-representation of Mip120b (AAEL020020) in both mutant strains may offer the most straightforward explanation for our observation of chemoreceptor under-expression. Mip120b is a homolog of Mip120, which is a part of the MMB/dREAM complex in D. melanogaster [76,88]. Multiple proteins, including TFs and chromatin remodelers, come together to form the MMB/dREAM complex [8,76]. This complex is composed of Lin-52, Rpd3, L(3)mbt, Myb, E2F2, DP, RBF1/2, Mip40, Mip120, Mip130, and P55/Caf1 [76,88]. In D. melanogaster, Myb is necessary for Gr21a and Gr63a expression, while Mip120 represses aberrant expression in other neurons [76]. There are two Mip120 homologs in Ae. aegypti: Mip120a (AAEL005893) and Mip120b (AAEL020020). Interestingly, Mip120a is significantly under-represented, while Mip120b is significantly over-represented in both mutants. If both genes are involved in repressing the expression of chemoreceptors in inappropriate neurons, then over-expression would lead to lower transcription of chemoreceptors, while under-expression would have the opposite effect. While Mip120a is significantly under-expressed relative to wildtype, Mip120b is over-represented with a positive fold change that is orders of magnitude larger than the negative fold change of Mip120a. In both mutants, the total expression of Mip120b is greater than that of Mip120a. If Mip120b shares the D. melanogaster Mip120 role as a chemoreceptor repressor, then its elevated expression relative to the wildtype could explain the broad under-representation of chemoreceptor genes found in Orco−/− and Ir8a−/− mutants.
After analyzing TFs that were differentially expressed, promoter regions (defined as 2000 bp upstream of the TSS) were extracted for over- and under-represented DEGs for both Orco−/− and Ir8a−/− strains. These were subjected to motif discovery and enrichment analysis using the web-based tool XSTREME, part of the MEME Suite 5.5.7. Comparisons were made between motifs enriched in each different list of DEGs. While it is not possible to draw a clear connection between the motif analysis and the TFs that were differentially expressed, some interesting connections were found between motifs enriched in different categories of DEGs. The comparison of motifs between the Orco−/− and Ir8a−/− over-expressed genes showed the greatest number of similar motifs, with a total of nine comparisons made between motifs in each category. Interestingly, the GATAd- and su(Hw)- like binding sites were the most frequently repeated motifs observed. Furthermore, a striking similarity was observed between the D. melanogaster E2F2 motif and the su(Hw) motif identified in Ir8a−/− over-represented DEG promoters [88].
Recently, a feedback loop was identified in the antennae of Anopheles gambiae. When AgamOr2 was expressed ectopically in all ORNs, the expression of any other Or was significantly repressed [83]. The pattern of under-expressed Ors and Irs reflected the pattern of under-expressed chemoreceptors in our study [83]. From these data, we conclude that the expression of Orco or Ir8a is necessary to allow expression of cognate tuning receptors, and that when one tuning receptor is effectively expressed, other tuning receptors are repressed. We propose a model whereby Orco, Ir8a, and the appropriate tuning receptor for a given OSN coordinate with the MMB/dREAM regulatory complex to achieve fine tuning of chemosensory control.
This work expands our understanding of the roles of Orco and Ir8a co-receptors in insects. Prior work has established the roles of Orco and Ir8a as co-receptors and has implicated them in the coordinated transport of tuning receptors and maintaining the health of OSNs [38,39,43,44]. Our study expands this pleiotropy to Ae. aegypti and suggests TFs and putative TF binding motifs that may play a role in chemoreceptor transcriptional regulation. Whether co-receptor coordination of tuning receptor transcription is limited to dipterans or it is a general phenomenon across other insect orders remains to be investigated. We also note that chemical response phenotypes associated with the Ae. aegypti Orco−/− and Ir8a−/− mutants should be reassessed considering the dysregulation of chemoreceptor genes across families [27,35,37]. For example, the mutation of either co-receptor led to decreased abundance of Gr4, a homolog of Drosophila melanogaster Gr64f, the sugar taste receptor [70,71]. It is interesting that this receptor would be the most highly expressed GrX in wildtype antennae, and that mutation of co-receptors Orco and Ir8a would be associated with decreased transcription. The complex interplay of co-receptor and tuning receptor expression suggests caution when interpreting results that might otherwise be assumed to affect only one gene family.
Mosquitoes transmit pathogens that disable or kill millions of people around the world annually [8]. In the ongoing struggle to combat vector-borne diseases, it is imperative to conceptualize novel means to control vector populations to reduce the public health burden imposed by them. Importantly, such strategies should be designed with the problem of insecticide resistance in mind [89]. The current study suggests that, in Ae. aegypti, there exists a tightly regulated transcriptional control of chemosensory receptors. The data further suggests that Orco and Ir8a co-receptors are integrally involved in this transcriptional control. Continuing to discover the molecular processes, promoter sequences, transcription factors, and other genes involved in such regulation is of high importance. Elucidation of such molecular pathways could lead to the discovery of novel molecular targets for next-generation pesticides. Insects will often develop resistance to pesticides by accumulating mutations in the target of a pesticide [90]. If there is a high fitness cost for mutation of a particular target, we would predict that selection would occur at a slower rate. Conceptually, next-generation insecticides/repellents could be developed to target one or more of the regulatory processes described in this study and integrated into current intervention strategies to mitigate the effects of resistance. However, if mosquitoes developed resistance via mutations in chemoreceptors or their transcriptional regulators, this might lead to a reduction in their ability to efficiently locate blood hosts. Both outcomes would theoretically decrease the vectorial capacity, either by decreasing populations directly or by decreasing the biting rate [8].
5. Conclusions
Our analysis highlights the aberrant expression profiles of chemoreceptor transcripts in Ae. aegypti Orco−/− or Ir8a−/− co-receptor mutants. We speculated that mutations in the Orco and Ir8a co-receptors would lead to the broad dysregulation of tuning Ors and Irs, respectively. Our findings support this hypothesis and suggest a pleiotropic role for olfactory co-receptors in Ae. aegypti in coordinating chemosensory transcript expression.
Future studies should expand the transcriptomic analysis and explore mechanisms for the coordination of chemosensory transcript expression. To expand the RNAseq analysis, follow-up experimentation should focus on the Ir8aattP/attP strain, produced by the DeGennaro lab, as the global expression of the dsRED protein may affect the expression of other transcripts [27]. Additionally, the transcriptomes of Orco−/− and Ir8a−/− mutants should be analyzed across chemosensory tissues and sexes, and under different physiological conditions. Such comprehensive analyses may reveal other novel roles for co-receptors. Moreover, the role of conserved motifs in the promoter regions should be evaluated by performing reporter assays in wildtype and mutant co-receptor strains. Such an analysis would contribute towards a mechanistic understanding of the roles of co-receptors in the coordination of chemoreceptor transcript expression. Finally, the molecular pathway for the regulation of chemoreceptor transcription should be fully elucidated to provide a basis for potential targets of next-generation insecticides and repellents.
Supplementary Materials
The following supporting information can be downloaded at: https://www.mdpi.com/article/10.3390/insects16060638/s1, Supplementary File S1: Merged_Annotations_AGWG.gff; Supplementary File S2: remove_utrs.py; Supplementary File S3: Merged_Gene_Ontology_Terms.gaf; Supplementary File S4: Merged_Aedes_aegypti_transcriptome.fasta; Supplementary File S5: Ors Phylogeny.svg; Supplementary File S6: Irs Phylogeny.svg; Supplementary File S7: Grs Phylogeny.svg; Supplementary File S8: Orco_16_transcriptome.fasta; Supplementary File S9: Ir8a_dsRED_Transcriptome.fasta; Supplementary File S10: R_scripts.txt; Supplementary File S11: extract_upstream_sequences.py; Supplementary File S12: DESeq2_results_orco_vs_orlando.csv; Supplementary File S13: DESeq2_results_ir8a_vs_orlando.csv; Supplementary File S14: Orco_DN_GO_Enrichment_Summary.csv; Supplementary File S15: Orco_UP_GO_Enrichment_Summary.csv; Supplementary File S16: Ir8a_DN_GO_Enrichment_Summary.csv; Supplementary File S17: Ir8a_UP_GO_Enrichment_Summary. Supplementary File S18: qPCRddCt_dat.csv, Supplementary File S19: qPCR_ddCt_results.csv; Supplementary Folder 1: XSTREME_Ir8a_UP; Supplementary Folder 2: XSTREME_Orco_DN; Supplementary Folder 3: XSTREME_Orco_UP; Supplementary Folder 4: XSTREME_Ir8a_DN; Supplementary Figure S1: RNAseq coverage of the Orco gene, with the Ir8a−/− strain on top, the Orlando strain in the middle, and the Orco−/− strain on the bottom. Reads aligned with HISAT2 against the Aedes aegypti L5 genome. Coverage visualized with Integrated Genome Viewer; Supplementary Figure S2: RNAseq coverage of the Ir8a gene, with the Ir8a−/− strain on top, the Orlando strain in the middle, and the Orco−/− strain on the bottom. Reads aligned with HISAT2 against the Aedes aegypti L5 genome. Coverage visualized with Integrated Genome Viewer.; Supplementary Figure S3: Fluorescent imaging (excitation 558 nm, emission 583 nm) shows that the Ir8a−/− strain of mosquitoes express dsRED in all tissues of the body. HISAT2 alignment was used to align reads from the Ir8a−/− mutant against the Ir8a_dsRED gene, which was set as the “genome”. Coverage was visualized with the Integrated Genome Viewer. A gene map shows the insert in exon 2 (left to right: green = polyubiquitin promoter, red = dsRED ORF, green = SV40). Increased coverage is observed in exons 3–5, following the polyubiquitin promoter.; Supplementary Figure S4: PCA plot of DESeq2 results for all strains shows separation of both mutants from the Orlando wildtype strain, with little separation between mutants; Supplementary Figure S5: TopGO analysis shows that peptidase functions are representative of the over-expressed genes in the Orco mutant antennae. TopGO analysis was performed at the Molecular Functions level, and the updated GAF file (including the most recently updated chemoreceptor genes) was used to map GO terms to genes. All GO terms with a classic Fisher’s p-value < 0.005 were plotted. The color map from red to blue represents the p-value for the enrichment of each term, with the lowest p-values colored in red.; Supplementary Figure S6: TopGO analysis shows that peptidase functions are representative of the over-expressed genes in the Ir8a mutant antennae. TopGO analysis was performed at the Molecular Functions level, and the updated GAF file (including the most recently updated chemoreceptor genes) was used to map GO terms to genes. All GO terms with a classic Fisher’s p-value < 0.005 were plotted. The color map from red to blue represents the p-value for the enrichment of each term, with the lowest p-values colored in red.; Supplementary Figure S7: Expanded heatmaps show relative expression levels between strains for different chemoreceptor classes.; Supplementary Figure S8: Confirmation of the distinction between Mip120a (AAEL005893) and Mip120b (AAEL020020) present in the Ae. aegypti genome. Negative controls with no template were used for each primer set. A separate “Set 1” primer set was used for each gene, consisting of a forward primer, which annealed to both Mip120 genes (Mip120_F1) and either of two gene specific reverse primers. A separate “Set 2” primer set was used for each gene, consisting of a reverse primer, which annealed to both Mip120 genes (Mip120_R2) and either of two gene specific forward primers. All four primer sets were designed to amplify a differently sized amplicon, and the expected sizes are annotated below each band. PCR amplification was performed in a single experiment, and a few non-specific amplification bands were observed in Set 1-AAEL020020 PCR.; Supplementary Figure S9: Gene maps of Wildtype and mutant co-receptors Orco and Ir8a used in this study. Scalebars above all gene maps are 100 bp. Exon lengths are drawn to scale, while introns are artificially rendered at 100 bp. Diagrams were made using the Exon-Intron Graphic Maker at WormWeb.org. A. Comparison of the wildtype Orco gene in the Orco−16 mutant, with a 16bp deletion in the first exon, leading to a frameshift mutation. B. Comparison of the wildtype and mutant Ir8a genes. The Ir8a mutant contains a large cassette inserted into the second intron, leading to a frameshift mutation and constitutive expression of the dsRED protein under the control of the polyubiquitin promoter.; Supplementary Figure S10. PCR confirmation of the Ir8a−/− mutant strain. Primer Set 1 flanks the insertion site of the dsRED cassette, and amplifies a 238bp region in the wildtype Ae. aegypi. The large knock-in mutation of the dsRED cassette prevents amplification in mutants using Set 1. Primer Set 2 uses the forward primer from Set1, anchoring the amplicon in the Ir8a gene (exon 2). The reverse primer for Se t2 anneals to the polyubiquitin promoter in the dsRED cassette. Thus, a 439bp region will be amplified in the Ir8a−/− mutant, but not in the wildtype. Negative controls with no primers are included in the experiment.
Author Contributions
Conceptualization, M.M.C. and R.J.P.; Data curation, M.M.C. and R.J.P.; Formal analysis, M.M.C.; Funding acquisition, R.J.P.; Investigation, M.M.C. and M.S.C.II; Methodology, M.M.C., M.S.C.II and R.J.P.; Project administration, R.J.P.; Resources, R.J.P.; Software, M.M.C.; Supervision, R.J.P.; Validation, M.M.C. and R.J.P.; Visualization, M.M.C.; Writing—original draft, M.M.C.; Writing—review and editing, M.M.C., M.S.C.II and R.J.P. All authors have read and agreed to the published version of the manuscript.
Funding
This research was funded by the National Institutes of Health, National Institute of Allergy and Infectious Diseases, award numbers R01AI148300-01A1 and R15AI156684-01 to R.J.P.
Data Availability Statement
Supporting data and results are provided as Supplementary Materials, as described above. RNAseq reads have been deposited in the National Center for Biotechnology Information, Sequence Read Archive (project PRJNA1249520; sample files SRR33089554-SRR3308569).
Acknowledgments
The following reagent was obtained through BEI Resources, NIAID, NIH: Aedes aegypti Orlando orco16, NR-44378. The Ir8adsRED/dsRED strain was provided by Matthew DeGennaro (Florida International University). We thank Joseph Taube (Baylor University) use of the QuantStudio for qRT-PCR experiments. We also thank John Boyi and Everest Castaneda (Baylor University) for helpful discussions on bioinformatics analysis and Isuru Gunarathna (Baylor University) for assistance in creating a merged gff file for Ae. aegypti genome annotations. We acknowledge the use of ChatGPT generative AI to aid in writing R and python scripts.
Conflicts of Interest
The authors declare no conflicts of interest.
Abbreviations
The following abbreviations are used in this manuscript:
| Orco | Odorant Receptor Co-Receptor |
| OrX | Odorant Receptor Tuning Receptor |
| IrX | Ionotropic Receptor Tuning Receptor |
| GrX | Gustatory Receptor Tuning Receptor |
| DPE | Days Post Eclosion |
| ZT | Zeitgeber Time |
| GAF | General Annotation File |
| GFF | Generic Feature File |
| OSN | Olfactory Sensory Neuron |
| ORN | Odorant Receptor Neuron |
| DEG | Differentially Expressed Gene |
References
- Matthews, B.J.; Vosshall, L.B. How to turn an organism into a model organism in 10 ‘easy’ steps. J. Exp. Biol. 2020, 223, jeb218198. [Google Scholar] [CrossRef]
- Herre, M.; Goldman, O.V.; Lu, T.C.; Caballero-Vidal, G.; Qi, Y.; Gilbert, Z.N.; Gong, Z.; Morita, T.; Rahiel, S.; Ghaninia, M.; et al. Non-canonical odor coding in the mosquito. Cell 2022, 185, 3104–3123. [Google Scholar] [CrossRef]
- Task, D.; Lin, C.C.; Vulpe, A.; Afify, A.; Ballou, S.; Brbic, M.; Schlegel, P.; Raji, J.; Jefferis, G.; Li, H.; et al. Chemoreceptor co-expression in Drosophila melanogaster olfactory neurons. Elife 2022, 11, e72599. [Google Scholar] [CrossRef]
- Benton, R. Drosophila olfaction: Past, present and future. Proc. Biol. Sci. 2022, 289, 20222054. [Google Scholar] [CrossRef]
- Bohbot, J.; Pitts, R.J.; Kwon, H.W.; Rutzler, M.; Robertson, H.M.; Zwiebel, L.J. Molecular characterization of the Aedes aegypti odorant receptor gene family. Insect. Mol. Biol. 2007, 16, 525–537. [Google Scholar] [CrossRef]
- Ai, M.; Min, S.; Grosjean, Y.; Leblanc, C.; Bell, R.; Benton, R.; Suh, G.S. Acid sensing by the Drosophila olfactory system. Nature 2010, 468, 691–695. [Google Scholar] [CrossRef]
- Barrows, W.M. The reactions of the Pomace fly, Drosophila ampelophila loew, to odorous substances. J. Exp. Zool. 1907, 4, 515–537. [Google Scholar] [CrossRef]
- Shaw, W.R.; Catteruccia, F. Vector biology meets disease control: Using basic research to fight vector-borne diseases. Nat. Microbiol. 2019, 4, 20–34. [Google Scholar] [CrossRef]
- WHO. Dengue and Severe Dengue. Available online: https://www.who.int/news-room/fact-sheets/detail/dengue-and-severe-dengue (accessed on 12 December 2024).
- de Almeida, M.T.; Merighi, D.G.S.; Visnardi, A.B.; Boneto Goncalves, C.A.; Amorim, V.M.F.; Ferrari, A.S.A.; de Souza, A.S.; Guzzo, C.R. Latin America’s Dengue Outbreak Poses a Global Health Threat. Viruses 2025, 17, 57. [Google Scholar] [CrossRef]
- Vinauger, C.; Lutz, E.K.; Riffell, J.A. Olfactory learning and memory in the disease vector mosquito Aedes aegypti. J. Exp. Biol. 2014, 217, 2321–2330. [Google Scholar] [CrossRef]
- Mitra, S.; Pinch, M.; Kandel, Y.; Li, Y.; Rodriguez, S.D.; Hansen, I.A. Olfaction-related gene expression in the antennae of female mosquitoes from common Aedes aegypti laboratory strains. Front. Physiol. 2021, 12, 668236. [Google Scholar] [CrossRef]
- Tallon, A.K.; Lorenzo, M.G.; Moreira, L.A.; Martinez Villegas, L.E.; Hill, S.R.; Ignell, R. Dengue infection modulates locomotion and host seeking in Aedes aegypti. PLoS Neglected Trop. Dis. 2020, 14, e0008531. [Google Scholar] [CrossRef]
- Montell, C.; Zwiebel, L.J. Chapter Ten—Mosquito Sensory Systems. In Advances in Insect Physiology; Raikhel, A.S., Ed.; Academic Press: Cambridge, MA, USA, 2016; Volume 51, pp. 293–328. [Google Scholar]
- Jones, W.D.; Cayirlioglu, P.; Kadow, I.G.; Vosshall, L.B. Two chemosensory receptors together mediate carbon dioxide detection in Drosophila. Nature 2007, 445, 86–90. [Google Scholar] [CrossRef]
- Kwon, J.Y.; Dahanukar, A.; Weiss, L.A.; Carlson, J.R. The molecular basis of CO2 reception in Drosophila. Proc. Natl. Acad. Sci. USA 2007, 104, 3574–3578. [Google Scholar] [CrossRef]
- Sparks, J.T.; Dickens, J.C. Mini review: Gustatory reception of chemicals affecting host feeding in aedine mosquitoes. Pestic. Biochem. Physiol. 2017, 142, 15–20. [Google Scholar] [CrossRef]
- Bohbot, J.D.; Sparks, J.T.; Dickens, J.C. The maxillary palp of a model of multisensory integration. Insect Biochem. Mol. 2014, 48, 29–39. [Google Scholar] [CrossRef]
- Matthews, B.J.; Dudchenko, O.; Kingan, S.B.; Koren, S.; Antoshechkin, I.; Crawford, J.E.; Glassford, W.J.; Herre, M.; Redmond, S.N.; Rose, N.H.; et al. Improved reference genome of informs arbovirus vector control. Nature 2018, 563, 501–507. [Google Scholar] [CrossRef]
- Benton, R.; Vannice, K.S.; Gomez-Diaz, C.; Vosshall, L.B. Variant Ionotropic Glutamate Receptors as Chemosensory Receptors in Drosophila. Cell 2009, 136, 149–162. [Google Scholar] [CrossRef]
- Clyne, P.J.; Warr, C.G.; Freeman, M.R.; Lessing, D.; Kim, J.; Carlson, J.R. A novel family of divergent seven-transmembrane proteins: Candidate odorant receptors in Drosophila. Neuron 1999, 22, 327–338. [Google Scholar] [CrossRef]
- Rytz, R.; Croset, V.; Benton, R. Ionotropic receptors (IRs): Chemosensory ionotropic glutamate receptors in Drosophila and beyond. Insect Biochem. Mol. Biol. 2013, 43, 888–897. [Google Scholar] [CrossRef]
- Wicher, D.; Miazzi, F. Functional properties of insect olfactory receptors: Ionotropic receptors and odorant receptors. Cell Tissue Res. 2021, 383, 7–19. [Google Scholar] [CrossRef] [PubMed]
- Pullmann-Lindsley, H.; Huff, R.M.; Boyi, J.; Pitts, R.J. Odorant receptors for floral- and plant-derived volatiles in the yellow fever mosquito, Aedes aegypti (Diptera: Culicidae). PLoS ONE 2024, 19, e0302496. [Google Scholar] [CrossRef]
- Ray, G.; Huff, R.M.; Castillo, J.S.; Bellantuono, A.J.; DeGennaro, M.; Pitts, R.J. Carboxylic acids that drive mosquito attraction to humans activate ionotropic receptors. PLoS Neglected Trop. Dis. 2023, 17, e0011402. [Google Scholar] [CrossRef] [PubMed]
- Prieto-Godino, L.L.; Rytz, R.; Bargeton, B.; Abuin, L.; Arguello, J.R.; Peraro, M.D.; Benton, R. Olfactory receptor pseudo-pseudogenes. Nature 2016, 539, 93–97. [Google Scholar] [CrossRef] [PubMed]
- Raji, J.I.; Melo, N.; Castillo, J.S.; Gonzalez, S.; Saldana, V.; Stensmyr, M.C.; DeGennaro, M. Aedes aegypti mosquitoes detect acidic volatiles found in human odor using the IR8a pathway. Curr. Biol. 2019, 29, 1253–1262. [Google Scholar] [CrossRef]
- Raji, J.I.; Potter, C.J. Chemosensory ionotropic receptors in human host-seeking mosquitoes. Curr. Opin. Insect Sci. 2022, 54, 100967. [Google Scholar] [CrossRef]
- Cooke, M.; Chembars II, M.S.; Pitts, R.J. The conserved IR75 subfamily mediates carboxylic acid detection in insects of public health and agricultural importance. J. Insect Sci. 2025, 25, ieaf012. [Google Scholar] [CrossRef]
- Hwang, Y.-S.; Schultz, G.W.; Axelrod, H.; Kramer, W.L.; Mulla, M.S. Ovipositional repellency of fatty acids and their derivatives against Culex and Aedes mosquitoes. Environ. Entomol. 1982, 11, 223–226. [Google Scholar] [CrossRef]
- Wang, Y.; Qiu, L.; Wang, B.; Guan, Z.; Dong, Z.; Zhang, J.; Cao, S.; Yang, L.; Wang, B.; Gong, Z.; et al. Structural basis for odorant recognition of the insect odorant receptor OR-Orco heterocomplex. Science 2024, 384, 1453–1460. [Google Scholar] [CrossRef]
- Zhao, J.; Chen, A.Q.; Ryu, J.; Del Marmol, J. Structural basis of odor sensing by insect heteromeric odorant receptors. Science 2024, 384, 1460–1467. [Google Scholar] [CrossRef]
- Huff, R.M.; Pitts, R.J. Carboxylic acid responses by a conserved odorant receptor in culicine vector mosquitoes. Insect Mol. Biol. 2020, 29, 523–530. [Google Scholar] [CrossRef] [PubMed]
- Morita, T.; Lyn, N.G.; von Heynitz, R.K.; Goldman, O.V.; Sorrells, T.R.; DeGennaro, M.; Matthews, B.J.; Houri-Zeevi, L.; Vosshall, L.B. Cross-modal sensory compensation increases mosquito attraction to humans. Sci. Adv. 2025, 11, eadn5758. [Google Scholar] [CrossRef]
- De Obaldia, M.E.; Morita, T.; Dedmon, L.C.; Boehmler, D.J.; Jiang, C.S.; Zeledon, E.V.; Cross, J.R.; Vosshall, L.B. Differential mosquito attraction to humans is associated with skin-derived carboxylic acid levels. Cell 2022, 185, 4099–4116. [Google Scholar] [CrossRef] [PubMed]
- Larsson, M.C.; Domingos, A.I.; Jones, W.D.; Chiappe, M.E.; Amrein, H.; Vosshall, L.B. Or83b encodes a broadly expressed odorant receptor essential for Drosophila olfaction. Neuron 2004, 43, 703–714. [Google Scholar] [CrossRef]
- DeGennaro, M.; McBride, C.S.; Seeholzer, L.; Nakagawa, T.; Dennis, E.J.; Goldman, C.; Jasinskiene, N.; James, A.A.; Vosshall, L.B. Orco mutant mosquitoes lose strong preference for humans and are not repelled by volatile DEET. Nature 2013, 498, 487–491. [Google Scholar] [CrossRef] [PubMed]
- Ai, M.; Blais, S.; Park, J.Y.; Min, S.; Neubert, T.A.; Suh, G.S. Ionotropic glutamate receptors IR64a and IR8a form a functional odorant receptor complex in vivo in Drosophila. J. Neurosci. 2013, 33, 10741–10749. [Google Scholar] [CrossRef]
- Benton, R.; Sachse, S.; Michnick, S.W.; Vosshall, L.B. Atypical membrane topology and heteromeric function of Drosophila odorant receptors in vivo. PLoS Biol. 2006, 4, e20. [Google Scholar] [CrossRef] [PubMed]
- Abuin, L.; Prieto-Godino, L.L.; Pan, H.; Gutierrez, C.; Huang, L.; Jin, R.; Benton, R. In vivo assembly and trafficking of olfactory Ionotropic Receptors. BMC Biol. 2019, 17, 34. [Google Scholar] [CrossRef]
- Chiang, A.; Priya, R.; Ramaswami, M.; Vijayraghavan, K.; Rodrigues, V. Neuronal activity and Wnt signaling act through Gsk3-beta to regulate axonal integrity in mature Drosophila olfactory sensory neurons. Development 2009, 136, 1273–1282. [Google Scholar] [CrossRef]
- Hueston, C.E.; Olsen, D.; Li, Q.; Okuwa, S.; Peng, B.; Wu, J.; Volkan, P.C. Chromatin Modulatory Proteins and Olfactory Receptor Signaling in the Refinement and Maintenance of Fruitless Expression in Olfactory Receptor Neurons. PLoS Biol. 2016, 14, e1002443. [Google Scholar] [CrossRef]
- Task, D.; Potter, C.J. Rapid degeneration of Drosophila olfactory neurons in Orco mutant maxillary palps. MicroPubl. Biol. 2021. [CrossRef]
- Long, T.; Mohapatra, P.; Ballou, S.; Menuz, K. Odorant receptor co-receptors affect expression of tuning receptors in Drosophila. Front. Cell Neurosci. 2024, 18, 1390557. [Google Scholar] [CrossRef] [PubMed]
- Ray, A.; van der Goes van Naters, W.; Shiraiwa, T.; Carlson, J.R. Mechanisms of odor receptor gene choice in Drosophila. Neuron 2007, 53, 353–369. [Google Scholar] [CrossRef]
- Khan, M.; Vaes, E.; Mombaerts, P. Regulation of the probability of mouse odorant receptor gene choice. Cell 2011, 147, 907–921. [Google Scholar] [CrossRef]
- Magklara, A.; Lomvardas, S. Stochastic gene expression in mammals: Lessons from olfaction. Trends Cell Biol. 2013, 23, 449–456. [Google Scholar] [CrossRef]
- Jafari, S.; Alkhori, L.; Schleiffer, A.; Brochtrup, A.; Hummel, T.; Alenius, M. Combinatorial activation and repression by seven transcription factors specify Drosophila odorant receptor expression. PLoS Biol. 2012, 10, e1001280. [Google Scholar] [CrossRef] [PubMed]
- Bai, L.; Goldman, A.; Carlson, J. Positive and Negative Regulation of Odor Receptor Gene Choice in Drosophila by Acj6. J. Neurosci. 2009, 29, 12940–12947. [Google Scholar] [CrossRef]
- Jafari, S.; Alenius, A. Cis-regulatory mechanisms for robust olfactory sensory neuron class-restricted odorant receptor gene expression in Drosophila. PLOS Genet. 2015, 11, e1005051. [Google Scholar] [CrossRef]
- Tichy, A.L.; Ray, A.; Carlson, J.R. A new Drosophila POU Gene, pdm3, acts in odor receptor expression and axon targeting of olfactory neurons. J. Neurosci. 2008, 28, 7121–7129. [Google Scholar] [CrossRef]
- Gonzalez, A.; Jafari, S.; Zenere, A.; Alenius, M.; Altafini, C. Thermodynamic model of gene regulation for the Or59b olfactory receptor in Drosophila. PLoS Comp. Biol. 2019, 15, e1006709. [Google Scholar] [CrossRef]
- Ray, A.; van der Goes van Naters, W.; Carlson, J.R. A regulatory code for neuron-specific odor receptor expression. PLoS Biol. 2008, 6, e125. [Google Scholar] [CrossRef] [PubMed]
- Mika, K.; Cruchet, S.; Chai, C.P.; Prieto-Godino, L.L.; Auer, T.O.; Pradervand, S.; Benton, R. Olfactory receptor-dependent receptor repression in Drosophila. Sci. Adv. 2021, 7, eabe3745. [Google Scholar] [CrossRef] [PubMed]
- McFarlane, M.; Almire, F.; Kean, J.; Donald, C.L.; McDonald, A.; Wee, B.; Lauréti, M.; Varjak, M.; Terry, S.; Vazeille, M.; et al. The Aedes aegypti Domino ortholog p400 regulates antiviral exogenous small interfering RNA pathway activity and ago-2 expression. Msphere 2020, 5, e00081-20. [Google Scholar] [CrossRef]
- Bolger, A.M.; Lohse, M.; Usadel, B. Trimmomatic: A flexible trimmer for Illumina sequence data. Bioinformatics 2014, 30, 2114–2120. [Google Scholar] [CrossRef]
- Mejía, A.; Mejía-Jaramillo, A.M.; Fernandez, G.J.; Granada, Y.; Lowenberger, C.; Triana-Chávez, O. Long-Term exposure to lambda-cyhalothrin reveals novel genes potentially involved in Aedes aegypti insecticide resistance. Insects 2025, 16, 106. [Google Scholar] [CrossRef] [PubMed]
- Ward, C.M.; To, T.H.; Pederson, S.M. ngsReports: A Bioconductor package for managing FastQC reports and other NGS related log files. Bioinformatics 2020, 36, 2587–2588. [Google Scholar] [CrossRef]
- Patro, R.; Duggal, G.; Love, M.I.; Irizarry, R.A.; Kingsford, C. Salmon provides fast and bias-aware quantification of transcript expression. Nat. Methods 2017, 14, 417–419. [Google Scholar] [CrossRef]
- Soneson, C.; Love, M.I.; Robinson, M.D. Differential analyses for RNA-seq: Transcript-level estimates improve gene-level inferences. F1000Research 2015, 4, 1521. [Google Scholar] [CrossRef] [PubMed]
- Love, M.; Anders, S.; Huber, W. Differential analysis of count data–the DESeq2 package. Genome Biol. 2014, 15, 10–1186. [Google Scholar]
- Love, M.I.; Huber, W.; Anders, S. Moderated estimation of fold change and dispersion for RNA-seq data with DESeq2. Genome Biol. 2014, 15, 550. [Google Scholar] [CrossRef]
- Pertea, G.; Pertea, M. GFF utilities: GffRead and GffCompare. F1000Research 2020, 9, 304. [Google Scholar] [CrossRef]
- Jones, P.; Binns, D.; Chang, H.; Fraser, M.; Li, W.; McAnulla, C.; McWilliam, H.; Maslen, J.; Mitchell, A.; Nuka, G.; et al. InterProScan 5: Genome-scale protein function classification. Bioinformatics 2014, 30, 1236–1240. [Google Scholar] [CrossRef]
- Zur Lage, P.I.; Prentice, D.R.A.; Holohan, E.E.; Jarman, A.P. The Drosophila proneural gene amos promotes olfactory sensillum formation and suppresses bristle formation. Development 2003, 130, 4683–4693. [Google Scholar] [CrossRef]
- Hartl, M.; Loschek, L.F.; Stephan, D.; Siju, K.P.; Knappmeyer, C.; Kadow, I.C.G. A New Prospero and microRNA-279 Pathway Restricts CO2 Receptor Neuron Formation. J. Neurosci. 2011, 31, 15660–15673. [Google Scholar] [CrossRef] [PubMed]
- Goulding, S.E.; zur Lage, P.; Jarman, A.P. Amos, a proneural gene for Drosophila olfactory sense organs that is regulated by lozenge. Neuron 2000, 25, 69–78. [Google Scholar] [CrossRef] [PubMed]
- Okumura, M.; Kato, T.; Miura, M.; Chihara, T. Hierarchical axon targeting of Drosophila olfactory receptor neurons specified by the proneural transcription factors Atonal and Amos. Genes Cells 2016, 21, 53–64. [Google Scholar] [CrossRef]
- Verzi, M.P.; Anderson, J.P.; Dodou, E.; Kelly, K.K.; Greene, S.B.; North, B.J.; Cripps, R.M.; Black, B.L. N-twist, an evolutionarily conserved bHLH protein expressed in the developing CNS, functions as a transcriptional inhibitor. Dev. Biol. 2002, 249, 174–190. [Google Scholar] [CrossRef]
- Fujii, S.; Yavuz, A.; Slone, J.; Jagge, C.; Song, X.Y.; Amrein, H. Sugar receptors in sweet taste perception, olfaction, and internal nutrient sensing. Curr. Biol. 2015, 25, 621–627. [Google Scholar] [CrossRef]
- Jové, V.; Gong, Z.Y.; Hol, F.J.H.; Zhao, Z.L.; Sorrells, T.R.; Carroll, T.S.; Prakash, M.; McBride, C.S.; Vosshall, L.B. Sensory discrimination of blood and floral nectar by mosquitoes. Neuron 2020, 108, 1163–1180.e12. [Google Scholar] [CrossRef]
- Langmead, B.; Salzberg, S.L. Fast gapped-read alignment with Bowtie 2. Nat. Methods 2012, 9, 357–359. [Google Scholar] [CrossRef]
- Grant, C.E.; Bailey, T.L. XSTREME: Comprehensive motif analysis of biological sequence datasets. BioRxiv, 2021; submitted. [Google Scholar] [CrossRef]
- Rauluseviciute, I.; Riudavets-Puig, R.; Blanc-Mathieu, R.; Castro-Mondragon, J.; Ferenc, K.; Kumar, V.; Lemma, R.B.; Lucas, J.; Cheneby, J.; Baranasic, D.; et al. JASPAR 2024: 20th anniversary of the open-access database of transcription factor binding profiles. Nucleic Acids Res. 2024, 52, D174–D182. [Google Scholar] [CrossRef] [PubMed]
- Fukutani, K.F.; Kasprzykowski, J.I.; Paschoal, A.R.; Gomes, M.S.; Barral, A.; de Oliveira, C.I.; Ramos, P.I.P.; de Queiroz, A.T.L. Meta-Analysis of Aedes aegypti expression datasets: Comparing virus infection and blood-fed transcriptomes to identify markers of virus presence. Front. Bioeng. Biotechnol. 2017, 5, 84. [Google Scholar] [CrossRef]
- Sim, C.K.; Perry, S.; Tharadra, S.K.; Lipsick, J.S.; Ray, A. Epigenetic regulation of olfactory receptor gene expression by the Myb-MuvB/dREAM complex. Genes Dev. 2012, 26, 2483–2498. [Google Scholar] [CrossRef]
- Kaupp, U.B. Olfactory signaling in vertebrates and insects: Differences and commonalities. Nat. Rev. Neurosci. 2010, 11, 188–200. [Google Scholar] [CrossRef] [PubMed]
- Grabe, V.; Sachse, S. Fundamental principles of the olfactory code. Biosystems 2018, 164, 94–101. [Google Scholar] [CrossRef]
- Hallem, E.A.; Carlson, J.R. The odor coding system of Drosophila. Trends Genet. 2004, 20, 453–459. [Google Scholar] [CrossRef]
- Barnum, G.; Hong, E.J. Olfactory coding. Curr. Biol. 2022, 32, R1296–R1301. [Google Scholar] [CrossRef]
- Rodriguez, I. Singular Expression of Olfactory Receptor Genes. Cell 2013, 155, 274–277. [Google Scholar] [CrossRef]
- Lewcock, J.; Reed, R. A feedback mechanism regulates monoallelic odorant receptor expression. Proc. Nat. Acad. Sci. USA 2004, 101, 1069–1074. [Google Scholar] [CrossRef]
- Maguire, S.E.; Afify, A.; Goff, L.A.; Potter, C.J. Odorant-receptor-mediated regulation of chemosensory gene expression in the malaria mosquito Anopheles gambiae. Cell Rep. 2022, 38, 110494. [Google Scholar] [CrossRef] [PubMed]
- Fabian, B.; Sachse, S. Experience-dependent plasticity in the olfactory system of Drosophila melanogaster and other insects. Front. Cell. Neurosci. 2023, 17, 1130091. [Google Scholar] [CrossRef] [PubMed]
- Koerte, S.; Keesey, I.W.; Khallaf, M.A.; Llorca, L.C.; Grosse-Wilde, E.; Hansson, B.S.; Knaden, M. Evaluation of the DREAM Technique for a High-Throughput Deorphanization of Chemosensory Receptors in Drosophila. Front. Mol. Neurosci. 2018, 11, 366. [Google Scholar] [CrossRef] [PubMed]
- Shankar, S.; Giraldo, D.; Tauxe, G.M.; Spikol, E.D.; Li, M.; Akbari, O.S.; Wohl, M.P.; McMeniman, C.J. Optimized genetic tools for neuroanatomical and functional mapping of the Aedes aegypti olfactory system. G3 Genes|Genomes|Genet. 2025, 15, jkae307. [Google Scholar] [CrossRef]
- Pan, J.W.; McLaughlin, J.; Yang, H.; Leo, C.; Rambarat, P.; Okuwa, S.; Monroy-Eklund, A.; Clark, S.; Jones, C.D.; Volkan, P.C. Comparative analysis of behavioral and transcriptional variation underlying CO2 sensory neuron function and development in Drosophila. Fly 2017, 11, 239–252. [Google Scholar] [CrossRef]
- Georlette, D.; Ahn, S.; MacAlpine, D.M.; Cheung, E.; Lewis, P.W.; Beall, E.L.; Bell, S.P.; Speed, T.; Manak, J.R.; Botchan, M.R. Genomic profiling and expression studies reveal both positive and negative activities for the Drosophila Myb MuvB/dREAM complex in proliferating cells. Genes Dev. 2007, 21, 2880–2896. [Google Scholar] [CrossRef]
- Pu, J.; Chung, H. New and emerging mechanisms of insecticide resistance. Curr. Opin. Insect Sci. 2024, 63, 101184. [Google Scholar] [CrossRef]
- Brevik, K.; Schoville, S.D.; Mota-Sanchez, D.; Chen, Y.H. Pesticide durability and the evolution of resistance: A novel application of survival analysis. Pest Manag. Sci. 2018, 74, 1953–1963. [Google Scholar] [CrossRef]
Disclaimer/Publisher’s Note: The statements, opinions and data contained in all publications are solely those of the individual author(s) and contributor(s) and not of MDPI and/or the editor(s). MDPI and/or the editor(s) disclaim responsibility for any injury to people or property resulting from any ideas, methods, instructions or products referred to in the content. |
© 2025 by the authors. Licensee MDPI, Basel, Switzerland. This article is an open access article distributed under the terms and conditions of the Creative Commons Attribution (CC BY) license (https://creativecommons.org/licenses/by/4.0/).