Article

Selection and Validation of Stable Reference Genes for RT-qPCR in Scotogramma trifolii (Lepidoptera: Noctuidae)

1
Institute of Plant Protection, Xinjiang Uygur Autonomous Region Academy of Agricultural Sciences, Urumqi 830091, China
2
Key Laboratory of Integrated Pest Management on Crops in Northwestern Oasis, Ministry of Agriculture and Rural Affairs, National Plant Protection Scientific Observation and Experiment Station of Korla, Urumqi 830091, China
*
Author to whom correspondence should be addressed.
Insects 2025, 16(5), 527; https://doi.org/10.3390/insects16050527
Submission received: 3 April 2025 / Revised: 2 May 2025 / Accepted: 5 May 2025 / Published: 15 May 2025
(This article belongs to the Section Insect Molecular Biology and Genomics)

Simple Summary

Real-time quantitative polymerase chain reaction (RT-qPCR) is a powerful technique for quantifying gene expression, with the selection of stable reference genes being critical for accurate normalization of expression data. In this study, we systematically evaluated the expression stability of six candidate reference genes (β-actin, RPL9, GAPDH, RPL10, EF1-α, and TUB) across four developmental stages (egg, larva, pupa, and adult) and six adult tissues (head, thorax, abdomen, wings, legs, and antennae) of Scotogramma trifolii using four algorithmic tools (geNorm, NormFinder, BestKeeper, and RefFinder). Our results identified β-actin, RPL9, and GAPDH as the most stable reference genes for developmental stage normalization, while RPL10, GAPDH, and TUB were validated for adult tissues. Functional validation using the odorant receptor gene StriOR20 demonstrated significant differences in relative expression levels when normalized with unstable reference genes (TUB and RPL9), underscoring the importance of appropriate reference gene selection. This study establishes the first validated set of reference genes for S. trifolii, providing a foundational resource for future gene expression studies in this agriculturally important pest species.

Abstract

The clover cutworm, Scotogramma trifolii Rottemberg (Lepidoptera: Noctuidae), is a globally distributed polyphagous pest causing significant economic losses to agricultural crops. RT-qPCR is a gold-standard technique for gene expression analysis, yet its accuracy depends critically on stable reference genes for data normalization. To address the lack of validated reference genes in S. trifolii, we evaluated six candidate genes (β-actin, RPL9, GAPDH, RPL10, EF1-α, and TUB) across four developmental stages (egg, larva, pupa, and adult) and six adult tissues (head, thorax, abdomen, wings, legs, and antennae) using geNorm, NormFinder, BestKeeper, and RefFinder algorithms. Stability analysis identified β-actin, RPL9, and GAPDH as the most reliable reference genes for developmental stage normalization, while RPL10, GAPDH, and TUB were validated for adult tissues. Functional validation using the odorant receptor gene StriOR20 revealed significant discrepancies in relative expression levels when normalized with unstable reference genes (TUB and RPL9), emphasizing the necessity of rigorous reference gene selection. This study establishes the first comprehensive reference gene panel for S. trifolii, providing a robust foundation for gene expression studies in this agriculturally important pest.

1. Introduction

Scotogramma trifolii Rottemberg, a globally distributed polyphagous leaf-feeding pest [1], exhibits highly mobile larvae with metastatic feeding behavior [2]. It is a partially explosive pest in northern China and has a wide range of hosts, feeding on more than 20 types of crops in 8 families and 27 types of weeds and causing damage to Beta vulgaris, Gossypium herbaceum, Linum usitatissimum, Solanum tuberosum, Arachis hypogaea, Zea mays, Helianthus annuus, Ricinus communis, Glycine max, Triticum aestivum, and cruciferous vegetables, thus threatening food security and the sustainable development of agriculture [3,4]. RT-qPCR is a cornerstone technique in molecular biology for quantifying gene expression across diverse biological contexts [5,6,7]. Renowned for its high sensitivity, specificity, and reproducibility [8], RT-qPCR remains susceptible to multiple confounding variables that can compromise data accuracy. Key sources of variability include RNA quality and quantity, primer specificity and amplification efficiency, cDNA synthesis efficiency, PCR reaction conditions, and experimental variability [9,10,11,12,13,14,15]. To address these challenges, normalization using stably expressed reference genes serves as a critical strategy to mitigate experimental noise and ensure reliable target gene quantification [16,17,18,19].
In lepidopteran gene expression studies, commonly employed reference genes include glyceraldehyde-3-phosphate dehydrogenase (GAPDH), β-actin, translation elongation factor 1α (TEF-1α), phospholipase A2 (PLA2), arginine kinase (AK), tubulin (TUB), TATA-binding protein (TBP), and ribosomal proteins (RPLs) [20,21,22,23,24,25,26]. While these genes are often assumed to exhibit constitutive expression across experimental conditions [27,28], the current “reference genes” are not stable under different experimental conditions and samples, and homologous reference genes show inconsistent expression stability under the same experimental conditions in different species [29]. Therefore, it is necessary to evaluate the stability of reference genes under different conditions.
In this study, we selected six candidate genes of S. trifoli, including GAPDH, RPL9, RPL10, EF1-α, TUB, and β-actin, and evaluated their expression stability in a spatiotemporal manner using four software programs, including geNorm v3.5, NormFinder v0.953, BestKeeper, and RefFinder. Furthermore, we assessed the expression profiles of odorant receptor genes (StriOR20) to verify the accuracy and reliability of the selected reference genes. This study will provide stable reference genes for analyzing the gene expression in S. trifolii.

2. Materials and Methods

2.1. Insect Rearing

The S. trifolii specimens were originally collected from sugar beet fields in Changji City, Xinjiang Uygur Autonomous Region, China, and have been successfully maintained for over 20 generations under controlled laboratory conditions at the Institute of Plant Protection, Xinjiang Academy of Agricultural Sciences (Urumqi, China). Larval stages were reared on a standardized artificial diet, while adult populations were maintained in mesh-rearing cages with ad libitum access to 10% honey water. All life stages were cultured under controlled environmental parameters: 26 ± 1 °C temperature, 70 ± 5% relative humidity, and a 16L:8D photoperiod.

2.2. Experimental Design and Sample Collection

Biological specimens were categorized into the following two experimental cohorts: developmental stages (egg, larva, pupa, and adult) and adult tissue types (head, thorax, abdomen, wing, leg, and antenna). Five biological replicates were established for each sample category. Post-collection, specimens were immediately transferred to 1.5 mL microcentrifuge tubes, subjected to liquid nitrogen flash-freezing, and archived at −80 °C until use in downstream assays.

2.2.1. Developmental State

Biological specimens were classified into four developmental modules: eggs, larval instars (1st–6th), sex-specific pupae (male and female), and sex-specific adults (male and female). For each biological replicate, sample sizes were standardized as follows: 30 eggs, 20 first-instar larvae, 10 second-instar larvae, and one individual each for third- to sixth-instar larvae, male pupae, female pupae, unmated male adults, and unmated female adults. All samples were randomly selected from a single population, yielding a total of 55 specimens (11 developmental modules × 5 replicates).

2.2.2. Adult Tissues

Adult tissue samples were dissected as follows: antennae (15 pairs per replicate), antennae-removed heads (2 individuals), wing-/leg-free thorax (1 individual), whole abdomens (1 individual), wings (3 individuals), and legs (3 individuals). Each of the six tissue types was dissected under stereomicroscopy, immediately transferred to 1.5 mL microcentrifuge tubes, and stored on dry ice during collection. This yielded 30 specimens in total (6 tissues × 5 biological replicates).

2.3. Total RNA Extraction and cDNA First Strand Synthesis

Total RNA isolation from each sample was performed using the TransZol Up Plus RNA Kit (ER501-01-V2, TransGen Biotech, Beijing, China) following the manufacturer’s protocol. Post-isolation, RNA concentration and purity were quantified using a NanoDrop 2000c spectrophotometer (Thermo Fisher Scientific, Waltham, MA, USA). First-strand cDNA synthesis was conducted using 1 μg of total RNA with the EasyScript® One-Step gDNA Removal and cDNA Synthesis SuperMix (AE311, TransGen Biotech, Beijing, China) according to the supplier’s guidelines. Following cDNA synthesis, reactions were immediately stored at −20 °C until use in RT-qPCR analyses.

2.4. Candidate Reference Genes and Primer Design

Six candidate reference genes (GAPDH, RPL9, RPL10, EF1-α, TUB, and β-actin) were selected from S. trifolii transcriptomic datasets (unpublished) based on common usage in insect gene expression studies. Primers for amplifying internal reference gene fragments were designed using Primer Premier 5.0 (Premier Biosoft International, Palo Alto, CA, USA) (Table 1), while locus-specific RT-qPCR primer pairs were developed using Beacon Designer 8.0 (Bio-Rad, Hercules, CA, USA) from validated transcript sequences (Table 2). All primers were commercially synthesized by Sangon Biotech (Shanghai, China), and the resulting RT-PCR amplicon sequences were deposited in GenBank under accession numbers PV394231-PV394236.

2.5. Standard Curve Construction and RT-qPCR

To determine primer efficiency and specificity, a 6-point 5-fold serial dilution series (1/5, 1/25, 1/125, 1/625, 1/3125, and 1/15625) of standard cDNA template was employed to generate RT-qPCR standard curves for each primer pair. Amplification efficiency (E) was calculated using the formula E = (10(−1/slope) − 1) × 100 [30]. Expression profiling of reference genes was conducted using the QuantStudio 6 Flex Real-Time PCR System (Thermo Fisher Scientific). Reaction components included 10 μL of 2 × PerfectStart™ Green qPCR SuperMix (AQ601-01-V2, TransGen Biotech, Beijing, China), 0.4 μL each of forward and reverse primers (10 μM), and 1 μL of 5-fold diluted cDNA template. Thermal cycling conditions were 95 °C for 5 min, followed by 40 cycles of 95 °C for 15 s and 60 °C for 30 s. Three technical replicates were performed per biological replicate, with melt curve analysis included to verify amplicon specificity.

2.6. Stability Analysis

Expression stability of candidate reference genes was evaluated using four computational algorithms: geNorm v3.5 [13], NormFinder v0.953 [31], BestKeeper [32], and RefFinder [33] (https://www.ciidirsinaloa.com.mx/RefFinder-master/, accessed 21 February 2025). Stability metrics were calculated as follows: geNorm: M-values (lower values indicate higher stability); NormFinder: Stability values (SV; lower SV indicates better stability); BestKeeper: Standard deviation (SD; lower SD reflects higher stability); and RefFinder: Geometric mean (GM) of normalized ranks derived from the four algorithms. Optimal reference gene number was determined by geNorm pairwise variation analysis (Vn/Vn + 1). A threshold of 0.15 was applied: if Vn/Vn + 1 ≤ 0.15, n reference genes were deemed sufficient; otherwise, n + 1 genes were recommended for RT-qPCR normalization.

2.7. Stability Validation of Candidate Reference Genes

To validate the stability of top-ranked and least stable reference genes, odorant receptor 20 (StriOR20; GenBank: PV394237) was selected as the target gene. Relative expression levels of StriOR20 were quantified using the 2−ΔΔCt method [34] based on threshold cycle (Ct) values, with five biological replicates included in the analysis.

2.8. Statistical Analysis

Statistical analysis of reference gene stability values was performed using four computational tools. Significant differences were determined via one-way ANOVA followed by Tukey’s post hoc test in IBM SPSS Statistics 25.0 (IBM Corp., Armonk, NY, USA), with statistical significance set at p < 0.05. All data visualizations, including boxplots and heatmaps, were generated using GraphPad Prism 10.1.2 (GraphPad Software, San Diego, CA, USA).

3. Results

3.1. Specificity and Amplification Efficiency of RT-qPCR Primers

The primers for RT-qPCR were designed for six reference genes with amplification lengths of 79 bp (GAPDH) to 161 bp (RPL9) (Table 2). The results showed that the melting curves of the six reference genes were all single peaks (Figure S1), indicating the high specificity of the RT-qPCR primers. The amplification efficiencies of the primers ranged from 90.951% (TUB) to 108.777% (RPL9), and the regression coefficients (R2) ranged from 0.990 (β-actin, GAPDH, and RPL9) to 0.999 (TUB) (Table 2), indicating that the designed primers met the requirements of RT-qPCR experiments.

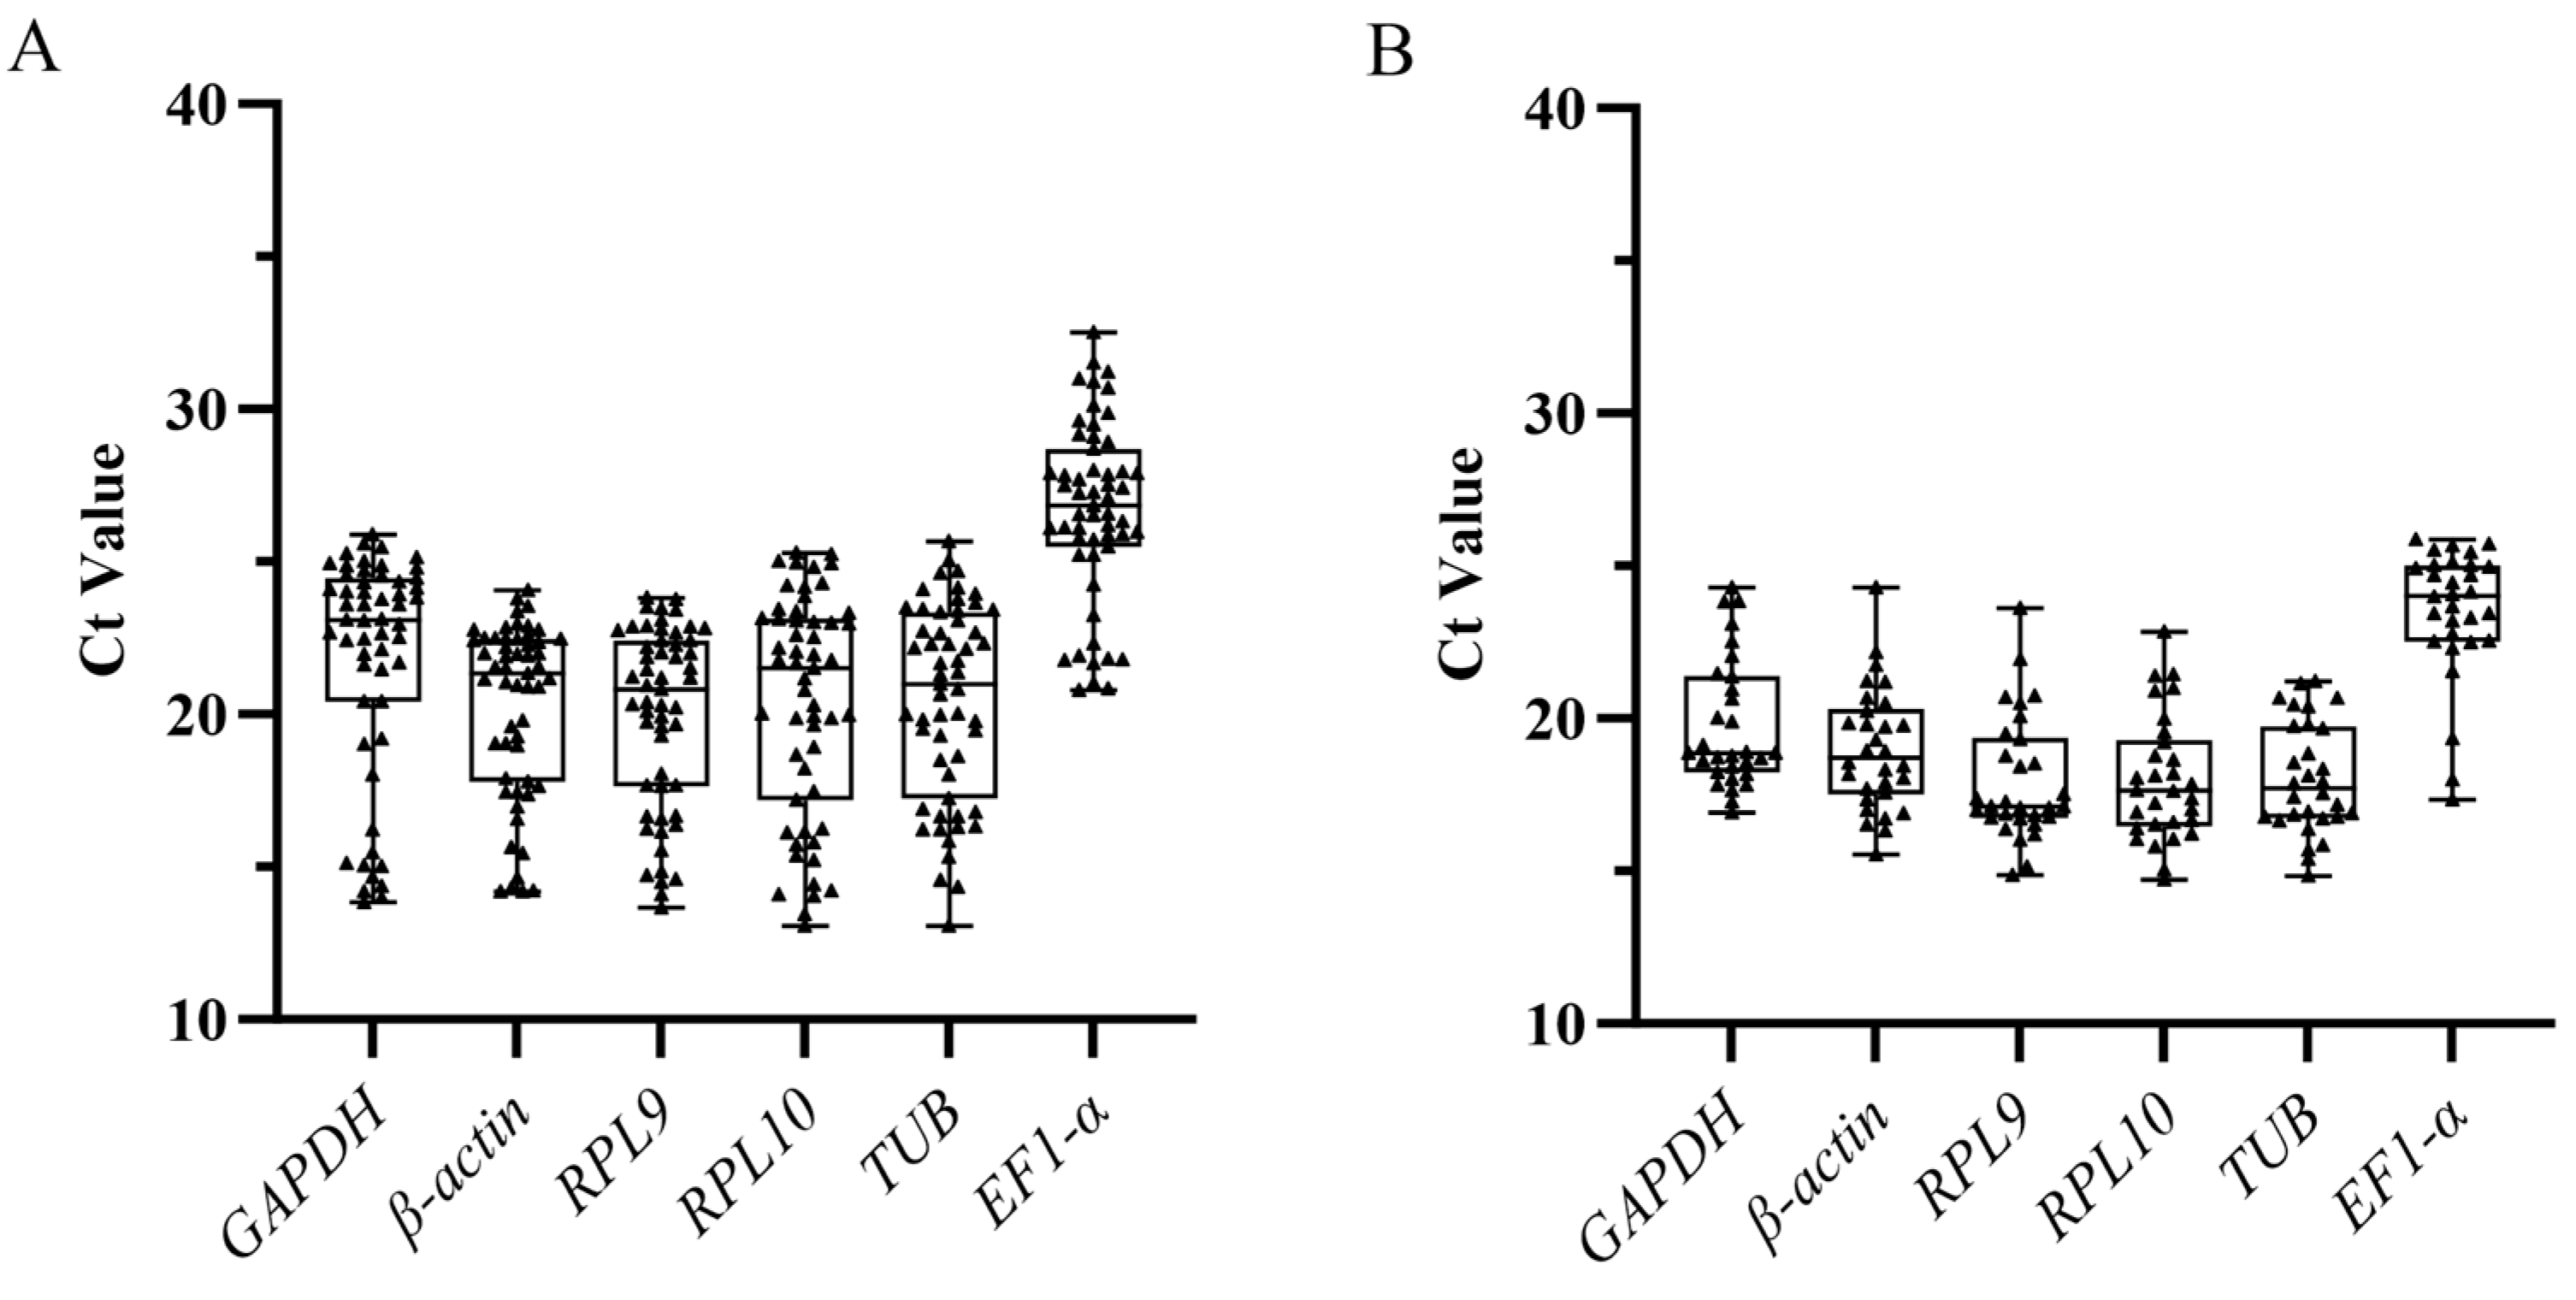
3.2. Expression Level of Six Candidate Reference Genes

The expression levels of the six candidate internal reference genes were evaluated using the Ct values obtained from RT-qPCR analysis. At different developmental stages, the expression of RPL9 was the highest (Ct = 19.94); the expression of EF1-α was the lowest (Ct = 26.64); the expression of β-actin was the least variable (14.186–24.050) with a variation of 9.864; and the expression of GAPDH was the most variable (13.849–25.897) with a variation of 12.048. In adult tissues, the expression level of RPL9 (Ct = 17.94) was the highest, while that of EF1-α (Ct = 23.50) was the lowest. TUB showed the lowest variation (14.837–21.213) with a variation of 6.376, and β-actin showed the highest variation (15.527–24.284) with a variation of 8.757 (Figure 1).

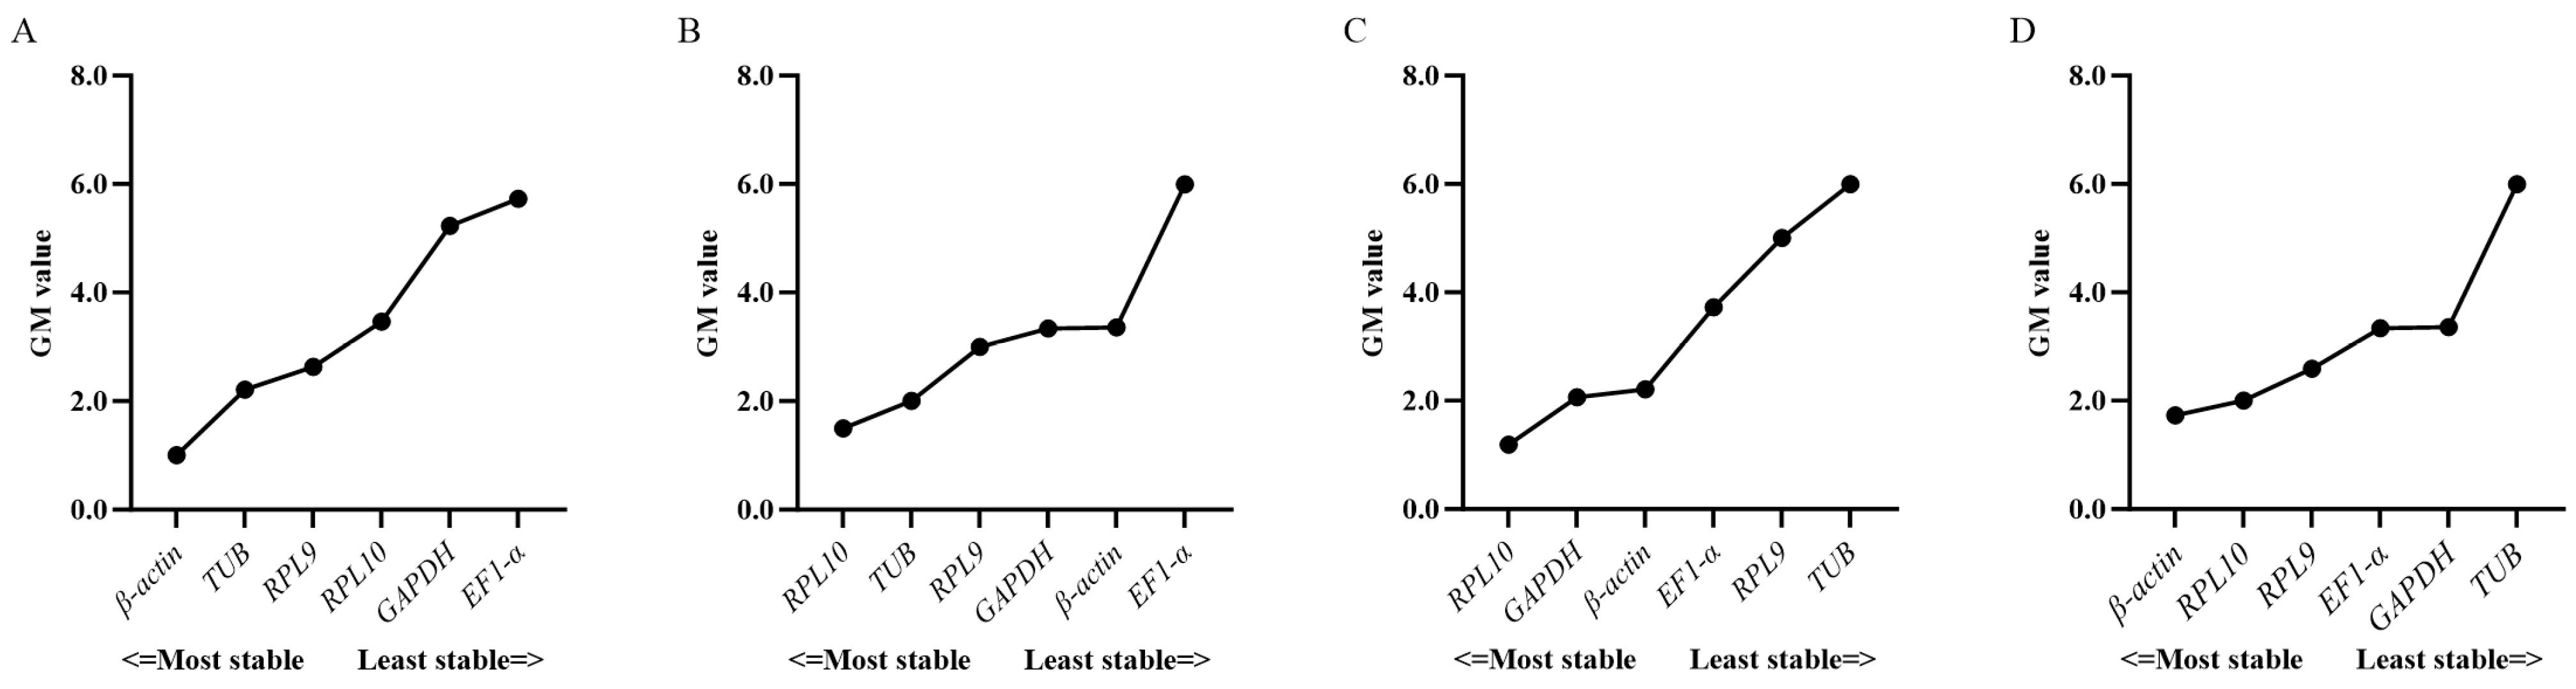
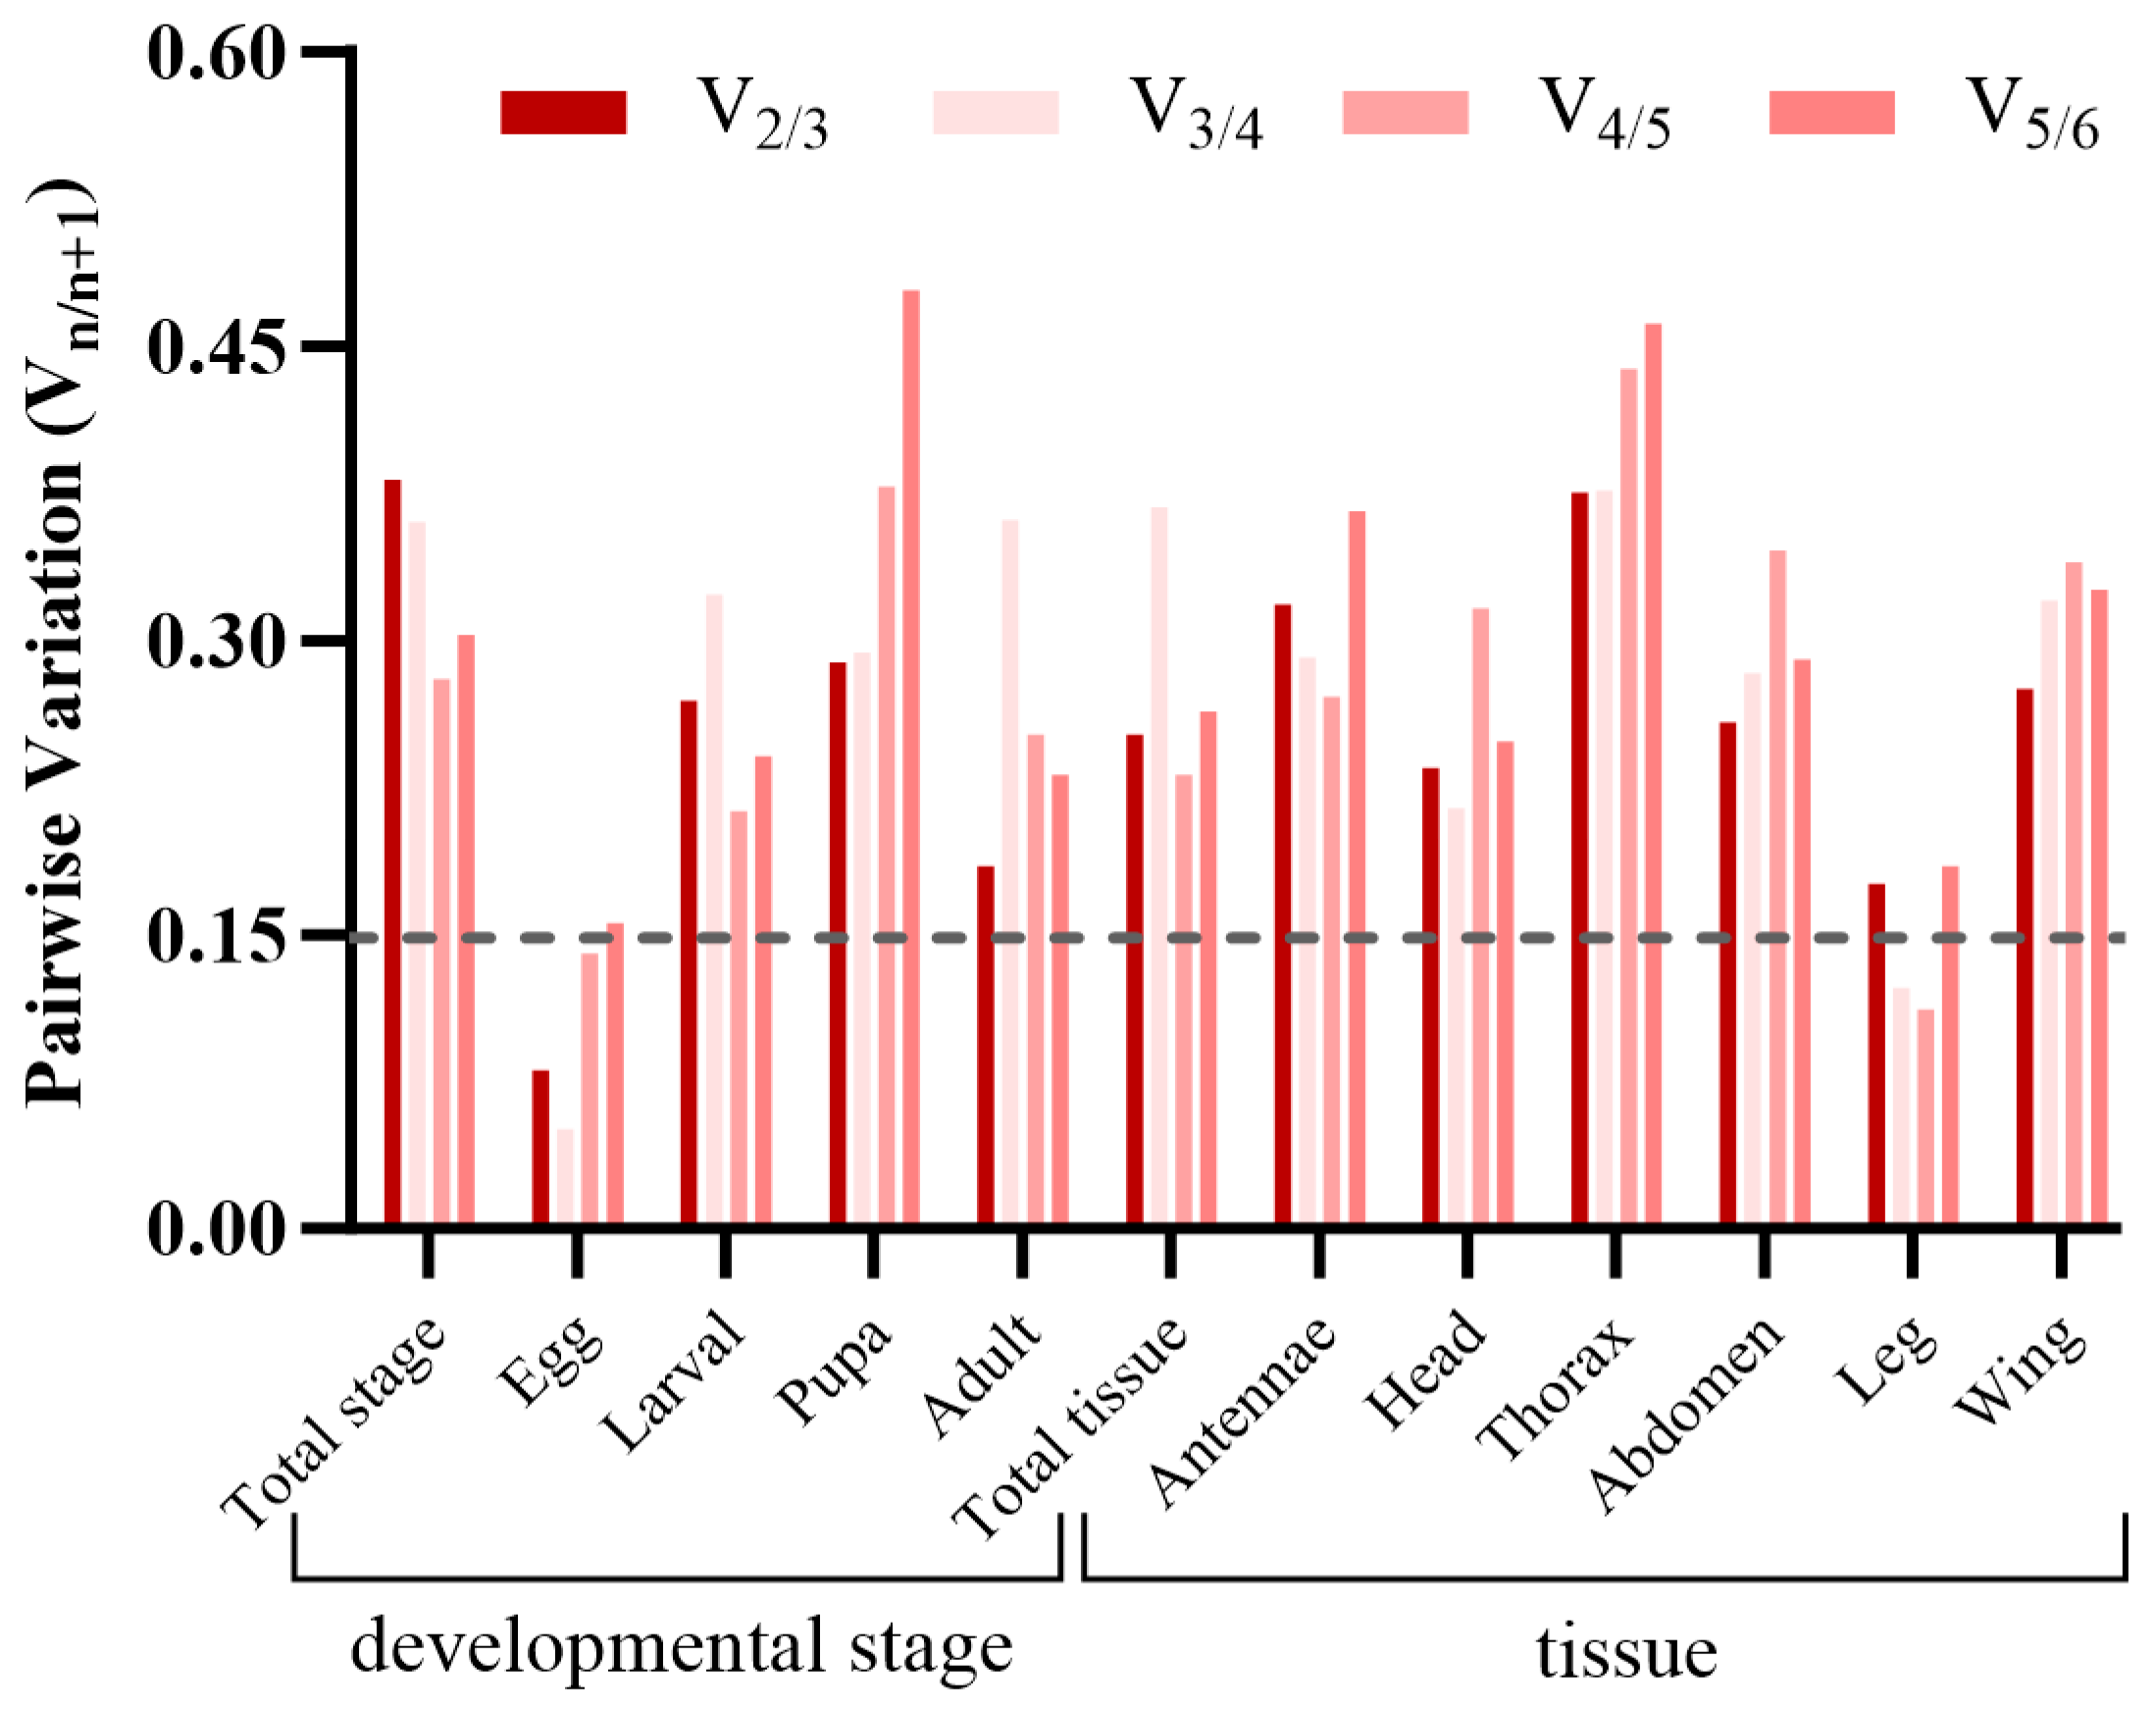
3.3. Expression Stability of Candidate Reference Genes

Based on RefFinder (Figure 2) and geNorm (Figure 3) analyses, the most stable reference genes in the egg stage were β-actin and TUB; RPL10, TUB, and RPL9 were the most stable in the larval stage; RPL10, GAPDH, and β-actin were the most stable in the pupal stage; and β-actin, RPL10, and RPL9 were the most stable in the adult stage. In all developmental stages, combined geNorm and NormFinder algorithms identified β-actin and RPL9 as the two most stable reference genes. BestKeeper analysis independently validated β-actin and EF1-α as the most reliable normalizers. A comprehensive stability ranking generated by RefFinder demonstrated the following descending order: β-actin > RPL9 > GAPDH > EF1-α > RPL10 > TUB (Figure 4). geNorm analysis indicated a pairwise variation value of V2/3 = 0.381 (greater than the 0.15 threshold), supporting the use of three reference genes for accurate normalization. Based on this criterion and stability rankings, the optimal combination for developmental stage normalization was determined to be β-actin, RPL9, and GAPDH (Figure 3).
According to the RefFinder and geNorm analyses of the expression stability of the reference genes in six adult tissues. RPL10, TUB, and EF1-α were the most stably expressed in the antennae; RPL10, GAPDH, and EF1-α were the most stably expressed in the head; RPL10, RPL9, and GAPDH were the most stably expressed in the thorax; GAPDH, RPL9, and TUB were the most stably expressed in the abdomen; β-actin, TUB, and GAPDH were the most stably expressed in the leg; and β-actin, GAPDH, and TUB were the most stably expressed in the wing (Figure 3 and Figure 5). In total adult tissues, geNorm identified GAPDH and RPL9 as the most stable reference genes, NormFinder ranked RPL10 highest, and BestKeeper validated TUB as the optimal normalizer. Finally, a comprehensive stability hierarchy derived from RefFinder demonstrated the following descending order: RPL10 > GAPDH > TUB > β-actin > EF1-α > RPL9 (Figure 6). geNorm analysis indicated a pairwise variation value of V2/3 = 0.252, which exceeds the 0.15 threshold for stability, supporting the inclusion of three reference genes. Specifically, RPL10, GAPDH, and TUB were selected for adult tissue normalization based on this criterion (Figure 3).

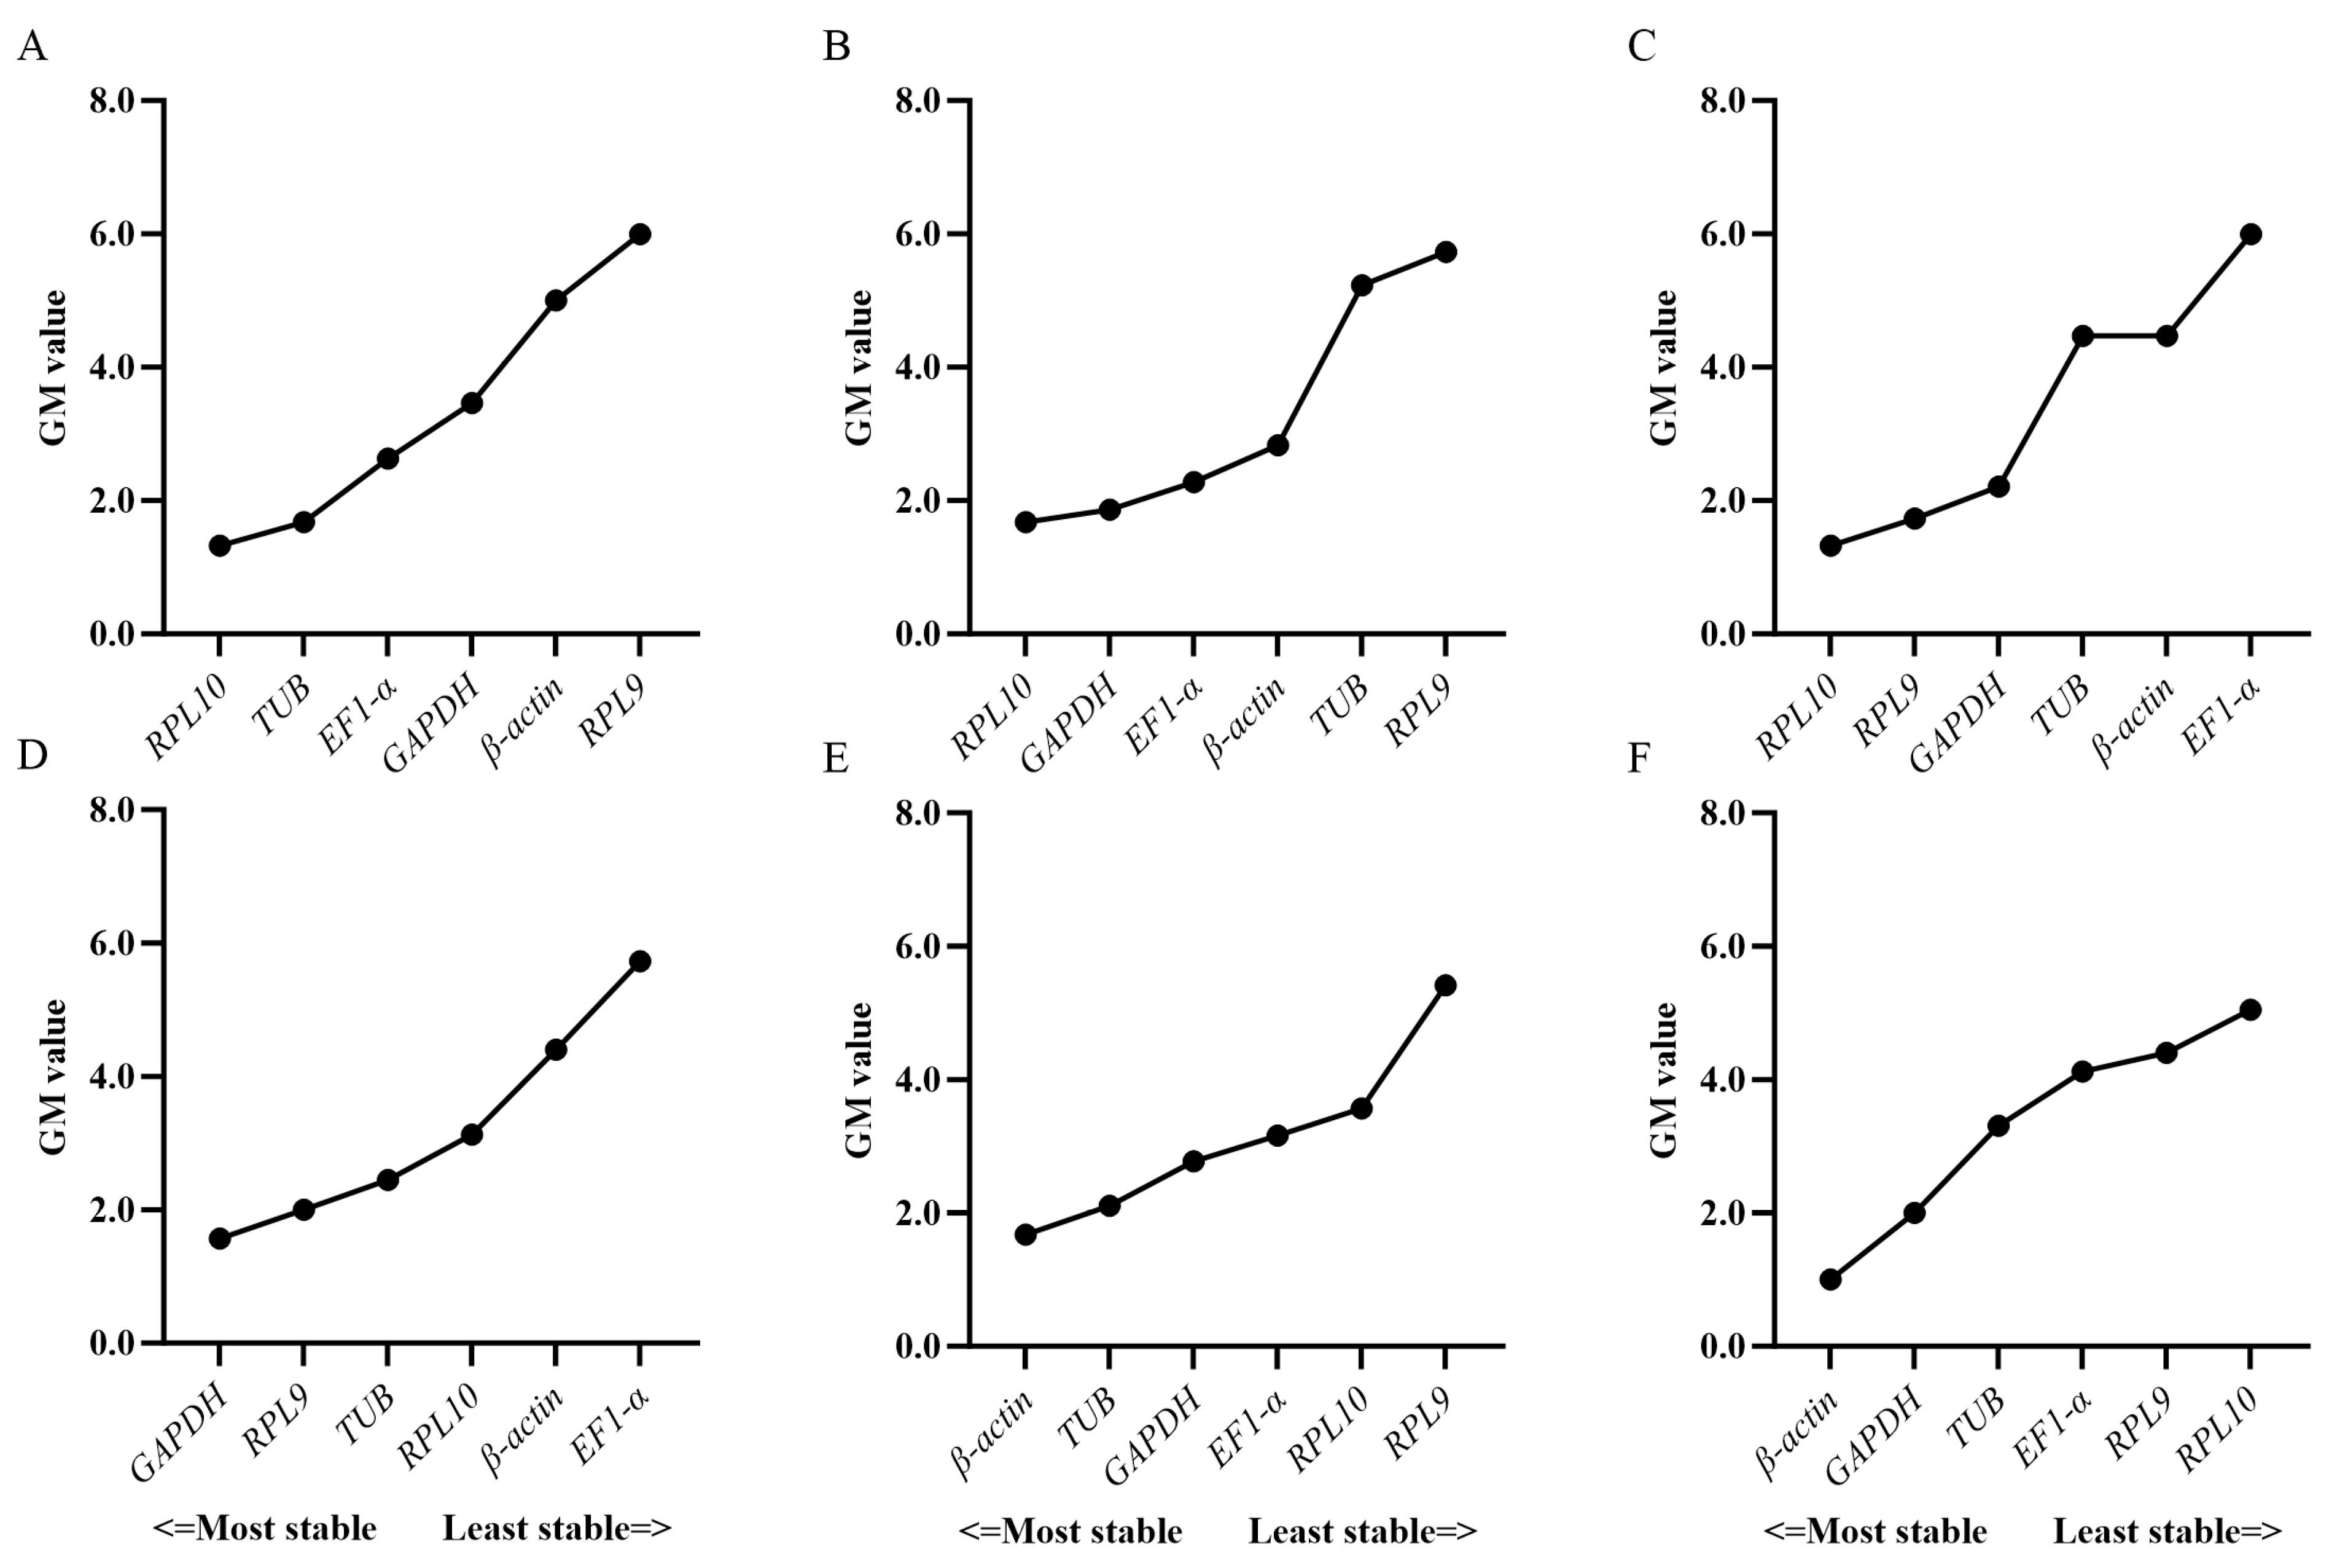
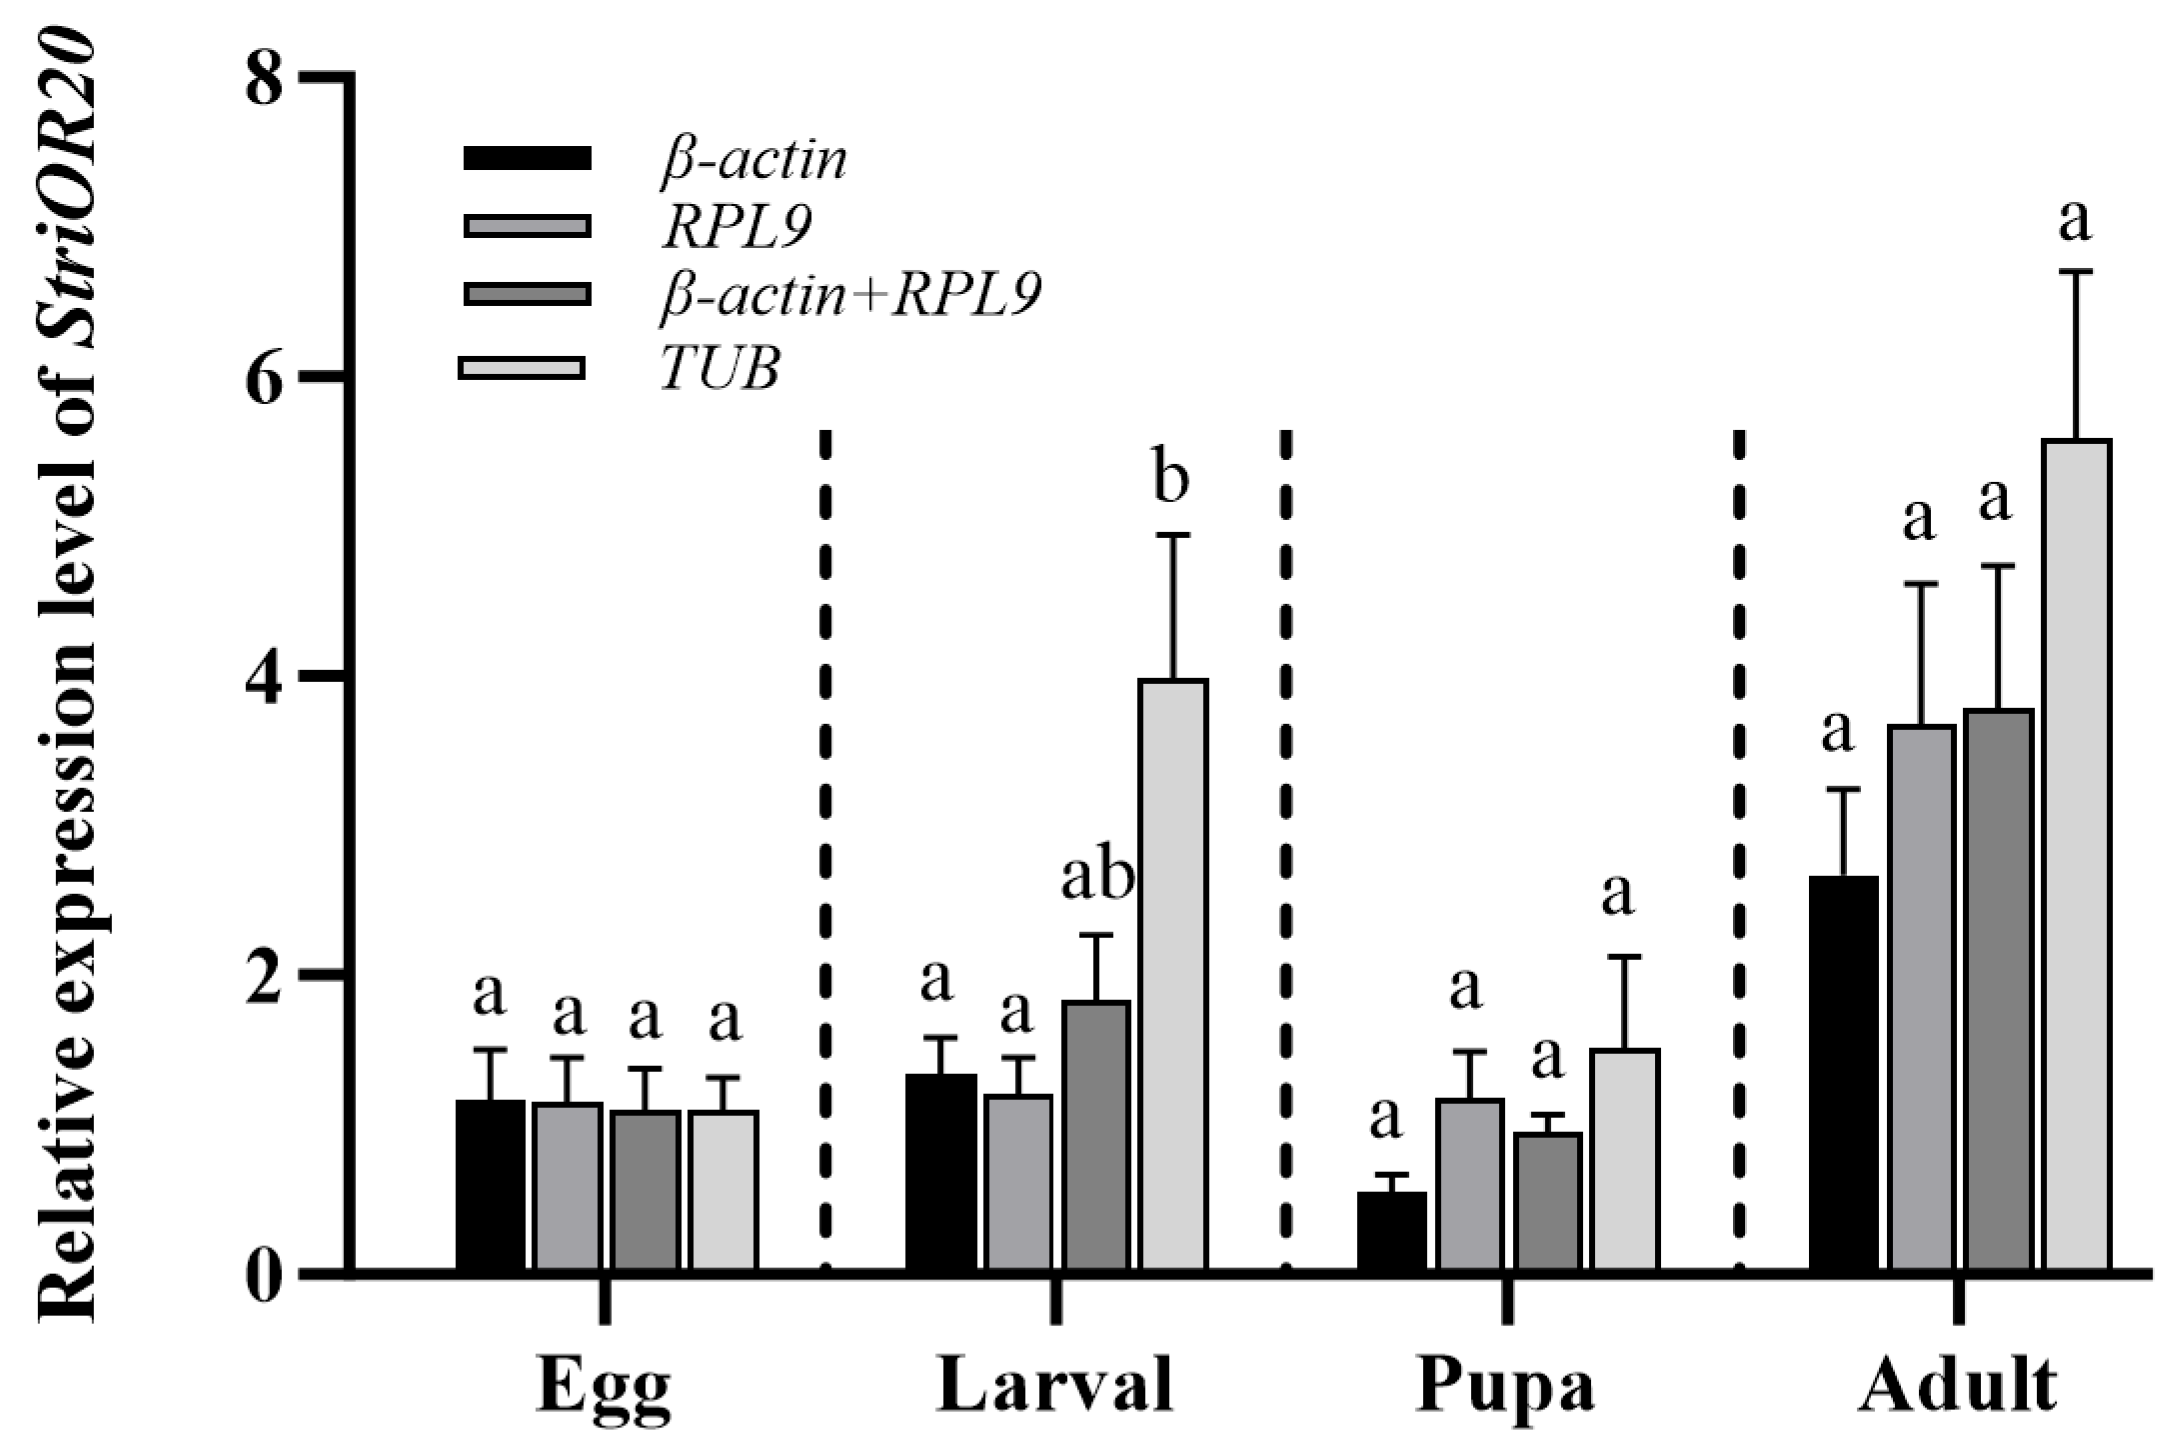
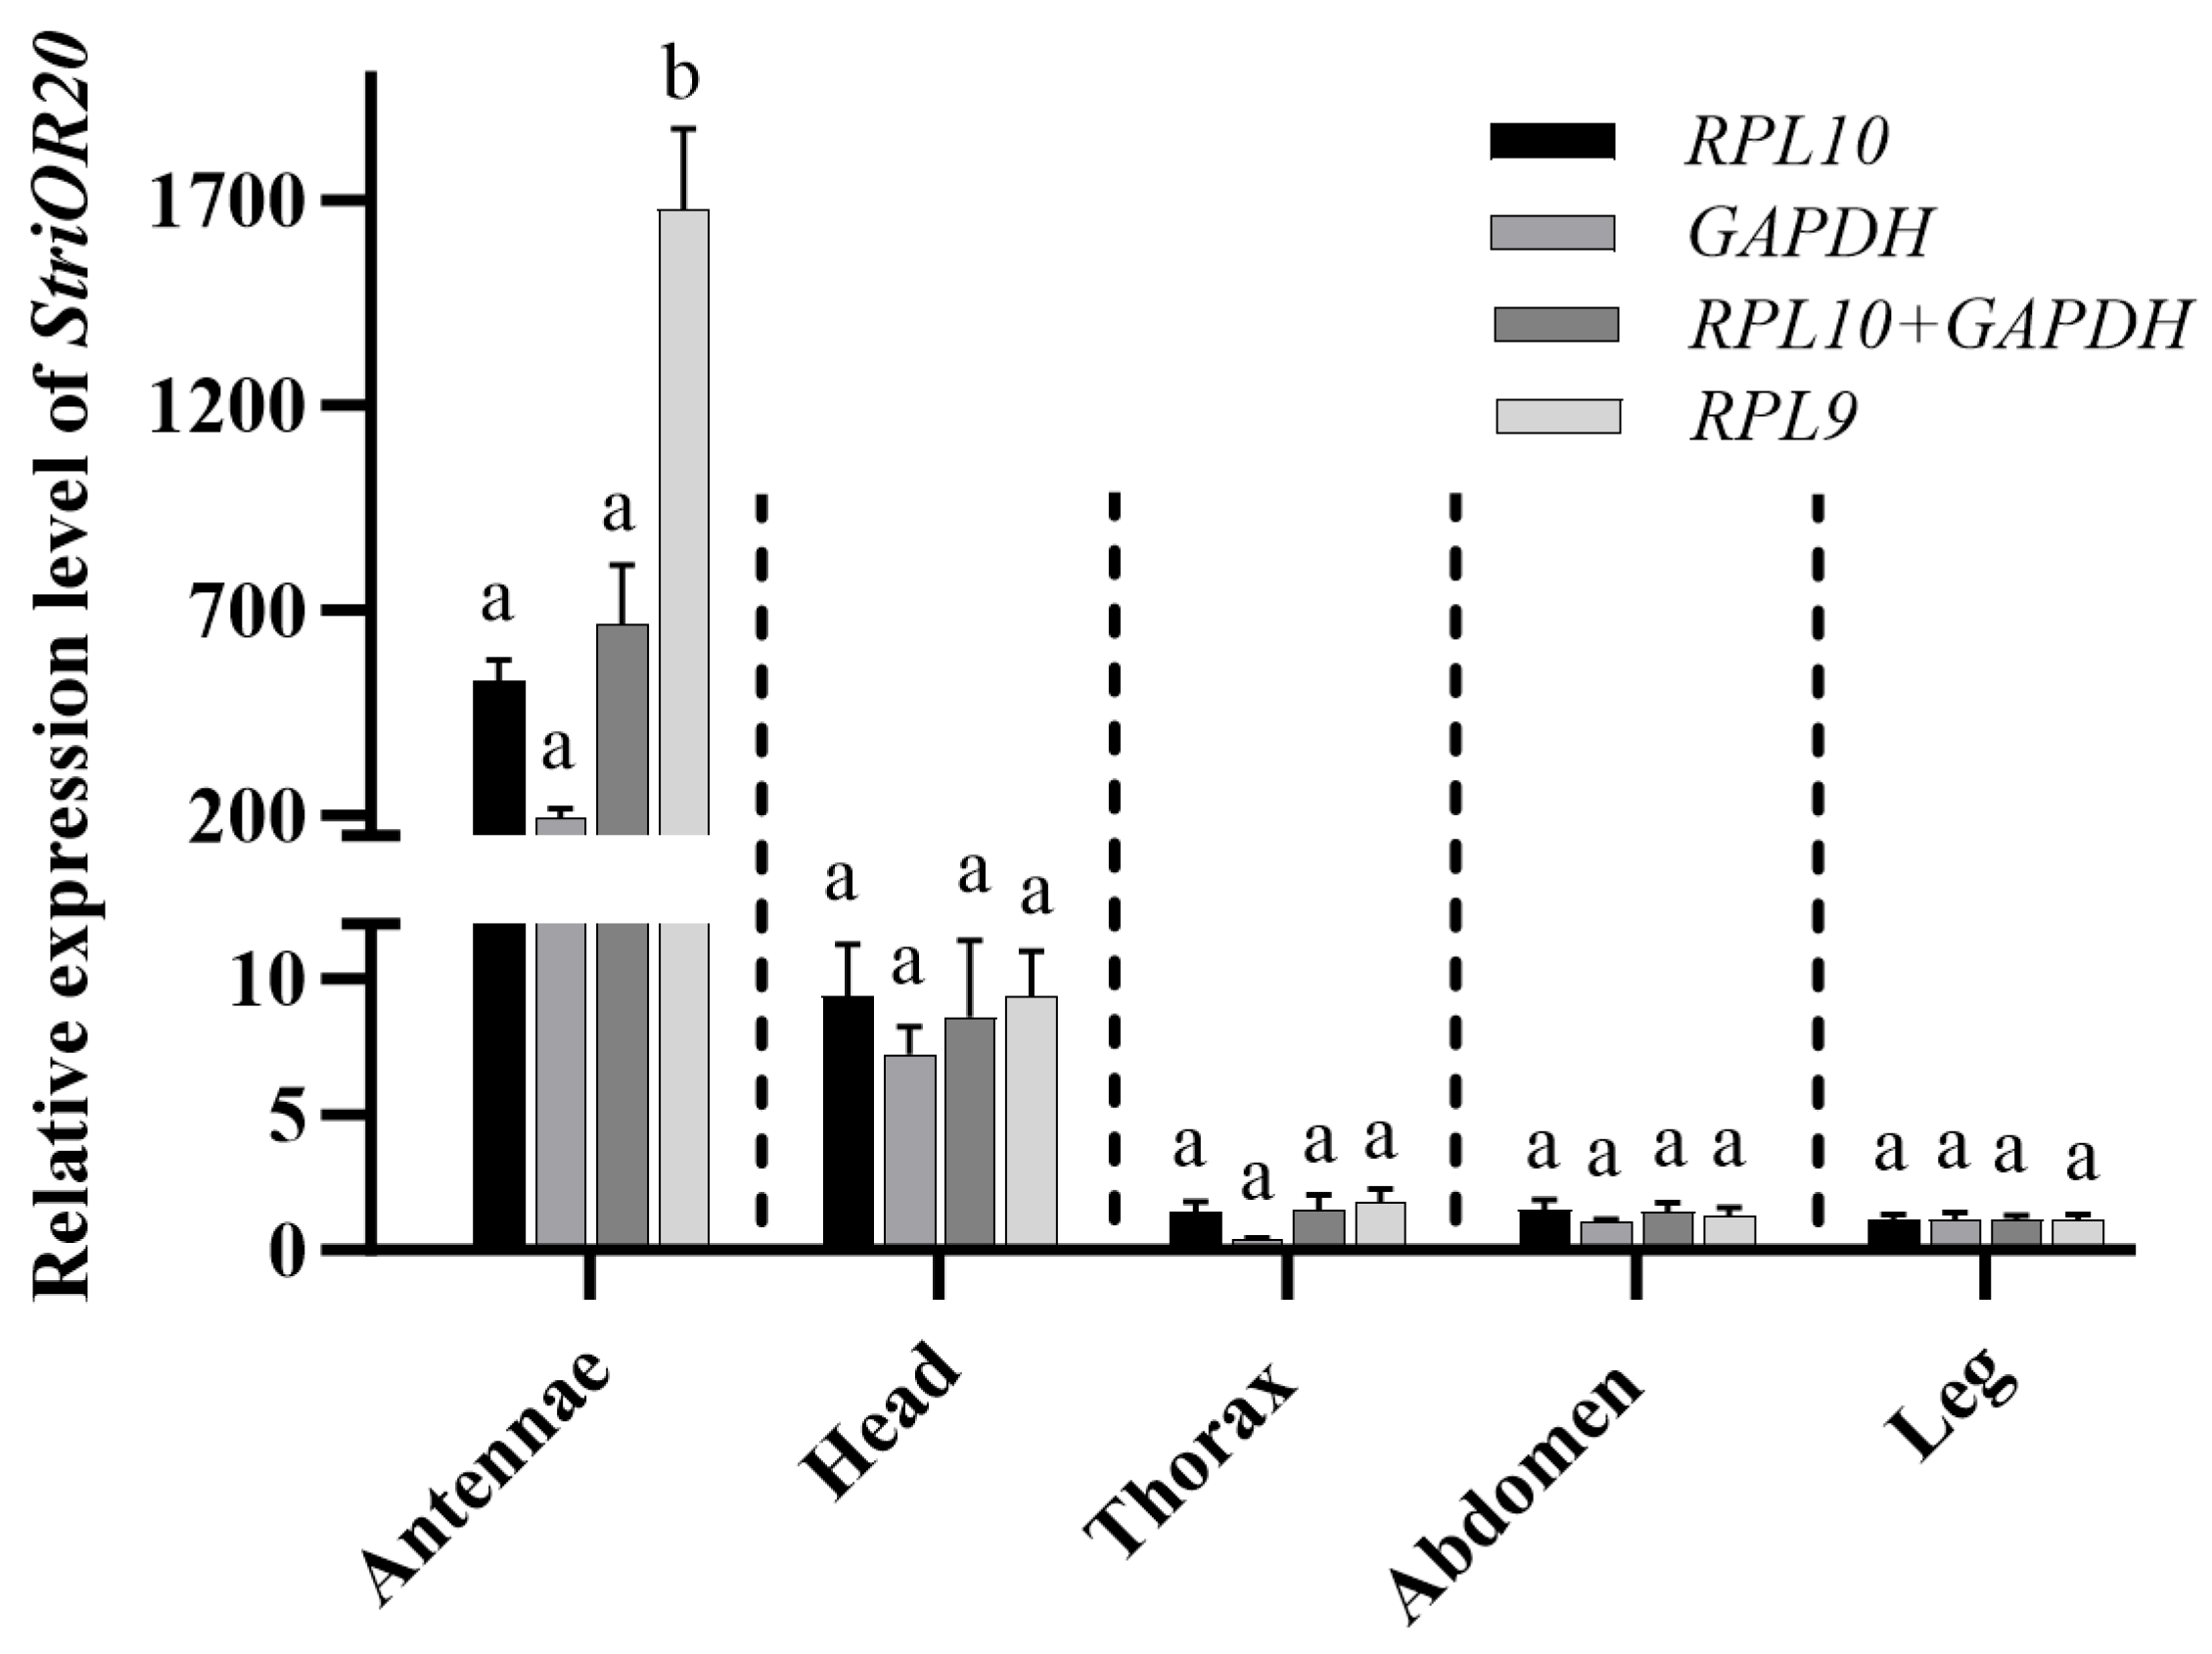
3.4. Verification of Candidate Reference Genes

To evaluate the effect of reference gene stability on gene expression quantification, the odorant receptor gene StriOR20 from S. trifolii was selected as a target. Relative expression levels were quantified using the ΔΔCt method [34], comparing normalization results obtained with validated stable versus unstable reference genes across all the developmental stages and total adult tissues. There was a significant difference (p < 0.05) between the expression levels of StriOR20 using the stable (β-actin and RPL9) and least stable reference genes (TUB) during the larval stage (Figure 7). No significant differences in StriOR20 relative expression were detected between stable and unstable reference gene normalizations across egg, pupa, and adult stages. However, adult-stage expression normalized with unstable reference genes showed a 1.48–2.09-fold increase compared to stable normalization (Figure 7). In different tissues, StriOR20 was highly expressed in the antennae, with low expression in other tissues. Antennae tissue showed a substantial difference (p < 0.001) in the relative expression levels of StriOR20 when normalizing with stable reference genes (RPL10 and GAPDH) compared to unstable ones (RPL9). In contrast, other tissues did not display any significant differences (Figure 8).

4. Discussion

RT-qPCR is the most widely used method to analyze gene expression; however, the accuracy and reliability of analyzing gene expression rely on stable reference genes for normalization. Current studies have shown that no reference gene is universally stably expressed, and the same reference gene in the same species appears to have different expression levels under different experimental conditions [29]; e.g., in this study, RPL9 is the reference gene with stable expression at different developmental stages, but it is the most unstable under different tissue conditions. Meanwhile, the same internal reference gene also appeared to have different expression levels in different species under the same experimental conditions [29]. For example, β-actin was a stable reference gene at different developmental stages in Plutella xylostella [35], Spodoptera exigua [36], and Mythimna separata [37], and was the most unstable gene at different developmental stages in Helicoverpa armigera [38], Spodoptera litura [39], and Spodoptera frugiperda [29], which are less stable reference genes at different developmental stages. In order to obtain accurate experimental data for target genes, it is necessary to screen for reference genes that are stable under specific experimental conditions in specific species. Therefore, our study reported stable reference genes at different developmental stages and in different tissues of S. trifolii, which provides a basis for the expression study of target genes.
Commonly used software programs for stability analysis of reference genes are BestKeeper, geNorm, and NormFinder. However, the results of different software analyses are not consistent. Here, we found that at developmental stages, EF1-α was ranked lowest (least stable) in geNorm and NormFinder analyses, while BestKeeper was ranked highest (most stable). The differences between the results of BestKeeper and geNorm and NormFinder may be due to the different algorithms of the different programs, and similar findings have been reported in other insects [29,40,41]. Therefore, in order to eliminate the potential noise between the three algorithms, we used the online software RefFinder to rank the sorting of the three programs together as a final filter. In order to improve the reliability and accuracy of RT-qPCR data, researchers proposed to use multiple internal reference genes at the same time [13,35,42,43], and the exact number of suitable internal reference genes to be used was decided based on the pairwise variance value (Vn/n + 1) calculated by the geNorm software, which has a threshold value of 0.15. Vn/n + 1 was greater than 0.15 in all the results of this study, and we suggest that the number of suitable reference genes used is three.
In this study, β-actin, RPL9, and GAPDH were screened as stable reference genes at different developmental stages, and RPL10, GAPDH, and TUB were stable reference genes in different tissues. The results are similar to those reported in other insects, where β-actin is a stable reference gene at different developmental stages in Leucinodes orbonalis [44], P. xylostella [35], S. exigua [36], and M. separata [37]. GAPDH was the best reference gene for developmental stages in Tuta absoluta [45]. Meanwhile, GAPDH is the most stable reference gene in S. litura [39], Sesamia inferens [46], and S. exigua [36] under different tissue conditions, such as TUB and RPL10 are stable in S. frugiperda [29], and RPL10 is most stable in S. litura [39] and T. absoluta [45]. However, there are inconsistent reports in some species, such as GAPDH not being a stable reference gene in the developmental stages and tissues of H. armigera [43] and S. frugiperda [29], and β-actin being unstable in the developmental stages of S. frugiperda [29]. Meanwhile, in the present study, we found that the most stable reference genes at four developmental stages were not consistent and also differed from all developmental stages; the stability of expression of reference genes varied in six adult tissues and in total adult tissues, and similar studies have been reported in S. exigua [36]. Therefore, in future studies, we should select the appropriate reference genes according to the specific experimental requirements. The odorant receptor is an important chemosensory protein involved in the process of olfactory perception in insects and plays a very important role in the regulation of insect olfactory behavior [47,48]. In the present study, we verified the expression levels of StriOR20 at different developmental stages and under different tissue treatments using stable and unstable reference genes. The results showed that the relative expression levels of StriOR20 in the larval stage and antennae were significantly different when using stable and unstable reference genes. The same was reported in the validation of odorant-binding protein (OBP) expression in S. frugiperda, where significant differences in the expression patterns of SfruOBP1 were observed when stable and unstable internal reference genes were used [29]. The present results further validate the importance of selecting appropriate stable reference genes in quantitative experiments for analyzing gene expression. Therefore, it is necessary to select and validate stable reference genes to improve the accuracy and reliability in the gene expression analysis of S. trifolii.

5. Conclusions

In this study, we analyzed the expression stability of six candidate reference genes in different developmental stages and different tissues of S. trifolii using RT-qPCR. We found that β-actin, RPL9, and GAPDH were reference genes stably expressed at different developmental stages, and RPL10, GAPDH, and TUB were reference genes with stable expression in different tissues. To the best of our knowledge, the results of this study are reported for the first time and provide a basis for gene expression analysis in S. trifolii.

Supplementary Materials

The following supporting information can be downloaded at: https://www.mdpi.com/article/10.3390/insects16050527/s1. Figure S1: Amplification melting curves of primers for six reference genes of Scotogramma trifolii (Lepidoptera: Lepidoptera) in RT-qPCR.

Author Contributions

Conceptualization, A.Y. and G.L.; methodology, A.Y.; software, A.Y. and W.L.; validation, H.Z., A.Y. and W.L.; formal analysis, G.L.; data curation, W.B. and R.D.; writing—original draft preparation, A.Y.; writing—review and editing, A.Y., H.Z., W.B., W.L., R.D. and G.L. All authors have read and agreed to the published version of the manuscript.

Funding

This research was funded by the Tianshan Talents Cultivation Program (2023TSYCCX0015) and the China Agriculture Research System (CARS17).

Data Availability Statement

The original contributions presented in this study are included in the article/Supplementary Material. Further inquiries can be directed to the corresponding author.

Conflicts of Interest

The authors declare no conflicts of interest.

References

  1. Federici, B.A. A new type of insect pathogen in larvae of the clover cutworm, Scotogramma trifolii. J. Invertebr. Pathol. 1982, 40, 41–54. [Google Scholar] [CrossRef]
  2. Zhang, Y.H.; Cheng, D.F.; Lu, H. Radar observations of the spring migration of spinneret moths in Yanqing, Beijing. In Proceedings of the 2007 Annual Meeting of the Chinese Society for Plant Protection, Guilin, China, 23 November 2007. [Google Scholar]
  3. Zhao, Z.J.; Chen, E.X.; Zhang, Y. Studies on the biological characteristic of Scotogramma trifolii Rottemberg and its control. Sugar Crops China 1992, 4, 25–28. [Google Scholar]
  4. Yu, J.N.; Bao, Y.Q. The occurrence of clover cutworm in cotton region of Xinjiang. Xinjiang Agric. Sci. 1996, 1, 34. [Google Scholar]
  5. Bustin, S.A. Absolute quantification of mRNA using real-time reverse transcription polymerase chain reaction assays. J. Mol. Endocrinol. 2000, 25, 169–193. [Google Scholar] [CrossRef] [PubMed]
  6. Kubista, M.; Andrade, J.M.; Bengtsson, M.; Forootan, A.; Jonák, J.; Lind, K.; Sindelka, R.; Sjöback, R.; Sjögreen, B.; Strömbom, L.; et al. The real-time polymerase chain reaction. Mol. Asp. Med. 2006, 27, 95–125. [Google Scholar] [CrossRef]
  7. Derveaux, S.; Vandesompele, J.; Hellemans, J. How to do successful gene expression analysis using real-time PCR. Methods 2010, 50, 227–230. [Google Scholar] [CrossRef]
  8. Sun, K.Q.; Zhang, Y.J.; D’Alessandro, A.; Nemkov, T.; Song, A.R.; Wu, H.Y.; Liu, H.; Adebiyi, M.; Huang, A.; Wen, Y.E.; et al. Sphingosine-1-phosphate promotes erythrocyte glycolysis and oxygen release for adaptation to high-altitude hypoxia. Nat. Commun. 2016, 7, 12086. [Google Scholar] [CrossRef]
  9. Guo, J.L.; Ling, H.; Wu, Q.B.; Xu, L.P.; Que, Y.X. The choice of reference genes for assessing gene expression in sugarcane under salinity and drought stresses. Sci. Rep. 2014, 4, 7042. [Google Scholar] [CrossRef]
  10. Shi, X.-Q.; Guo, W.-C.; Wan, P.-J.; Zhou, L.-T.; Ren, X.-L.; Ahmat, T.; Fu, K.-Y.; Li, G.-Q. Validation of reference genes for expression analysis by quantitative real-time PCR in Leptinotarsa decemlineata (Say). BMC Res. Notes 2013, 6, 93. [Google Scholar] [CrossRef]
  11. Bustin, S.A.; Benes, V.; Garson, J.A.; Hellemans, J.; Huggett, J.; Kubista, M.; Mueller, R.; Nolan, T.; Pfaffl, M.W.; Shipley, G.L.; et al. The MIQE guidelines: Minimum information for publication of quantitative real-time PCR experiments. Clin. Chem. 2009, 55, 611–622. [Google Scholar] [CrossRef]
  12. Bustin, S.A. Quantification of mRNA using real-time reverse transcription PCR (RT-PCR): Trends and problems. J. Mol. Endocrinol. 2002, 29, 23–39. [Google Scholar] [CrossRef]
  13. Vandesompele, J.; De Preter, K.; Pattyn, F.; Poppe, B.; Van Roy, N.; De Paepe, A.; Speleman, F. Accurate normalization of real-time quantitative RT-PCR data by geometric averaging of multiple internal control genes. Genome Biol. 2002, 3, research0034.1. [Google Scholar] [CrossRef] [PubMed]
  14. Schmittgen, T.D.; Zakrajsek, B.A. Effect of experimental treatment on housekeeping gene expression: Validation by real-time, quantitative RT-PCR. J. Biochem. Biophys. Methods 2000, 46, 69–81. [Google Scholar] [CrossRef]
  15. Lee, P.D.; Sladek, R.; Greenwood, C.M.; Hudson, T.J. Control genes and variability: Absence of ubiquitous reference transcripts in diverse mammalian expression studies. Genome Res. 2002, 12, 292–297. [Google Scholar] [CrossRef] [PubMed]
  16. Kozera, B.; Rapacz, M. Reference genes in real-time PCR. J. Appl. Genet. 2013, 54, 391–406. [Google Scholar] [CrossRef]
  17. Hu, Y.; Fu, H.; Qiao, H.; Sun, S.; Zhang, W.; Jin, S.; Jiang, S.; Gong, Y.; Xiong, Y.; Wu, Y. Validation and Evaluation of Reference Genes for Quantitative Real-Time PCR in Macrobrachium nipponense. Int. J. Mol. Sci. 2018, 19, 2258. [Google Scholar] [CrossRef] [PubMed]
  18. Ren, H.; Wu, X.Q.; Lyu, Y.P.; Zhou, H.Z.; Xie, X.Y.; Zhang, X.J.; Yang, H.T. Selection of reliable reference genes for gene expression studies in Botrytis cinerea. J. Microbiol. Methods 2017, 142, 71–75. [Google Scholar] [CrossRef]
  19. Bagnall, N.H.; Kotze, A.C. Evaluation of reference genes for real-time PCR quantification of gene expression in the Australian sheep blowfly, Lucilia cuprina. Med. Vet. Entomol. 2010, 24, 176–181. [Google Scholar] [CrossRef]
  20. Bai, Y.; Lv, Y.N.; Zeng, M.; Jia, P.Y.; Lu, H.N.; Zhu, Y.B.; Li, S.; Cui, Y.Y.; Luan, Y.X. Selection of reference genes for normalization of gene expression in Thermobia domestica (Insecta: Zygentoma: Lepismatidae). Genes 2020, 12, 21. [Google Scholar] [CrossRef]
  21. Scharlaken, B.; de Graaf, D.C.; Goossens, K.; Brunain, M.; Peelman, L.J.; Jacobs, F.J. Reference gene selection for insect expression studies using quantitative real-time PCR: The head of the honeybee, Apis mellifera, after a bacterial challenge. J. Insect Sci. 2008, 8, 33. [Google Scholar] [CrossRef]
  22. de Boer, M.E.; de Boer, T.E.; Mariën, J.; Timmermans, M.J.T.N.; Nota, B.; van Straalen, N.M.; Ellers, J.; Roelofs, D. Reference genes for QRT-PCR tested under various stress conditions in Folsomia candida and Orchesella cincta (Insecta, Collembola). BMC Mol. Biol. 2009, 10, 54. [Google Scholar] [CrossRef]
  23. Jiang, H.B.; Liu, Y.H.; Tang, P.A.; Zhou, A.W.; Wang, J.J. Validation of endogenous reference genes for insecticide-induced and developmental expression profiling of Liposcelis bostsrychophila (Psocoptera: Liposcelididae). Mol. Biol. Rep. 2010, 37, 1019–1029. [Google Scholar] [CrossRef]
  24. Arun, A.; Baumlé, V.; Amelot, G.; Nieberding, C.M. Selection and validation of reference genes for qRT-PCR expression analysis of candidate genes involved in olfactory communication in the butterfly Bicyclus anynana. PLoS ONE 2015, 10, e0120401. [Google Scholar] [CrossRef] [PubMed]
  25. Koramutla, M.K.; Aminedi, R.; Bhattacharya, R. Comprehensive evaluation of candidate reference genes for qRT-PCR studies of gene expression in mustard aphid, Lipaphis erysimi (Kalt). Sci. Rep. 2016, 6, 25883. [Google Scholar] [CrossRef] [PubMed]
  26. Nakamura, A.M.; Chahad-Ehlers, S.; Lima, A.L.; Taniguti, C.H.; Sobrinho, I., Jr.; Torres, F.R.; de Brito, R.A. Reference genes for accessing differential expression among developmental stages and analysis of differential expression of OBP genes in Anastrepha obliqua. Sci. Rep. 2016, 6, 17480. [Google Scholar] [CrossRef]
  27. Chapman, J.R.; Waldenström, J. With reference to reference genes: A systematic review of endogenous controls in gene expression studies. PLoS ONE 2015, 10, e0141853. [Google Scholar] [CrossRef]
  28. Nolan, T.; Hands, R.E.; Bustin, S.A. Quantification of mRNA using real-time RT-PCR. Nat. Protoc. 2006, 1, 1559–1582. [Google Scholar] [CrossRef] [PubMed]
  29. Han, S.P.; Qin, Q.J.; Wang, D.; Zhou, Y.Y.; He, Y.Z. Selection and evaluation of reference genes for qRT-PCR in Spodoptera frugiperda (Lepidoptera: Noctuidae). Insects 2021, 12, 902. [Google Scholar] [CrossRef]
  30. Pfaffl, M.W. A new mathematical model for relative quantification in real-time RT-PCR. Nucleic Acids Res. 2001, 29, e45. [Google Scholar] [CrossRef]
  31. Andersen, C.L.; Jensen, J.L.; Ørntoft, T.F. Normalization of real-time quantitative reverse transcription-PCR data: A model-based variance estimation approach to identify genes suited for normalization, applied to bladder and colon cancer data sets. Cancer Res. 2004, 64, 5245–5250. [Google Scholar] [CrossRef]
  32. Pfaffl, M.W.; Tichopad, A.; Prgomet, C.; Neuvians, T.P. Determination of stable housekeeping genes, differentially regulated target genes and sample integrity: BestKeeper–Excel-based tool using pair-wise correlations. Biotechnol. Lett. 2004, 26, 509–515. [Google Scholar] [CrossRef] [PubMed]
  33. Xie, F.L.; Wang, J.Y.; Zhang, B.H. RefFinder: A web-based tool for comprehensively analyzing and identifying reference genes. Funct. Integr. Genom. 2023, 23, 125. [Google Scholar] [CrossRef] [PubMed]
  34. Livak, K.J.; Schmittgen, T.D. Analysis of relative gene expression data using real-time quantitative PCR and the 2(-Delta Delta C(T)) Method. Methods 2001, 25, 402–408. [Google Scholar] [CrossRef]
  35. Fu, W.; Xie, W.; Zhang, Z.; Wang, S.; Wu, Q.; Liu, Y.; Zhou, X.; Zhou, X.; Zhang, Y. Exploring valid reference genes for quantitative real-time PCR analysis in Plutella xylostella (Lepidoptera: Plutellidae). Int. J. Biol. Sci. 2013, 9, 792–802. [Google Scholar] [CrossRef]
  36. Zhu, X.; Yuan, M.; Shakeel, M.; Zhang, Y.; Wang, S.; Wang, X.; Zhan, S.; Kang, T.; Li, J. Selection and evaluation of reference genes for expression analysis using qRT-PCR in the beet armyworm Spodoptera exigua (Hübner) (Lepidoptera: Noctuidae). PLoS ONE 2014, 9, e84730. [Google Scholar] [CrossRef]
  37. Li, H.B.; Dai, C.G.; Zhang, C.R.; He, Y.F.; Ran, H.Y.; Chen, S.H. Screening potential reference genes for quantitative real-time PCR analysis in the oriental armyworm, Mythimna separata. PLoS ONE 2018, 13, e0195096. [Google Scholar] [CrossRef]
  38. Zhang, S.; An, S.; Li, Z.; Wu, F.; Yang, Q.; Liu, Y.; Cao, J.; Zhang, H.; Zhang, Q.; Liu, X. Identification and validation of reference genes for normalization of gene expression analysis using qRT-PCR in Helicoverpa armigera (Lepidoptera: Noctuidae). Gene 2015, 555, 393–402. [Google Scholar] [CrossRef] [PubMed]
  39. Lu, Y.; Yuan, M.; Gao, X.; Kang, T.; Zhan, S.; Wan, H.; Li, J. Identification and validation of reference genes for gene expression analysis using quantitative PCR in Spodoptera litura (Lepidoptera: Noctuidae). PLoS ONE 2013, 8, e68059. [Google Scholar] [CrossRef]
  40. Xu, J.; Lu, M.X.; Cui, Y.D.; Du, Y.Z. Selection and evaluation of reference genes for expression analysis using qRT-PCR in Chilo suppressalis (Lepidoptera: Pyralidae). J. Econ. Entomol. 2017, 110, 683–691. [Google Scholar] [CrossRef]
  41. Yang, Q.; Li, Z.; Cao, J.; Zhang, S.; Zhang, H.; Wu, X.; Zhang, Q.; Liu, X. Selection and assessment of reference genes for quantitative PCR normalization in migratory locust Locusta migratoria (Orthoptera: Acrididae). PLoS ONE 2014, 9, e98164. [Google Scholar] [CrossRef]
  42. Shu, B.; Zhang, J.; Cui, G.; Sun, R.; Sethuraman, V.; Yi, X.; Zhong, G. Evaluation of reference genes for Real-Time Quantitative PCR analysis in Larvae of Spodoptera litura exposed to azadirachtin stress conditions. Front. Physiol. 2018, 9, 372. [Google Scholar] [CrossRef] [PubMed]
  43. Tan, Y.; Zhou, X.R.; Pang, B.P. Reference gene selection and evaluation for expression analysis using qRT-PCR in Galeruca daurica (Joannis). Bull. Entomol. Res. 2017, 107, 359–368. [Google Scholar] [CrossRef] [PubMed]
  44. Kariyanna, B.; Prabhuraj, A.; Asokan, R.; Babu, P.; Jalali, S.K.; Venkatesan, T.; Gracy, R.G.; Mohan, M. Identification of suitable reference genes for normalization of RT-qPCR data in eggplant fruit and shoot borer (Leucinodes orbonalis Guenée). Biologia 2020, 75, 289–297. [Google Scholar] [CrossRef]
  45. Yan, X.; Zhang, Y.; Xu, K.; Wang, Y.; Yang, W. Selection and validation of reference genes for gene expression analysis in Tuta absoluta Meyrick (Lepidoptera: Gelechiidae). Insects 2021, 12, 589. [Google Scholar] [CrossRef]
  46. Sun, M.; Lu, M.X.; Tang, X.T.; Du, Y.Z. Exploring valid reference genes for quantitative real-time PCR analysis in Sesamia inferens (Lepidoptera: Noctuidae). PLoS ONE 2015, 10, e0115979. [Google Scholar] [CrossRef] [PubMed]
  47. Leal, W.S. Odorant reception in insects: Roles of receptors, binding proteins, and degrading enzymes. Annu. Rev. Entomol. 2013, 58, 373–391. [Google Scholar] [CrossRef]
  48. Fleischer, J.; Pregitzer, P.; Breer, H.; Krieger, J. Access to the odor world: Olfactory receptors and their role for signal transduction in insects. Cell. Mol. Life Sci. 2018, 75, 485–508. [Google Scholar] [CrossRef]
Figure 1. Expression levels of six candidate reference genes in the S. trifolii. (A) Development stage (n = 55). (B) Adult tissue (n = 30). The black-centered triangles represent the Ct values for each sample. The line across the box shows the median value. The top and bottom whiskers represent the 25th and 75th percentiles, respectively, and the bars represent the minimum and maximum.
Insects 16 00527 g001
Figure 2. Comprehensive ranking of the expression stability of the six reference genes in the (A) egg, (B) larval, (C) pupa, and (D) adult stages as calculated by the RefFinder software.
Insects 16 00527 g002
Figure 3. Optimal reference gene selection for RT-qPCR normalization in S. trifolii at different developmental stages and different tissue conditions. The threshold for pairwise variation (Vn/n + 1) is 0.15.
Insects 16 00527 g003
Figure 4. Expression stability of six candidate reference genes in S. trifolii across different developmental stages was evaluated using the following four computational tools: (A) geNorm, (B) NormFinder, (C) BestKeeper, and (D) RefFinder.
Insects 16 00527 g004
Figure 5. Comprehensive ranking of the expression stability of the six reference genes in six tissues of adult calculated according to the RefFinder software. (A) Antennae, (B) head, (C) thorax, (D) abdomen, (E) leg, and (F) wing.
Insects 16 00527 g005
Figure 6. Expression stability of six candidate reference genes in S. trifolii adult tissues was evaluated using the following four distinct computational tools: (A) geNorm, (B) NormFinder, (C) BestKeeper, and (D) RefFinder.
Insects 16 00527 g006
Figure 7. Expression level of StriOR20 at different developmental stages of S. trifolii. Error bar, means ± standard error (SE) (n = 5). Different lowercase letters above bars in the same treatment represent significant differences (p < 0.05, one-way ANOVA analysis followed by Tukey’s test).
Insects 16 00527 g007
Figure 8. Expression level of StriOR20 in different tissues of Scotogramma trifolii. Error bar, means ± SE (n = 5). Different lowercase letters above bars in the same treatment represent significant differences (p < 0.05, one-way ANOVA analysis followed by Tukey’s test).
Insects 16 00527 g008
Table 1. Primers of reference genes in S. trifolii.
Gene Primer Sequences (5′–3′)Tm (°C)Length (bp)
TUBF:CCGACCTCTTCGTAGTCCTTCTC601202
R:ATGCCCTCGGACAAGACCC
β-actinF:TGTGTGACGAGGATGTTGCT60892
R:GTGTTGGCGTACAGGTCCTT
RPL9F:CAAATAGTTGCGAACCAAAAAGT56559
R:CATCCAGTTCAACAGTAGTCTTCTC
RPL10F:CACGGTTCTGTCGTGGTGTA58459
R:AGCCCCATTTCTTGGAGACG
GAPDHF:TCCAAAATCGGTATCAACGG57970
R:TGAGATCGATGACGCGGT
EF1-αF:GAGGCACGCTACGAGGAGATTA59767
R:GGGAACTCCTGGAAAGACTCCA
Table 2. Primers of reference genes for RT-qPCR in S. trifolii.
Gene Primer Sequences (5′–3′)Tm (°C)Length (bp)Eff (%)R2 Standard Curve Equation
TUBF:GGCGATGGCGGTGGTGTTAGAC6010890.9510.999Y = −3.560x + 42.985
R:GGATTCAAGGTGGGCATCAACT
β-actinF:GTATCCTCACGCTCAAGTA608994.1150.990Y = −3.353x + 40.171
R:GTTGTAGAAGGTGTGGTG
RPL9F:GAGTGCTGAAGGTAGAGAA60161108.7770.990Y = −3.128x + 37.734
R:AGTGGTGACACAGTTGAT
RPL10F:GCAGTTCTTGACGAGGTA608790.7990.994Y = −3.564x + 41.675
R:CTGGTGTCTGACGAGTAC
GAPDHF:TGCCAAGAAGGTCATCAT607994.2010.990Y = −3.469x + 49.458
R:GTCGTATGCCTCAAGGTT
EF1-αF:GCGATCCAGCCCCCTTC60119102.270.992Y = −3.269x + 46.702
R:TTGAGGATGCCGGTCTCAAC
Eff, RT-qPCR efficiency; R2, regression coefficient; F, forward primer; R, reverse primer.
Disclaimer/Publisher’s Note: The statements, opinions and data contained in all publications are solely those of the individual author(s) and contributor(s) and not of MDPI and/or the editor(s). MDPI and/or the editor(s) disclaim responsibility for any injury to people or property resulting from any ideas, methods, instructions or products referred to in the content.

