
The Potential of Newly Established Grassland Strips and Permanent Semi-Natural Grassland to Promote Common Carabids and Spiders on Arable Land

 ,
,  , , and
Simple Summary
Abstract
1. Introduction
2. Materials and Methods
2.1. Experimental Setup
2.2. Collection of Carabid Beetles and Spiders
2.3. Statistical Analysis
3. Results
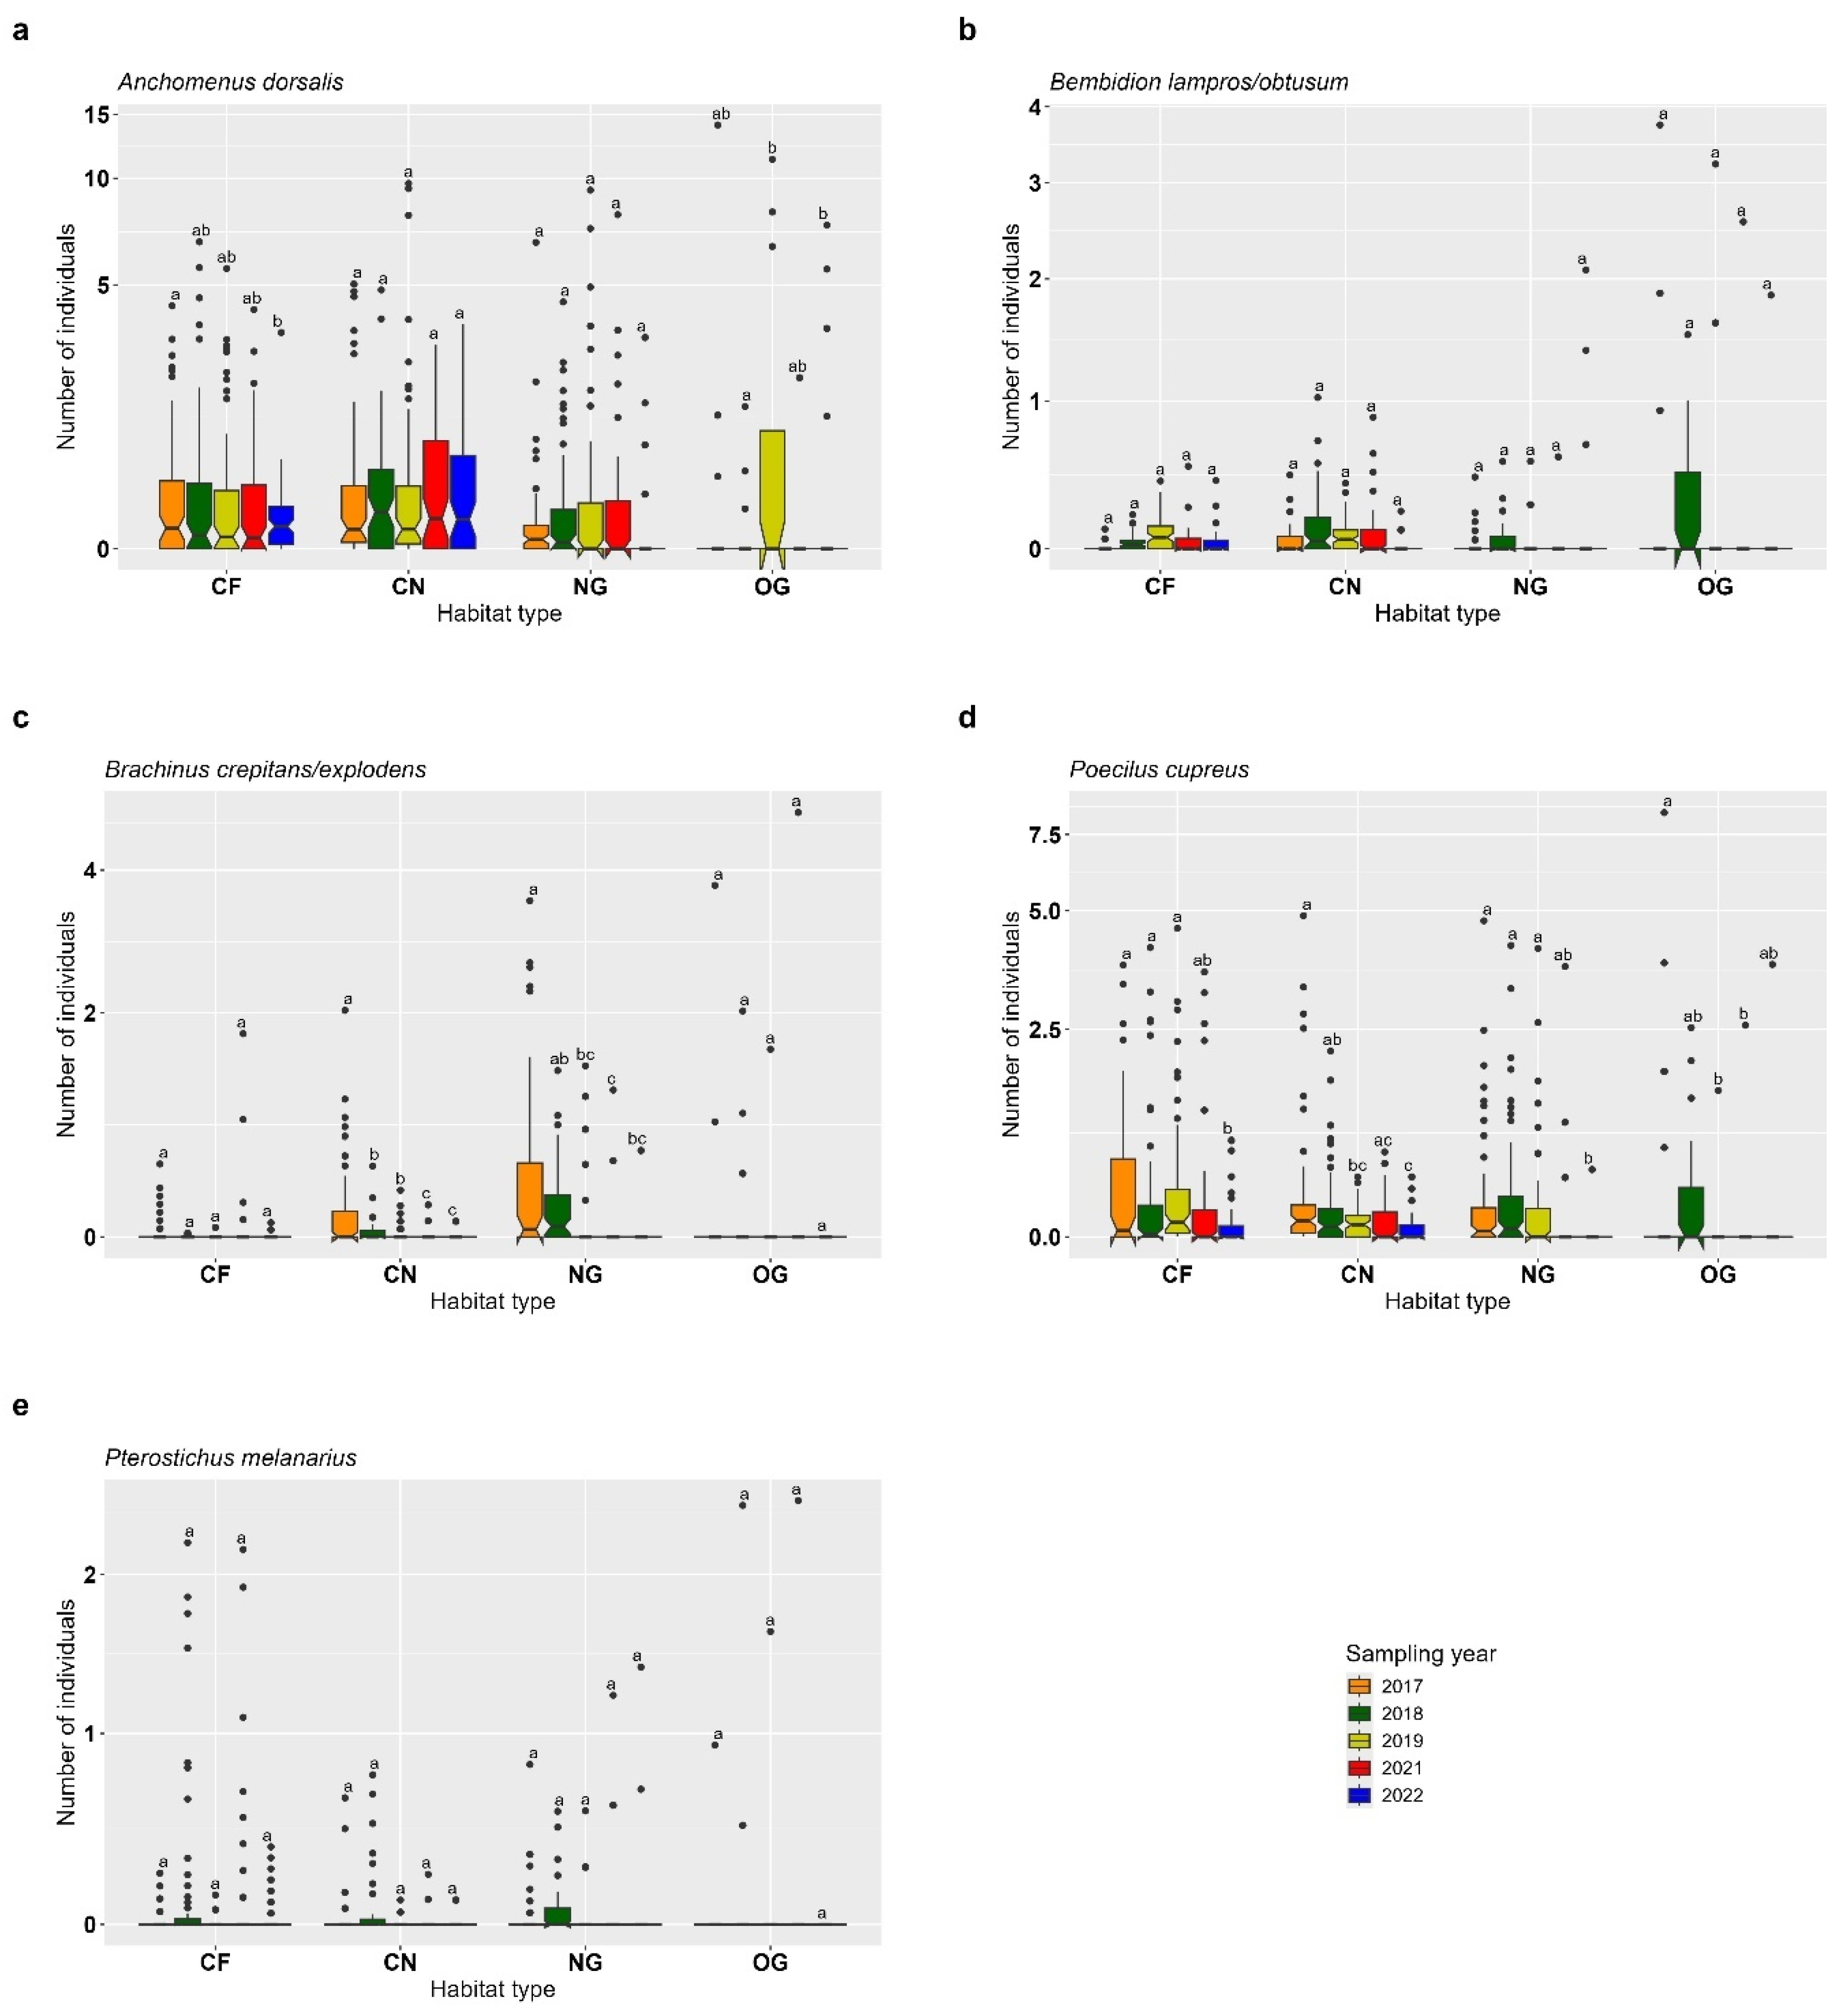
3.1. Carabids
3.2. Spiders
4. Discussion
5. Conclusions
Supplementary Materials
Author Contributions
Funding
Data Availability Statement
Acknowledgments
Conflicts of Interest
References
- Sánchez-Bayo, F.; Wyckhuys, K.A.G. Worldwide decline of the entomofauna: A review of its drivers. Biol. Conserv. 2019, 232, 8–27. [Google Scholar] [CrossRef]
- Boetzl, F.A.; Krimmer, E.; Krauss, J.; Steffan-Dewenter, I. Agri-environmental schemes promote ground-dwelling predators in adjacent oilseed rape fields: Diversity, species traits and distance-decay functions. J. Appl. Ecol. 2019, 56, 10–20. [Google Scholar] [CrossRef]
- Dengler, J.; Janišová, M.; Török, P.; Wellstein, C. Biodiversity of Palaearctic grasslands: A synthesis. Agric. Ecosyst. Environ. 2014, 182, 1–14. [Google Scholar] [CrossRef]
- Denys, C.; Tscharntke, T. Plant-insect communities and predator-prey ratios in field margin strips, adjacent crop fields, and fallows. Oecologia 2002, 130, 315–324. [Google Scholar] [CrossRef]
- Haaland, C.; Naisbit, R.E.; Bersier, L.F. Sown wildflower strips for insect conservation: A review. Insect Conserv. Divers. 2011, 4, 60–80. [Google Scholar] [CrossRef]
- Hussain, R.I.; Walcher, R.; Vogel, N.; Krautzer, B.; Rasran, L.; Frank, T. Effectiveness of flowers strips on insect’s restoration in intensive grassland. Agric. Ecosyst. Environ. 2023, 348, 108436. [Google Scholar] [CrossRef]
- Öckinger, E.; Smith, H.G. Semi-natural grasslands as population sources for pollinating insects in agricultural landscapes. J. Appl. Ecol. 2007, 44, 50–59. [Google Scholar] [CrossRef]
- Cousins, S.A. Landscape history and soil properties affect grassland decline and plant species richness in rural landscapes. Biol. Conserv. 2009, 142, 2752–2758. [Google Scholar] [CrossRef]
- Batáry, P.; Tscharntke, T. Scale-dependent effectiveness of on-field vs. off-field agri-environmental measures for wild bees. Basic. Appl. Ecol. 2022, 62, 55–60. [Google Scholar] [CrossRef]
- Ouvrard, P.; Transon, J.; Jacquemart, A.L. Flower-strip agri-environment schemes provide diverse and valuable summer flower resources for pollinating insects. Biodivers. Conserv. 2018, 27, 2193–2216. [Google Scholar] [CrossRef]
- Révész, K.; Torma, A.; Szabó, M.; Korsoveczky, L.; Gallé-Szpisjak, N.; Batáry, P.; Gallé, R. Supportive effect of uncut refuge strips on grassland arthropods may depends on the amount and width of strips. J. Appl. Ecol. 2024, 61, 1894–1904. [Google Scholar] [CrossRef]
- Mazalová, M.; Šipoš, J.; Rada, S.; Kašák, J.; Šarapatka, B.; Kuras, T. Responses of grassland arthropods to various biodiversity-friendly management practices: Is there a compromise? Eur. J. Entomol. 2015, 112. [Google Scholar] [CrossRef]
- Ernoult, A.; Vialatte, A.; Butet, A.; Michel, N.; Rantier, Y.; Jambon, O.; Burel, F. Grassy strips in their landscape context, their role as new habitat for biodiversity. Agric. Ecosyst. Environ. 2013, 166, 15–27. [Google Scholar] [CrossRef]
- Hussain, R.I.; Brandl, M.; Maas, B.; Rabl, D.; Walcher, R.; Krautzer, B.; Entling, M.H.; Moser, D.; Frank, T. Re-established grasslands on farmland promote pollinators more than predators. Agric. Ecosyst. Environ. 2021, 319, 107543. [Google Scholar] [CrossRef]
- Geosphere Austria—Klimamittel. 2024. Available online: https://www.geosphere.at/de (accessed on 16 April 2025).
- Brandl, M.; Hussain, R.I.; Maas, B.; Rabl, D.; Pachinger, B.; Holzinger, W.; Krautzer, B.; Moser, D.; Frank, T. Improving insect conservation values of agri-environment schemes through diversified seed mixtures. Biol. Conserv. 2022, 269, 109530. [Google Scholar] [CrossRef]
- Freude, H.; Harde, K.W.; Lohse, G.A.; Klausnitzer, B.; Müller-Motzfeld, G. Die Käfer Mitteleuropas, Band II, Adephaga I, Carabidae; Spektrum Akademischer: München, Germany, 2004; p. 521. [Google Scholar]
- Trautner, J.; Geigenmüller, K. Tiger Beetles, Ground Beetles—Illustrated Key to the Cicindelidae and Carabidae of Europe; J. Margraf: Aichtal, Germany, 1987; p. 488. [Google Scholar]
- Nentwig, W.; Blick, T.; Bosmans, R.; Gloor, D.; Hänggi, A.; Kropf, C. Spiders of Europe. Version July-October. Available online: https://www.araneae.nmbe.ch (accessed on 18 February 2025).
- Hanson, H.I.; Palmu, E.; Birkhofer, K.; Smith, H.G.; Hedlund, K. Agricultural land use determines the trait composition of ground beetle communities. PLoS ONE 2016, 11, e0146329. [Google Scholar] [CrossRef]
- Trautner, J. Die Laufkäfer Baden-Württembergs; Eugen Ulmer: Stuttgart, Germany, 2017; Volume 2, p. 848. [Google Scholar]
- R Core Team. R: A Language for Statistical Computing; R Foundation for Statistical Computing: Vienna, Austria, 2021; Available online: https://www.R-project.org/ (accessed on 18 February 2025).
- Bates, D.; Mächler, M.; Bolker, B.; Walker, S. Fitting Linear Mixed-Effects Models Using lme4. J. Stat. Softw. 2015, 67, 1–48. [Google Scholar] [CrossRef]
- Lüdecke, D.; Ben-Shachar, M.; Patil, I.; Waggoner, P.; Makowski, D. performance: An R Package for Assessment, Comparison and Testing of Statistical Models. J. Open Source Softw. 2021, 6, 3139. [Google Scholar] [CrossRef]
- Harrison, X.A. Using observation-level random effects to model overdispersion in count data in ecology and evolution. Peer J. 2014, 2, 616. [Google Scholar] [CrossRef]
- Brooks, M.E.; Kristensen, K.; van Benthem, K.J.; Magnusson, A.; Berg, C.W.; Nielsen, A.; Skaug, H.J.; Maechler, M.; Bolker, B.M. glmmTMB Balances Speed and Flexibility Among Packages for Zero-inflated Generalized Linear Mixed Modeling. R J. 2017, 9, 378–400. [Google Scholar] [CrossRef]
- Hothorn, T.; Bretz, F.; Westfall, P. Simultaneous Inference in General Parametric Models. Bio. J. 2008, 50, 346–363. [Google Scholar] [CrossRef] [PubMed]
- Wickham, H. ggplot2: Elegant Graphics for Data Analysis; Springer: New York, NY, USA, 2016; ISBN 978-3-319-24277-4. Available online: https://ggplot2.tidyverse.org (accessed on 18 February 2025).
- Kleiber, C.; Zeileis, A. Applied Econometrics with R; Springer: New York, NY, USA, 2008. [Google Scholar] [CrossRef]
- Bennewicz, J.; Barczak, T. Ground beetles (Carabidae) of field margin habitats. Biologia 2020, 75, 1631–1641. [Google Scholar] [CrossRef]
- Brygadyrenko, V.; Avtaeva, T.; Matsyura, A. Effect of global climate change on the distribution of Anchomenus dorsalis (Coleoptera, Carabidae) in Europe. Acta Biol. Sib. 2021, 7, 237–260. [Google Scholar] [CrossRef]
- Teofilova, T. Ground beetles in Romanian oilseed rape fields and adjacent grasslands (Coleoptera: Carabidae). Folia Oecol. 2022, 49, 148–158. [Google Scholar] [CrossRef]
- Twardowski, J.P.; Gruss, I.A.; Hurej, M. Can mixture of flowering plants within intensive agricultural landscape positively affect ground-dwelling spider assemblages? Rom. Agric. Res. 2021, 38, 1–11. [Google Scholar] [CrossRef]
- Hoffmann, H.; Peter, F.; Herrmann, J.D.; Donath, T.W.; Diekoetter, T. Benefits of wildflower areas as overwintering habitats for ground-dwelling arthropods depend on landscape structural complexity. Agric. Ecosys. Environ. 2021, 314, 107421. [Google Scholar] [CrossRef]
- Ranjha, M.; Irmler, U. Which carabid species benefit from grassy strips in organic agriculture. Angew. Carabidol. 2013, 10, 13–16. [Google Scholar]
- Fournier, E.; Loreau, M. Foraging activity of the carabid beetle Pterostichus melanarius Ill. in field margin habitats. Agric. Ecosys. Environ. 2002, 89, 253–259. [Google Scholar] [CrossRef]
- Holland, J.M.; Begbie, M.; Birkett, T.; Southway, S.; Thomas, S.R.; Alexander, C.J.; Thomas, C.F.G. The spatial dynamics and movement of Pterostichus melanarius and P. madidus (Carabidae) between and within arable fields in the UK. Int. J. Environ. Sci. 2004, 30, 35–53. [Google Scholar]
- Holland, J.M. Carabid beetles: Their ecology, survival and use in agroecosystems. In The Agroecology of Carabid Beetles; Intercept Ltd.: Andover, UK, 2002. [Google Scholar]
- Eyre, M.D.; Labanowska-Bury, D.; Avayanos, J.G.; White, R.; Leifert, C. Ground beetles (Coleoptera, Carabidae) in an intensively managed vegetable crop landscape in eastern England. Agric. Ecosys. Environ. 2009, 131, 340–346. [Google Scholar] [CrossRef]
- Samu, F.; Szinetár, C. On the nature of agrobiont spiders. J. Arachnol. 2002, 30, 389–402. [Google Scholar] [CrossRef]
- Mestre, L.; Schirmel, J.; Hetz, J.; Kolb, S.; Pfister, S.C.; Amato, M.; Sutter, L.; Jeanneret, P.; Albrecht, M.; Entling, M.H. Both woody and herbaceous semi-natural habitats are essential for spider overwintering in European farmland. Agric. Ecosys. Environ. 2018, 267, 141–146. [Google Scholar] [CrossRef]
- Schmidt, M.H.; Tscharntke, T. The role of perennial habitats for Central European farmland spiders. Agric. Ecosys. Environ. 2005, 105, 235–242. [Google Scholar] [CrossRef]
- Lemke, A.; Poehling, H.M. Sown weed strips in cereal fields: Overwintering site and “source” habitat for Oedothorax apicatus (Blackwall) and Erigone atra (Blackwall) (Araneae: Erigonidae). Agric. Ecosys. Environ. 2002, 90, 67–80. [Google Scholar] [CrossRef]
- Schmidt-Entling, M.H.; Döbeli, J. Sown wildflower areas to enhance spiders in arable fields. Agric. Ecosys. Environ. 2009, 133, 19–22. [Google Scholar] [CrossRef]
- Blick, T.; Pfiffner, L.; Luka, H. Epigäische Spinnen auf Äckern der Nordwest-Schweiz im mitteleuropäischen Vergleich (Arachnida: Araneae). Ges. Allg. Angew. Ent. 2000, 12, 267–276. [Google Scholar]
- Öberg, S.; Ekbom, B.; Bommarco, R. Influence of habitat type and surrounding landscape on spider diversity in Swedish agroecosystems. Agric. Ecosys. Environ. 2007, 122, 211–219. [Google Scholar] [CrossRef]
- Schmidt, M.H.; Thies, C.; Nentwig, W.; Tscharntke, T. Contrasting responses of arable spiders to the landscape matrix at different spatial scales. J. Biogeogr. 2008, 35, 157–166. [Google Scholar] [CrossRef]


Disclaimer/Publisher’s Note: The statements, opinions and data contained in all publications are solely those of the individual author(s) and contributor(s) and not of MDPI and/or the editor(s). MDPI and/or the editor(s) disclaim responsibility for any injury to people or property resulting from any ideas, methods, instructions or products referred to in the content. |
© 2025 by the authors. Licensee MDPI, Basel, Switzerland. This article is an open access article distributed under the terms and conditions of the Creative Commons Attribution (CC BY) license (https://creativecommons.org/licenses/by/4.0/).
Share and Cite
Walcher, R.; Rabl, D.; Bürgler, M.; Hussain, R.I.; Maas, B.; Krautzer, B.; Moser, D.; Frank, T. The Potential of Newly Established Grassland Strips and Permanent Semi-Natural Grassland to Promote Common Carabids and Spiders on Arable Land. Insects 2025, 16, 439. https://doi.org/10.3390/insects16050439
Walcher R, Rabl D, Bürgler M, Hussain RI, Maas B, Krautzer B, Moser D, Frank T. The Potential of Newly Established Grassland Strips and Permanent Semi-Natural Grassland to Promote Common Carabids and Spiders on Arable Land. Insects. 2025; 16(5):439. https://doi.org/10.3390/insects16050439
Chicago/Turabian StyleWalcher, Ronnie, Dominik Rabl, Manuela Bürgler, Raja Imran Hussain, Bea Maas, Bernhard Krautzer, Dietmar Moser, and Thomas Frank. 2025. "The Potential of Newly Established Grassland Strips and Permanent Semi-Natural Grassland to Promote Common Carabids and Spiders on Arable Land" Insects 16, no. 5: 439. https://doi.org/10.3390/insects16050439
APA StyleWalcher, R., Rabl, D., Bürgler, M., Hussain, R. I., Maas, B., Krautzer, B., Moser, D., & Frank, T. (2025). The Potential of Newly Established Grassland Strips and Permanent Semi-Natural Grassland to Promote Common Carabids and Spiders on Arable Land. Insects, 16(5), 439. https://doi.org/10.3390/insects16050439