Simple Summary
The nun moth (Lymantria monacha L.), a defoliator of conifers and broad-leaved trees, is expanding its range, and outbreaks are increasingly occurring in the forests of central and eastern Europe. The only way to control and eradicate mass outbreaks of the pest is aerial spraying with a biological insecticide, Foray 76B. However, knowledge of variations in non-target insect assemblages following a treatment is limited. The present study aimed to determine the effect of the treatment on the diversity of non-target insects in Pinus sylvestris stands in three regions of Lithuania in the year following a nun moth outbreak. The treatment was found to influence the diversity of psyllids, ants, and beetles. Treated pine forests near the Baltic Sea exhibited lower insect species richness and a decreased relative abundance of beetles on the forest floor. The spraying influenced a reduction in the relative abundance of Carabus arcensis in the forests in the southern part of the country. The treatment also influenced the movement of ants from the tree canopy to the forest floor at all studied locations.
Abstract
Outbreaks of Lymantria monacha are of great concern, as their occurrence is predicted to become more intense and frequent due to a warming climate. A frequent treatment to control mass outbreaks of the pest is with the bioinsecticide Foray 76B. However, knowledge of how this treatment affects non-target insect species is limited. We surveyed the assemblages of non-target epigeal and arboreal insects in Pinus sylvestris forests in the year following bioinsecticide application. A collection of insects using sweep nets and pitfall traps was carried out in L. monacha-infested pine stands, (i) treated with Foray 76B and (ii) untreated, in three regions of Lithuania from May to October 2021. The results revealed that, in Neringa forests, species richness of the epigeal insects was lower in treated than in untreated sampling plots, with 36 and 41 different insect species, respectively. The relative abundance of epigeal Coleoptera in treated plots was 3.6%, while in untreated it was 53.2%. There was a significant decrease in the relative abundance of Carabus arcencis in Kapčiamiestis (by 7.4%) and Marcinkonys (by 16.7%). Treated plots were distinguished by lower relative abundance of arboreal Hymenoptera at all three study locations.
1. Introduction
Due to the warming climate, coniferous forests are increasingly vulnerable to various biotic and abiotic disturbances [1,2,3,4], including outbreaks of forest insects [5,6,7]. In consideration of its adaptability to a diverse range of soil and climatic conditions, Scots pine (Pinus sylvestris L.) is one of the most dominant coniferous tree species in hemiboreal forests across the northern hemisphere [8,9]. In Lithuania, Scots pine stands cover 34.5% of the total forest area [10].
Insects play a critical role in plant reproduction, soil fertility, forest health, and food-web interactions [11,12]. Most forest insect species are embedded in complex food webs [13]. Although some species of insects themselves provide food for birds, reptiles, bats, amphibians, and other animals [14], many of these species are predators that are important, especially during outbreaks of insect pests [15,16]. Specific insect species, such as beetles (Coleoptera) and ants (Formicidae), are indicators of forest health [17,18,19].
The nun moth (Lymantria monacha L.) is an important pest of Scots pine forests in central and northern Europe [20,21], expanding its distribution northward and causing frequent outbreaks [22]. Forests in Poland, the Czech Republic, and Germany [20,23], as well as in Lithuania and Latvia [24,25] experience frequent nun moth outbreaks. Since Scots pine stands provide habitats for many organisms, the spread of L. monacha can reduce their abundance or even threaten some species [26]. The nun moth outbreaks in Lithuania in 2018–2020 affected more than 6000 hectares of P. sylvestris stands [24]. In such extreme cases, Bacillus thuringiensis subspecies kurstaki Strain ABTS-351 (abbr. Btk, or Foray 76B), as an aerial treatment, is the most common biological agent used [27]. Although Btk is considered toxic only to lepidopterans (moths and butterflies) [28,29,30,31], the use of bioinsecticides utilizing Bacillus thuringiensis spores and toxins (including Btk) may impact non-target species [32]. These encompass beneficial insects involved in biological control [33], pollinators [34], and species coexisting with Btk-targeted insect pests [35]. However, there is a lack of knowledge regarding the indirect effects of treatment with Foray 76B against L. monacha outbreaks on such non-target species. To better understand and predict the effects of L. monacha outbreak treatments, a comprehensive assessment of their population dynamics is necessary.
We hypothesized that treatment with Foray 76B to control L. monacha outbreaks in P. sylvestris stands can lead to significant changes in epigeal and arboreal insect abundance and species assemblages. The present study aimed to determine the diversity and abundance of epigeal and arboreal insect species in Scots pine forests following L. monacha outbreaks and treatment with bioinsecticide.
2. Materials and Methods
2.1. Description of Forest Stands
Six 60–120-year-old P. sylvestris forest stands damaged by L. monacha outbreaks (tree crown defoliation, 30–60%) in Neringa, Kapčiamiestis, and Marcinkonys were selected for the study (Figure 1). Each of the six forest stands was treated with the biological insecticide Foray 76B in 2020 under the guidance of the State Forest Service. Meanwhile, the nearest L. monacha-damaged sampling plots (abbr. plots), which were not treated due to nearby protection zones, were selected as controls. The distance between the two forest stands at the same location was 5–30 km, and there was 2–3 km between treated and untreated plots of the same forest stand. The pine stands of Neringa grow in the dunes by the Baltic Sea at the transition between terrestrial and marine environments and have mild climatic conditions [36], whereas Kapčiamiestis and Marcinkonys in the southern part of the country experience harsher climatic conditions [37]. All the forest stands were characterized by normal humidity (N), very poor (a) or poor (b) fertility, light soil texture (l), and either cladoniosum (cl) or vaccinio-myrtilliosum (vm) vegetation type (Table 1).
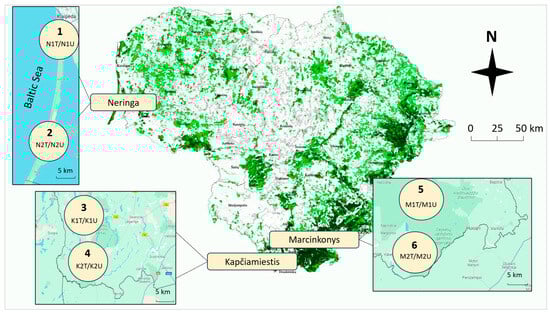
Figure 1.
Map of Lithuania showing six P. sylvestris forest stands (1–6) damaged by L. monacha outbreaks—in Neringa, Kapčiamiestis, and Marcinkonys. Circles represent different forest stands, where samples were collected from treated (e.g., N1T) and untreated (e.g., N1U) plots.

Table 1.
Characteristics of treated and untreated P. sylvestris forest stands. Data obtained by permission from the State Forest Cadaster as of 2021.
In each of the plots, the trapping of epigeal and arboreal insects was performed using two different methods: (I) pitfall traps and (II) entomological sweep nets.
2.2. Assessment of Epigeal Insects
Epigeal insects were sampled during the period of maximum arthropod activity in May–October 2021 (the following year after L. monacha outbreaks), using a modified Kamonen et al. (2015) method [39]. Pitfall traps, made of small plastic cups (6.5 cm diameter, 10 cm in depth), were dug into the substrate until they were flushed with the surrounding surface and filled with approximately 50 mL of 70% isopropyl alcohol. A nail-supported roof was installed 5 cm above the trap to reduce flooding and the accumulation of debris. In each plot, 5 traps were installed every 10 m, with a total of 30 traps in treated and 30 in untreated P. sylvestris plots. Insects were collected once a month, and the traps were filled with fresh isopropyl alcohol. The samples from 5 traps per plot were combined (total n = 12), transported to the laboratory, and dried at room temperature for 20 days. There was a total of 5 sample replicates over 5 months (6 forest stands × 2 plots per stand × 5 times). Identification of epigeal insects was performed using a Zeiss Stemi 2000-C microscope (Oberkochen, Germany) based on morphological characteristics and standard identification keys [40,41,42,43,44].
2.3. Assessment of Arboreal Insects
Sampling of arboreal insects was carried out during the same period and at the same plots as for epigeal insects (see above). In each plot, 50 sweeps around approximately 20 P. sylvestris tree branches were made with an entomological net in a 30 m2 crown area. Sampling was carried out on dry days. Collected arboreal insects were placed into a glass container with cotton wool, soaked in 99.2% chloroform for 15 min., sieved to remove plant material, and transferred to plastic boxes (n = 12). There was a total of 6 sample replicates over 6 monthly accountings (6 forest stands × 2 plots per stand × 6 times). The subsequent procedure for sample transportation, insect preparation, and identification was the same as described above for the epigeal insects.
2.4. Statistical Analysis
PC-Ord 6 was used to calculate Shannon’s [45] diversity index. R (Version 4.2.1) with RStudio (Version 1.1.456) was used to calculate the following: (1) the number of insect individuals; (2) the relative abundance of insects; (3) the insect species richness; (4) the nonparametric chi-square test; (5) the nonparametric Mann–Whitney test; (6) the nonmetric multidimensional scaling (NMDS) with 999 premutations (performed using metaMDS function from vegan package); (7) the permutational multivariate analysis of variance (PERMANOVA) (performed using adonis2 function with the Bray–Curtis distance metric from the vegan package); (8) ANOVA, followed by a Tukey HSD (Honestly Significant Difference). The statistically significant difference between analyzed groups was considered when the results of the Tukey HSD and ANOVA were less than 0.05. The reported relative abundance of analyzed groups represents the percentage (%) of insects that belong to treated or untreated plots from different locations. Visualization was performed using vegan, ggplot2, and lattice libraries in R with RStudio and Microsoft Excel 2010.
3. Results
3.1. Diversity of Epigeal Insects
During the study period, a total of 7210 individuals (4380 in treated and 2830 in untreated plots) of epigeal insects was trapped (Supplementary Table S1). The relative abundance of the epigeal insects, species richness, Shannon’s index, and NMDS between treated and untreated plots in Kapčiamiestis and Marcinkonys did not differ significantly (p > 0.05) in contrast to Neringa (Table 2). The relative abundance of epigeal insects in Neringa was significantly higher (p < 0.05) in treated (2274 individuals) than in untreated (703 individuals) plots. However, species richness in Neringa was significantly lower (p < 0.005) in treated than in untreated plots. Shannon’s diversity was lower in treated (N1T + N2T) than in untreated (N1U + N2U) plots (p < 0.05). The epigeal insect assemblages showed (the PERMANOVA confirmed) significant differences (p < 0.05) between treated and untreated plots in both forest stands (N1T/N1U: R = 0.056, p < 0.05; N2T/N2U: R = 0.9795, p < 0.05) (Figure 2).
Table 2.
Total number, relative abundance (%), number of insect species, and Shannon diversity of trapped epigeal insects in treated and untreated P. sylvestris plots in different forest stands.
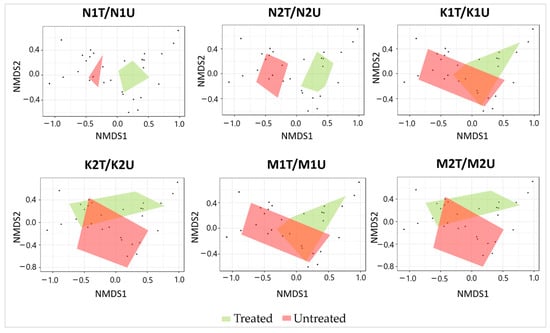
Figure 2.
Ordination diagram based on NMDS of epigeal insect assemblages detected in association with treated and untreated P. sylvestris plots in different forest stands. Each black dot in the diagrams represents an individual insect species.
In contrast to Neringa, there were only minor variations in the relative abundance of insects in treated and untreated plots in Kapčiamiestis and Marcinkonys (Figure 3). Hymenopterans had significantly higher (p < 0.05) relative abundance in treated (96.1%) than in untreated (45.9%) plots in Neringa (Figure 3a), while beetles had higher relative abundance in untreated (53.2%) than in treated (3.6%) plots. The relative abundance of insects from the Formicidae (Hymenoptera) family was 96.0% in treated and 42.8% in untreated plots in Neringa (Figure 3b). The relative abundance of the most frequently detected coleopterans, such as Carabidae, Curculionidae, and Geotrupidae, was 34.4%, 4.8%, and 2.8%, respectively in untreated, and 2.2%, 0.6%, and 0.4%, respectively, in treated plots. The relative abundance of non-target epigeal lepidopterans (Phalera bucephala (L.): Notodontidae) was less than 2% (Supplementary Table S1), and they were combined with other less abundant orders, including Diptera, Hemiptera, Dictyoptera, Neuroptera, and Archaeognatha as “Others” (Figure 3).
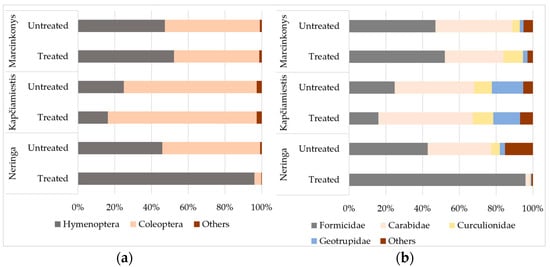
Figure 3.
The relative abundance (%) of epigeal insects in treated and untreated P. sylvestris plots in different locations, classified by (a) order and (b) family. Insect orders and families with the relative abundance of less than 2% are marked as “Others”.
Formica rufa and Myrmica rubra were the most dominant insect species in Neringa (Table 3). The relative abundance of F. rufa and M. rubra in treated plots was 46.2% and 49.3%, respectively, while in untreated plots it was 8.5% and 32.1%. In contrast, the relative abundance of the beetles Pterostichus niger, Calathus micropterus, and Staphylinus erythropterus in Neringa was significantly higher (p < 0.05) in untreated (11.1%, 9.0%, and 7.0%, respectively) than in treated (0.2%, 0.4%, and 0.1%, respectively) plots. The relative abundance of Carabus arcensis was higher in untreated than in treated plots in Kapčiamiestis (22.9% and 15.5%, respectively) and Marcinkonys (38.9% and 22.2%, respectively).
Table 3.
Relative abundance (%) of the 15 most abundant epigeal insect species in treated and untreated P. sylvestris plots in different locations, organized alphabetically by species name.
Among the epigeal insects, entomophagous composed the highest part in each location. The relative abundance of entomophagous insects showed non-significant differences (p > 0.05) between treated and untreated plots in Kapčiamiestis and Marcinkonys. In contrast, the relative abundance of entomophagous insects in Neringa was significantly higher (p < 0.05) in treated (98.5%) than in untreated (87.9%) plots. There was little variation in the relative abundance of phytophagous, coprophagous, and others, including dendrophagous, mycophagous, necrophagous, polyphagous, and saprophagous, between treated and untreated plots within each location.
3.2. Diversity of Arboreal Insects
A total of 380 and 448 arboreal insect individuals were captured in treated and untreated plots, respectively (Supplementary Table S2). The relative abundance of arboreal insects was significantly higher (p < 0.05) in untreated than in treated plots at Neringa and Marcinkonys (154 vs. 127 insect individuals, and 127 vs. 82 insect individuals, respectively) (Table 4). Meanwhile, neither the Chi-square test nor Shannon’s diversity showed significant differences (p > 0.05) between treated and untreated plots within each location. NMDS of the arboreal insect assemblages showed (and PERMANOVA confirmed) significant differences (p < 0.05) between treated and untreated plots in one of the two forest stands within each location (N1T/N1U: R = 0.352; K2T/K2U: R = 0.424; M1T/M1U: R = 0.300) (Figure 4).
Table 4.
Total number, relative abundance (%), number of insect species, and Shannon diversity of arboreal insects in treated and untreated P. sylvestris plots in different forest stands.
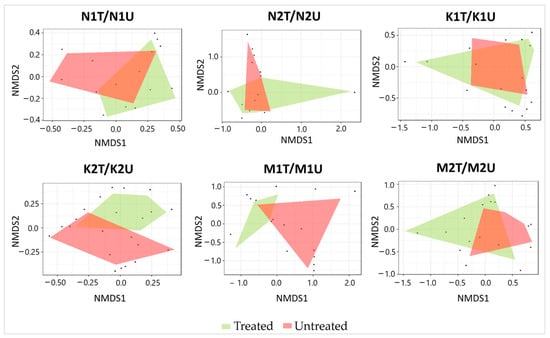
Figure 4.
Ordination diagram based on NMDS of arboreal insect assemblages detected in association with treated and untreated P. sylvestris plots in different forest stands. Each black dot in the diagram represents an individual insect species.
The relative abundance of hymenopterans was significantly lower (p < 0.05) in treated than in untreated plots in Neringa (41.7% and 73.4%), Kapčiamiestis (14.0% and 57.5%), and Marcinkonys (25.6% and 38.6%), respectively (Figure 5a). The decrease of the relative abundance of hymenopterans was mostly influenced by a reduction in ant numbers (Figure 5b). Meanwhile, the relative abundance of hemipterans was higher in treated than in untreated plots in Neringa (40.2% and 13.0%) and Kapčiamiestis (57.3% and 21.6%) (Figure 5a), caused mostly by Psyllidae (Figure 5b). The relative abundance of coleopterans was 40.2% in treated and 22.8% in untreated plots in Marcinkonys (Figure 5a). It was influenced by a higher relative abundance of Curculionidae (23.2% and 8.7%, respectively) (Figure 5b). The orders with relative abundance ≤ 2%, including the non-target geometrid and tortricid Lepidoptera (Supplementary Table S2) and other orders (Diptera, Dictyoptera, Neuroptera, Odonata, Orthoptera, and Psocoptera) are collectively shown as “Others” (Figure 5).
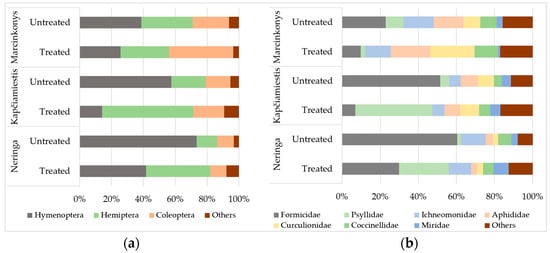
Figure 5.
Relative abundance (%) of arboreal insects in treated and untreated P. sylvestris plots in different locations classified by (a) order and (b) family. Insect orders and families with a relative abundance of less than 2% are marked as “Others”.
The relative abundance of Lasius sp. and F. rufa was lower in treated plots in Neringa (7.1% and 19.7%, respectively) and Kapčiamiestis (4.7% and 0.6%, respectively) than in untreated ones (Table 5). No individuals of F. rufa were found in Marcinkonys’ treated plots, while the relative abundance of F. rufa in untreated plots was 11.0%. Unlike F. rufa, the relative abundance of Strophosomus capitatum in Marcinkonys was higher in treated than in untreated plots. The relative abundance of Ichneumonidae sp. showed non-significant (p > 0.05) differences between treated and untreated plots (p > 0.05).
Table 5.
The relative abundance (%) of the 15 most abundant arboreal insect species in treated and untreated P. sylvestris plots in different locations, organized alphabetically by species name.
Among arboreal insects, entomophagous and phytophagous ones were the most common at each location. The relative abundance of entomophagous insects was 52.8% in treated and 81.8% in untreated plots in Neringa, 23.4% in treated and 65.3% in untreated plots in Kapčiamiestis, and 39.0% in treated and 52.8% in untreated plots in Marcinkonys.
4. Discussion
Previous studies on the potential control of L. monacha outbreaks have focused mainly on the use of pheromone traps [46], natural predators [47], entomopathogenic fungi [48] and viruses [49], or the bioinsecticide Foray 76B (B. thuringiensis subspecies kurstaki (Btk)) [50]. However, studies on the indirect effects of the Btk treatment on non-target insect populations were lacking. Our results highlight changes in non-target epigeal and arboreal insect diversity in P. sylvestris stands after treatment with Foray 76B.
Among all collected non-target insects in the year following mass L. monacha outbreaks, the most dominant were Coleoptera, Hymenoptera, and Hemiptera, while non-target Lepidoptera constituted a small part. Shifts in the diversity of these orders could be directly (for Lepidoptera) and indirectly (for Coleoptera, Hymenoptera, and Hemiptera) affected by Btk and may act as indicators of forest stress [51,52,53]. For instance, Coleoptera, which are considered the most species-rich order among insects [54], can either help to control populations of other insects [51] or can contribute to nutrient cycling and decomposition processes [55]. The findings of our study revealed that the changes in the diversity of Coleoptera mostly depended on the population of ground beetles (Carabidae), which spend their entire life cycle on the forest floor or underground [56]. Hymenopterans, including bees, wasps, and ants, can also contribute to insect pest control through their functions in predation [57], decomposition [58], support of the food web [59], and parasitism [60]. Our study showed that the diversity of epigeal and arboreal Hymenoptera was similar, highlighting their potential role in facilitating trophic connections between different forest strata [61]. This can be influenced by their life cycle and active vertical movement [62]. Shifts in the diversity of true bugs (Hemiptera) can also indicate changes in forest ecosystems [63]. In the year following mass L. monacha outbreaks, hemipterans exhibited higher diversity in the P. sylvestris canopy compared to the forest floor, confirming their ecological functions as sapsuckers [64]. Lepidoptera are influential in forest ecosystems, and, as prey, they provide nutrients for entomophagous insects, birds, and bats [65]. Other studies showed that the recovery after Btk treatment of non-target Lepidoptera varies among different species [66]. For instance, the populations of non-target Lepidoptera in Douglas-fir forests after Btk treatment may partially recover in the following year and require at least two years to fully recover [67]. However, based on the low abundance of Lepidoptera in our study, it is difficult to compare these results with other similar studies.
The results of our study showed an indirect association between the applied sprays with Foray 76B and the species richness of non-target insects in Neringa. The species richness of the epigeal insects was lower in bioinsecticide-treated P. sylvestris plots, where the 1st and 2nd instar larvae of the pest are usually killed within 2–5 days after the treatment [68]. However, the species richness of arboreal insects did not differ between treated and untreated P. sylvestris plots. Nevertheless, the relative abundance of different orders of non-target insects in tree canopies was clearly distinguished between treated and untreated plots in all locations. A higher relative abundance of arboreal psyllids (sapsuckers) was observed in the bioinsecticide-treated plots. It is known that sapsuckers are indirectly driven by environmental factors that affect the defenses and nutritional quality of trees [69]. Despite being influenced by drought, the general association of sapsuckers with defoliators is more complex [69,70]. Food source competition between sapsuckers and defoliators may lead to the fact that the timing and frequency of their outbreaks differ [71]. Increased relative abundance of sapsuckers in Foray 76B-treated plots could indicate that trees are still under physiological stress after the disruption of their natural enemies—L. monacha larvae [72].
The abundance of Formicidae ants could be related to the populations of defoliator [73] and psyllids [74]. We determined a lower population of arboreal red wood ants (Formica rufa) in Foray 76B-treated than in untreated P. sylvestris stands. This may indicate the role of F. rufa in controlling still active defoliator outbreaks in untreated stands. Even though the food-searching behavior of F. rufa is primarily related to the abundance of the psyllids, and approximately 85% of the dry mass of the F. rufa diet consists of honeydew from them [75,76,77], a higher relative abundance of psyllids did not induce an increased population of F. rufa ants in the canopies of treated stands. However, the increased psyllid population might have a stimulating effect on the increased prevalence of the epigeal F. rufa ants, which are characterized by their adaptation and ability to navigate through different ecological strata, including the forest canopy, understory, and forest floor, as much as needed [78,79,80,81,82]. Given that F. rufa has long been valued for its role in controlling insect pest outbreaks in temperate and boreal forests [83], it is possible that an increase in their arboreal population during the outbreaks of L. monacha could naturally contribute to pest management.
The results of our study also indicated significant changes in the diversity of epigeal Coleoptera in the following year after applied treatment with bioinsecticide Foray 76B. The most dominant species of ground beetle was Carabus arcensis, which is common in P. sylvestris forests in eastern Europe [84]. We found a decreased relative abundance of C. arcensis in treated P. sylvestris plots, which might be influenced by less direct sunlight on the forest floor through the canopy after defoliation of the trees was stopped [85], or the increased relative abundance of epigeal F. rufa ants [83]. Several field studies have reported that the association between the relative abundance of certain species of Carabidae and F. rufa is based on their interference competition [86,87]. C. arsensis can be a bioindicator of certain biotic and abiotic stress in forests [88]. However, due to climate change and habitat destruction, the species abundance is declining in Europe [89,90]. Our study revealed that treatment with Foray 76B may indirectly contribute to C. arcensis decline. Nevertheless, the proliferation of L. monacha outbreaks in recent years [25] could have a serious impact on C. arcensis populations in Europe.
Sudden fluctuations in the relative abundance of forest insects due to their feeding habits may result in significant damage to overall forest health [91,92]. In our study, the relative abundance of arboreal entomophagous and phytophagous insects distinguished between Foray 76B-treated and untreated P. sylvestris stands. A lower ratio of the arboreal entomophagous in treated plots in the following year after the outbreaks could be influenced by the reduced level of the defoliator [92]. However, an increased relative abundance of arboreal phytophagous insects in treated plots may be related to several factors: (1) better nutritional quality of tree needles and (2) P. sylvestris trees still experiencing stress caused by the outbreaks of L. monacha.
Overall, the results of the conducted studies show that treatment with Foray 76B to control the mass outbreaks of L. monacha may indirectly influence the diversity and species composition of non-target insect assemblages, resulting in a possible impact on the health and resilience of the forest stands. The study provides valuable knowledge regarding the interactions between non-target insects and how they are affected by biotic disturbance. Further research to assess whether changes in the diversity and composition of non-target insect assemblages are a long-term phenomenon, or whether resilience may occur over time, is needed. Although the short-term effect of Foray 76B on non-target organisms might be negligible, the impact of frequent repeated applications of biological agents on most ecosystems is not well known [32,34,93]. It is probable that any regular disruption of insect assemblages, due to chemical or microbial insecticides or natural factors, could have long-term deleterious effects on ecosystem structure [94]. Therefore, complex research, including other ecosystem factors such as soil chemistry and microbial diversity after the applied treatment, is demanding.
Supplementary Materials
The following supporting information can be downloaded at: https://www.mdpi.com/article/10.3390/insects15030200/s1, Supplementary Table S1: Relative abundance (%) of epigeal insects in Pinus sylvestris in Lithuania. Supplementary Table S2: Relative abundance (%) of arboreal insects in Pinus sylvestris in Lithuania.
Author Contributions
Conceptualization, V.Č., D.M. and A.G.; methodology, V.Č., D.M. and A.G.; validation, V.Č. and D.M.; formal analysis, V.Č. and D.M.; investigation, V.Č., D.M., J.L. and A.G.; data curation, V.Č. and D.M.; writing—original draft preparation, V.Č. and D.M.; writing—review and editing, V.Č., D.M., A.G. and J.L.; visualization, V.Č. and D.M.; supervision, D.M.; project administration, V.Č. and D.M. All authors have read and agreed to the published version of the manuscript.
Funding
This research received no external funding.
Data Availability Statement
The relative abundance (%) of epigeal and arboreal insects in Pinus sylvestris in Lithuania presented in this study are presented in Tables S1 and S2. Other data related to the study are available on request from the corresponding author.
Acknowledgments
We appreciate Ieva Čėsnienė for help with insect collection and identification and Valeriia Mishcherikova for help with data visualization.
Conflicts of Interest
The authors declare no conflicts of interest.
References
- Cornelissen, T. Climate Change and Its Effects on Terrestrial Insects and Herbivory Patterns. Neotrop. Entomol. 2011, 40, 155–163. [Google Scholar] [CrossRef]
- Pureswaran, D.S.; Roques, A.; Battisti, A. Forest Insects and Climate Change. Curr. For. Rep 2018, 4, 35–50. [Google Scholar] [CrossRef]
- Buras, A.; Menzel, A. Projecting Tree Species Composition Changes of European Forests for 2061–2090 under RCP 4.5 and RCP 8.5 Scenarios. Front. Plant Sci. 2019, 9, 435160. [Google Scholar] [CrossRef]
- Reich, P.B.; Oleksyn, J. Climate Warming Will Reduce Growth and Survival of Scots Pine except in the Far North. Ecol. Lett. 2008, 11, 588–597. [Google Scholar] [CrossRef]
- Netherer, S.; Schopf, A. Potential Effects of Climate Change on Insect Herbivores in European Forests-General Aspects and the Pine Processionary Moth as Specific Example. For. Ecol. Manag. 2010, 259, 831–838. [Google Scholar] [CrossRef]
- Robson, J.R.M.; Conciatori, F.; Tardif, J.C.; Knowles, K. Tree-Ring Response of Jack Pine and Scots Pine to Budworm Defoliation in Central Canada. For. Ecol. Manag. 2015, 347, 83–95. [Google Scholar] [CrossRef]
- de Groot, M.; Ogris, N. Short-Term Forecasting of Bark Beetle Outbreaks on Two Economically Important Conifer Tree Species. For. Ecol. Manag. 2019, 450, 117495. [Google Scholar] [CrossRef]
- Millberg, H.; Boberg, J.; Stenlid, J. Changes in Fungal Community of Scots Pine (Pinus Sylvestris) Needles along a Latitudinal Gradient in Sweden. Fungal Ecol. 2015, 17, 126–139. [Google Scholar] [CrossRef]
- Hallingbäck, H.R.; Burton, V.; Vizcaíno-Palomar, N.; Trotter, F.; Liziniewicz, M.; Marchi, M.; Berlin, M.; Ray, D.; Benito Garzón, M. Managing Uncertainty in Scots Pine Range-Wide Adaptation Under Climate Change. Front. Ecol. Evol. 2021, 9, 724051. [Google Scholar] [CrossRef]
- Čėsna, V.; Čėsnienė, I.; Sirgedaitė-Šėžienė, V.; Marčiulynienė, D. Changes in Biologically Active Compounds in Pinus sylvestris Needles after Lymantria monacha Outbreaks and Treatment with Foray 76B. Plants 2024, 13, 328. [Google Scholar] [CrossRef]
- Brockerhoff, E.G.; Liebhold, A.M. Ecology of Forest Insect Invasions. Biol. Invasions 2017, 19, 3141–3159. [Google Scholar] [CrossRef]
- Hillstrom, M.L.; Lindroth, R.L. Elevated Atmospheric Carbon Dioxide and Ozone Alter Forest Insect Abundance and Community Composition. Insect Conserv. Divers. 2008, 1, 233–241. [Google Scholar] [CrossRef]
- Liebhold, A.; Bentz, B. Insect Disturbance and Climate Change. US Department of Agriculture, Forest Service, Climate Change Resource Center. 2011. Available online: www.fs.usda.gov/ccrc/topics/insectdisturbance/insect-disturbance (accessed on 22 January 2024).
- Goulson, D. The Insect Apocalypse, and Why It Matters. Curr. Biol. 2019, 29, R967–R971. [Google Scholar] [CrossRef]
- Sugiura, S. Predators as Drivers of Insect Defenses. Entomol. Sci. 2020, 23, 316–337. [Google Scholar] [CrossRef]
- Boukouvala, M.C.; Kavallieratos, N.G.; Skourti, A.; Pons, X.; Alonso, C.L.; Eizaguirre, M.; Fernandez, E.B.; Solera, E.D.; Fita, S.; Bohinc, T.; et al. Lymantria Dispar (L.) (Lepidoptera: Erebidae): Current Status of Biology, Ecology, and Management in Europe with Notes from North America. Insects 2022, 13, 854. [Google Scholar] [CrossRef]
- Parikh, G.; Rawtani, D.; Khatri, N. Insects as an Indicator for Environmental Pollution. Environ. Claims J. 2021, 33, 161–181. [Google Scholar] [CrossRef]
- Guénard, B. An Overview of the Species and Ecological Diversity of Ants. In eLS; Wiley: Hoboken, NJ, USA, 2013. [Google Scholar] [CrossRef]
- Kaiser, L.; Ode, P.; Van Nouhuys, S.; Calatayud, P.A.; Colazza, S.; Cortesero, A.M.; Thiel, A.; Van Baaren, J. The Plant as Habitat for Entomophagous insects. Adv. Bot. Res. 2017, 81, 179–223. [Google Scholar] [CrossRef]
- Nakládal, O.; Brinkeová, H. Review of Historical Outbreaks of the Nun Moth (Lymantria Monacha) with Respect to Host Tree Species. J. For. Sci. 2015, 61, 18–26. [Google Scholar] [CrossRef]
- Głowacka, B. The nun moth (Lymantria monacha) as a pest of coniferous forests in Poland. In Proceeding of the Integrated Management of Forest Lymantriidae, Warsaw, Poland, 27–29 March 1996; pp. 33–40. [Google Scholar]
- Fält-Nardmann, J.J.J.; Tikkanen, O.P.; Ruohomäki, K.; Otto, L.F.; Leinonen, R.; Pöyry, J.; Saikkonen, K.; Neuvonen, S. The Recent Northward Expansion of Lymantria monacha in Relation to Realised Changes in Temperatures of Different Seasons. For. Ecol. Manag. 2018, 427, 96–105. [Google Scholar] [CrossRef]
- Wanner, M.; Wiesener, C.; Otto, L.; Xylander, W.E.R. Short-Term Effects of a Nun Moth Suppression Programme (Lymantria monacha), (Lepidoptera: Lymantriidae) on Epigeic Non-Target Arthropods. J. Pest Sci. 2005, 78, 7–11. [Google Scholar] [CrossRef]
- State Forest Service. Lithuanian Statistical Yearbook of Forestry 2020; Ministry of Environment, State Forest Service: Vilnius, Lithuania, 2021. [Google Scholar]
- Siliņš, I.; Kārkliņa, A.; Miezīte, O.; Jansons, Ā. Trends in Outbreaks of Defoliating Insects Highlight Growing Threats for Central European Forests, and Implications for Eastern Baltic Region. Forests 2021, 12, 799. [Google Scholar] [CrossRef]
- Beule, L.; Grüning, M.M.; Karlovsky, P.; L-M-Arnold, A. Changes of Scots Pine Phyllosphere and Soil Fungal Communities during Outbreaks of Defoliating Insects. Forests 2017, 8, 316. [Google Scholar] [CrossRef]
- Olivieri, M.; Mannu, R.; Ruiu, L.; Ruiu, P.A.; Lentini, A. Comparative Efficacy Trials with Two Different Bacillus thuringiensis Serovar Kurstaki Strains against Gypsy Moth in Mediterranean Cork Oak Forests. Forests 2021, 12, 602. [Google Scholar] [CrossRef]
- Meher, S.M.; Bodhankar, S.L.; Dhuley, J.N.; Khodape, D.J.; Naik, S.R. Toxicity Studies of Microbial Insecticide Bacillus thuringiensis Var. Kenyae in Rats, Rabbits, and Fish. Int. J. Toxicol. 2002, 21, 99–105. [Google Scholar] [CrossRef]
- Beavers, J.; Smith, G. An Avian Oral Pathogenicity and Toxicity Study in the Mallard: Lab Project Number: 297-106; (Unpublished Study); Wildlife International Ltd.: New York, NY, USA, 1990; p. 19. [Google Scholar]
- Christensen, K. Dipel Technical Material (Bacillus thuringiensis var. kurstaki)—Infectivity and Pathogenicity to Rainbow Trout (Onchorhyncus mykiss) during a 32-Day State Renewal Test: Lab Project Number: 2469.0889.6107.157; 90-2-3219; (Unpublished Study); Springborn Laboratories, Inc.: Spencerville, OH, USA, 1990; p. 77. [Google Scholar]
- EPA. EPA Registration Eligibility Decision (RED) Bacillus thuringiensis, EPA 738-R-98-004. March 1998. Available online: https://www3.epa.gov/pesticides/chem_search/reg_actions/reregistration/red_PC-006400_30-Mar-98.pdf (accessed on 22 January 2024).
- Babin, A.; Nawrot-Esposito, M.P.; Gallet, A.; Gatti, J.L.; Poirié, M. Differential Side-Effects of Bacillus thuringiensis Bioinsecticide on Non-Target Drosophila Flies. Sci. Rep. 2020, 10, 16241. [Google Scholar] [CrossRef]
- Amichot, M.; Curty, C.; Benguettat-Magliano, O.; Gallet, A.; Wajnberg, E. Side Effects of Bacillus thuringiensis Var. kurstaki on the Hymenopterous Parasitic Wasp Trichogramma chilonis. Environ. Sci. Pollut. Res. 2016, 23, 3097–3103. [Google Scholar] [CrossRef]
- Renzi, M.T.; Amichot, M.; Pauron, D.; Tchamitchian, S.; Brunet, J.L.; Kretzschmar, A.; Maini, S.; Belzunces, L.P. Chronic Toxicity and Physiological Changes Induced in the Honey Bee by the Exposure to Fipronil and Bacillus thuringiensis Spores Alone or Combined. Ecotoxicol. Environ. Saf. 2016, 127, 205–213. [Google Scholar] [CrossRef]
- Caquet, T.; Roucaute, M.; Le Goff, P.; Lagadic, L. Effects of Repeated Field Applications of Two Formulations of Bacillus thuringiensis Var. israelensis on Non-Target Saltmarsh Invertebrates in Atlantic Coastal Wetlands. Ecotoxicol. Environ. Saf. 2011, 74, 1122–1130. [Google Scholar] [CrossRef]
- Martínez, M.L.; Psuty, N.P. Coastal Dunes; Springer: Berlin, Germany, 2004. [Google Scholar]
- Rimkus, E.; Stonevičius, E.; Kilpys, J.; Mačiulytė, V.; Valiukas, D. Drought identification in the eastern Baltic region using NDVI. Earth Syst. Dyn. 2017, 8, 627–637. [Google Scholar] [CrossRef]
- Vaičys, M. Miško dirvožemiu klasifikacija. In Lietuvos Dirvožemiai; Mokslas: Vilnius, Lithuania, 2001; pp. 1040–1043. (In Lithuanian) [Google Scholar]
- Komonen, A.; Overmark, E.; Hytonen, J.; Halme, P. Tree species influences diversity of ground-dwelling insects in afforested fields. For. Ecol. Manag. 2015, 349, 12–19. [Google Scholar] [CrossRef]
- Tamutis, V.; Aleseev, V. A survey of Lepturinae Latreille, 1802 (Coleoptera: Cerambycidae) of the south-eastern Baltic region (Lithuania and the Kaliningrad Region). Biologija 2020, 66, 169–235. [Google Scholar] [CrossRef]
- Tamutis, V.; Tamutė, B.; Ferenca, R. A catalogue of Lithuanina beetles (Insecta: Coleoptera). ZooKeys 2011, 121, 1–494. [Google Scholar] [CrossRef]
- Tamutis, V. Eighty-two new for Lithuania beetle (Coleoptera) species. In New and Rare for Lithuania Insect Species; Lithuanian Entomological Society: Vilnius, Lithuania, 2003; Volume 15, pp. 54–62. [Google Scholar]
- Ivinskis, P.; Meržijevskis, A.; Rimšaitė, J. Data on new and rare for the Lithuanian fauna species of Coleoptera. In New and Rare for Lithuania Insect Species; Lithuanian Entomological Society: Vilnius, Lithuania, 2009; Volume 21, pp. 45–63. [Google Scholar]
- Ivinskis, P. Lepidoptera of Lithuania; Annotated Catalogue; Petro ofsetas: Vilnius, Lithuania, 2004. (In Lithuanian) [Google Scholar]
- Shannon, C.E. A mathematical theory of communication. Bell Syst. Tech. J. 1948, 27, 379–423. [Google Scholar] [CrossRef]
- Stancă-Moise, C.; Brereton, T.; Blaj, R. The control of the defoliator Lymantra monacha L. populations (Lepidoptera: Lymantriidae) by making use of pheromone traps in the Forest Range Miercurea Sibiului (Romania) in the period 2011–2015. Sci. Pap. Ser. Manag. Econ. Eng. Agric. Rural Dev. 2017, 17, 327–331. [Google Scholar]
- Stancă-Moise, C.; Brereton, T. Monitoring and Control Of The Defoliator Population Lymantria monacha (L., 1758) Within The Forestry Field RĂȘinari (Sibiu, Romania). Analele Univ. Din Oradea Fasc. Biol. 2020, 27, 27–31. [Google Scholar]
- Kereselidze, M.; Draganova, S.; Pilarska, D.; Linde, A. Susceptibility of Lymantria monacha and L. dispar to the Entomopathogenic Fungus Isaria Fumosorosea Wize. Sumar List 2014, 138, 185–191. [Google Scholar]
- Raj, M.N.; Samal, I.; Paschapur, A.; Subbanna, A.R.N.S. Entomopathogenic viruses and their potential role in sustainable pest management. In New and Future Developments in Microbial Biotechnology and Bioengineering; Elsevier: Amsterdam, The Netherlands, 2022; pp. 47–72. [Google Scholar]
- Brunk, I.; Sobczyk, T.; Roth, M. Pest Control in German Forests: General Patterns of Biodiversity and Possible Impacts of Btk, Diflubenzuron and Lambda-Cyhalothrin on Non-Target Arthropods, Birds and Bats—A Literature Review. J. For. Landsc. Res. 2019, 4, 1–26. [Google Scholar] [CrossRef]
- Rainio, J.; Niemela, J. Ground beetles (Coleoptera: Carabidae) as bioindicators. Biodivers. Conserv. 2003, 12, 487–506. [Google Scholar] [CrossRef]
- Andersen, A.N.; Hoffmann, B.D.; Müller, W.J.; Griffiths, A.D. Using Ants as Bioindicators in Land Management: Simplifying Assessment of Ant Community Responses. J. Appl. Ecol. 2002, 39, 8–17. [Google Scholar] [CrossRef]
- Fauvel, G. Diversity of Heteroptera in Agroecosystems: Role of Sustainability and Bioindication. Agric. Ecosyst. Environ. 1999, 74, 275–303. [Google Scholar] [CrossRef]
- Bouchard, P.; Smith, A.B.T.; Douglas, H.; Gimmel, M.L.; Brunke, A.J.; Kanda, K. Biodiversity of Coleoptera; Wiley: Hoboken, NJ, USA, 2017. [Google Scholar] [CrossRef]
- Magni, P.A.; Voss, S.C.; Testi, R.; Borrini, M.; Dadour, I.R. A biological and procedural review of forensically significant Dermestes species (Coleoptera: Dermestidae). J. Med. Entomol. 2015, 52, 755–769. [Google Scholar] [CrossRef]
- Çiftçi, D.; Hasbenli, A. Diversity Analysis of the Subfamilies Steninae, Staphylininae and Paederinae (Coleoptera: Staphylinidae) in Different Habitats of the Sündiken Mountains, Turkey. Acta Zool. Bulg. 2018, 70, 319–329. [Google Scholar]
- Way, M.J.; Cammell, M.E.; Bolton, B.; Kanagaratnam, P. Ants (Hymenoptera: Formicidae) as egg predators of coconut pests, especially in relation to biological control of the coconut caterpillar, Opisina arenosella Walker (Lepidoptera: Xyloryctidae), in Sri Lanka. Bull. Entomol. Res. 1989, 79, 219–234. [Google Scholar] [CrossRef]
- Del Toro, I.; Ribbons, R.R.; Pelini, S.L. The Little Things That Run the World Revisited: A Review of Ant-Mediated Ecosystem Services and Disservices (Hymenoptera: Formicidae). Myrmecol. News 2012, 17, 133–146. [Google Scholar]
- Phillips, I.D.; Willis, C.K.R. Defensive Behavior of Ants in a Mutualistic Relationship with Aphids. Behav. Ecol. Sociobiol. 2005, 59, 321–325. [Google Scholar] [CrossRef]
- Torres, J. Lepidoptera outbreaks in response to successional changes after the passage of Hurricane Hugo in Puerto Rico. J. Trop. Ecol. 1992, 8, 285–298. [Google Scholar] [CrossRef]
- Parker, J.; Kronauer, D.J.C. How Ants Shape Biodiversity. Curr. Biol. 2021, 31, R1208–R1214. [Google Scholar] [CrossRef] [PubMed]
- Burchill, A.T.; Pavlic, T.P.; Pratt, S.C.; Reid, C.R. Weaver Ants Regulate the Rate of Prey Delivery during Collective Vertical Transport. J. Exp. Biol. 2023, 226, jeb245634. [Google Scholar] [CrossRef]
- Moir, M.L.; Brennan, K.E.C. Using bugs (Hemiptera) as ecological and environmental indicators in forest ecosystems. In Forest Ecology Research Horizons; Nova: New York, NY, USA, 2007; pp. 203–238. [Google Scholar]
- de Souza Amorim, D.; Brown, B.V.; Boscolo, D.; Ale-Rocha, R.; Alvarez-Garcia, D.M.; Balbi, M.I.P.A.; de Marco Barbosa, A.; Capellari, R.S.; de Carvalho, C.J.B.; Couri, M.S.; et al. Vertical Stratification of Insect Abundance and Species Richness in an Amazonian Tropical Forest. Sci. Rep. 2022, 12, 1734. [Google Scholar] [CrossRef]
- Ober, H.K.; Hayes, J.P. Determinants of nocturnal lepidopteran diversity and community structure in a conifer-dominated forest. Biodivers. Conserv. 2010, 19, 761–774. [Google Scholar] [CrossRef]
- Boulton, T.J.; Otvos, I.S.; Ring, R.A. Monitoring Nontarget Lepidoptera on Ribes cereum to Investigate Side Effects of an Operational Application of Bacillus thuringiensis subsp. kurstaki. Environ. Entomol. 2002, 31, 903–913. [Google Scholar] [CrossRef]
- Boulton, T.J.; Otvos, I.S. Monitoring native non-target Lepidoptera for three years following a high dose and volume application of Bacillus thuringiensis subsp. kurstaki. Int. J. Pest Manag. 2004, 50, 297–305. [Google Scholar] [CrossRef]
- van Frankenhuyzen, K.; Nystrom, C.; Dedes, J.; Seligy, V. Mortality, feeding inhibition, and recovery of spruce budworm (Lepidoptera: Tortricidae) larvae following aerial application of a high-potency formulation of Bacillus thuringiensis subsp. kurstaki. Can. Entomol. 2000, 132, 505–518. [Google Scholar] [CrossRef]
- Johnson, D.M.; Haynes, K.J. Spatiotemporal dynamics of forest insect populations under climate change. Curr. Opin. Insect Sci. 2023, 56, 101020. [Google Scholar] [CrossRef]
- Marini, L.; Ayres, M.P.; Jactel, H. Impact of Stand and Landscape Management on Forest Pest Damage. Annu. Rev. Entomol. 2022, 67, 181–199. [Google Scholar] [CrossRef]
- Perevaryukha, A.Y. A Continuous Model for Oscillating Outbreaks of the Population of a Phytophagous Moth, the Tent Caterpillar, Malacosoma Disstria (Lepidoptera, Lasiocampidae). Biophysics 2020, 65, 118–130. [Google Scholar] [CrossRef]
- Branco, M.; Franco, J.C.; Mendel, Z. Sap-Sucking Forest Pests. In Forest Entomology and Pathology: Volume 1: Entomology; Springer International Publishing: Cham, Switzerland, 2023; pp. 417–456. [Google Scholar]
- Karhu, K.J. Effects of ant exclusion during outbreaks of a defoliator and a sap-sucker on birch. Ecol. Entomol. 1998, 23, 185–194. [Google Scholar] [CrossRef]
- Hodek, I.; Honěk, A. Scale Insects, Mealybugs, Whiteflies and Psyllids (Hemiptera, Sternorrhyncha) as Prey of Ladybirds. Biol. Control 2009, 51, 232–243. [Google Scholar] [CrossRef]
- Mabelis, A.A. Flying as a survival strategy for wood ants in a fragmented landscape (Hymenoptera, Formicidae). Memorab. Zool. 1994, 48, 147–170. [Google Scholar]
- Denny, A.J.; Wright, J.; Grief, B. Foraging efficiency in the wood ant, Formica rufa: Is time of the essence in trail following? Anim. Behav. 2001, 62, 139–146. [Google Scholar] [CrossRef][Green Version]
- Vandegehuchte, M.L.; Wermelinger, B.; Fraefel, M.; Baltensweiler, A.; Düggelin, C.; Brändli, U.-B.; Freitag, A.; Bernasconi, C.; Cherix, D.; Risch, A.C. Distribution and habitat requirements of red wood ants in Switzerland: Implications for conservation. Biol. Conserv. 2017, 212, 366–375. [Google Scholar] [CrossRef]
- Rosengren, R.; Vespäläinen, K.; Wourenrie, H. Distribution, nest densities, and ecological significance of wood ants (the Formica rufa group) in Finland. OILB Bull. SROP II 1979, 3, 181–213. [Google Scholar]
- Pisarski, B.; Czechowski, W. The course of artificial colonization of red wood ants in the Gorce National Park. Memorab. Zool. 1990, 44, 37–46. [Google Scholar]
- Czechowski, W.; Vepsäläinen, K. Territory size of wood ants (Hymenoptera: Formicidae): A search for limits of existence of Formica polyctena Först, an inherently polygynic and polycalic species. Ann. Zool. 2009, 59, 179–187. [Google Scholar] [CrossRef]
- Czechowski, W.; Rutkowski, T.; Stephan, W.; Vepsäläinen, K. Living beyond the limits of survival: Wood ants trapped in a gigantic pitfall. J. Hymenopt. Res. 2016, 51, 227–239. [Google Scholar] [CrossRef][Green Version]
- Rutowski, T.; Maák, I.; Vepsäläinen, K.; Trigos-Peral, G.; Stephan, W.; Wojtaszyn, G.; Czechowski, W. Ants trapped for years in an old bunker; survival by cannibalism and eventual escape. J. Hymenopt. Res. 2019, 72, 177–184. [Google Scholar] [CrossRef]
- Parmentier, T.; Dekoninck, W.; Wenseleers, T. A Highly Diverse Microcosm in a Hostile World: A Review on the Associates of Red Wood Ants (Formica rufa Group). Insectes Soc. 2014, 61, 229–237. [Google Scholar] [CrossRef]
- Dapkus, D.; Tamutis, V. Assemblages of Beetles (Coleoptera) in a Peatbog and Surrounding Pine Forest. Balt. J. Coleopterol. 2008, 8, 31–40. [Google Scholar]
- Yamanaka, S.; Yamaura, Y.; Sayama, K.; Sato, S.; Ozaki, K. Effects of Dispersed Broadleaved and Aggregated Conifer Tree Retention on Ground Beetles in Conifer Plantations. For. Ecol. Manag. 2021, 489, 119073. [Google Scholar] [CrossRef]
- Hawes, C.; Stewart, A.J.A.; Evans, H.F. The Impact of Wood Ants (Formica rufa) on the Distribution and Abundance of Ground Beetles (Coleoptera: Carabidae) in a Scots Pine Plantation. Oecologia 2002, 131, 612–619. [Google Scholar] [CrossRef]
- Hawes, C.; Evans, H.F.; Stewart, A.J.A. Interference Competition, Not Predation, Explains the Negative Association between Wood Ants (Formica rufa) and Abundance of Ground Beetles (Coleoptera: Carabidae). Ecol. Entomol. 2013, 38, 315–322. [Google Scholar] [CrossRef]
- Kędzior, R.; Szwalec, A.; Mundała, P.; Skalski, T. Ground Beetle (Coleoptera, Carabidae) Life History Traits as Indicators of Habitat Recovering Processes in Postindustrial Areas. Ecol. Eng. 2020, 142, 105615. [Google Scholar] [CrossRef]
- Hansen, A.K.; Justesen, M.J.; Olsen, M.T.; Solodovnikov, A. Genomic Population Structure and Conservation of the Red Listed Carabus arcensis (Coleoptera: Carabidae) in Island–Mainland Habitats of Northern Europe. Insect Conserv. Divers. 2018, 11, 255–266. [Google Scholar] [CrossRef]
- Brooks, D.R.; Bater, J.E.; Clark, S.J.; Monteith, D.T.; Andrews, C.; Corbett, S.J.; Beaumont, D.A.; Chapman, J.W. Large Carabid Beetle Declines in a United Kingdom Monitoring Network Increases Evidence for a Widespread Loss in Insect Biodiversity. J. Appl. Ecol. 2012, 49, 1009–1019. [Google Scholar] [CrossRef]
- Jactel, H.; Koricheva, J.; Castagneyrol, B. Responses of Forest Insect Pests to Climate Change: Not so Simple. Curr. Opin. Insect Sci. 2019, 35, 103–108. [Google Scholar] [CrossRef] [PubMed]
- Cortesero, A.M.; Stapel, J.O.; Lewis, W.J. Understanding and Manipulating Plant Attributes to Enhance Biological Control. Biol. Control 2000, 17, 35–49. [Google Scholar] [CrossRef]
- EFSA Panel on Biological Hazards (BIOHAZ). Risks for Public Health Related to the Presence of Bacillus Cereus and Other Bacillus spp. Including Bacillus thuringiensis in Foodstuffs. EFSA J. 2016, 14, e04524. [Google Scholar] [CrossRef]
- Lacey, L.A.; Siegel, J.P. Safety and ecotoxicology of entomopathogenic bacteria. In Entomopathogenic Bacteria: From Laboratory to Field Application; Charles, J.F., Delécluse, A., Roux, C.N.L., Eds.; Springer: Dordrecht, The Netherlands, 2000. [Google Scholar] [CrossRef]
Disclaimer/Publisher’s Note: The statements, opinions and data contained in all publications are solely those of the individual author(s) and contributor(s) and not of MDPI and/or the editor(s). MDPI and/or the editor(s) disclaim responsibility for any injury to people or property resulting from any ideas, methods, instructions or products referred to in the content. |
© 2024 by the authors. Licensee MDPI, Basel, Switzerland. This article is an open access article distributed under the terms and conditions of the Creative Commons Attribution (CC BY) license (https://creativecommons.org/licenses/by/4.0/).