Article

Genetic Diversity and Population Structure of Anopheles funestus in Western Kenya Based on Mitochondrial DNA Marker COII

1
West Africa Centre for Cell Biology of Infectious Pathogen (WACCBIP), University of Ghana, Accra P.O. Box LG 54, Ghana
2
Sub-Saharan Africa International Centre of Excellence for Malaria Research, Homabay P.O. Box 199-40300, Kenya
3
Centre for Global Health Research, Kenya Medical Research Institute, Kisumu P.O. Box 20778-00202, Kenya
4
Program in Public Health, College of Health Sciences, University of California, Irvine, CA 92697, USA
5
Noguchi Memorial Institute for Medical Research, University of Ghana, Accra P.O. Box LG 581, Ghana
6
Department of Medical Microbiology, University of Ghana Medical School, College of Health Sciences, University of Ghana, Accra P.O. Box 4236, Ghana
*
Authors to whom correspondence should be addressed.
These authors contributed equally to this work.
Insects 2023, 14(3), 273; https://doi.org/10.3390/insects14030273
Submission received: 26 January 2023 / Revised: 26 February 2023 / Accepted: 7 March 2023 / Published: 9 March 2023
(This article belongs to the Special Issue Biology, Genetics and Evolution of Mosquitoes)

Abstract

:

Simple Summary

An. funestus is a major vector of human malaria and is responsible for high transmissions in sub-Saharan Africa. In the malaria endemic region of western Kenya, it has adapted and colonized different ecological niches owing to its high resistance to pyrethroids and changing breeding environments. The genetic basis of its ecological adaptations to various settings, which could enrich our understanding of how the population is structured or segregated, is poorly understood. This study sought to evaluate the population structure and genetic diversity of Anopheles funestus in different landscapes in western Kenya. To achieve this, the cytochrome oxidase subunit II gene (COII) was PCR-amplified and sequenced. This study revealed an excess of low-frequency variations that are likely due to population expansion or possibly negative selection pressure. Our findings could serve as a guide for future genomic research to facilitate the design of control strategies.

Abstract

The mitochondrial marker, COII, was employed to assess the genetic structure and diversity of Anopheles funestus, a very important malaria vector in Africa that adapt and colonize different ecological niches in western Kenya. Mosquitoes were collected using mechanical aspirators in four areas (Bungoma, Port Victoria, Kombewa, and Migori) in western Kenya. Following morphological identification, PCR was used to confirm the species. The COII gene was amplified, sequenced, and analyzed to determine genetic diversity and population structure. A total of 126 (Port Victoria-38, Migori-38, Bungoma-22, and Kombewa-28) sequences of COII were used for population genetic analysis. Anopheles funestus had a high haplotype diversity (Hd = 0.97 to 0.98) but low nucleotide diversity (Π = 0.004 to 0.005). The neutrality test revealed negative Tajima’s D and Fs values indicating an excess of low-frequency variation. This could be attributed to either population expansion or negative selection pressure across all the populations. No genetic or structural differentiation (Fst = −0.01) and a high level of gene flow (Gamma St, Nm = 17.99 to 35.22) were observed among the populations. Population expansion suggests the high adaptability of this species to various ecological requirements, hence sustaining its vectorial capacity and malaria transmission.

1. Introduction

Malaria is a public health problem in Sub-Saharan Africa and is spread mainly through members of the Anopheles funestus group and the Anopheles gambiae species complex [1]. The An. funestus group comprises five subgroups, of which three of these subgroups contain at least thirteen (13) species that are identified in various ecological niches across Africa [2]. Anopheles funestus sensu stricto (s.s.) (hereafter An. funestus) belongs to the Funestus subgroup, which has seven members, namely, An. funestus, An. aruni, An. vaneedeni, An. funestus-like, An. confuses, An. longipalpis type C and An. parensis [2,3]. Of this group, An. funestus is a major vector that is responsible for high malaria transmission in sub-Saharan Africa. Three of the members of the An. funestus group, An. funestus, An. Rivulorum, and An. Leesoni were found sympatrically in various ecological zones in Kenya [4], Sudan [5], and Nigeria [6,7], suggesting that they had effective reproductive isolation mechanisms.
While most of the species of the Anopheles funestus group can be found only in certain geographical areas in Africa, An. funestus has a wide range of geographical distributions across various climatic types. This vector remains one of the most devastatingly efficient human malaria vectors exhibiting consistently notorious anthropophilic (preferring human habitation), anthropophagic (biting humans), endophilic (indoor resting), and endophagic (indoor biting) behaviors [8,9]. Its capacity to transmit human malaria far outpaced Anopheles gambiae and Anopheles arabiensis in some endemic areas in Africa [8,10].
An. funestus can adapt and colonize different ecological niches owing to its high resistance to insecticides and changing breeding environments. A previous study in Kenya revealed that An. funestus breeds in various habitats and co-breeds with An. gambiae sensu lato, Culex spp., and other vectors in the same habitats [11]. The vector survival rate, behavior, ecology, vectorial capacity, and host–pathogen interactions are all affected by external environmental stress, including temperature changes, land-use changes, host migration, and insecticide use [12]. These environmental factors have been demonstrated to influence mosquito population selection [12]. A study using microsatellite markers identified three genetically different An. funestus clusters namely: FUN1, FUN2, and FUN3 in Kenya [13]. The largest cluster (FUN1) was identified in samples collected from the Rift Valley and Western regions, while FUN2 and FUN3 were identified in coastal region samples.
The mitochondrial DNA (mtDNA) is sensitive to genetic drift and has a high copy of numbers, and highly conserved primer binding and ease of amplification making it a good marker for interpreting molecular taxonomy, phylogenetic relationships, population structure, and genetic diversity [14]. Indeed, mtDNA markers have been utilized to study the genetic variances and evolutionary relationships of many mosquito species, as well as to correctly quantify the gene flow and changes between populations [15,16].
As a mitochondrial marker, COII has a number of properties such as maternal inheritance, which is devoid of recombination, intraspecific polymorphism, a higher level of differentiation between populations, and small effective population sizes which make it a good marker for studying genetic diversity, gene flow, and population structure [17]. Mitochondrial genetic diversity and molecular phylogeny are becoming increasingly important in mosquito research [18].
The population structure and genetic diversity of An. funestus might influence its adaptation and efficiency of malaria transmission in western Kenya. Delineating the fine-scale population structure of vectors might be useful for investigating the genetic basis of speciation and local adaptation processes. Moreover, understanding the gene flow among An. funestus populations could help to assess their movement in natural populations and, therefore, how the populations are segregated. This study was designed to investigate the genetic structure, diversity, and gene flow of a major vector, An. funestus in a malaria-endemic region of western Kenya using the mitochondrial marker COII.

2. Materials and Methods

2.1. Mosquito Sampling

Anopheles funestus mosquitoes were collected from four malaria transmission areas (Port Victoria, Migori, Bungoma, and Kombewa) in four counties in western Kenya from November 2020 to October 2021. The sample collection sites are shown in Figure 1. Adult mosquitoes were sampled indoors using pyrethrum spray catches and mechanical aspirators. All mosquitoes were morphologically identified using morphological keys [19] and the An. funestus sensu lato was stored in 1.5 mL Eppendorf tubes containing cotton wool and silica gel [19]. Samples were stored at −20 °C for subsequent molecular analysis.
This map was prepared with ESRI ArcGIS Pro 2.8 using field survey results and publicly available datasets. The Open Database License, which is used to make the data available, was used to compile the material on the map from OpenStreetMap and the OpenStreetMap 115 Foundation.

2.2. DNA Extraction, PCR Amplification and Sequencing

Genomic DNA was extracted from the whole mosquito using the Chelex®-100 method [20]. An. funestus-specific PCR was conducted to confirm species using the species-specific primers (ITS2A/FUN) that could amplify the internal transcribed spacer region (ITS2) on the ribosomal DNA as described by [21]. The COII gene was amplified using forward (5′-TCTAATATGGCAGATTAGTGCA-3′) and reverse (5′-ACTTGCTTTCAG TCATCTAATG-3′) primers [17]. A final volume of 23 µL containing 3 µL genomic DNA, 0.5 µL each of forward and reverse primers, an 11.5 µL master mix with PerfeCTa® ToughMix® (5×), and 7.5 µL of PCR water were used. The PCR conditions included initial denaturation at 95 °C for 3 min followed by 35 cycles, denaturation at 95 °C for 15 s, and annealing at 41 °C for 30 s, with extension at 72 °C for 1 min and 30 s and final extension at 72 °C for 7 min. The resulting amplicons were separated by agarose gel electrophoresis in 1.5% w/v agarose gel stained with 2 µL smart glow. The SmartDoc imaging system (Accuris Tm instruments) was used to visualize the DNA bands and were imaged. All the amplicons were bidirectionally sequenced using the primers used in PCR amplification. Sequencing was performed on an ABI PRISM® 3700 DNA Analyzer (Applied Biosystems, Foster City, CA, USA) platform using the 3730 BigDye® Terminator v3.1 chemistry.

2.3. Data Analysis

The de novo assembly of paired raw reads was performed using the Geneious prime software version 2022.0.1 [22] and CLC Genomics Workbench [23]. Low-quality reads with a low base calling accuracy below 99% (Phred 20) were excluded from the analysis. The ClustalW algorithm in MEGA X was used for multiple sequence alignment [24]. The DnaSP Version 6.12.03 [25] was used to compute genetic diversity indices [haplotype diversity (Hd), the number of haplotypes (h), nucleotide diversity (Π), the number of segregating sites (S) and the mean number of pairwise difference (k)] and neutrality tests (Tajima’s D, Fu and Li’s D, Fu and Li’s F, and Fu’s Fs statistics). Gamma ST measurements, including an inbuilt algorithm with DnaSP software, were used to estimate the gene flow and genetic differentiation [26,27]. The analysis of molecular variance (AMOVA) was performed in Arlequin version 3.5.2 [28] to partition genetic variations among groups (Port Victoria, Migori, Bungoma, and Kombewa) and within groups. Population analysis with reticulate trees (PopART) version 1.7 [29] was used to infer haplotype networks.
The best-fitting nucleotide substitution model was estimated with the Akaike Information Criterion (AIC) and the Bayesian information criterion (BIC) implemented in MEGA version 11.0.13 [24]. The Bayesian phylogenetic analysis was performed by MrBayes v3.2.7 [30] using Markov chain Monte Carlo (MCMC) methods. The MCMC was run for 2,000,000 generations by sampling tree topologies every 1000 generations, after excluding the initial 25% as ‘burn-in’. To root the tree, Anopheles gambiae, Aedes albopictus, and Culex pipiens pallens were the “outgroup” (accession # MG930872, MG930866, KX383916, and KT851543). The previously reported COII sequences of An. funestus from western Kenya (GenBank accession: MT917174) and other locations in African countries, including southern Ghana (MT917179 and MT917180), northwestern Tanzania (MT917176 and MT917177), eastern Uganda (MT917175, MT917181, and MT917182), eastern Zambia (MT917178), and northern Malawi (MT917161), were also included in the phylogenetic tree. The 50% majority rule consensus tree was constructed with Bayesian posterior probabilities of the nodal supports. The output tree was visualized and edited with an online tool called the Interactive Tree of Life (iTOL) v5 [31].

3. Results

3.1. Genetic Diversity of An. funestus in Western Kenya

A total of 126 (Port Victoria-38, Migori-38, Bungoma-22, and Kombewa-28) amplicon sequences of COII were used for population genetic analysis. A total of 64 haplotypes were identified (Table S1), suggesting a high haplotype diversity in the populations (Hd = 0.97 to 0.98) albeit low nucleotide diversity (Π = 0.004) based on COII sequences (Table 1). Moreover, the statistical test of neutrality revealed significant negative Tajima’s D and Fs values indicating a deviation from a standard neutral model and population expansion with an excess of low-frequency variation likely due to population expansion (or possibly negative selection pressure). (Table 1). There was no significant difference in the observed nucleotide diversity across the four populations (X2 = 181.744, df = 189, p = 0.635).

3.2. Population Structure and Gene Flow

AMOVA results showed that there was no genetic differentiation across all four populations (Fst = −0.01). Specifically, our result revealed that there was no genetic differentiation between Port Victoria and Migori (Fst = −0.010), Bungoma and Kombewa (Fst= −0.016), Port Victoria and Bungoma (Fst = −0.020), Migori and Bungoma (Fst = −0.008), Port Victoria and Kombewa (Fst = −0.009), and Migori and Kombewa (Fst = −0.003) (Table 2). The lack of population structure was supported by a high level of gene flows across the four populations (Gamma St, Nm = 15.40), with the highest gene flow occurring between Port Victoria and Bungoma (Gamma St, Nm = 35.22). This was followed by Port Victoria and Migori (Gamma St, Nm = 30.25). The lowest gene flow was between Migori and Kombewa (Gamma St, Nm = 17.99) (Table 2).

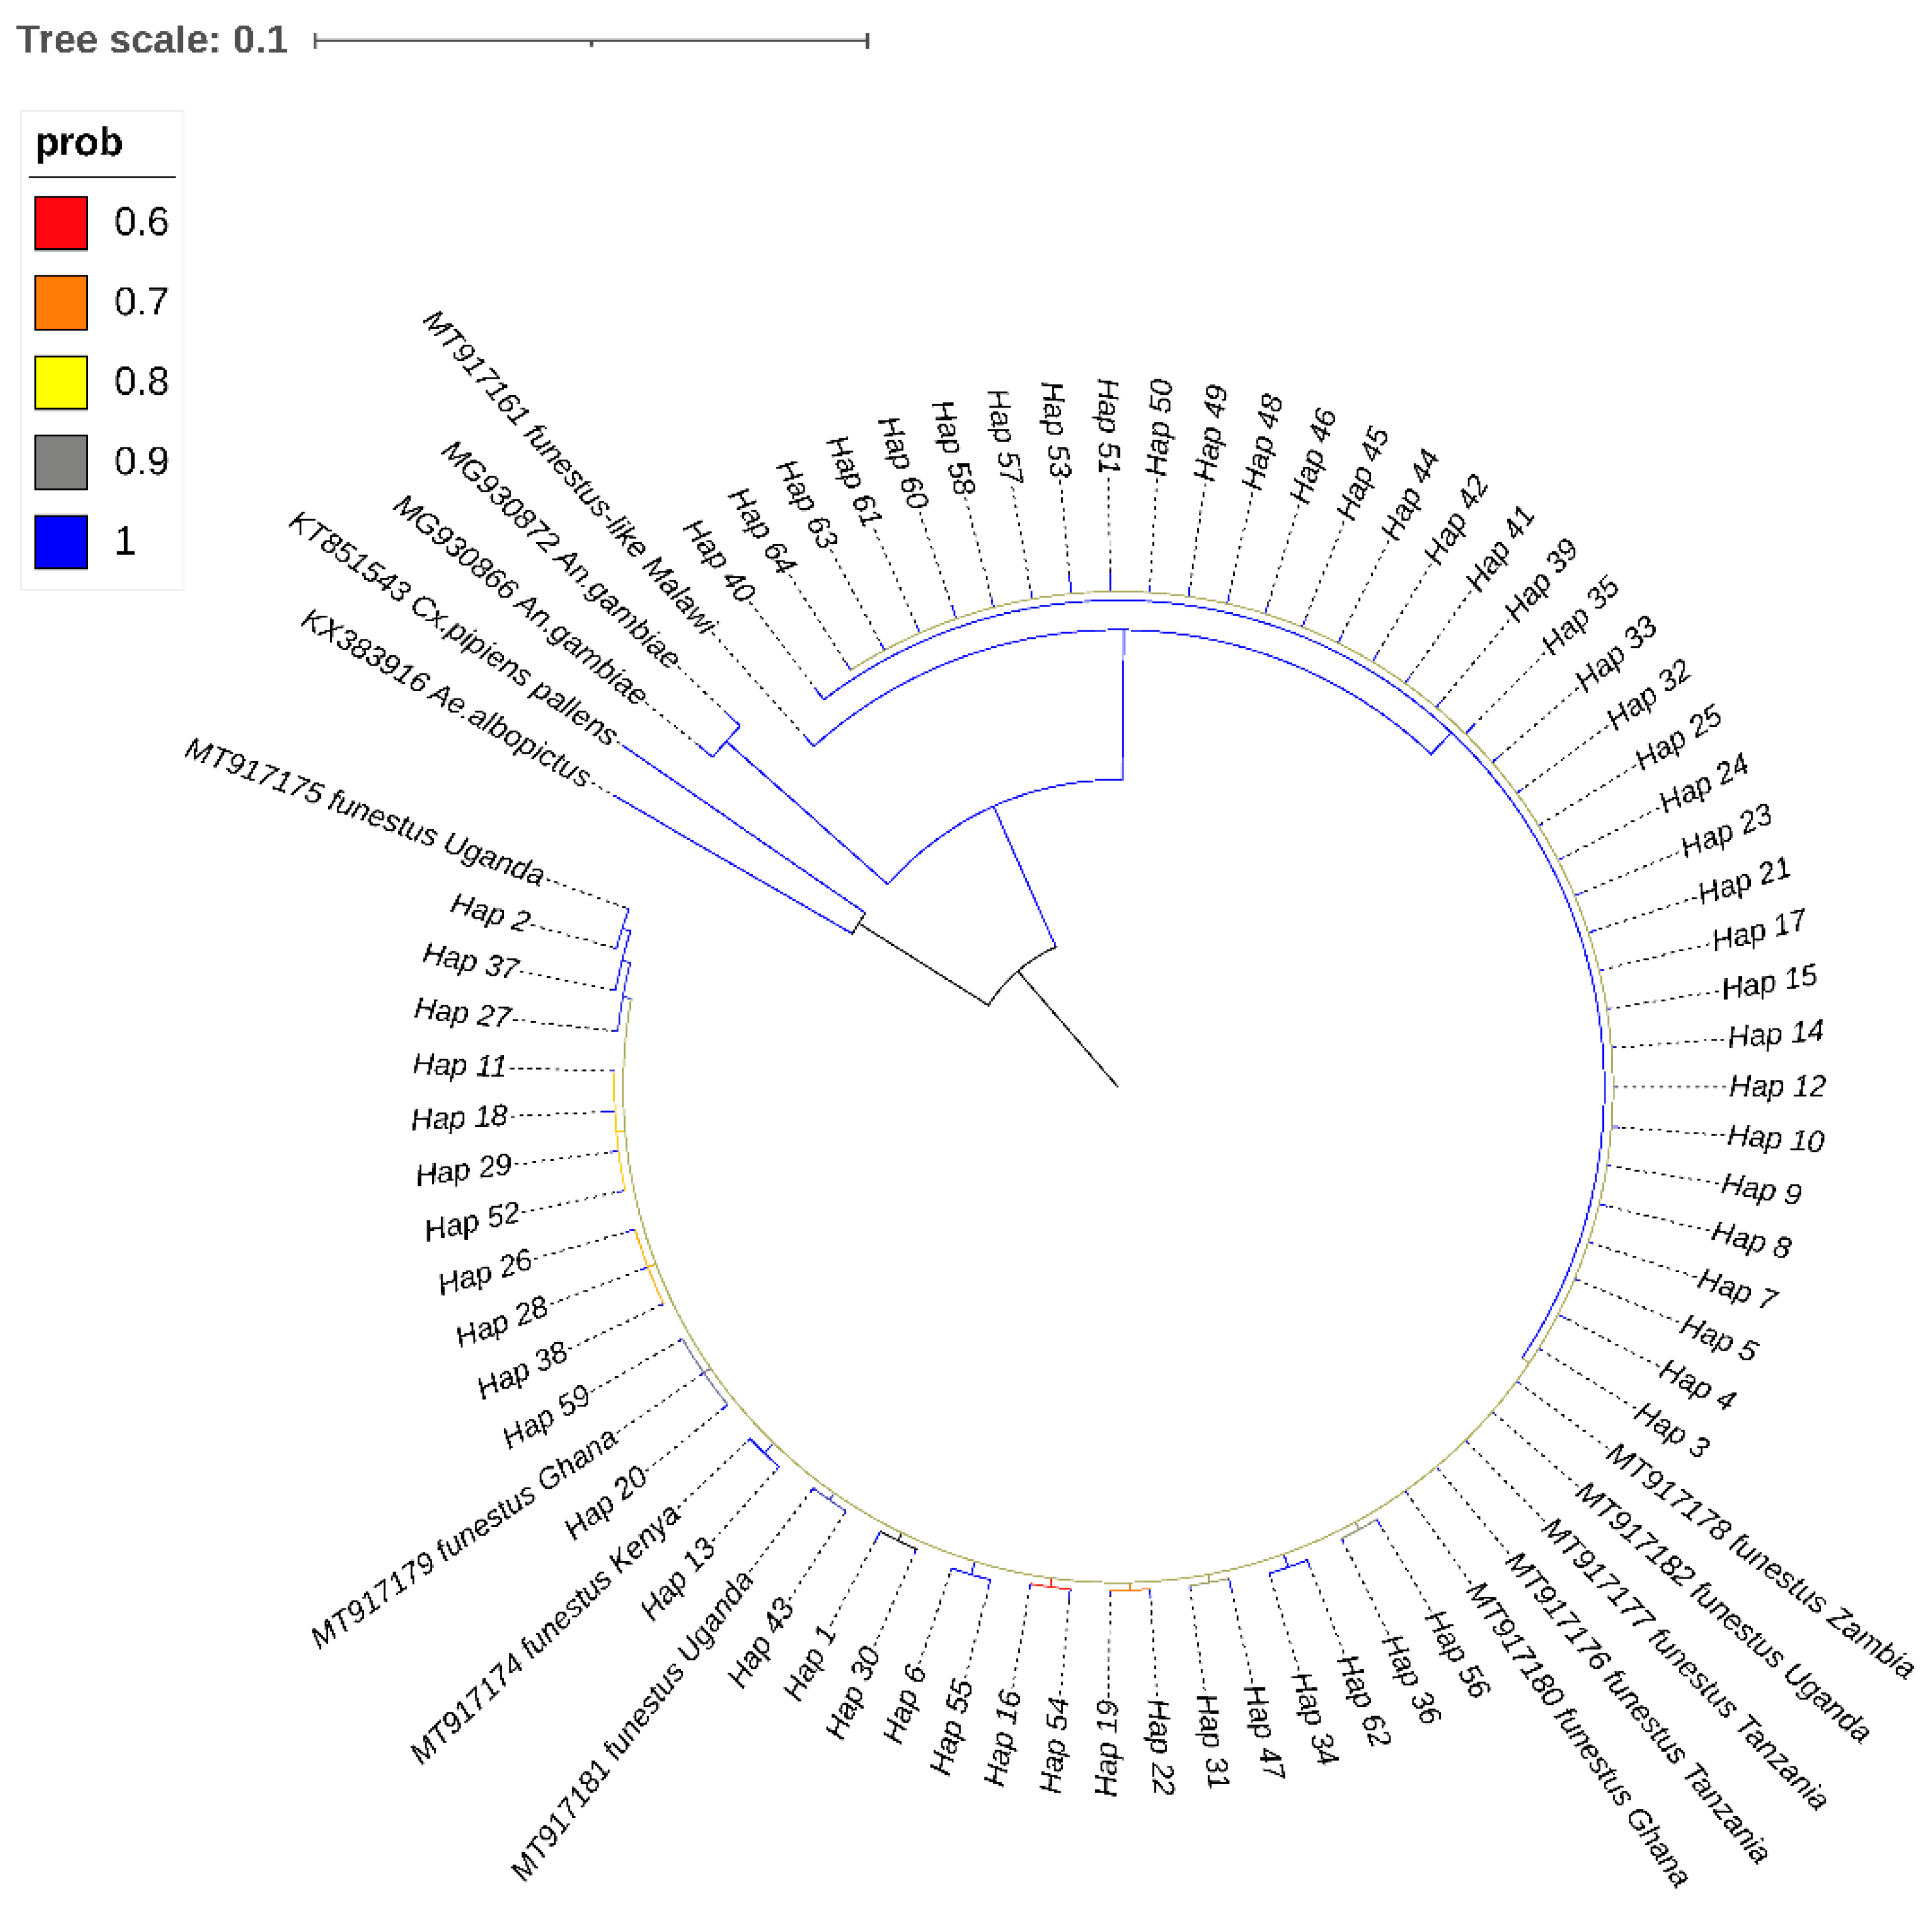
3.3. Phylogenetic Relationships and Network Analyses

The best-fit model for nucleotide substitution was identified by MEGA 11 as a Tamura 3-parameter with gamma-distributed rate heterogeneity (T92 + G) according to the Bayesian information criterion for COII haplotypes. The phylogenetic tree was inferred by Bayesian analyses with the standard deviation of split frequency values (p < 0.01). The phylogenetic estimates from the MCMC analyses strongly supported the monophyletic group (posterior probability = 1) (Figure 2). There was no clear clustering of haplotypes observed, and all the 64 identified haplotypes (Prob = 0.9983) in western Kenya shared a common ancestor with An. funestus-like (accession # MT917161) from Malawi, with the closest haplotype (Hap 40) coming from the Migori and Port Victoria populations, which border Tanzania and Uganda, respectively. Anopheles funestus samples from Port Victoria and Bungoma (Hap 2) shared a recent common ancestor with An. funestus (accession # MT917175) from Uganda.
Haplotype networks were constructed using the median-joining method in PopART software. Out of the 64 distinct haplotypes identified in western Kenya, 30 (46.9%) were found in the Port Victoria population (Table 1). Twenty (31.3%) of the 64 haplotypes were found in each of the study populations. The median-joining haplotype network of the COII gene revealed the genealogy of each of the observed haplotypes, with haplotypes S1-S20 being shared across the study populations (Figure 3). In the four study areas, the most common haplotype was S1 (14/64, 21.9%), followed by S3 (7/64, 10.9%), S2 (7/64, 10.9%), S4 (6/64, 9.4%), S6 (6/64, 9.4%), and S8 (4/64, 6.3%). The distribution of the S1 haplotype among the 64 observed haplotypes was as follows: 8%, 6%, 5%, and 3% in Port Victoria, Migori, Bungoma, and Kombewa, respectively. The haplotype (S1) could be an ancestral haplotype (recent common ancestor) to An. funestus in western Kenya. Port Victoria and Bungoma populations had the most shared mutations (52.9%), followed by Migori and Port Victoria, as well as Kombewa, each at 50%. Port Victoria and Kombewa populations had the least shared number of mutated sites (42%). Nucleotide sequences of the 64 identified haplotypes were submitted to GenBank and assigned accession numbers ON931353-ON931416.

4. Discussion

This study revealed the population genetic structure of An. funestus population across four counties in western Kenya using a mitochondrial marker, COII. In the context of malaria control strategies, including the genetic alteration of vector species, information on the genetic diversity and population structure of vectors is critical [32]. In recent years, changes in the ecology of vector populations have been documented [11]. High tolerance to a variety of ecological niches, insecticide resistance, and vast geographic distribution make An. Funestus a highly adaptable dominant vector species [33]. Due to differences in the ecological zones in western Kenya, we anticipated that the barrier to gene flow could be due to variation brought about either by biotic or abiotic factors. Key biotic factors include Lake Victoria, climatic conditions, and landscape (highland versus lowland), resulting in gene flow and genetic diversity between the populations. Abiotic factors, including agriculture and the use of fertilizers and pesticides, could have selective pressure on the An. funestus population resulting in genetic diversity.
This study revealed the signature of population expansion, with weak population structure and high levels of gene flow among the population of An. funestus from areas with varied p. falciparum transmission intensities in western Kenya. Generally, An. funestus exhibited low nucleotide diversity, with Port Victoria exhibiting a higher number of haplotypes than other regions. In western Kenya, the high genetic diversity of the An. funestus population compared to coastal regions based on microsatellite markers was reported a decade ago [34]. The observed high number of haplotypes in Kombewa, Migori, and Port Victoria among this primary vector is consistent with high levels of Plasmodial transmission in these study areas compared to other malaria vectors [35,36]. Port Victoria, which is also proximal to Lake Victoria, had a significantly high number of haplotypes circulating in the area. Port Victoria is the main Lake Victoria transport corridor between Kenya, Lake Victoria Islands, and Uganda. It was earlier reported that small wooden boats played a significant role in the transportation of mosquitoes between the mainland and Lake Victoria Islands [37]. This might have played a role in facilitating high gene flow, resulting in a high number of haplotypes and haplotype diversity reported in that population. Port Victoria has also been documented to have a high malaria prevalence with vector control interventions ongoing [38]. The high gene flow observed in the populations could be due to migration and a lack of geographical barriers [15]. Mountain ranges, rivers, forests, and other physical barriers, in combination with climatic or biological obstacles, such as flight range and breeding grounds, may obstruct the gene flow between Anopheles populations. However, none of these factors served as a barrier to gene flow in the An. funestus population in western Kenya. The Rift Valley is known to serve as a barrier to gene flow [4]; nonetheless, our findings showed that there were no physical barriers to hamper gene flow among mosquito populations in western Kenya. Different breeding sites, mosquito migration, environmental changes, and human activities act to shape the genetic diversity of An. funestus populations [39].
Given the low Fst values and high Gamma St, Nm values, there was a strong indication of a high gene flow between populations as well as high breeding. Not only has a high gene flow reduced the heterozygosity between populations, but it has also resulted in most haplotypes being shared among the western Kenya region, contributing to a weak or lack of population structure. The shared haplotypes were observed between western Kenya and other African countries, suggesting that the genetic diversity of the COII gene might be not directly associated with geographical divisions. However, with the excess frequency of rare alleles, a genetic signature for population expansion could persist for a long period, masking any genuine ecological population or genetic structure that may exist [40]. The observed weak population structure, negative selection, and population expansion suggest that there was a free exchange of genes among An. funestus populations in western Kenya. The presence of a negative signature of selection on this gene is an indicator of purifying selection, which acts on the gene to preserve the genetic structure by eliminating deleterious mutations [41].
With evidence of purifying selection and population expansion (or possibly negative selection pressure), it is possible that evolutionary forces shaping the An. funestus population in western Kenya could be the usage of long-lasting insecticidal nets, indoor residual spraying, and insecticide use for agricultural activities, especially those affecting larval breeding sites [42,43]. The high number of haplotypes per study site and the population expansion observed in this study suggest the high adaptability of An. funestus to various ecological requirements, hence sustaining its vectorial capacity and malaria transmission.

5. Conclusions

This study has shown that the An. funestus population in western Kenya is under selection pressure leading to demographic expansion and the spread of variants through breeding among varied transmission sites in western Kenya. Population expansion (or possibly negative selection pressure) suggests there is high adaptability of this species to various ecological requirements hence allowing them to sustain their vectorial capacity and transmission of malaria.

Supplementary Materials

The following is available online at https://www.mdpi.com/article/10.3390/insects14030273/s1, Table S1: Distribution of COII Haplotypes identified in the four An. funestus populations in western Kenya.

Author Contributions

Conceptualization, I.D., Y.A.A. and G.Y.; methodology, I.D. and S.A.O.; software, I.D., K.O.O. and D.Z.; validation, I.D., W.O.O., D.Z. and L.E.A.; formal analysis, I.D., K.O.O. and D.Z.; investigation, I.D., K.O.O., W.O.O., M.G.M. and E.O.M.; resources, A.K.G. and G.Y.; data curation, I.D. and D.Z.; writing—original draft preparation, I.D.; writing—review and editing, I.D., K.O.O., W.O.O., S.A.O., D.Z., L.E.A., A.K.G., Y.A.A. and G.Y.; visualization, I.D.; supervision, L.E.A., A.K.G., Y.A.A. and G.Y.; project administration, I.D., L.E.A., A.K.G. and G.Y.; funding acquisition, A.K.G., Y.A.A. and G.Y. All authors have read and agreed to the published version of the manuscript.

Funding

This study was supported by grants from the National Institute of Health (R01 A1123074, U19 AI129326, R01 AI050243, and D43 TW001505). There was no additional external funding received for this study. The funders, however, did not play any role in designing, data collection, and manuscript writing.

Informed Consent Statement

Verbal consent was sought from heads of households before mosquitoes were collected inside the living rooms.

Data Availability Statement

This study’s datasets are available in the online repository. The accession numbers for the haplotype sequence data submitted to GenBank are ON931353-ON931416.

Conflicts of Interest

The authors declare no conflict of interest.

References

  1. Sinka, M.E.; Bangs, M.J.; Manguin, S.; Coetzee, M.; Mbogo, C.M.; Hemingway, J.; Patil, A.P.; Temperley, W.H.; Gething, P.W.; Kabaria, C.W. The Dominant Anopheles Vectors of Human Malaria in Africa, Europe and the Middle East: Occurrence Data, Distribution Maps and Bionomic Précis. Parasit. Vectors 2010, 3, 117. [Google Scholar] [CrossRef] [PubMed] [Green Version]
  2. Harbach, R.E. Mosquito Taxonomic Inventory. 2013. Available online: http://Mosquito-Taxonomic-Inventory.Info/ (accessed on 10 June 2020).
  3. Garros, C.; Harbach, R.E.; Manguin, S. Morphological Assessment and Molecular Phylogenetics of the Funestus and Minimus Groups of Anopheles (Cellia). J. Med. Entomol. 2005, 42, 522–536. [Google Scholar] [CrossRef] [PubMed]
  4. Kamau, L.; Munyekenye, G.O.; Koekemoer, L.L.; Hunt, R.H.; Coetzee, M. A Survey of the Anopheles Funestus (Diptera: Culicidae) Group of Mosquitoes from 10 Sites in Kenya with Special Emphasis on Population Genetic Structure Based on Chromosomal Inversion Karyotypes. J. Med. Entomol. 2003, 40, 664–671. [Google Scholar] [CrossRef] [PubMed] [Green Version]
  5. Makhawi, A.M.; Aboud, M.A.; Raba’a, F.M.E.; Osman, O.F.; Elnaiem, D.E.A. Identification of Anopheles Species of the Funestus Group and Their Role in Malaria Transmission in Sudan. J. Appl. Indust. Sci. 2015, 3, 58–62. [Google Scholar]
  6. Awolola, T.S.; Oyewole, I.O.; Koekemoer, L.L.; Coetzee, M. Identification of Three Members of the Anopheles Funestus (Diptera: Culicidae) Group and Their Role in Malaria Transmission in Two Ecological Zones in Nigeria. Trans. R. Soc. Trop. Med. Hyg. 2005, 99, 525–531. [Google Scholar] [CrossRef]
  7. Temu, E.A.; Minjas, J.N.; Tuno, N.; Kawada, H.; Takagi, M. Identification of Four Members of the Anopheles Funestus (Diptera: Culicidae) Group and Their Role in Plasmodium Falciparum Transmission in Bagamoyo Coastal Tanzania. Acta Trop. 2007, 102, 119–125. [Google Scholar] [CrossRef]
  8. Kaindoa, E.W.; Matowo, N.S.; Ngowo, H.S.; Mkandawile, G.; Mmbando, A.; Finda, M.; Okumu, F.O. Interventions That Effectively Target Anopheles Funestus Mosquitoes Could Significantly Improve Control of Persistent Malaria Transmission in South-Eastern Tanzania. PLoS ONE 2017, 12, e0177807. [Google Scholar] [CrossRef] [Green Version]
  9. Sougoufara, S.; Diédhiou, S.M.; Doucouré, S.; Diagne, N.; Sembène, P.M.; Harry, M.; Trape, J.-F.; Sokhna, C.; Ndiath, M.O. Biting by Anopheles Funestus in Broad Daylight after Use of Long-Lasting Insecticidal Nets: A New Challenge to Malaria Elimination. Malar. J. 2014, 13, 125. [Google Scholar] [CrossRef] [Green Version]
  10. Coetzee, M.; Fontenille, D. Advances in the Study of Anopheles Funestus, a Major Vector of Malaria in Africa. Insect Biochem. Mol. Biol. 2004, 34, 599–605. [Google Scholar] [CrossRef]
  11. Debrah, I.; Afrane, Y.A.; Amoah, L.E.; Ochwedo, K.O.; Mukabana, W.R.; Zhong, D.; Zhou, G.; Lee, M.-C.; Onyango, S.A.; Magomere, E.O.; et al. Larval Ecology and Bionomics of Anopheles Funestus in Highland and Lowland Sites in Western Kenya. PLoS ONE 2021, 16, e0255321. [Google Scholar] [CrossRef]
  12. Zouache, K.; Fontaine, A.; Vega-Rua, A.; Mousson, L.; Thiberge, J.-M.; Lourenco-De-Oliveira, R.; Caro, V.; Lambrechts, L.; Failloux, A.-B. Three-Way Interactions between Mosquito Population, Viral Strain and Temperature Underlying Chikungunya Virus Transmission Potential. Proc. R. Soc. B Biol. Sci. 2014, 281, 20141078. [Google Scholar] [CrossRef]
  13. Ogola, E.O.; Odero, J.O.; Mwangangi, J.M.; Masiga, D.K.; Tchouassi, D.P. Population Genetics of Anopheles Funestus, the African Malaria Vector, Kenya. Parasit. Vectors 2019, 12, 15. [Google Scholar] [CrossRef] [Green Version]
  14. Norris, D.E. Genetic Markers for Study of the Anopheline Vectors of Human Malaria. Int. J. Parasitol. 2002, 32, 1607–1615. [Google Scholar] [CrossRef] [PubMed]
  15. Bunmee, K.; Thaenkham, U.; Saralamba, N.; Ponlawat, A.; Zhong, D.; Cui, L.; Sattabongkot, J.; Sriwichai, P. Population Genetic Structure of the Malaria Vector Anopheles Minimus in Thailand Based on Mitochondrial DNA Markers. Parasit. Vectors 2021, 14, 496. [Google Scholar] [CrossRef] [PubMed]
  16. Weeraratne, T.C.; Surendran, S.N.; Walton, C.; Karunaratne, S.H.P. Genetic Diversity and Population Structure of Malaria Vector Mosquitoes Anopheles Subpictus, Anopheles Peditaeniatus, and Anopheles Vagus in Five Districts of Sri Lanka. Malar. J. 2018, 17, 271. [Google Scholar] [CrossRef] [Green Version]
  17. Chang, X.; Zhong, D.; Lo, E.; Fang, Q.; Bonizzoni, M.; Wang, X.; Lee, M.-C.; Zhou, G.; Zhu, G.; Qin, Q. Landscape Genetic Structure and Evolutionary Genetics of Insecticide Resistance Gene Mutations in Anopheles Sinensis. Parasit. Vectors 2016, 9, 228. [Google Scholar] [CrossRef] [PubMed] [Green Version]
  18. Zhang, Y.; Zhang, C.; Yang, R.; Luo, C.; Deng, Y.; Liu, Y.; Zhou, H.; Zhang, D. Molecular Phylogeny of Anopheles Nivipes Based on MtDNA-COII and Mosquito Diversity in Cambodia-Laos Border. Malar. J. 2022, 21, 91. [Google Scholar] [CrossRef]
  19. Coetzee, M. Key to the Females of Afrotropical Anopheles Mosquitoes (Diptera: Culicidae). Malar. J. 2020, 19, 70. [Google Scholar] [CrossRef] [Green Version]
  20. Musapa, M.; Kumwenda, T.; Mkulama, M.; Chishimba, S.; Norris, D.E.; Thuma, P.E.; Mharakurwa, S. A Simple Chelex Protocol for DNA Extraction from Anopheles Spp. JoVE J. Vis. Exp. 2013, 71, e3281. [Google Scholar]
  21. Koekemoer, L.L.; Kamau, L.; Hunt, R.H.; Coetzee, M. A Cocktail Polymerase Chain Reaction Assay to Identify Members of the Anopheles Funestus (Diptera: Culicidae) Group. Am. J. Trop. Med. Hyg. 2002, 66, 804–811. [Google Scholar] [CrossRef] [Green Version]
  22. Kearse, M.; Moir, R.; Wilson, A.; Stones-Havas, S.; Cheung, M.; Sturrock, S.; Buxton, S.; Cooper, A.; Markowitz, S.; Duran, C.; et al. Geneious Basic: An Integrated and Extendable Desktop Software Platform for the Organization and Analysis of Sequence Data. Bioinformatics 2012, 28, 1647–1649. [Google Scholar] [CrossRef] [PubMed] [Green Version]
  23. Matvienko, M. CLC Genomics Workbench. Plant Anim. Genome Sr. Field Appl. Sci. CLC Bio 2015, 1, 1–42. [Google Scholar]
  24. Tamura, K.; Stecher, G.; Kumar, S. MEGA11: Molecular Evolutionary Genetics Analysis Version 11. Mol. Biol. Evol. 2021, 38, 3022–3027. [Google Scholar] [CrossRef] [PubMed]
  25. Rozas, J.; Ferrer-Mata, A.; Sánchez-DelBarrio, J.C.; Guirao-Rico, S.; Librado, P.; Ramos-Onsins, S.E.; Sánchez-Gracia, A. DnaSP 6: DNA Sequence Polymorphism Analysis of Large Data Sets. Mol. Biol. Evol. 2017, 34, 3299–3302. [Google Scholar] [CrossRef]
  26. Zhong, Y.; Tang, Z.; Huang, L.; Wang, D.; Lu, Z. Genetic Diversity of Procambarus Clarkii Populations Based on Mitochondrial DNA and Microsatellite Markers in Different Areas of Guangxi, China. Mitochondrial DNA Part A 2020, 31, 48–56. [Google Scholar] [CrossRef]
  27. Higuera, A.; Muñoz, M.; López, M.C.; Reyes, P.; Urbano, P.; Villalobos, O.; Ramírez, J.D. Development of a Multilocus Sequence Typing Scheme for Giardia Intestinalis. Genes 2020, 11, 764. [Google Scholar] [CrossRef]
  28. Excoffier, L.; Lischer, H.E. Arlequin Suite Ver 3.5: A New Series of Programs to Perform Population Genetics Analyses under Linux and Windows. Mol. Ecol. Resour. 2010, 10, 564–567. [Google Scholar] [CrossRef]
  29. Leigh, J.W.; Bryant, D. POPART: Full-Feature Software for Haplotype Network Construction. Methods Ecol. Evol. 2015, 6, 1110–1116. [Google Scholar] [CrossRef]
  30. Ronquist, F.; Teslenko, M.; Van Der Mark, P.; Ayres, D.L.; Darling, A.; Höhna, S.; Larget, B.; Liu, L.; Suchard, M.A.; Huelsenbeck, J.P. MrBayes 3.2: Efficient Bayesian Phylogenetic Inference and Model Choice across a Large Model Space. Syst. Biol. 2012, 61, 539–542. [Google Scholar] [CrossRef] [Green Version]
  31. Letunic, I.; Bork, P. Interactive Tree Of Life (ITOL) v5: An Online Tool for Phylogenetic Tree Display and Annotation. Nucleic Acids Res. 2021, 49, W293–W296. [Google Scholar] [CrossRef]
  32. Collins, F.H.; James, A.A. Genetic Modification of Mosquitoes. Sci. Med. 1996, 3, 52–61. [Google Scholar]
  33. Dia, I.; Guelbeogo, M.W.; Ayala, D. Advances and Perspectives in the Study of the Malaria Mosquito Anopheles Funestus. Anopheles Mosq. New. Insights Malar. Vectors 2013, 10, 55389. [Google Scholar]
  34. Braginets, O.P.; Minakawa, N.; Mbogo, C.M.; Yan, G. Population Genetic Structure of the African Malaria Mosquito Anopheles Funestus in Kenya. Am. J. Trop. Med. Hyg. 2003, 69, 303–308. [Google Scholar] [CrossRef] [PubMed]
  35. Zhou, G.; Afrane, Y.A.; Vardo-Zalik, A.M.; Atieli, H.; Zhong, D.; Wamae, P.; Himeidan, Y.E.; Minakawa, N.; Githeko, A.K.; Yan, G. Changing Patterns of Malaria Epidemiology between 2002 and 2010 in Western Kenya: The Fall and Rise of Malaria. PLoS ONE 2011, 6, e20318. [Google Scholar] [CrossRef] [Green Version]
  36. Ototo, E.N.; Mbugi, J.P.; Wanjala, C.L.; Zhou, G.; Githeko, A.K.; Yan, G. Surveillance of Malaria Vector Population Density and Biting Behaviour in Western Kenya. Malar. J. 2015, 14, 244. [Google Scholar] [CrossRef] [PubMed] [Green Version]
  37. Chen, H.; Minakawa, N.; Beier, J.; Yan, G. Population Genetic Structure of Anopheles Gambiae Mosquitoes on Lake Victoria Islands, West Kenya. Malar. J. 2004, 3, 48. [Google Scholar] [CrossRef] [Green Version]
  38. Noor, A.M.; Gething, P.W.; Alegana, V.A.; Patil, A.P.; Hay, S.I.; Muchiri, E.; Juma, E.; Snow, R.W. The Risks of Malaria Infection in Kenya in 2009. BMC Infect. Dis. 2009, 9, 180. [Google Scholar] [CrossRef] [Green Version]
  39. Samb, B.; Dia, I.; Konate, L.; Ayala, D.; Fontenille, D.; Cohuet, A. Population Genetic Structure of the Malaria Vector Anopheles Funestus, in a Recently Re-Colonized Area of the Senegal River Basin and Human-Induced Environmental Changes. Parasit. Vectors 2012, 5, 188. [Google Scholar] [CrossRef] [Green Version]
  40. Rogers, A.R.; Harpending, H. Population Growth Makes Waves in the Distribution of Pairwise Genetic Differences. Mol. Biol. Evol. 1992, 9, 552–569. [Google Scholar]
  41. Meiklejohn, C.D.; Montooth, K.L.; Rand, D.M. Positive and Negative Selection on the Mitochondrial Genome. Trends Genet. 2007, 23, 259–263. [Google Scholar] [CrossRef]
  42. Pasteur, N.; Raymond, M. Insecticide Resistance Genes in Mosquitoes: Their Mutations, Migration, and Selection in Field Populations. J. Hered. 1996, 87, 444–449. [Google Scholar] [CrossRef] [PubMed] [Green Version]
  43. Aguirre-Obando, O.A.; Bona, A.C.D.; Duque L, J.E.; Navarro-Silva, M.A. Insecticide Resistance and Genetic Variability in Natural Populations of Aedes (Stegomyia) Aegypti (Diptera: Culicidae) from Colombia. Zool. Curitiba 2015, 32, 14–22. [Google Scholar] [CrossRef] [Green Version]
Figure 1. Map of study areas in western Kenya.
Insects 14 00273 g001
Figure 2. Bayesian phylogenetic tree inferred from cytochrome oxidase subunit II gene (COII). The 50% majority rule consensus tree was constructed using Markov chain Monte Carlo (MCMC) methods and posterior probabilities of the nodal supports are indicated by color lines where the green corresponds to a 100% support value).
Insects 14 00273 g002
Figure 3. Haplotype distribution in the four study populations. S represents shared haplotypes across the four study sites, p represents haplotypes in Port Victoria only, M represents haplotypes in Migori, K represents haplotypes in Kombewa, and B represents haplotypes in Bungoma. Hatch marks represent the number of mutated sites resulting in particular haplotypes whereas the size of the circle corresponds to the haplotype frequency or numbers of the sample under that specific haplotype.
Insects 14 00273 g003
Table 1. Nucleotide diversity indices based on COII of An. funestus from four areas in western Kenya.
PopulationsNLSΠhHdTajima’sFsFu and Li’sFu and Li’s
DpStatisticspDpFp
Port Vic.38774320.005300.98−1.86<0.05−31.510.000−1.99>0.10−2.31>0.05
Migori38774260.004250.97−1.76>0.05−21.850.000−2.75<0.05−2.86<0.05
Bungoma22774190.004180.98−1.64>0.05−16.420.000−1.89>0.10−2.12>0.05
Kombewa28774170.004230.98−1.33>0.10−25.040.000−1.06>0.10−1.34>0.10
All populations126 410.004640.97−1.81<0.05−32.910.000−1.42>0.10−1.89>0.05
N: sampled population, L: number of sites analyzed, S: segregating sites, Π: nucleotide diversity, h: number of Haplotypes, Hd: haplotype diversity, statistical significance (p < 0.05).
Table 2. Anopheles funestus population structure in the western Kenya region.
PopulationsNo. of Shared Mutations (%)DxyHsKsKxyGstGamma StFst
ValueNmValueNmp-Value
Port Vic. vs. Migori20/40 (50)0.0040.973.4003.3650.0010.00830.25−0.010−24.450.855
Bungoma vs. Kombewa12/25 (48)0.0040.982.8782.836−0.0060.01319.43−0.016−16.040.892
Port Vic vs. Bungoma18/34 (52.9)0.0040.983.3893.222−0.0040.00735.22−0.020−12.800.982
Migori vs. Bungoma14/32 (43.8)0.0040.973.0482.9940.0010.01319.02−0.008−31.710.649
Port Vic vs. Kombewa15/36 (41.7)0.0040.983.3243.234−0.0030.01123.43−0.009−28.290.838
Migori vs. Kombewa15/30 (50)0.0040.973.0152.9850.00030.01417.99−0.003−82.770.468
Dxy: the average number of nucleotide substitution per site between populations, Hs: weighted average of estimated haplotype diversities in the subpopulations, Ks: the number of synonymous substitutions per synonymous site, Kxy: the average number of nucleotide differences between populations, Gst: a measure of population differentiation, Nm: number of migrants.
Disclaimer/Publisher’s Note: The statements, opinions and data contained in all publications are solely those of the individual author(s) and contributor(s) and not of MDPI and/or the editor(s). MDPI and/or the editor(s) disclaim responsibility for any injury to people or property resulting from any ideas, methods, instructions or products referred to in the content.

