
A Non-Destructive High-Speed Procedure to Obtain DNA Barcodes from Soft-Bodied Insect Samples with a Focus on the Dipteran Section of Schizophora


 , and
, and
Abstract
:Simple Summary
Abstract
1. Introduction
2. Materials and Methods
2.1. Sample Origin
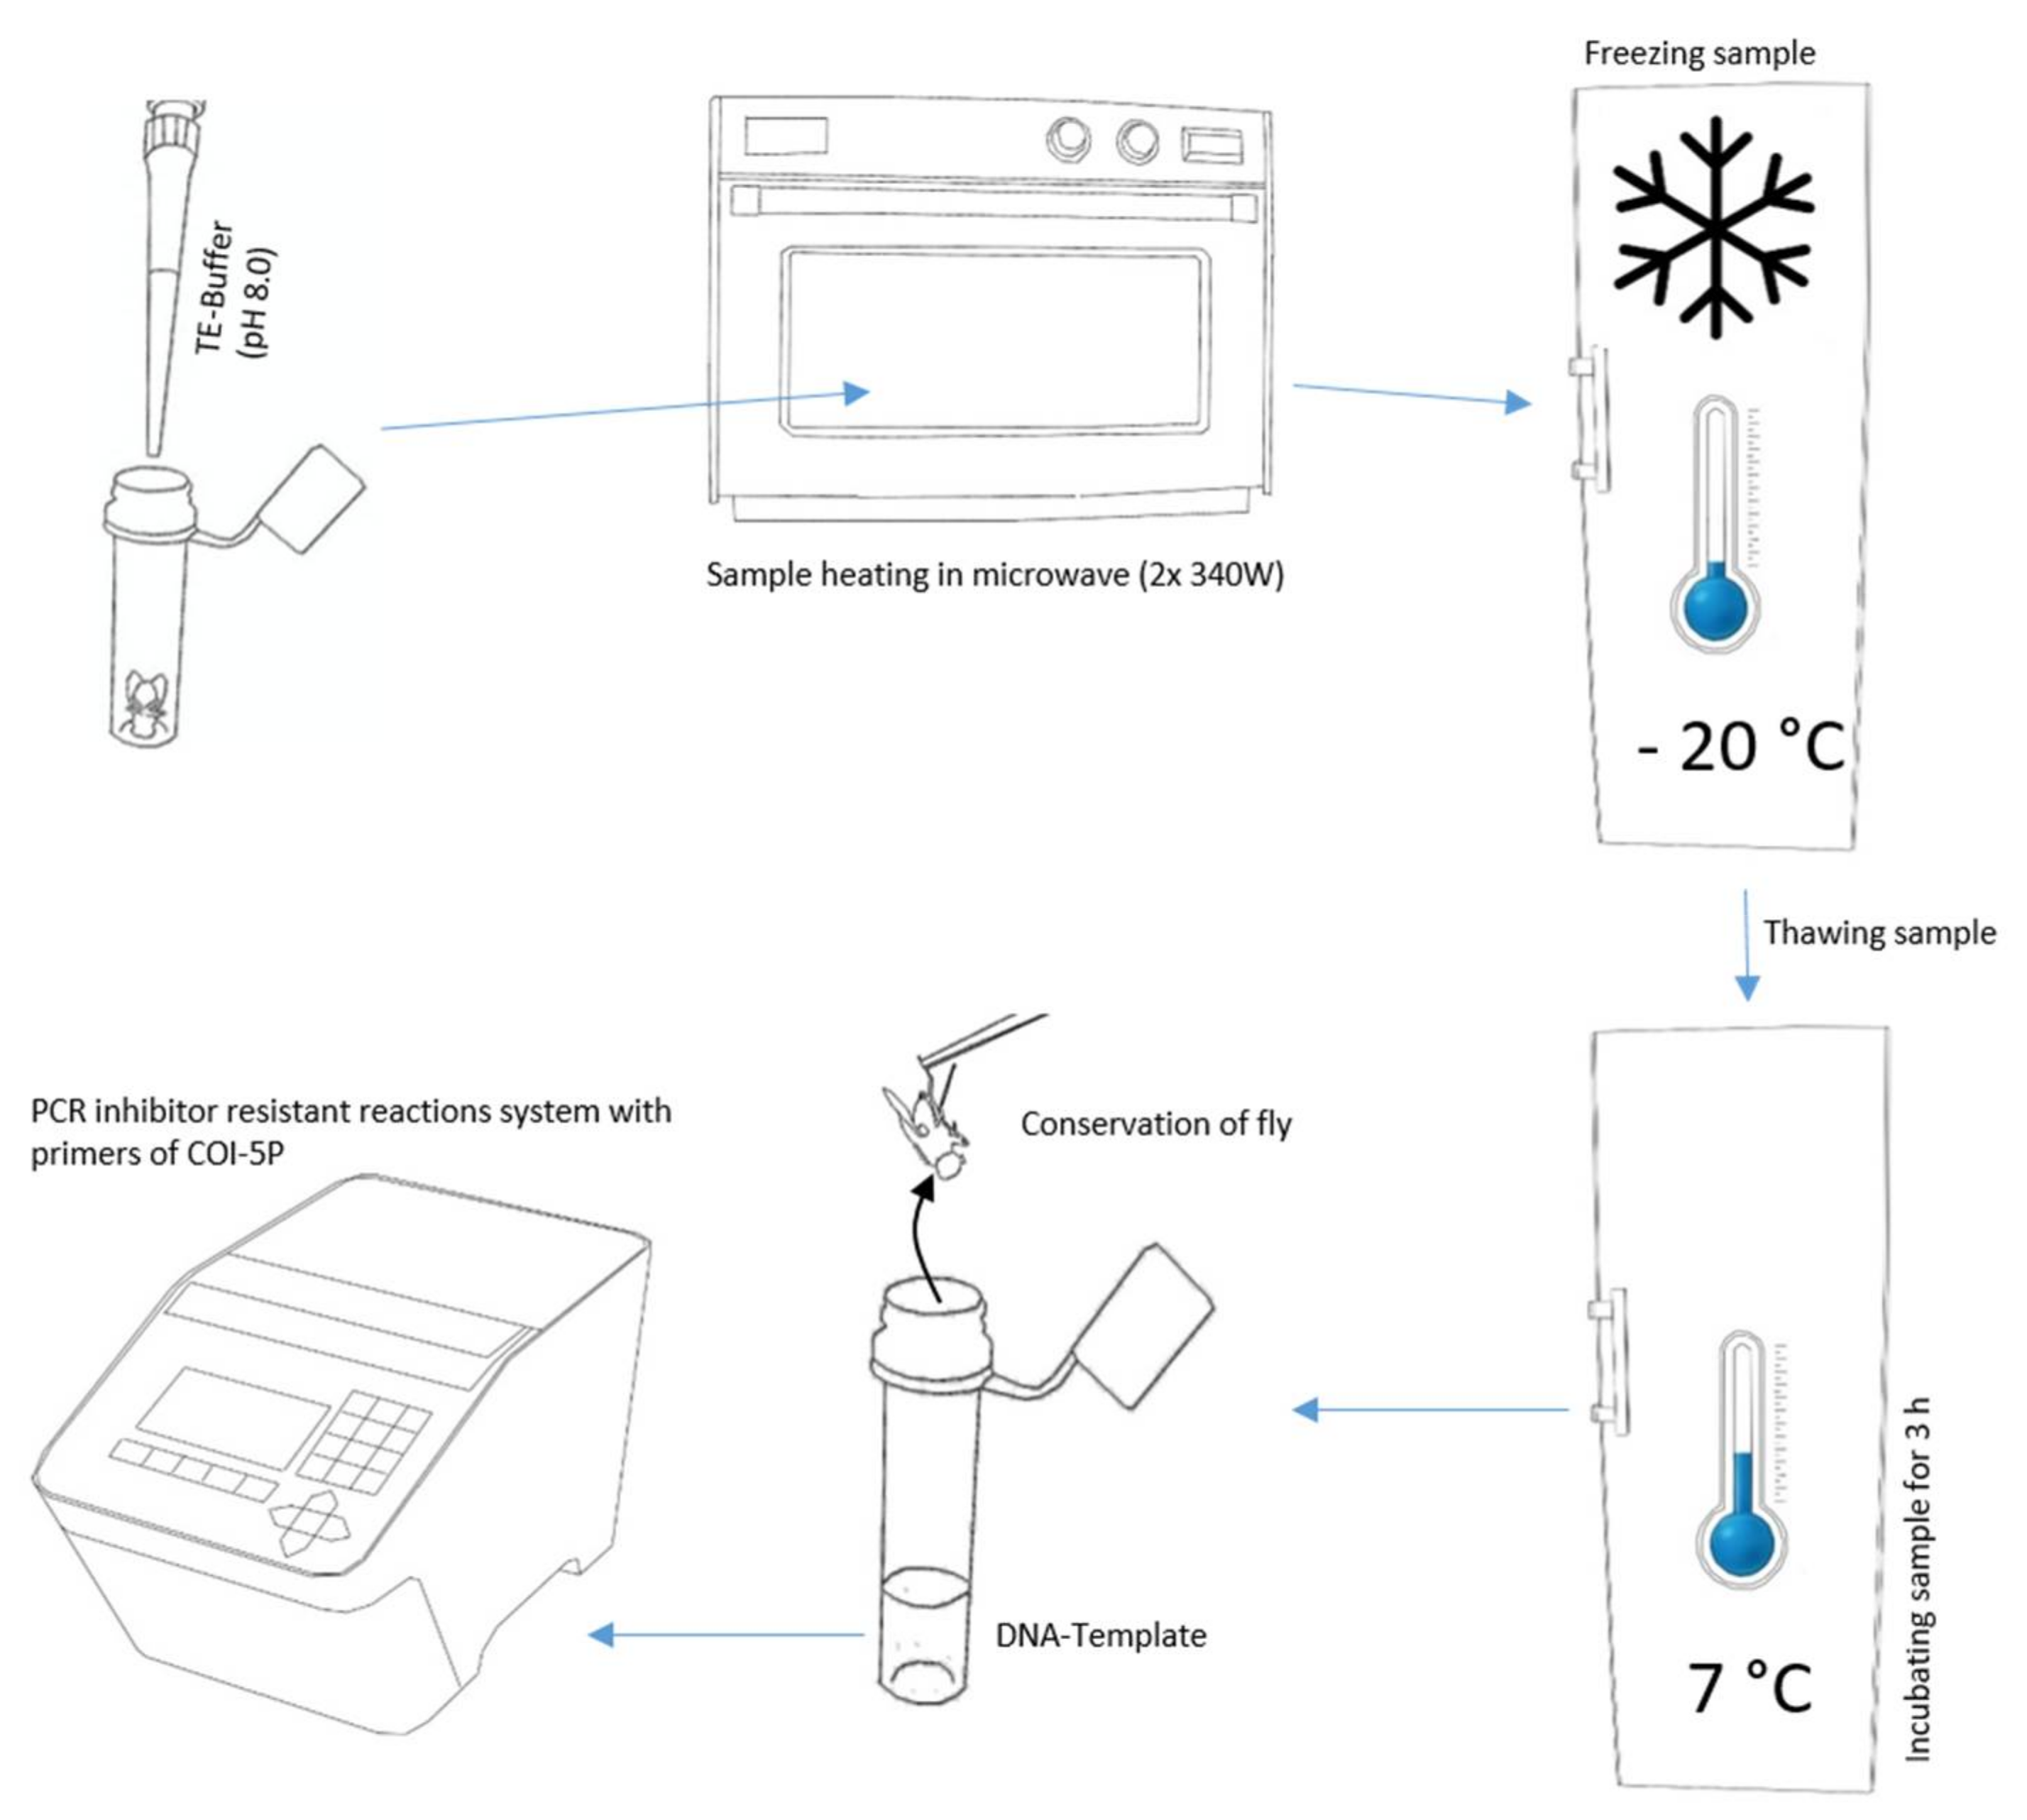
2.2. DNA Extraction

| Order | Family | Species | Author of First Description | Origin | Institute | Stage | DNA extraction Modifications | Primer | No of Specimen | ||||
|---|---|---|---|---|---|---|---|---|---|---|---|---|---|
| †† | §§ | ¶¶ | ‡‡ | †§ | |||||||||
| Araneae | Araneidae | Mangora species | O.P.-Cambridge, 1889 | Meadow, dry pitfall trap | JKI GF † | Juvenile | Standard | C_LepFolF/CLepFolR [24] | 0 | 0 | 0 | 5 | 5 |
| Coleoptera | Curculionidae | Otiorhynchus armadillo | (Rossi, 1792) | Laboratory rearing | JKI GF † | Imago | Standard | C_LepFolF/CLepFolR [24] | 0 | 0 | 0 | 5 | 5 |
| Coleoptera | Curculionidae | Pityogenes chalcographus | (Linnaeus, 1761) | Laboratory rearing | JKI GF † | Imago | Standard | C_LepFolF/CLepFolR [24] | 0 | 0 | 0 | 3 | 3 |
| Diptera | Anthomyiidae | Delia radicum | (Linnaeus, 1758) | Laboratory rearing | JKI GF † | Imago | Standard | LCO1490/HCO2198 [25] | 5 | 5 | 0 | 5 | 5 |
| Diptera | Calliphoridae | Lucilia sericata | (Meigen, 1826) | Commercial rearing | JKI GF † | Imago | Standard | LCO1490/HCO2198 [25] | 5 | 0 | 0 | 5 | 5 |
| Diptera | Drosophilidae | Drosophila hydei | Sturtevant 1921 | Commercial rearing | JKI GF † | Imago | Standard | LCO1490/HCO2198 [25] | 10 | 0 | 0 | 10 | 10 |
| Diptera | Tachinidae | Blondelia inclusa | (Hartig, 1838) | Diprionidae pupae | LFE § | Imago | Standard | LCO1490/HCO2198 [25] | 5 | 0 | 0 | 5 | 5 |
| Diptera | Tachinidae | Exorista larvarum | (Linnaeus, 1758) | Laboratory rearing | DISTAL | Imago | Standard | LCO1490/HCO2198 [25] | 0 | 5 | 5 | 0 | 0 |
| Diptera | Tachinidae | Exorista larvarum | (Linnaeus, 1758) | Laboratory rearing | DISTAL | Imago | Triton | LCO1490/HCO2198 25] | 0 | 5 | 5 | 5 | 0 |
| Diptera | Tachinidae | Senometopia intermedia | (Herting, 1960) | Ennominae cocoon | LFE § | Imago | Standard | LCO1490/HCO2198 [25] | 1 | 0 | 0 | 1 | 1 |
| Diptera | Tachinidae | Senometopia pollinosa | (Mesnil, 1941) | Ennominae cocoon | LFE § | Imago | Standard | LCO1490/HCO2198 [25] | 1 | 0 | 0 | 1 | 1 |
| Diptera | Tachinidae | species of Exorsitini tribe | NA | Diprionidae pupae | LFE § | Imago | Standard | LCO1490/HCO2198 [25] | 1 | 0 | 0 | 1 | 1 |
| Hymenoptera | Apidae | Apis mellifera | Linnaeus, 1758 | Laboratory rearing | JKI BS ‡ | Imago | Standard | C_LepFolF/CLepFolR [24] | 0 | 0 | 0 | 5 | 5 |
| Hymenoptera | Braconidae | Diaeretiella rapae | (M’Intosh, 1855) | Laboratory rearing | JKI GF † | Imago | Standard | C_LepFolF/CLepFolR [24] | 0 | 0 | 0 | 5 | 5 |
| Hymenoptera | Diprionidae | Diprion species | Schrank, 1802 | Diprionidae pupae | LFE § | Imago | 16 h | C_LepFolF/CLepFolR [24] | 0 | 1 | 0 | 0 | 0 |
| Hymenoptera | Diprionidae | Gilpinia frutetorum | (Fabricius, 1793) | Diprionidae pupae | LFE § | Imago | 16 h | C_LepFolF/CLepFolR [24] | 0 | 1 | 0 | 0 | 0 |
| Hymenoptera | Diprionidae | Gilpinia frutetorum | (Fabricius, 1793) | Diprionidae pupae | LFE § | Imago | punctured + 16 h | C_LepFolF/CLepFolR [24] | 0 | 1 | 0 | 0 | 0 |
| Hymenoptera | Diprionidae | Gilpinia variegata | (Hartig, 1834) | Diprionidae pupae | LFE § | Imago | 16 h | C_LepFolF/CLepFolR [24] | 0 | 2 | 0 | 0 | 0 |
| Hymenoptera | Diprionidae | Gilpinia variegata | (Hartig, 1834) | Diprionidae pupae | LFE § | Imago | punctured + 16 h | C_LepFolF/CLepFolR [24] | 0 | 1 | 0 | 0 | 0 |
| Hymenoptera | Diprionidae | unknown Diprionidae | NA | Diprionidae pupae | LFE § | Imago | 16 h | C_LepFolF/CLepFolR [24] | 0 | 1 | 0 | 0 | 0 |
| Hymenoptera | Diprionidae | unknown Diprionidae | NA | Diprionidae pupae | LFE § | Imago | punctured | C_LepFolF/CLepFolR [24] | 0 | 5 | 0 | 0 | 0 |
| Hymenoptera | Diprionidae | unknown Diprionidae | NA | Diprionidae pupae | LFE § | Imago | punctured + 16 h | C_LepFolF/CLepFolR [24] | 0 | 2 | 0 | 0 | 0 |
| Hymenoptera | Diprionidae | unknown Diprionidae | NA | Diprionidae pupae | LFE § | Imago | Standard | C_LepFolF/CLepFolR [24] | 0 | 5 | 0 | 5 | 5 |
| Hymenoptera | Ichneumonidae | Cratichneumon species | Thomson, 1893 | Ennominae cocoon | LFE § | Imago | Standard | C_LepFolF/CLepFolR [24] | 0 | 0 | 0 | 1 | 1 |
| Hymenoptera | Ichneumonidae | Cratichneumon species | Thomson, 1893 | Ennominae cocoon | LFE § | Imago | Standard | C_LepFolF/CLepFolR [24] | 0 | 1 | 0 | 1 | 1 |
| Hymenoptera | Ichneumonidae | Exenterus abruptorius | (Thunberg, 1824) | Diprionidae pupae | LFE § | Imago | Standard | C_LepFolF/CLepFolR [24] | 0 | 1 | 0 | 1 | 1 |
| Hymenoptera | Ichneumonidae | Exenterus species | Hartig, 1837 | Diprionidae pupae | LFE § | Imago | Standard | C_LepFolF/CLepFolR [24] | 0 | 1 | 0 | 1 | 1 |
| Hymenoptera | Ichneumonidae | Heteropelma megarthrum | (Ratzeburg, 1848) | Ennominae cocoon | LFE § | Imago | Standard | C_LepFolF/CLepFolR [24] | 0 | 1 | 0 | 1 | 1 |
| Hymenoptera | Ichneumonidae | Hyposoter didymator | (Thunberg, 1824) | Diprionidae pupae | LFE § | Imago | Standard | C_LepFolF/CLepFolR [24] | 0 | 1 | 0 | 1 | 1 |
| Hymenoptera | Ichneumonidae | Lamachus frutetorum | (Hartig, 1828) | Diprionidae pupae | LFE § | Imago | Standard | C_LepFolF/CLepFolR [24] | 0 | 1 | 0 | 1 | 1 |
| Hymenoptera | Ichneumonidae | Pleolophus species | Townes, 1962 | Diprionidae pupae | LFE § | Imago | Standard | C_LepFolF/CLepFolR [24] | 0 | 1 | 0 | 1 | 1 |
| Hymenoptera | Ichneumonidae | species of Playbini Tribe | NA | Ennominae cocoon | LFE § | Imago | Standard | C_LepFolF/CLepFolR [24] | 0 | 1 | 0 | 1 | 1 |
| Hymenoptera | Ichneumonidae | unknown Ichneumonidae | NA | Diprionidae pupae | LFE § | Imago | Standard | C_LepFolF/CLepFolR [24] | 0 | 3 | 0 | 3 | 3 |
| Hymenoptera | Ichneumonidae | unknown Ichneumonidae | NA | Ennominae cocoon | LFE § | Imago | Standard | C_LepFolF/CLepFolR [24] | 0 | 0 | 0 | 3 | 3 |
| Lepidoptera | Erebidae | Lymantria dispar | (Linnaeus, 1758) | Laboratory rearing | JKI GF † | Imago | Standard | C_LepFolF/CLepFolR [24] | 0 | 3 | 0 | 3 | 3 |
| Lepidoptera | Geometridae | Bupalus piniaria | (Linnaeus, 1758) | Ennominae cocoon | LFE § | Imago | Standard | C_LepFolF/CLepFolR [24] | 0 | 0 | 0 | 2 | 2 |
| Lepidoptera | Geometridae | Macaria liturata | (Clerck, 1759) | Ennominae cocoon | LFE § | Imago | Standard | C_LepFolF/CLepFolR [24] | 0 | 0 | 0 | 3 | 3 |
| Lepidoptera | Noctuidae | Mamestra brassicae | (Linnaeus, 1758) | Laboratory rearing | JKI GF † | Imago | Standard | C_LepFolF/CLepFolR [24] | 0 | 0 | 0 | 5 | 5 |
| Lepidoptera | Erebidae | Lymantria dispar | (Linnaeus, 1758) | Laboratory rearing | JKI GF † | L3 | Standard | C_LepFolF/CLepFolR [24] | 0 | 1 | 0 | 1 | 0 |
| Lepidoptera | Erebidae | Lymantria dispar | (Linnaeus, 1758) | Laboratory rearing | JKI GF † | L4 | Standard | C_LepFolF/CLepFolR [24] | 0 | 2 | 0 | 2 | 0 |
| Lepidoptera | Erebidae | Lymantria dispar | (Linnaeus, 1758) | Laboratory rearing | JKI GF † | L5 | Standard | C_LepFolF/CLepFolR [24] | 0 | 2 | 0 | 2 | 0 |
| Lepidoptera | Erebidae | Lymantria dispar | (Linnaeus, 1758) | Laboratory rearing | JKI GF † | L6 | Standard | C_LepFolF/CLepFolR [24] | 0 | 1 | 0 | 1 | 0 |
| Lepidoptera | Erebidae | Lymantria dispar | (Linnaeus, 1758) | Laboratory rearing | JKI GF † | L7 | Standard | C_LepFolF/CLepFolR [24] | 0 | 4 | 0 | 4 | 0 |
| 28 | 58 | 10 | 99 | 84 | |||||||||
2.3. PCR and Post PCR Treatment
2.4. Stochastic Analyses and Assessment
3. Results
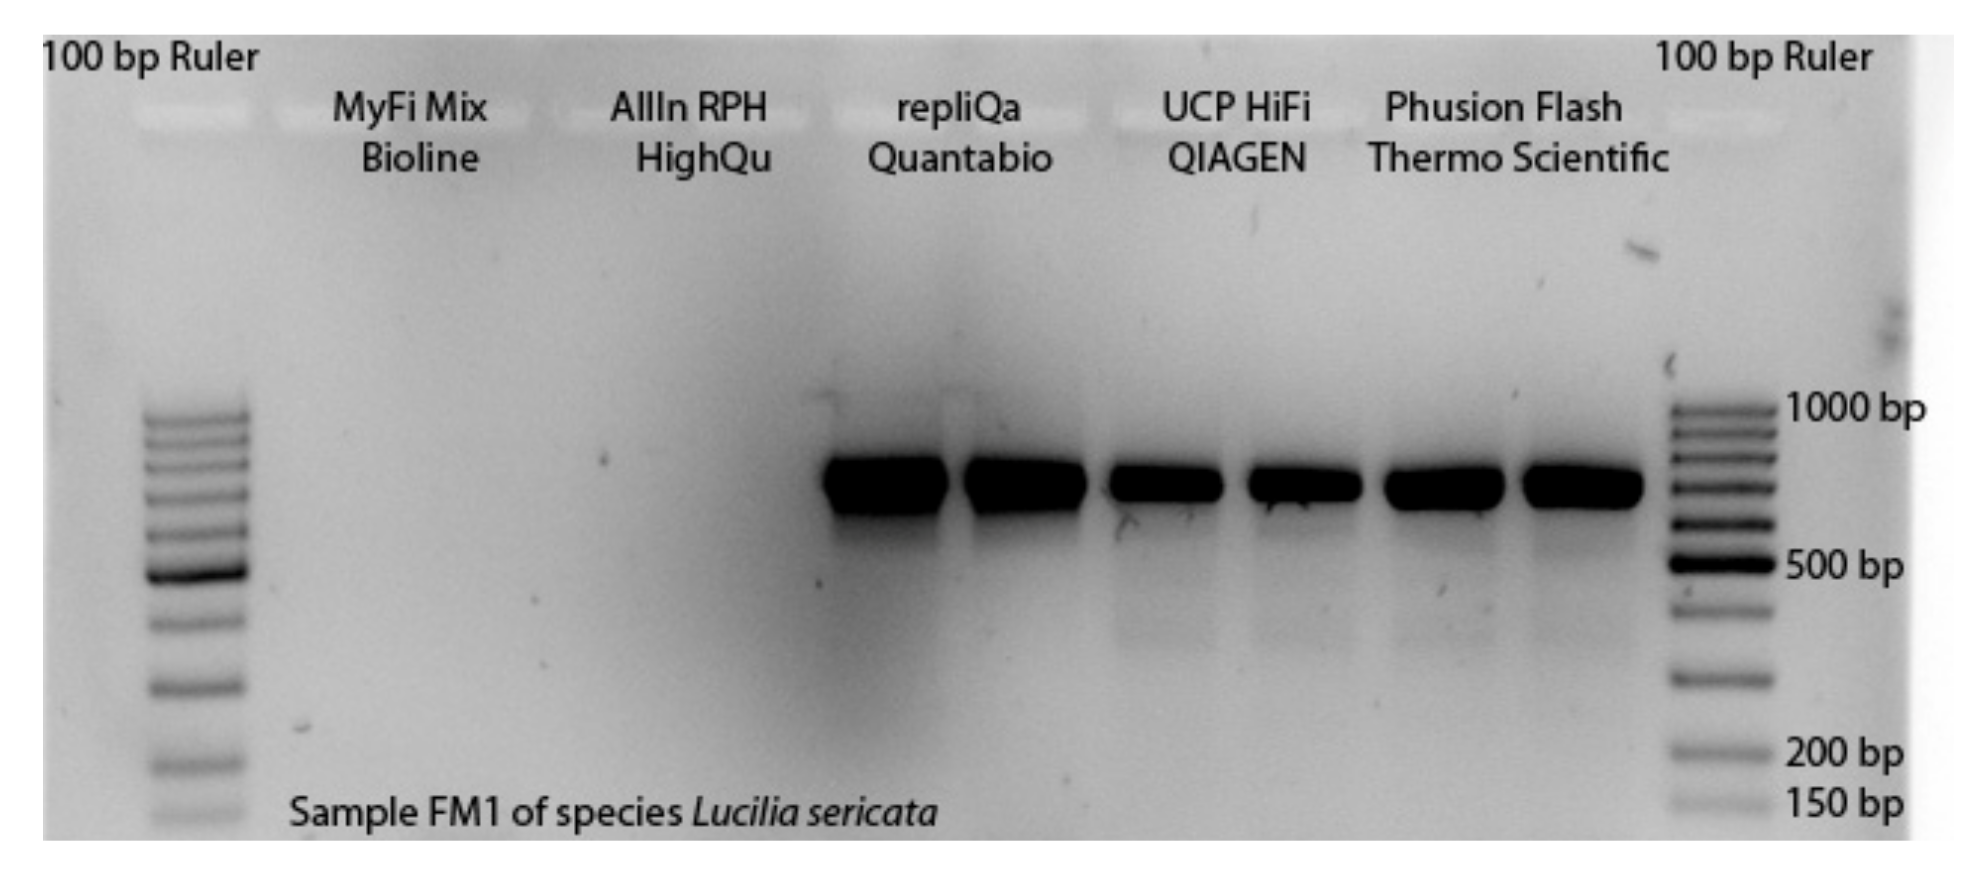
3.1. Selection of Master Mixes
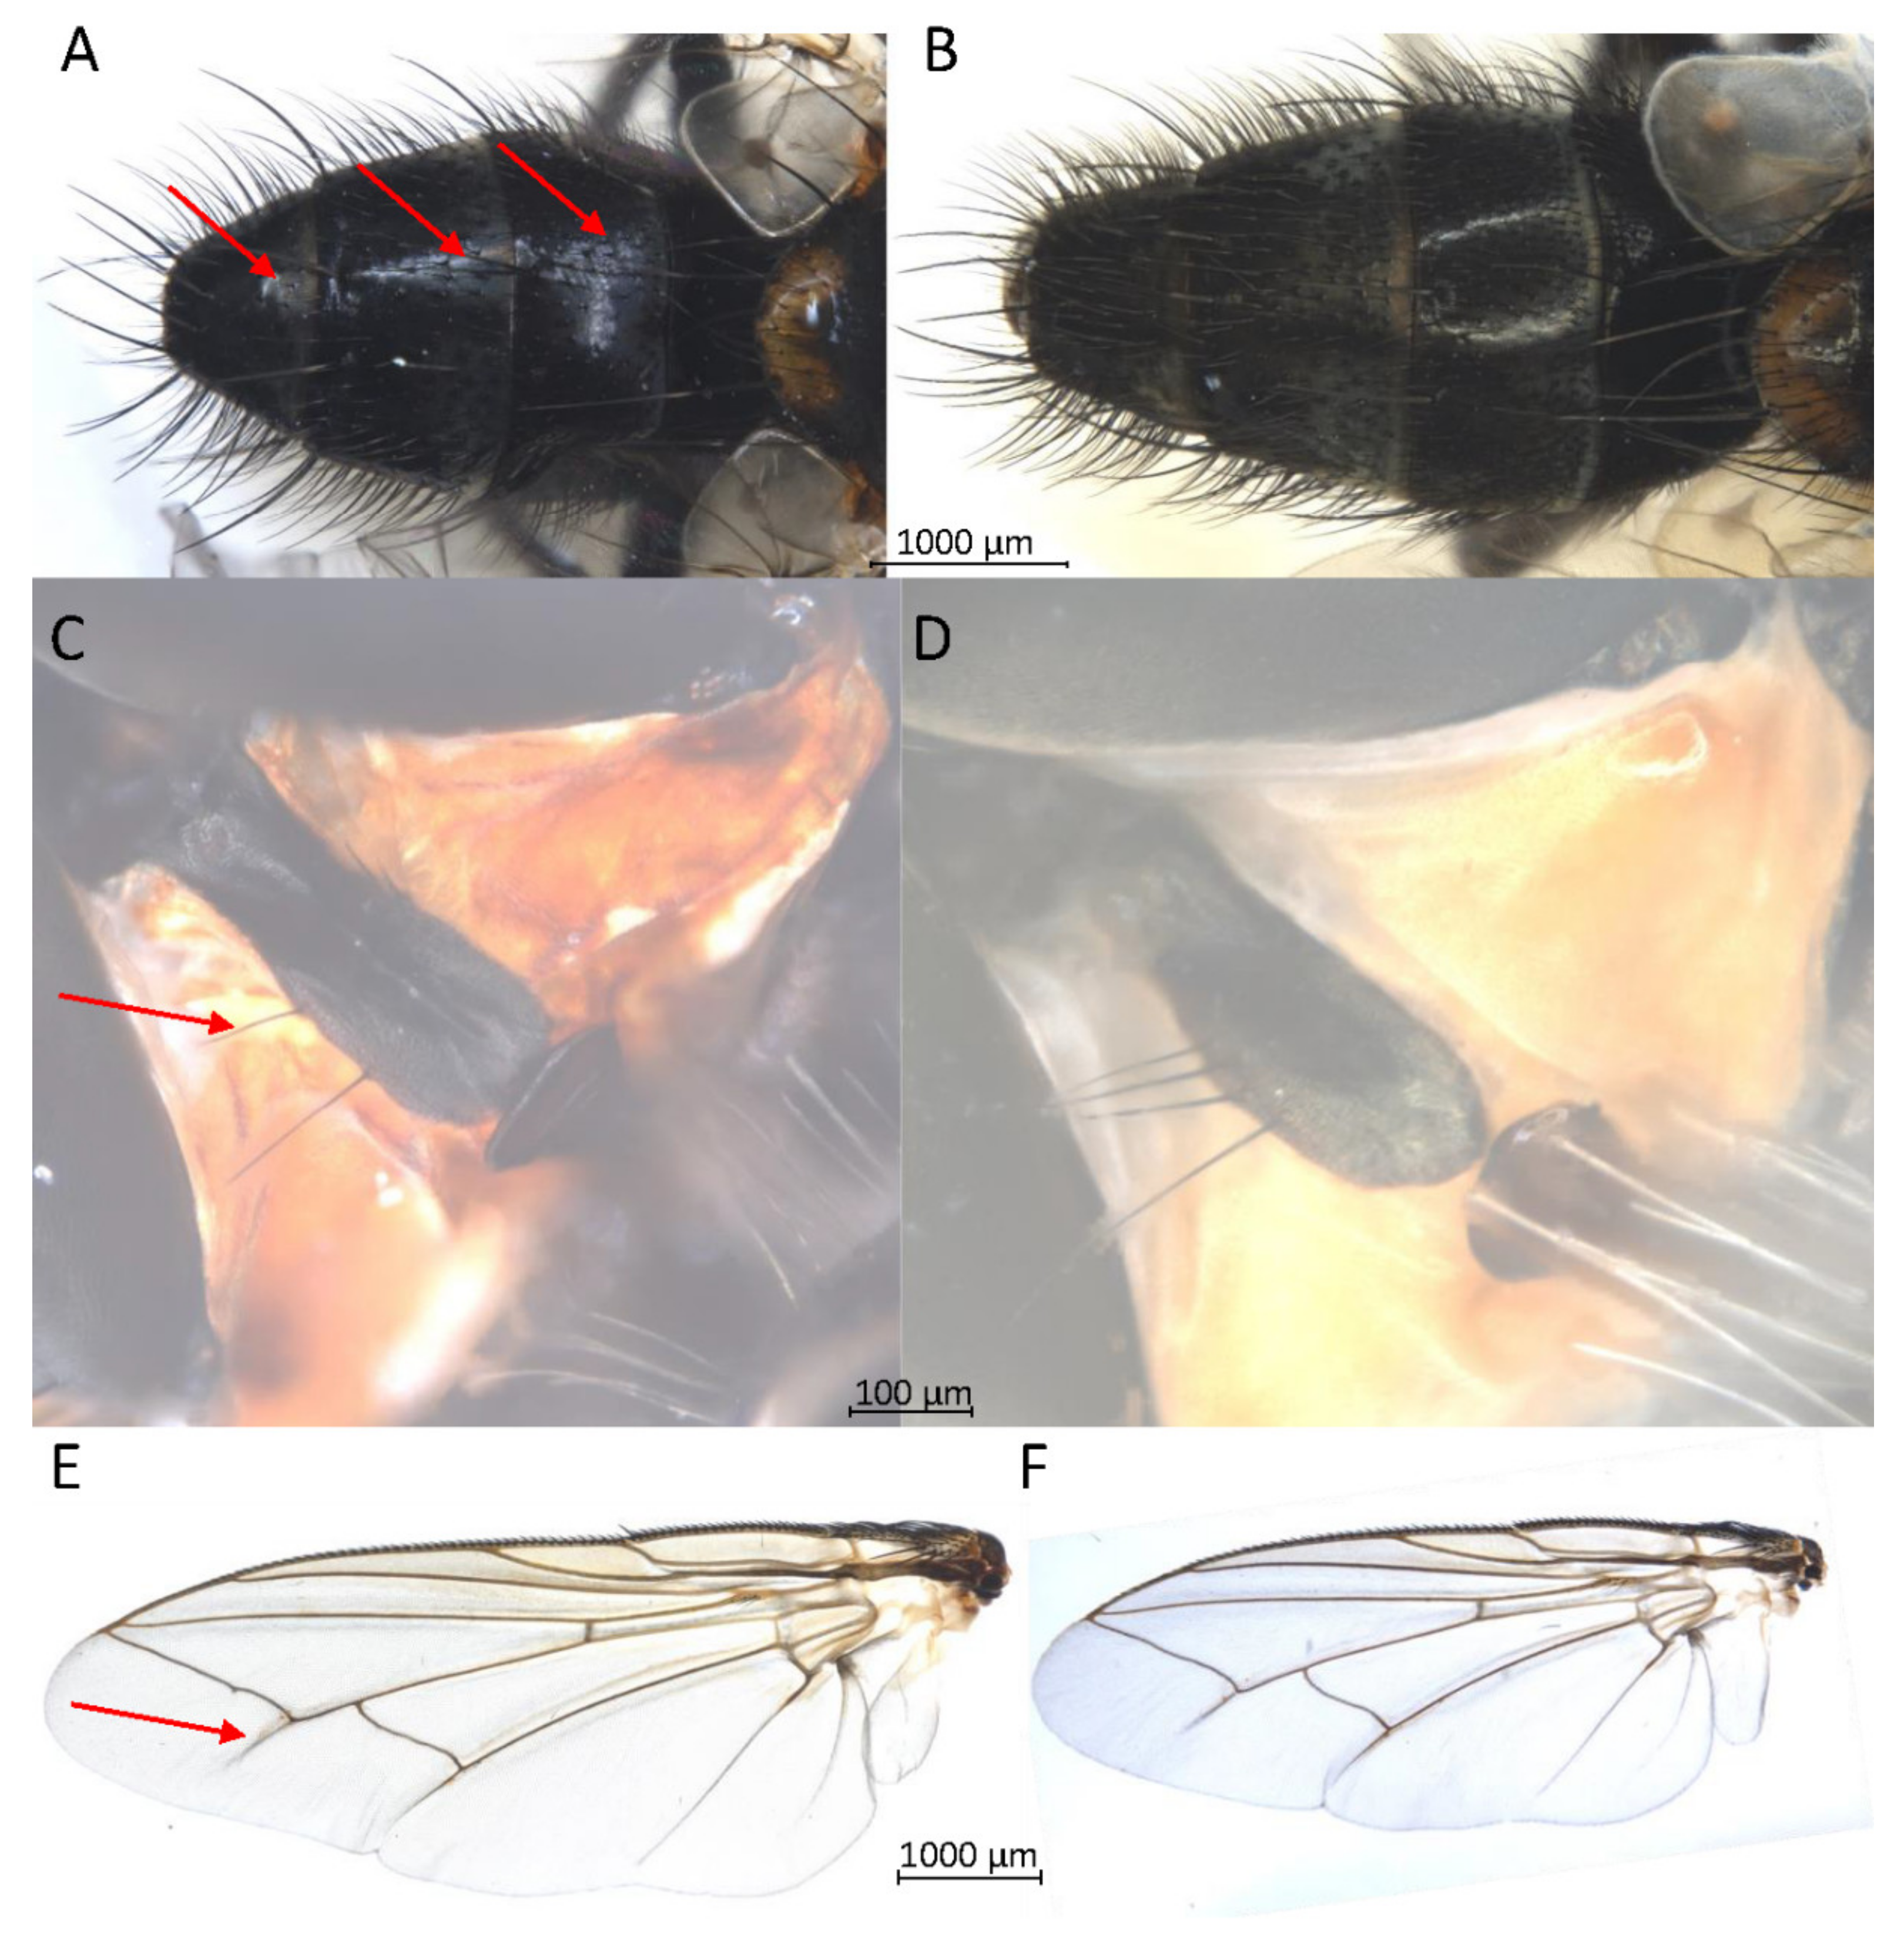
3.2. Success of Morphology Character Maintenance and DNA Barcoding
3.3. Diptera (Brachycera: Schizophora)
3.4. Hymenoptera (Symphyta, Apocrita)
3.5. Further Samples (Insects: Coleoptera, Lepidoptera, Arachnida: Araneae)
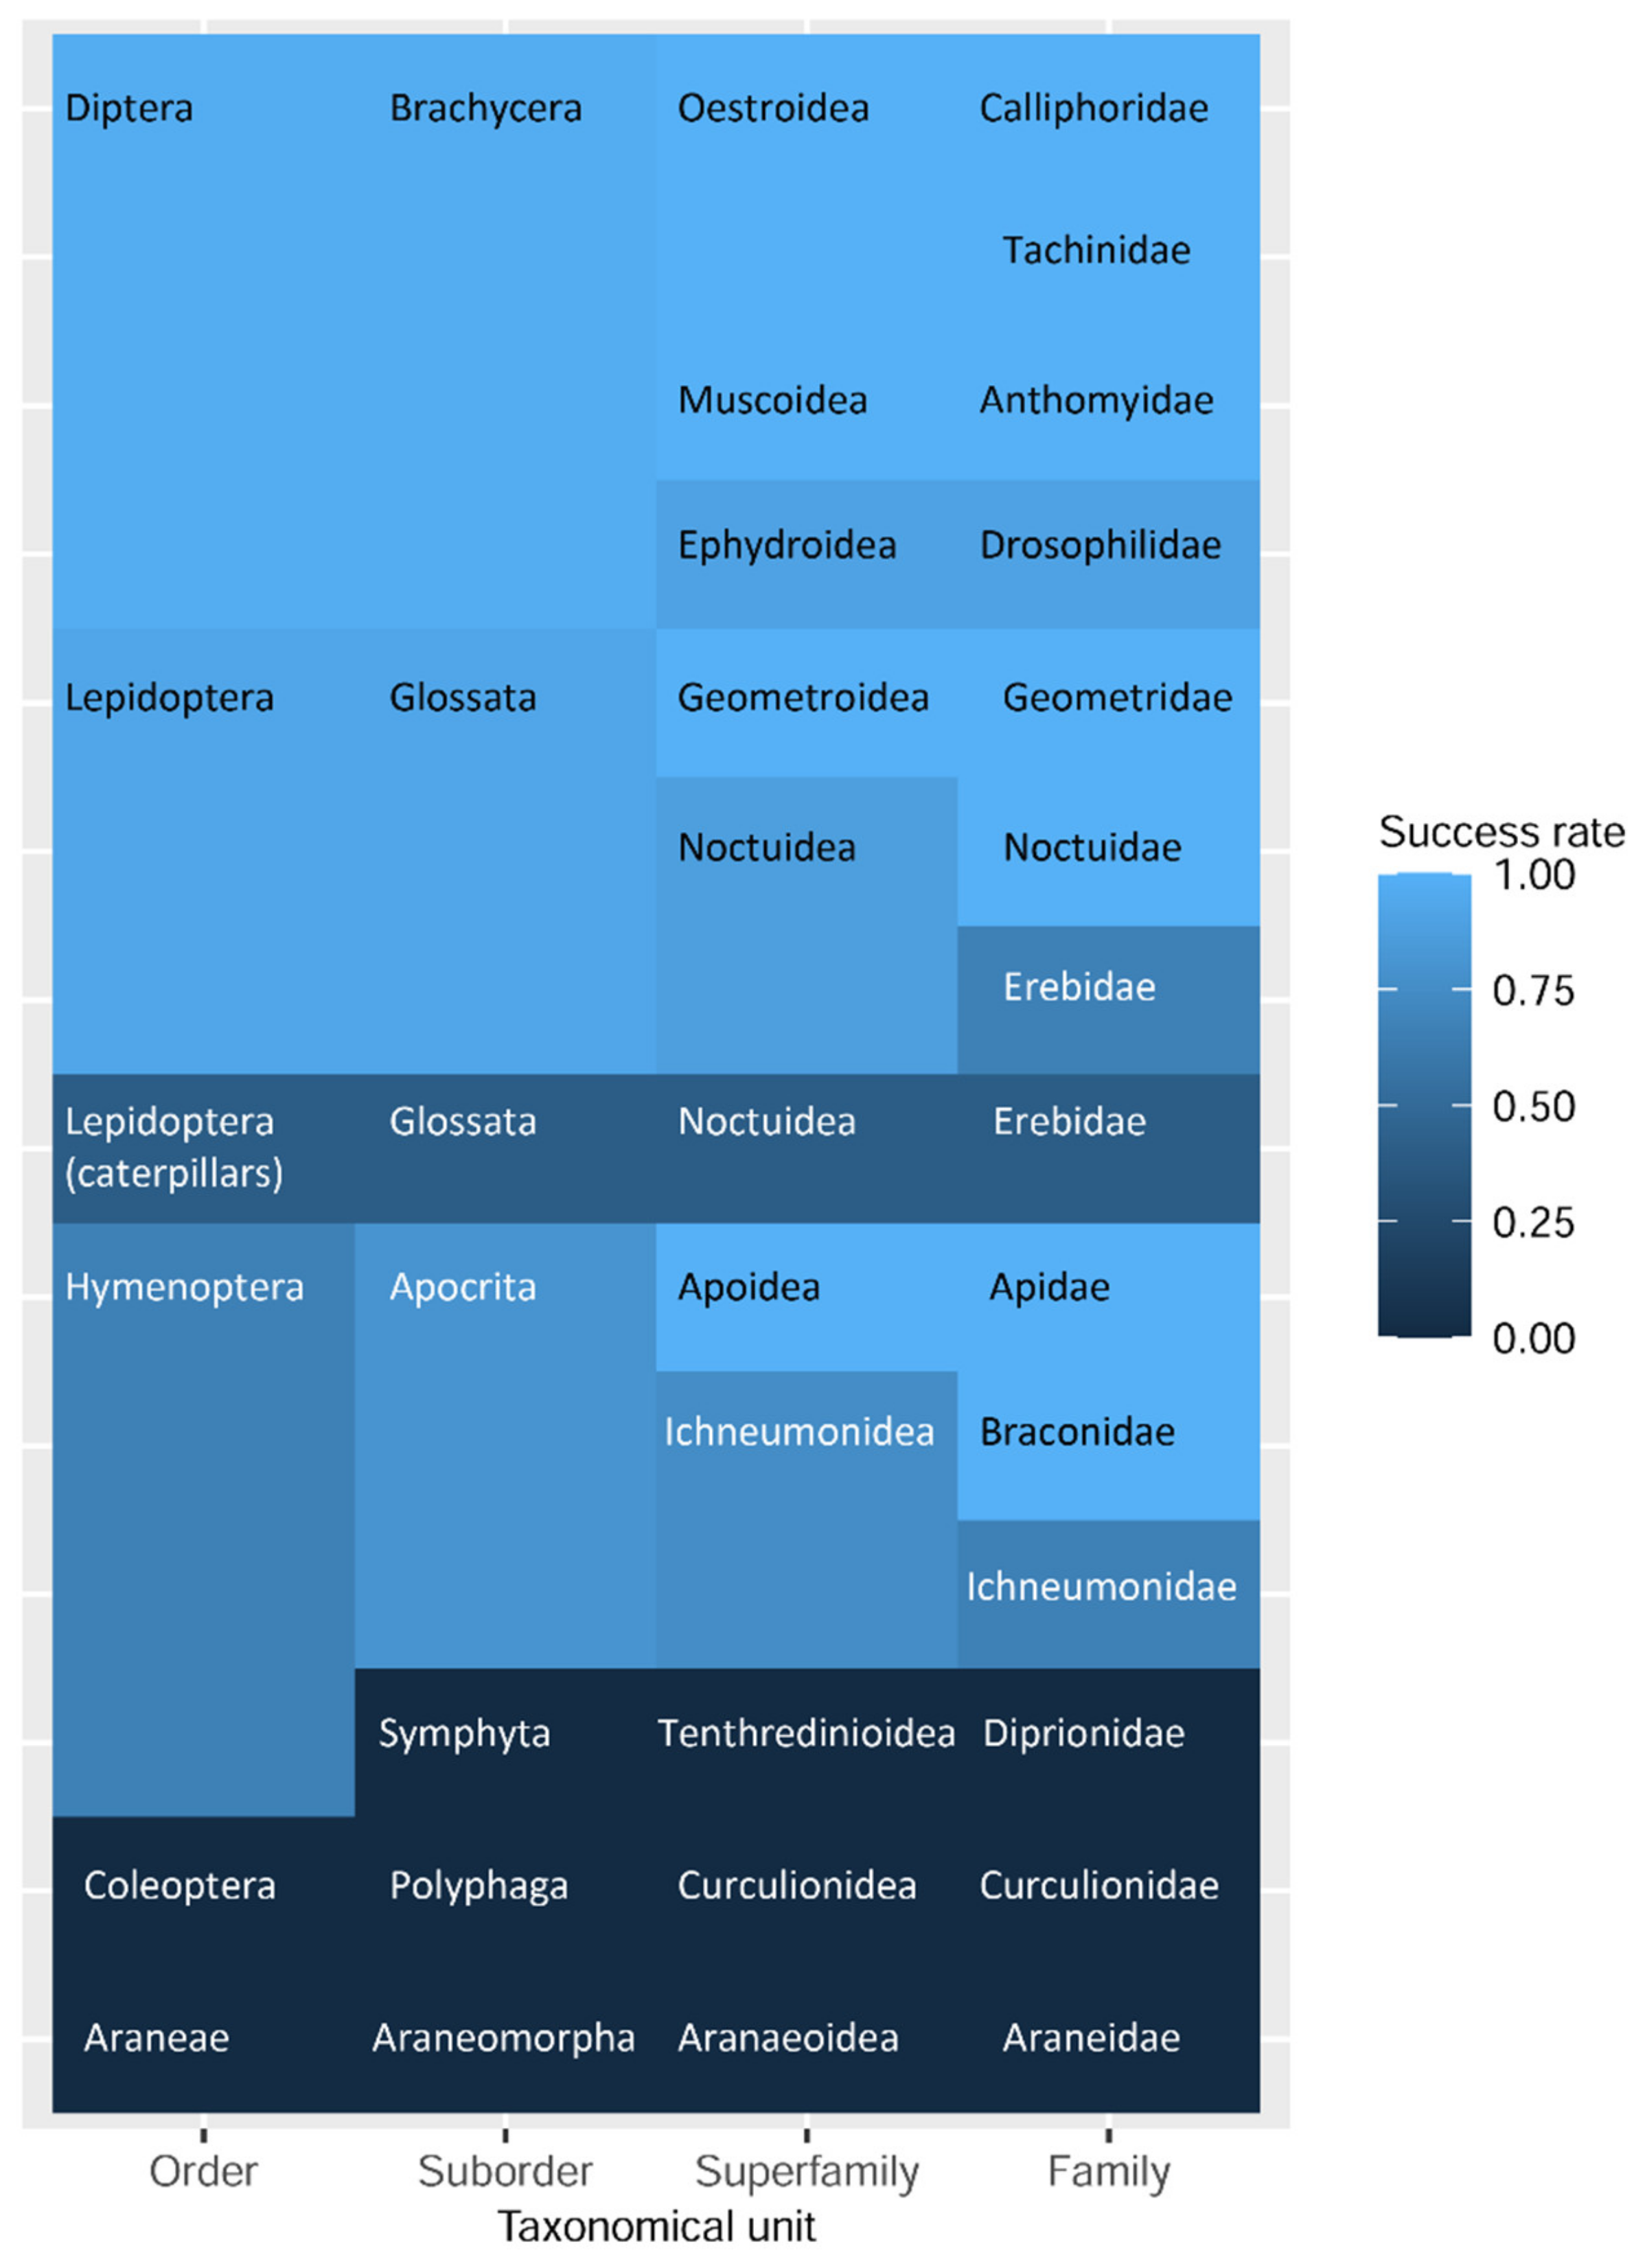
3.6. Statistical Analysis
4. Discussion
5. Conclusions
Supplementary Materials
Author Contributions
Funding
Institutional Review Board Statement
Informed Consent Statement
Data Availability Statement
Acknowledgments
Conflicts of Interest
References
- Kim, K.C.; Byrne, L.B. Biodiversity loss and the taxonomic bottleneck: Emerging biodiversity science. Ecol. Res. 2006, 21, 794–810. [Google Scholar] [CrossRef] [Green Version]
- Klopper, R.R.; Smith, G.F.; Chikuni, A.C. The Global Taxonomy Initiative in Africa. TAXON 2002, 51, 159–165. [Google Scholar] [CrossRef]
- Hebert, P.D.N.; Cywinska, A.; Ball, S.L.; Dewaard, J.R. Biological identifications through DNA barcodes. Proc. R. Soc. Lond. Ser. B Biol. Sci. 2003, 270, 313–321. [Google Scholar] [CrossRef] [Green Version]
- Meier, R.; Shiyang, K.; Vaidya, G.; Ng, P.K.L. DNA barcoding and taxonomy in Diptera: A Tale of Intraspecific Variability and Low Identifcation Success. Syst. Biol. 2006, 55, 715–728. [Google Scholar] [CrossRef] [PubMed] [Green Version]
- Virgilio, M.; Backeljau, T.; Nevado, B.; de Meyer, M. Comparative performances of DNA barcoding across insect orders. BMC Bioinform. 2010, 11, 206. [Google Scholar] [CrossRef] [PubMed] [Green Version]
- Seibold, S.; Gossner, M.M.; Simons, N.K.; Blüthgen, N.; Müller, J.; Ambarlı, D.; Ammer, C.; Bauhus, J.; Fischer, M.; Habel, J.C.; et al. Arthropod decline in grasslands and forests is associated with landscape-level drivers. Nature 2019, 574, 671–674. [Google Scholar] [CrossRef]
- Malcolm, J.R.; Liu, C.; Neilson, R.P.; Hansen, L.; Hannah, L. Global Warming and Extinctions of Endemic Species from Biodiversity Hotspots. Conserv. Biol. 2006, 20, 538–548. [Google Scholar] [CrossRef]
- Benítez-Malvido, J.; Dáttilo, W.; Martinez-Falcon, A.P.; Durán-Barrón, C.; Valenzuela, J.; Lopez, S.; Lombera, R. The Multiple Impacts of Tropical Forest Fragmentation on Arthropod Biodiversity and on their Patterns of Interactions with Host Plants. PLoS ONE 2016, 11, e0146461. [Google Scholar] [CrossRef] [Green Version]
- Davis, M.A. Biotic globalization: Does competition from introduced species threaten biodiversity? BioScience 2003, 53, 481. [Google Scholar] [CrossRef] [Green Version]
- Miedaner, T.; Juroszek, P. Global warming and increasing maize cultivation demand comprehensive efforts in disease and insect resistance breeding in north-western Europe. Plant Pathol. 2021, 70, 1032–1046. [Google Scholar] [CrossRef]
- Kim, S.Y.; Park, S.H.; Piao, H.; Chung, U.; Ko, K.S.; Hwang, J.-J. Vouchering of Forensically Important Fly Specimens by Nondestructive DNA Extraction. ISRN Èntomol. 2012, 2013, 1–5. [Google Scholar] [CrossRef] [Green Version]
- Krosch, M.N.; Cranston, P.S. Non-destructive DNA extraction from Chironomidae, including of fragile pupal exuviae, extends analysable collections and enhances vouchering. CHIRONOMUS J. Chironomidae Res. 2012. [Google Scholar] [CrossRef] [Green Version]
- Sakamoto, H.; Gotoh, T. Non-destructive direct polymerase chain reaction (direct PCR) greatly facilitates molecular identification of spider mites (Acari: Tetranychidae). Appl. EÈntomol. Zool. 2017, 52, 661–665. [Google Scholar] [CrossRef]
- Gilbert, M.T.P.; Moore, W.; Melchior, L.; Worobey, M. DNA Extraction from Dry Museum Beetles without Conferring External Morphological Damage. PLoS ONE 2007, 2, e272. [Google Scholar] [CrossRef] [PubMed] [Green Version]
- Thomsen, P.F.; Elias, S.; Gilbert, M.T.P.; Haile, J.; Munch, K.; Kuzmina, S.; Froese, D.G.; Sher, A.; Holdaway, R.N.; Willerslev, E. Non-Destructive Sampling of Ancient Insect DNA. PLoS ONE 2009, 4, e5048. [Google Scholar] [CrossRef] [PubMed]
- Castalanelli, M.A.; Severtson, D.L.; Brumley, C.J.; Szito, A.; Foottit, R.G.; Grimm, M.; Munyard, K.; Groth, D.M. A rapid non-destructive DNA extraction method for insects and other arthropods. J. Asia-Pacific Èntomol. 2010, 13, 243–248. [Google Scholar] [CrossRef] [Green Version]
- Phillips, A.J.; Simon, C. Simple, Efficient, and Nondestructive DNA Extraction Protocol for Arthropods. Ann. Èntomol. Soc. Am. 1995, 88, 281–283. [Google Scholar] [CrossRef]
- Ritter, C.D.; Häggqvist, S.; Karlsson, D.; Sääksjärvi, I.E.; Muasya, A.M.; Nilsson, R.H.; Antonelli, A.; Muasya, M. Biodiversity assessments in the 21st century: The potential of insect traps to complement environmental samples for estimating eukaryotic and prokaryotic diversity using high-throughput DNA metabarcoding. Genome 2019, 62, 147–159. [Google Scholar] [CrossRef]
- Rowley, D.L.; Coddington, J.A.; Gates, M.W.; Norrbom, A.L.; Ochoa, R.A.; Vandenberg, N.J.; Greenstone, M.H. Vouchering DNA-barcoded specimens: Test of a nondestructive extraction protocol for terrestrial arthropods. Mol. Ecol. Notes 2007, 7, 915–924. [Google Scholar] [CrossRef] [Green Version]
- Suaste-Dzul, A.P.; Rodríguez-Vélez, J.M.; Rodríguez-Vélez, B.; Arredondo-Bernal, H.C.; Gallou, A. Non-destructive DNA extraction methods for entomophagous insects with emphasis on biological control. Genome 2019, 62, 287–293. [Google Scholar] [CrossRef] [PubMed]
- Martoni, F.; Valenzuela, I.; Blacket, M.J. Non-destructive DNA extractions from fly larvae (Diptera: Muscidae) enable molecular identification of species and enhance morphological features. Austral Èntomol. 2019, 58, 848–856. [Google Scholar] [CrossRef]
- Santos, D.; Ribeiro, G.C.; Cabral, A.D.; Sperança, M.A. A non-destructive enzymatic method to extract DNA from arthropod specimens: Implications for morphological and molecular studies. PLoS ONE 2018, 13, e0192200. [Google Scholar] [CrossRef] [PubMed] [Green Version]
- Tschorsnig, H.-P.; Herting, B. Die Raupenfliegen (Diptera; Tachinidae) Mitteleuropas: Bestimmungstabellen und Angaben zur Verbreitung und Ökologie der einzelnen Arten. Stuttg. Beiträge Zur Nat. Ser. A 1994, 506, 1–170. [Google Scholar]
- Hernández-Triana, L.M.; Prosser, S.W.; Rodríguez-Perez, M.A.; Chaverri, L.G.; Hebert, P.D.N.; Ryan Gregory, T. Recovery of DNA barcodes from blackfly museum specimens (Diptera: Simuliidae) using primer sets that target a variety of sequence lengths. Mol. Ecol. Resour. 2014, 14, 508–518. [Google Scholar] [CrossRef]
- Folmer, O.; Black, M.; Hoeh, W.; Lutz, R.; Vrijenhoek, R. DNA primers for amplification of mitochondiral cytochrome c oxidase subunit I from diverse metazoan invertebrates. Mol. Marine Biol. Biotechnol. 1994, 3, 194–299. [Google Scholar]
- Izumitsu, K.; Hatoh, K.; Sumita, T.; Kitade, Y.; Morita, A.; Tanaka, C.; Gafur, A.; Ohta, A.; Kawai, M.; Yamanaka, T.; et al. Rapid and simple preparation of mushroom DNA directly from colonies and fruiting bodies for PCR. Mycoscience 2012, 53, 396–401. [Google Scholar] [CrossRef]
- Müller, H.-J.; Prange, D.R. PCR—Polymerase-Kettenreaktion, 2nd ed.; Springer: Berlin, Germany, 2016. [Google Scholar]
- Gibson, J.F.; Kelso, S.; Jackson, M.D.; Kits, J.H.; Miranda, G.F.G.; Skevington, J.H. Diptera-Specific Polymerase Chain Reaction Amplification Primers of use in Molecular Phylogenetic Research. Ann. Èntomol. Soc. Am. 2011, 104, 976–997. [Google Scholar] [CrossRef] [Green Version]
- EPPO. PM 7/129 (1) DNA barcoding as an identification tool for a number of regulated pests. EPPO Bull. 2016, 46, 501–537. [Google Scholar] [CrossRef] [Green Version]
- R Development Core Team. R: A language and environment for statistical computing. R Foundation for Statistical Computing, Vienna, Austria. 2020. Available online: https://www.R-project.org/ (accessed on 11 August 2021).
- Ratnasingham, S.; Hebert, P.D.N. A DNA-Based Registry for All Animal Species: The Barcode Index Number (BIN) System. PLoS ONE 2013, 8, e66213. [Google Scholar] [CrossRef] [PubMed] [Green Version]
- Wigglesworth, V.B. The Principles of Insect Physiology; Springer: Dordrecht, The Netherlands, 1972; ISBN 9789400959736. [Google Scholar]
- Freeman, P.W. Correspondence of Food Habits and Morphology in Insectivorous Bats. J. Mammal. 1981, 62, 156–172. [Google Scholar] [CrossRef]
- Klowden, M.J. Physiological Systems in Insects, 3rd ed.; Elsevier Inc.: London, UK, 2013. [Google Scholar]
- Carew, M.E.; Coleman, R.A.; Hoffmann, A. Can non-destructive DNA extraction of bulk invertebrate samples be used for metabarcoding? PeerJ 2018, 6, e4980. [Google Scholar] [CrossRef] [Green Version]
- Nagarajan, R.P.; Goodbla, A.; Graves, E.; Baerwald, M.; Holyoak, M.; Schreier, A. Non-invasive genetic monitoring for the threatened valley elderberry longhorn beetle. PLoS ONE 2020, 15, e0227333. [Google Scholar] [CrossRef] [Green Version]
- Wong, W.H.; Tay, Y.C.; Puniamoorthy, J.; Balke, M.; Cranston, P.S.; Meier, R. ‘Direct PCR’ optimization yields a rapid, cost-effective, nondestructive and efficient method for obtaining DNA barcodes without DNA extraction. Mol. Ecol. Resour. 2014, 14, 1271–1280. [Google Scholar] [CrossRef]
- Bork, R.A. Non-destructive DNA extraction methods that yield DNA barcodes in spiders. Honor. Program Theses Pap. 2015, 168, 1–28. [Google Scholar]
- Favret, C. A new non-destructive DNA extraction and specimen clearing technique for aphids (Hemiptera). Proc. Entomol. Soc. Wash. 2005, 107, 469–470. [Google Scholar]
- Giantsis, I.; Chaskopoulou, A.; Bon, M.C. Mild-Vectolysis: A Nondestructive DNA Extraction Method for Vouchering Sand Flies and Mosquitoes. J. Med. Èntomol. 2016, 53, 692–695. [Google Scholar] [CrossRef]
- Guzmán-Larralde, A.J.; Suaste-Dzul, A.P.; Gallou, A.; Peña-Carrillo, K.I. DNA recovery from microhymenoptera using six non-destructive methodologies with considerations for subsequent preparation of museum slides. Genome 2017, 60, 85–91. [Google Scholar] [CrossRef] [Green Version]
- Hofreiter, M. Nondestructive DNA Extraction from Museum Specimens. In Ancient DNA.; Shapiro, B., Hofreiter, M., Eds.; Humana Press: Santa Cruz, CA, USA, 2012; pp. 93–100. [Google Scholar]
- Miura, K.; Higashiura, Y.; Maeto, K. Evaluation of easy, non-destructive methods of DNA extraction from minute insects. Appl. Èntomol. Zool. 2017, 52, 349–352. [Google Scholar] [CrossRef] [Green Version]
- Ota, A.; Karasawa, S.; Nakamura, T.; Harada, H.; Shimano, S. Non-destructive DNA extraction protocol for oribatid mites (Acari: Oribatida). Edaphologia 2011, 89, 19–23. [Google Scholar] [CrossRef]
- Pons, J. DNA-based identification of preys from non-destructive, total DNA extractions of predators using arthropod universal primers. Mol. Ecol. Notes 2006, 6, 623–626. [Google Scholar] [CrossRef]
- Porco, D.; Rougerie, R.; Deharveng, L.; Hebert, P.D.N. Coupling non-destructive DNA extraction and voucher retrieval for small soft-bodied Arthropods in a high-throughput context: The example of Collembola. Mol. Ecol. Resour. 2010, 10, 942–945. [Google Scholar] [CrossRef] [PubMed]
- Robbertse, N.; Omondi, B.A.; Millar, I.M.; Krüger, K.; Jooste, A.E.C. Non-destructive DNA extraction from aphids: The application in virus—Vector studies of Banana bunchy top virus (BBTV). Eur. J. Plant Pathol. 2019, 153, 571–582. [Google Scholar] [CrossRef]
- Taekul, C.; Valerio, A.A.; Austin, A.D.; Klompen, H.; Johnson, N.F. Molecular phylogeny of telenomine egg parasitoids (Hymenoptera:Platygastridaes.l.:Telenominae): Evolution of host shifts and implications for classification. Syst. Èntomol. 2014, 39, 24–35. [Google Scholar] [CrossRef] [Green Version]
- Yaakop, S.; van Achterberg, C.; Idris, A.B.; Aman, A.Z. Freezing method as a new non-destructive modification of DNA extraction. Pertanika J. Trop. Agric. Aci. 2013, 36, 373–392. [Google Scholar]
- Aoyama, H.; Saitoh, S.; Fujii, S.; Nagahama, H.; Shinzato, N.; Kaneko, N.; Nakamori, T. A rapid method of non-destructive DNA extraction from individual springtails (Collembola). Appl. Èntomol. Zool. 2015, 50, 419–425. [Google Scholar] [CrossRef]
- Ahaniazad, M.; Bagheri, M.; Roumi, V.; Akrami, M.A. An efficient and non-destructive DNA extraction method for oribatid mites. Arch. Phytopathol. Plant Prot. 2018, 51, 187–196. [Google Scholar] [CrossRef]
- Hunter, S.J.; Goodall, T.I.; Walsh, K.A.; Owen, R.; Day, J.C. Nondestructive DNA extraction from blackflies (Diptera: Simuliidae): Retaining voucher specimens for DNA barcoding projects. Mol. Ecol. Resour. 2008, 8, 56–61. [Google Scholar] [CrossRef] [PubMed]
- Stamper, T.; Wong, E.S.; Timm, A.; DeBry, R.W. Validating sonication as a DNA extraction method for use with carrion flies. Forensic Sci. Int. 2017, 275, 171–177. [Google Scholar] [CrossRef]
- Wigglesworth, V.B. Transpiration Through the Cuticle of Insects. J. Exp. Biol. 1945, 21, 97–114. [Google Scholar] [CrossRef]
- Kouřimská, L.; Adámková, A. Nutritional and sensory quality of edible insects. NFS J. 2016, 4, 22–26. [Google Scholar] [CrossRef] [Green Version]
- He, J.; Yavuz, B.; Kluge, J.A.; Li, A.B.; Omenetto, F.G.; Kaplan, D.L. Stabilization of RNA Encapsulated in Silk. ACS Biomater. Sci. Eng. 2018, 4, 1708–1715. [Google Scholar] [CrossRef]
- Toft, S. Aspects of the ground-living spider fauna of two barley fields in Denmark: Species richness and phenological synchronization. Entomol. Medd. 1989, 32, 151–200. [Google Scholar]
- Mizushina, Y.; Miyazaki, S.; Ohta, K.; Hirota, M.; Sakaguchi, K. Novel anti-inflammatory compounds from Myrsine seguinii, terpeno-benzoic acids, are inhibitors of mammalian DNA polymerases. Biochim. et Biophys. Acta (BBA)—Gen. Subj. 2000, 1475, 1–4. [Google Scholar] [CrossRef]


| Thermal Cycler Step | repliQa MM | UCP & AllIn MM | Phusion & MyFi MM | No of Cycles | Go To |
|---|---|---|---|---|---|
| Initial Denaturation | 98 °C (1 min) | 95 °C (3 min) | 98 °C (3 min) | 1 | |
| Denaturation | 98 °C (10 s) | 95 °C (30 s) | 98 °C (30 s) | 5 | |
| Annealing | 45 °C (5 s) | 45 °C (30 s) | 45 °C (30 s) | Step 2 | |
| Elongation | 68 °C (2 s) | 72 °C (1 min) | 72 °C (1 min) | ||
| Denaturation | 98° C (10 s) | 95° C (30 s) | 98° C (30 s) | 35 | |
| Annealing | 51 °C (5 s) | 51 °C (1 min) | 51 °C (1 min) | Step 5 | |
| Elongation | 68 °C (2 s) | 72 °C (1 min) | 72 °C (1 min) | ||
| Extension | - | 72 °C (10 min) | 72 °C (10 min) | 1 |
Publisher’s Note: MDPI stays neutral with regard to jurisdictional claims in published maps and institutional affiliations. |
© 2022 by the authors. Licensee MDPI, Basel, Switzerland. This article is an open access article distributed under the terms and conditions of the Creative Commons Attribution (CC BY) license (https://creativecommons.org/licenses/by/4.0/).
Share and Cite
Stein, F.; Wagner, S.; Bräsicke, N.; Gailing, O.; Moura, C.C.M.; Götz, M. A Non-Destructive High-Speed Procedure to Obtain DNA Barcodes from Soft-Bodied Insect Samples with a Focus on the Dipteran Section of Schizophora. Insects 2022, 13, 679. https://doi.org/10.3390/insects13080679
Stein F, Wagner S, Bräsicke N, Gailing O, Moura CCM, Götz M. A Non-Destructive High-Speed Procedure to Obtain DNA Barcodes from Soft-Bodied Insect Samples with a Focus on the Dipteran Section of Schizophora. Insects. 2022; 13(8):679. https://doi.org/10.3390/insects13080679
Chicago/Turabian StyleStein, Frederik, Stefan Wagner, Nadine Bräsicke, Oliver Gailing, Carina C. M. Moura, and Monika Götz. 2022. "A Non-Destructive High-Speed Procedure to Obtain DNA Barcodes from Soft-Bodied Insect Samples with a Focus on the Dipteran Section of Schizophora" Insects 13, no. 8: 679. https://doi.org/10.3390/insects13080679
APA StyleStein, F., Wagner, S., Bräsicke, N., Gailing, O., Moura, C. C. M., & Götz, M. (2022). A Non-Destructive High-Speed Procedure to Obtain DNA Barcodes from Soft-Bodied Insect Samples with a Focus on the Dipteran Section of Schizophora. Insects, 13(8), 679. https://doi.org/10.3390/insects13080679