
Honey Bee Health in Maine Wild Blueberry Production


Abstract
Simple Summary
Abstract
1. Introduction
Objectives
2. Materials and Methods
2.1. Study Site and Colony Health Measures
(colony strength at time t) × 100
2.2. Pesticide Residues
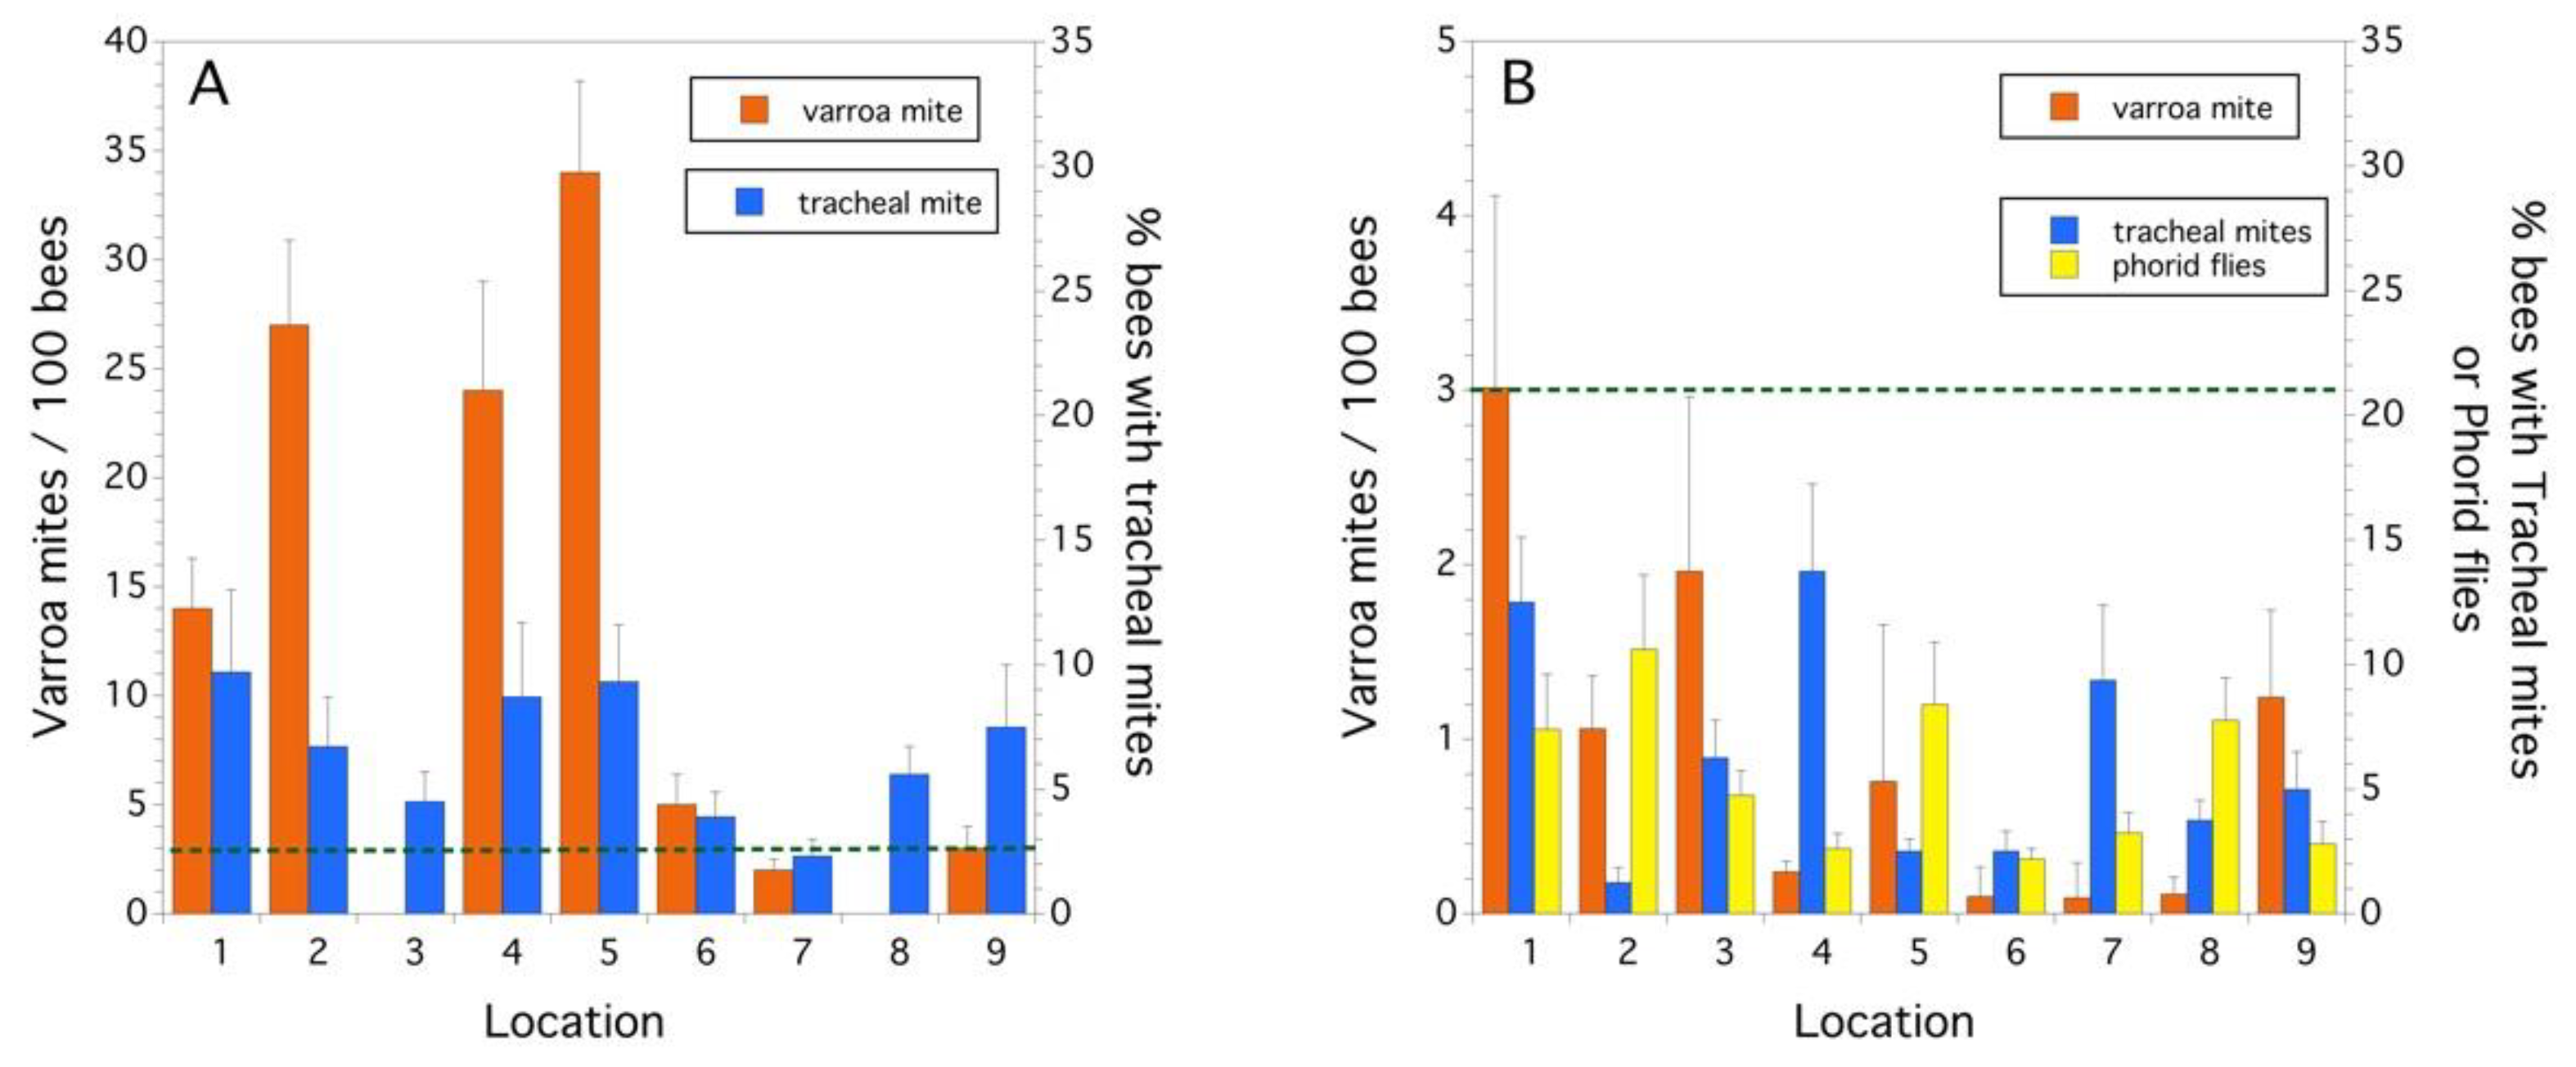
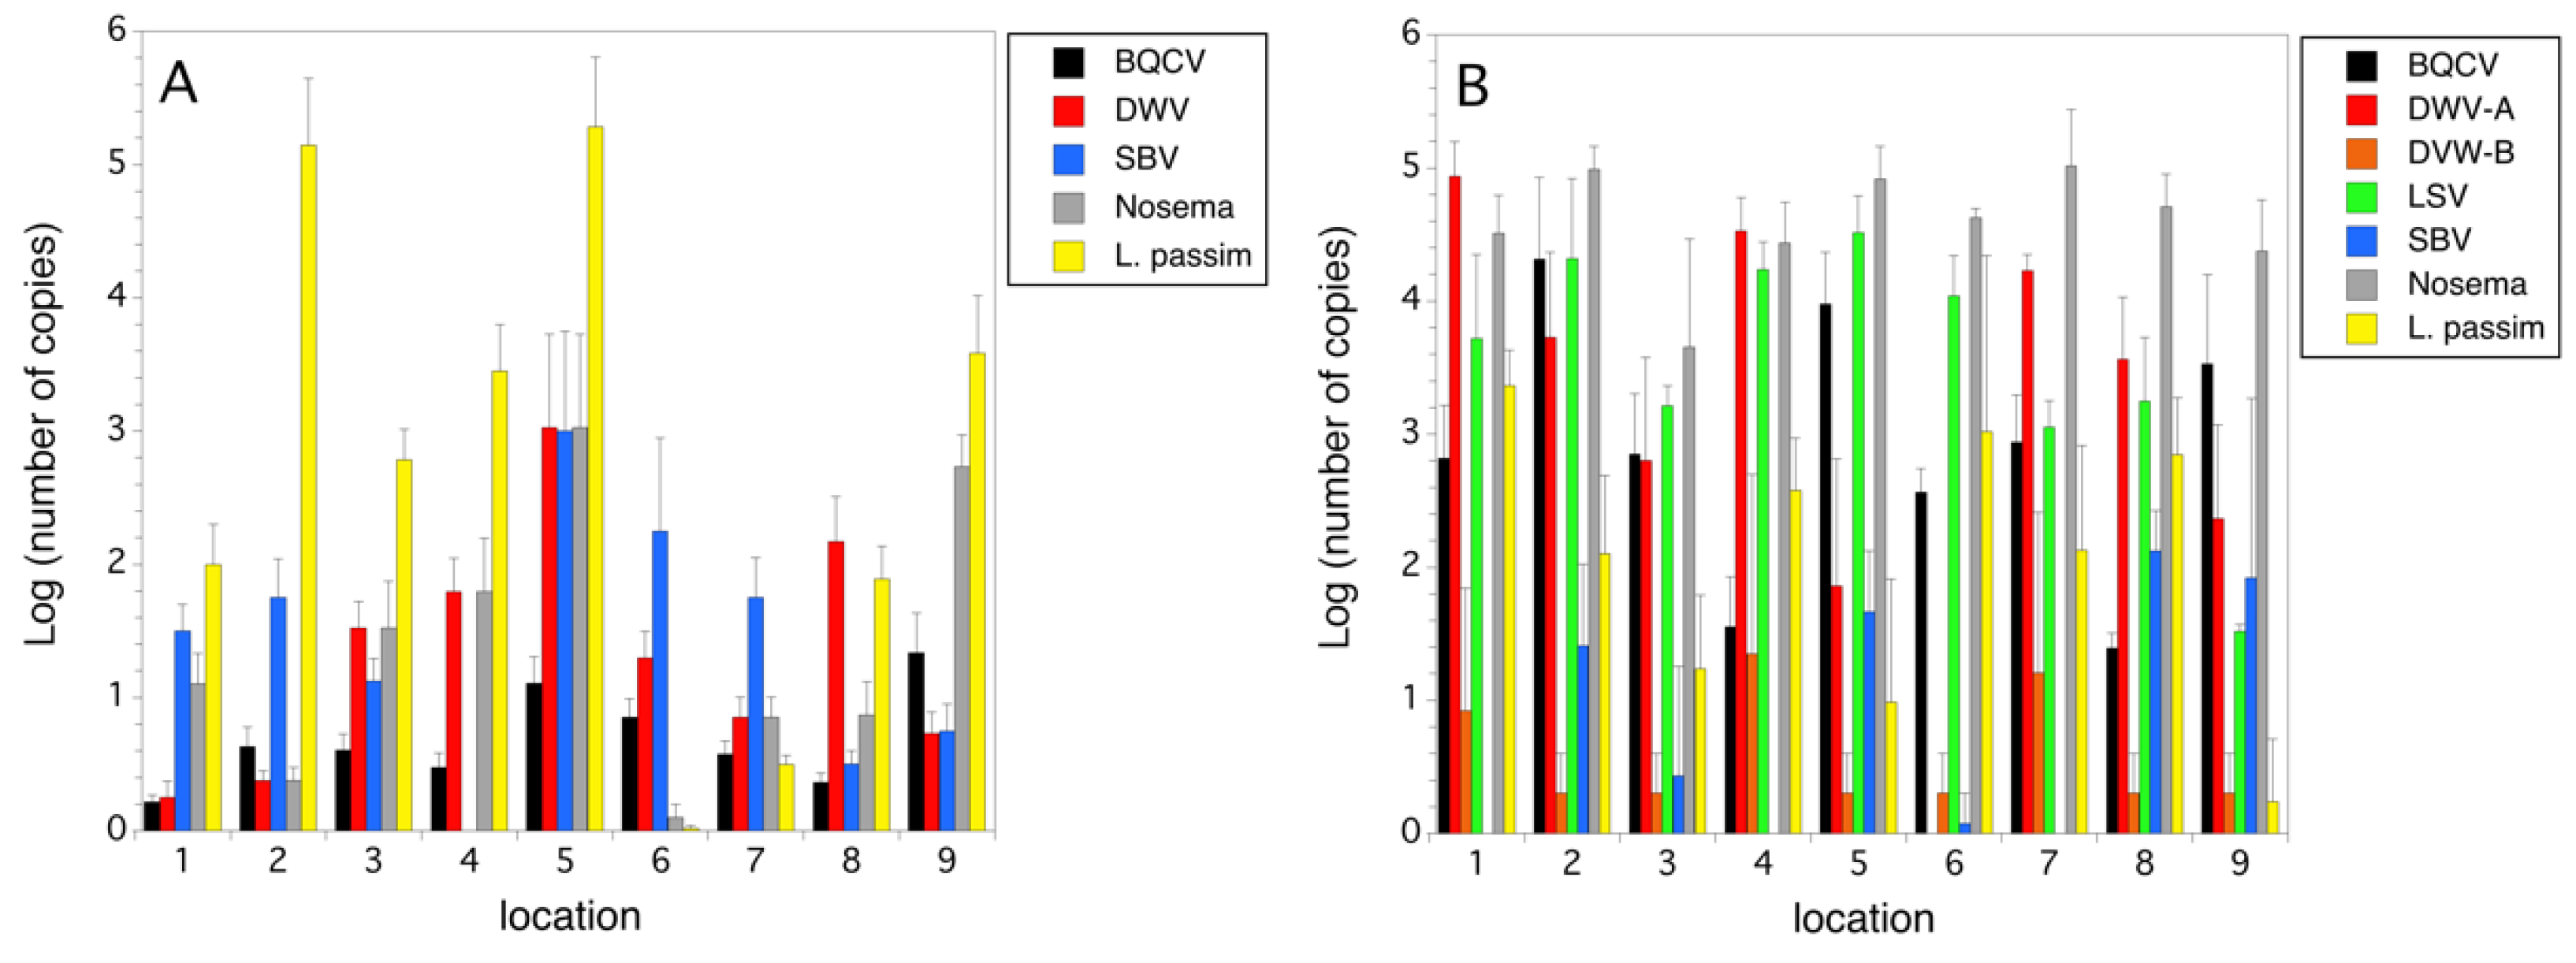
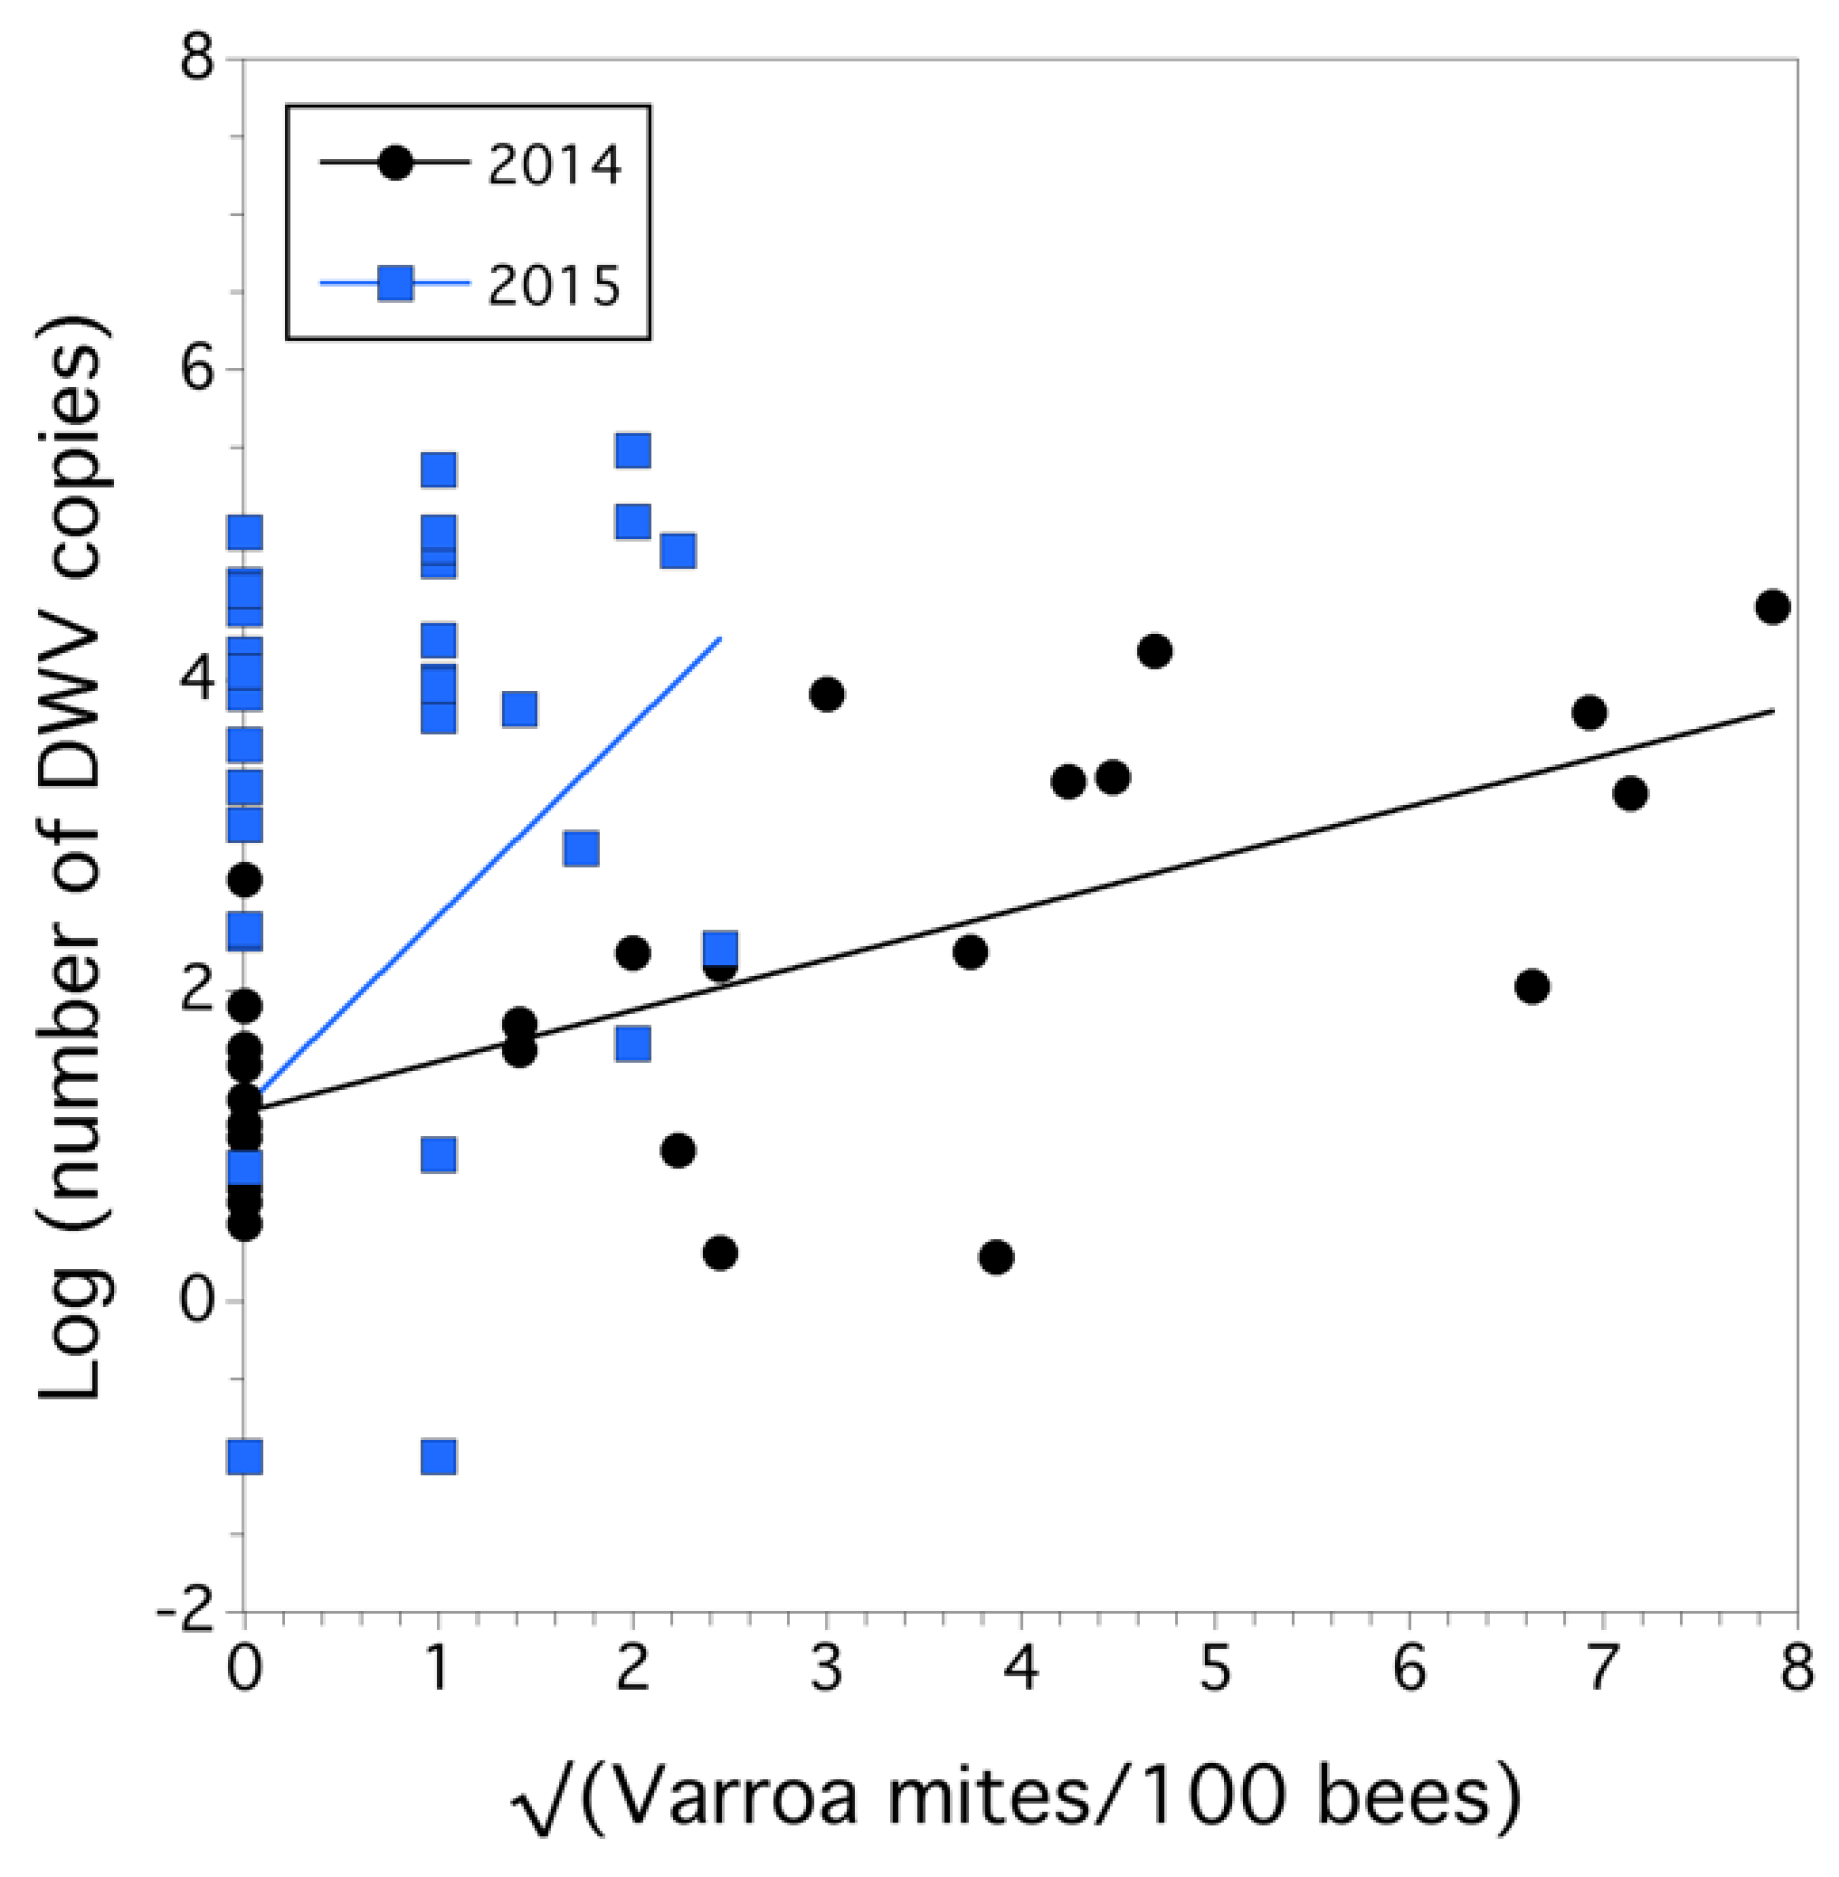
2.3. Parasites and Pathogens
2.4. Statistical Analysis
3. Results
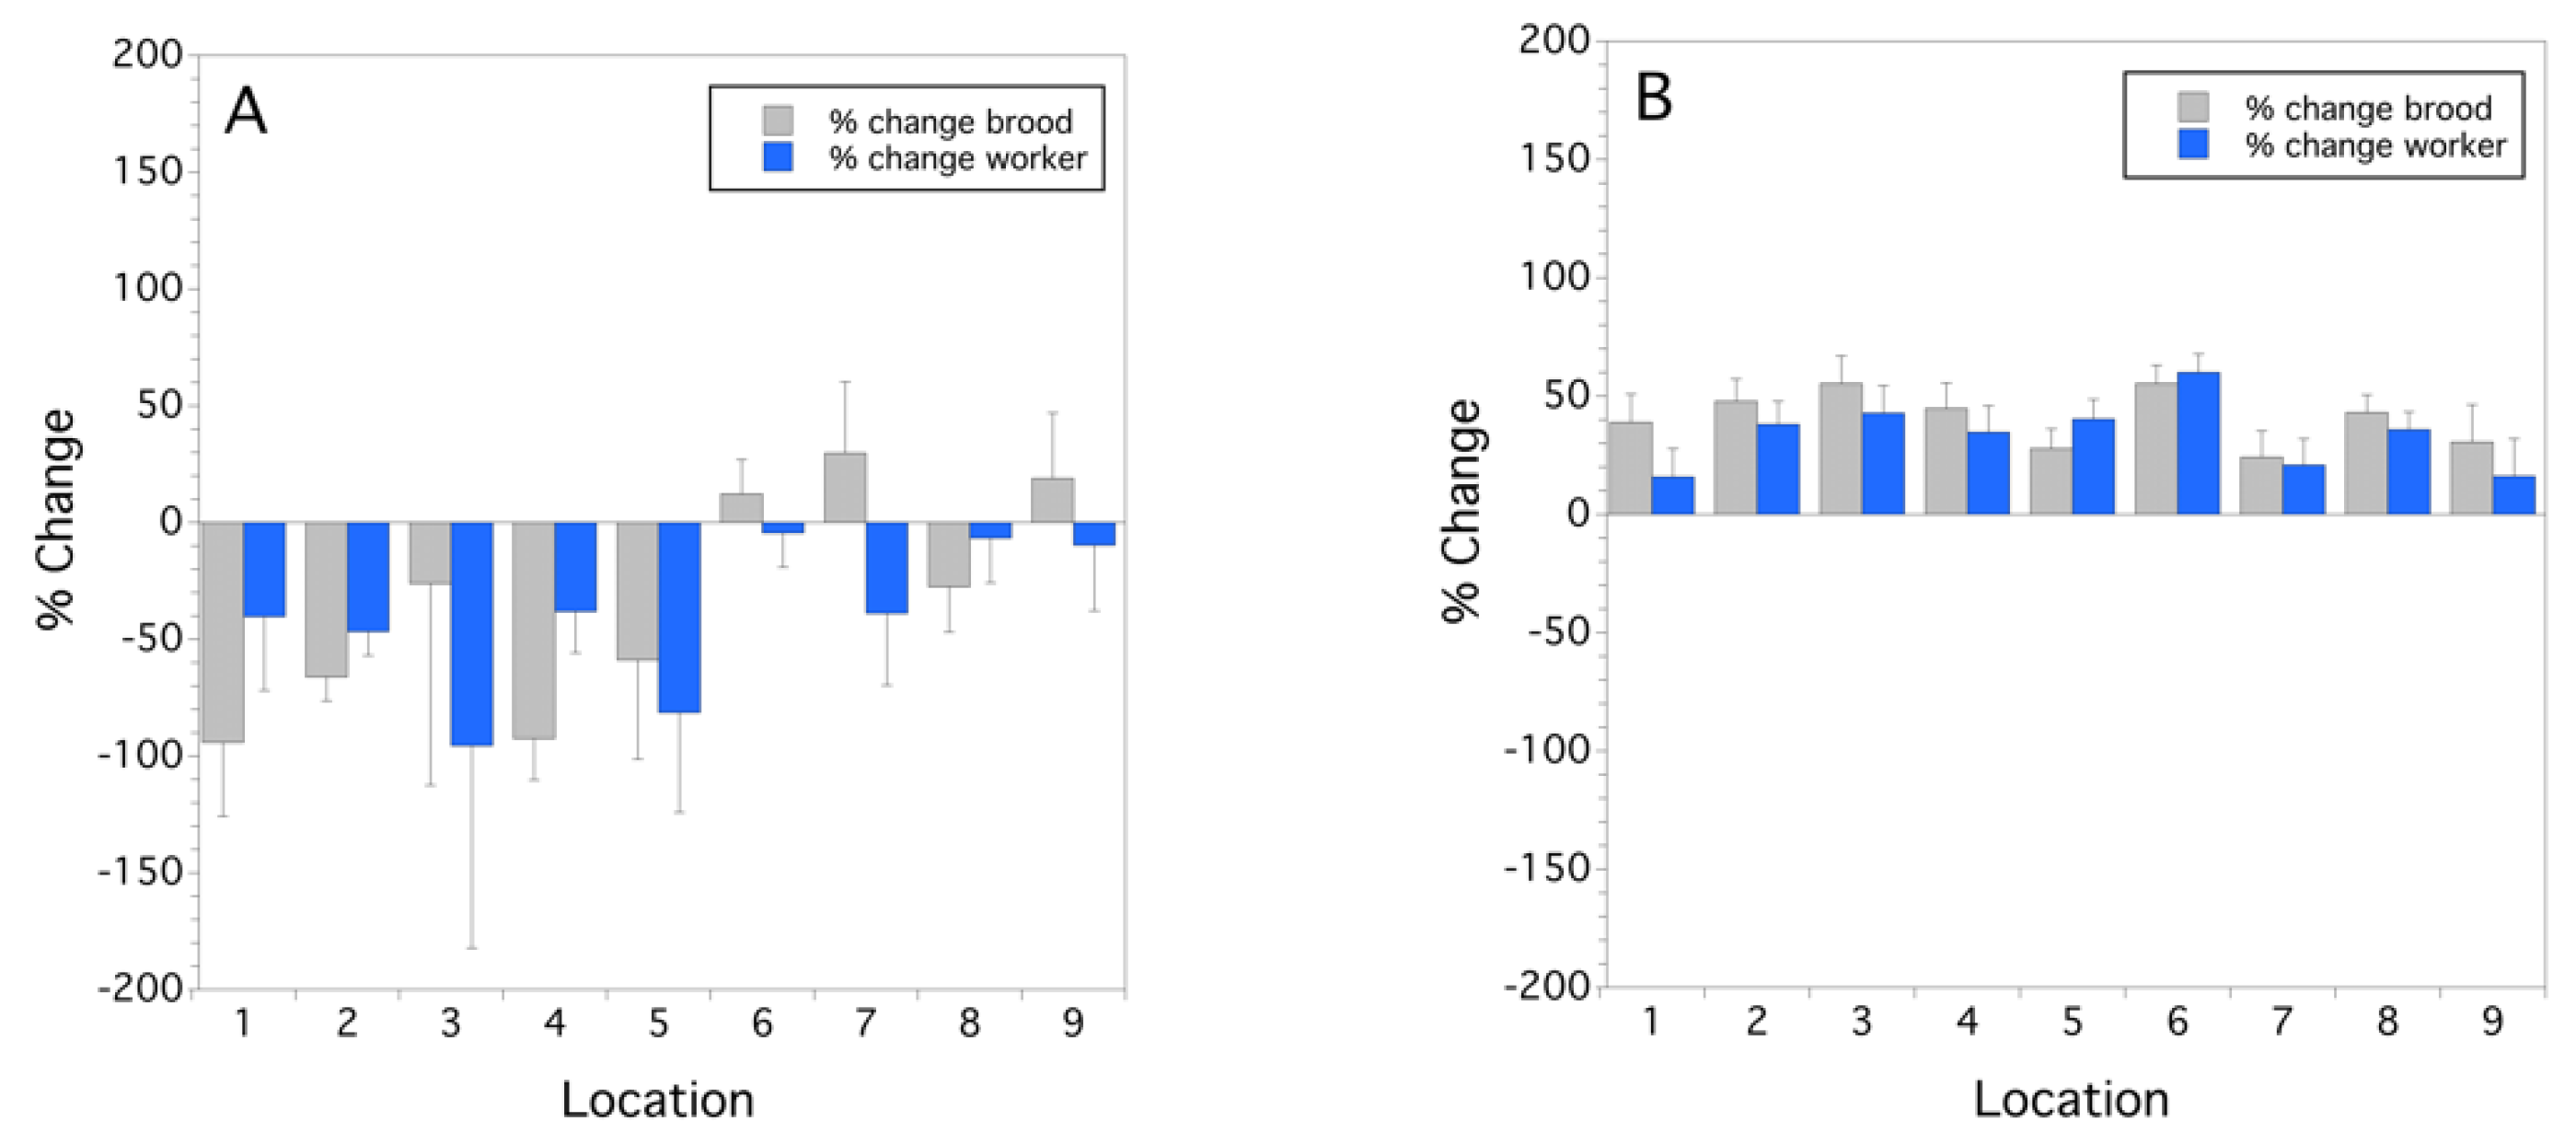
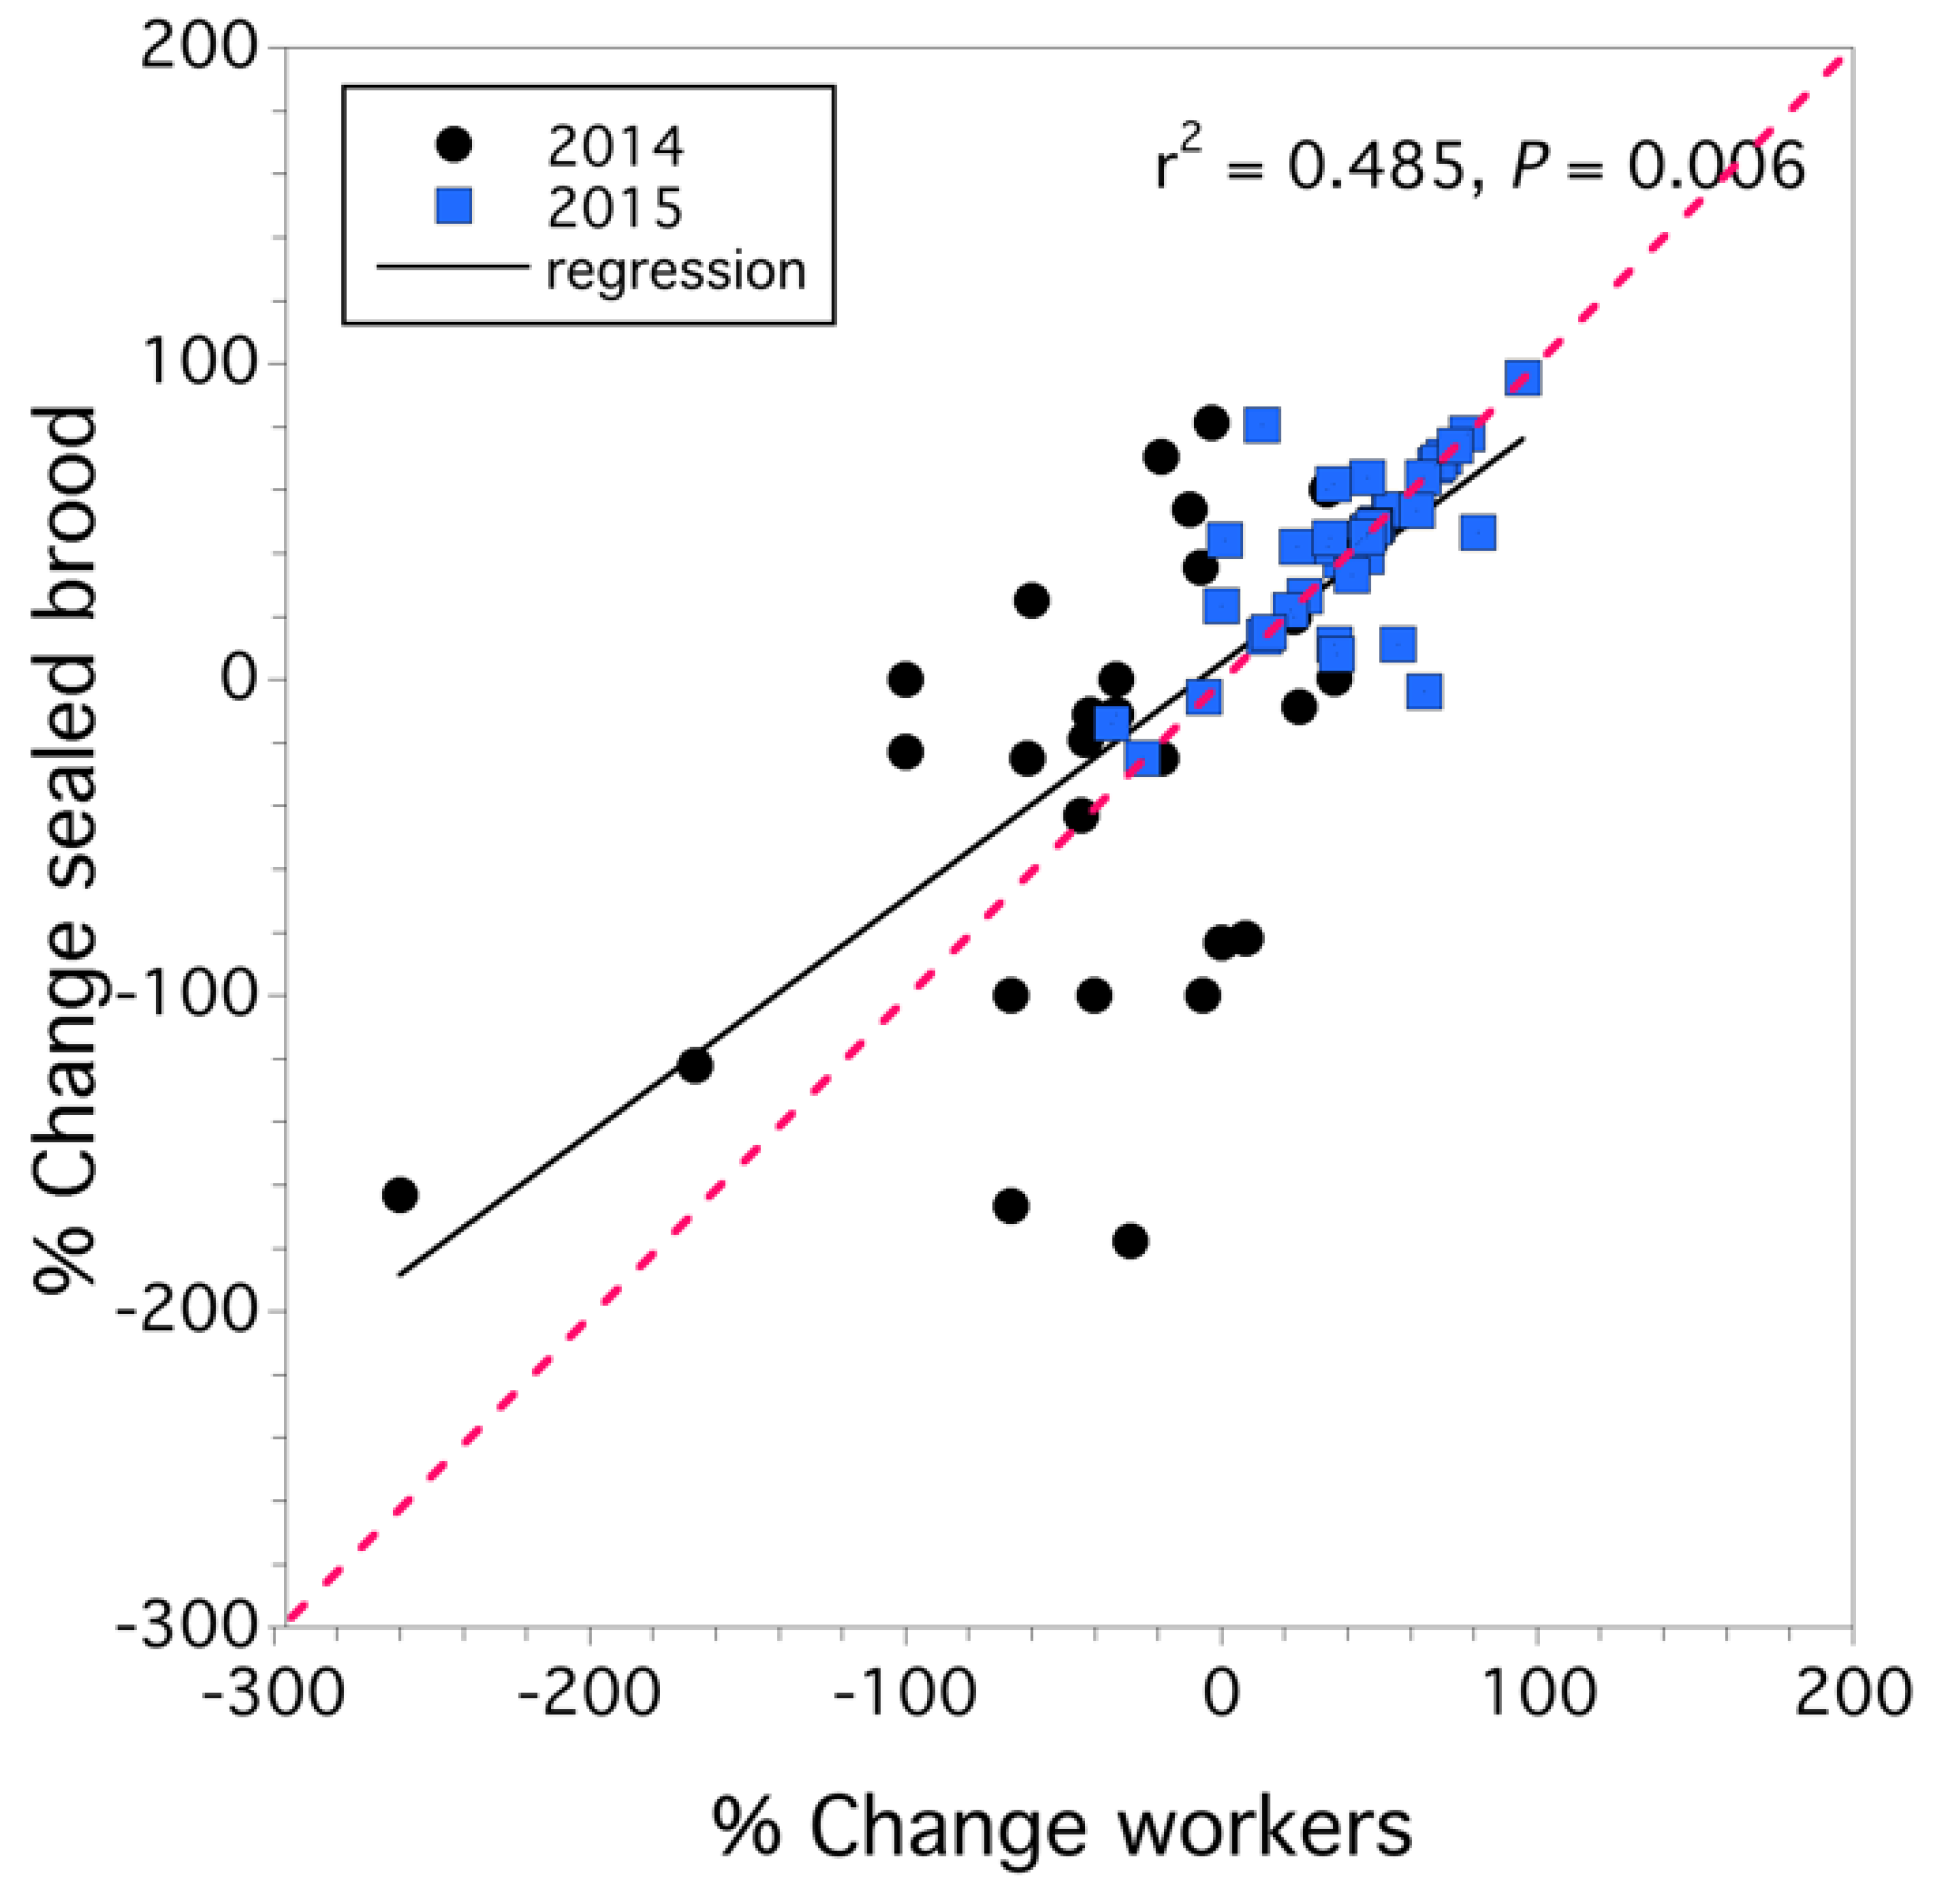
3.1. Colony Health
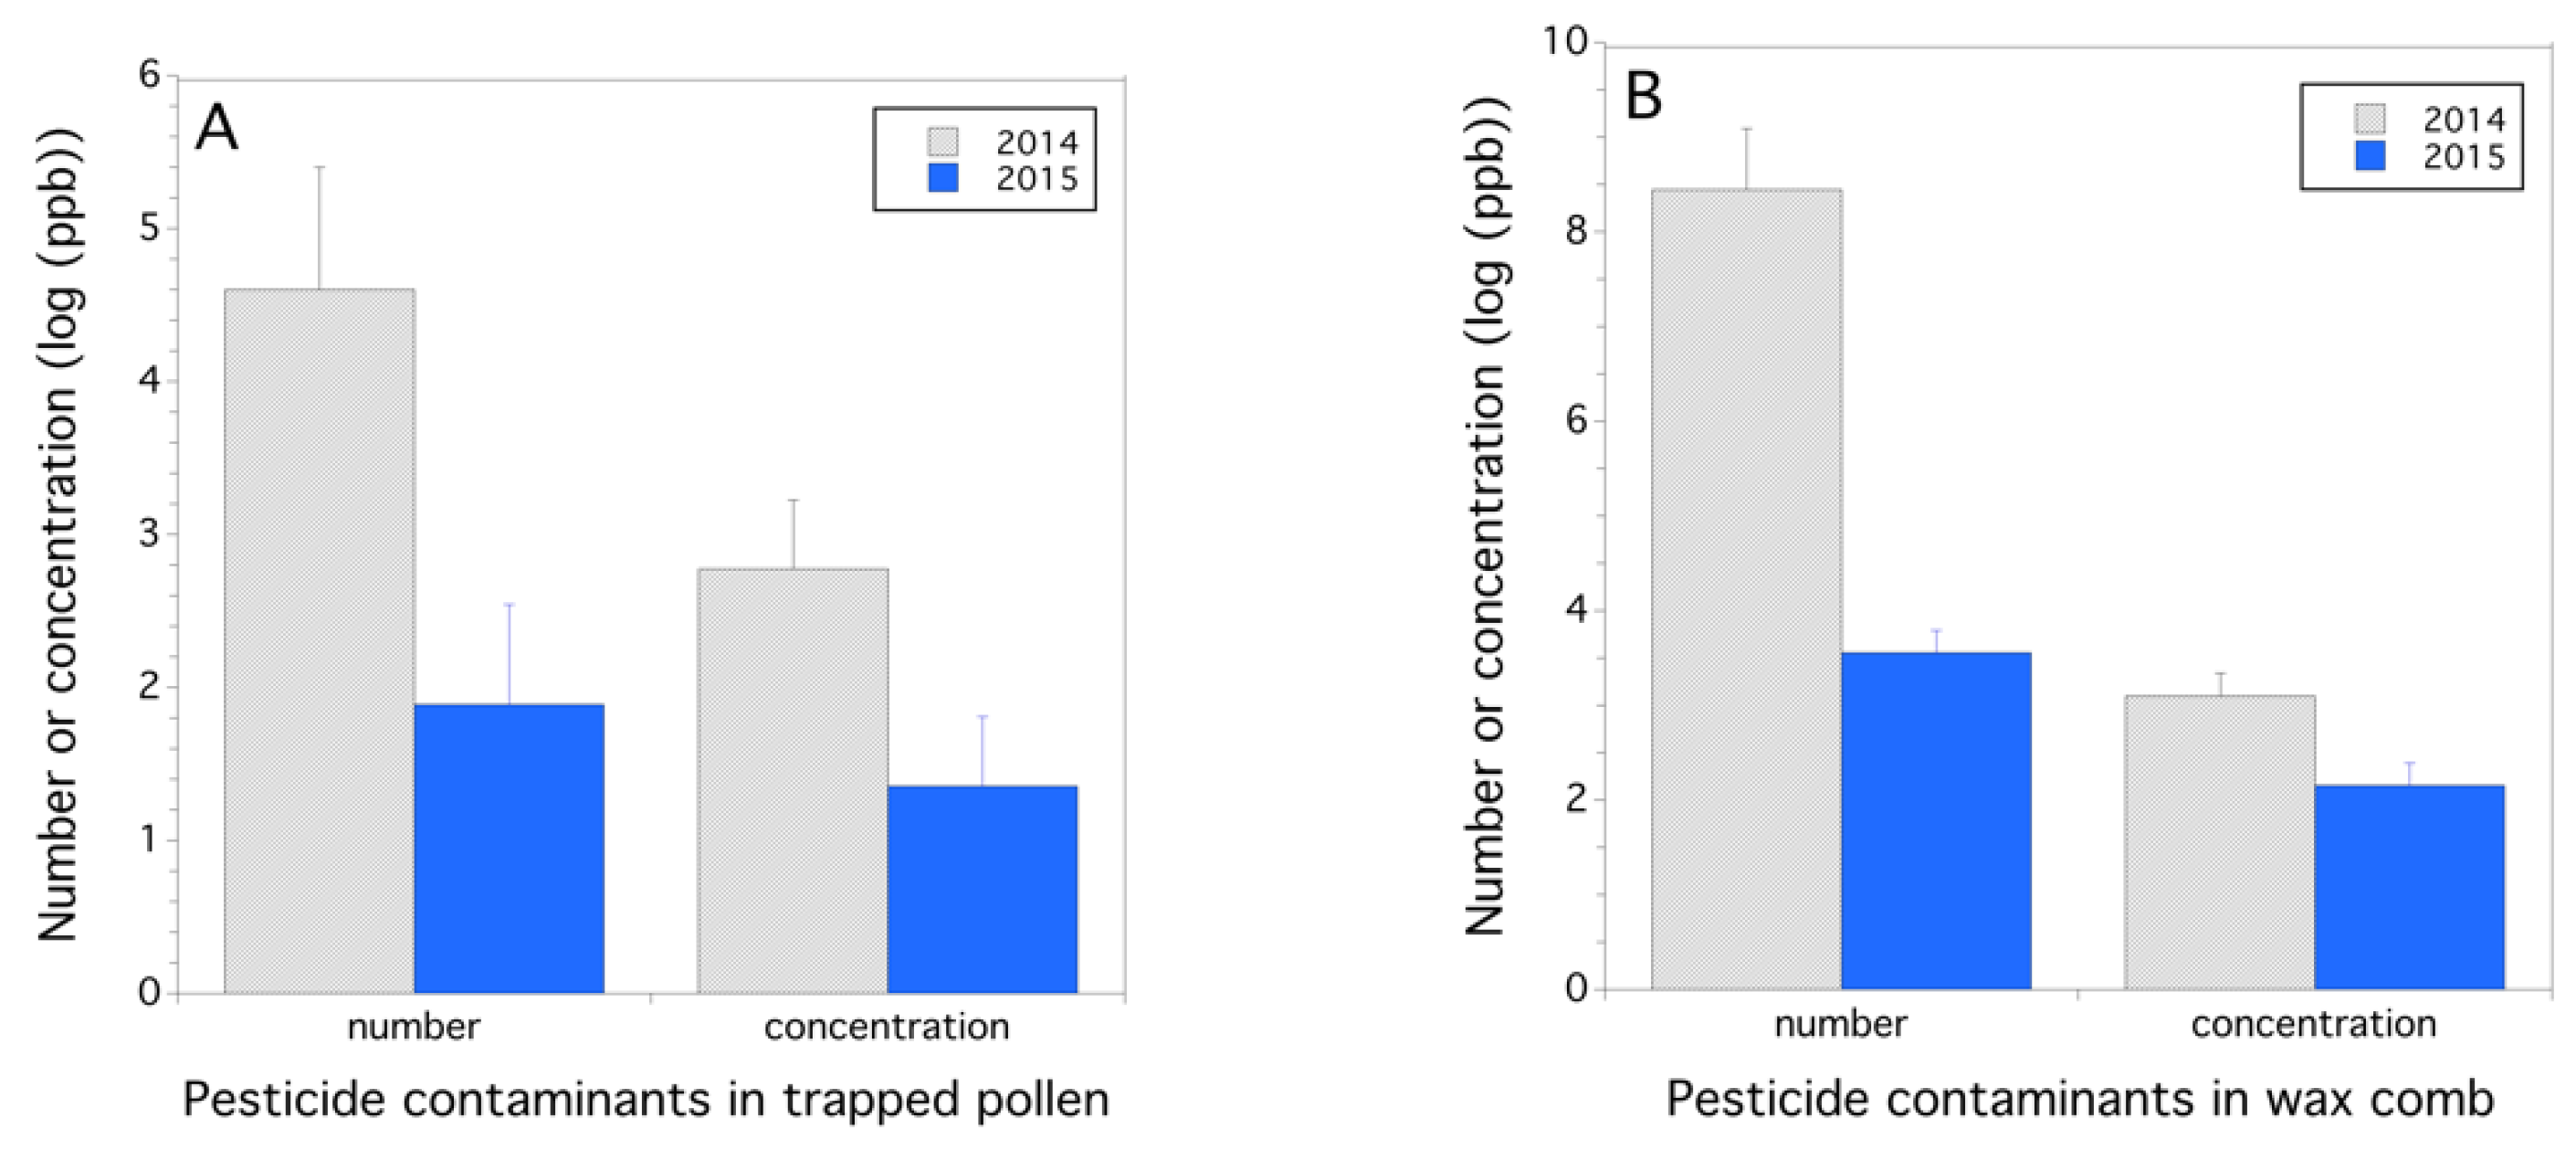
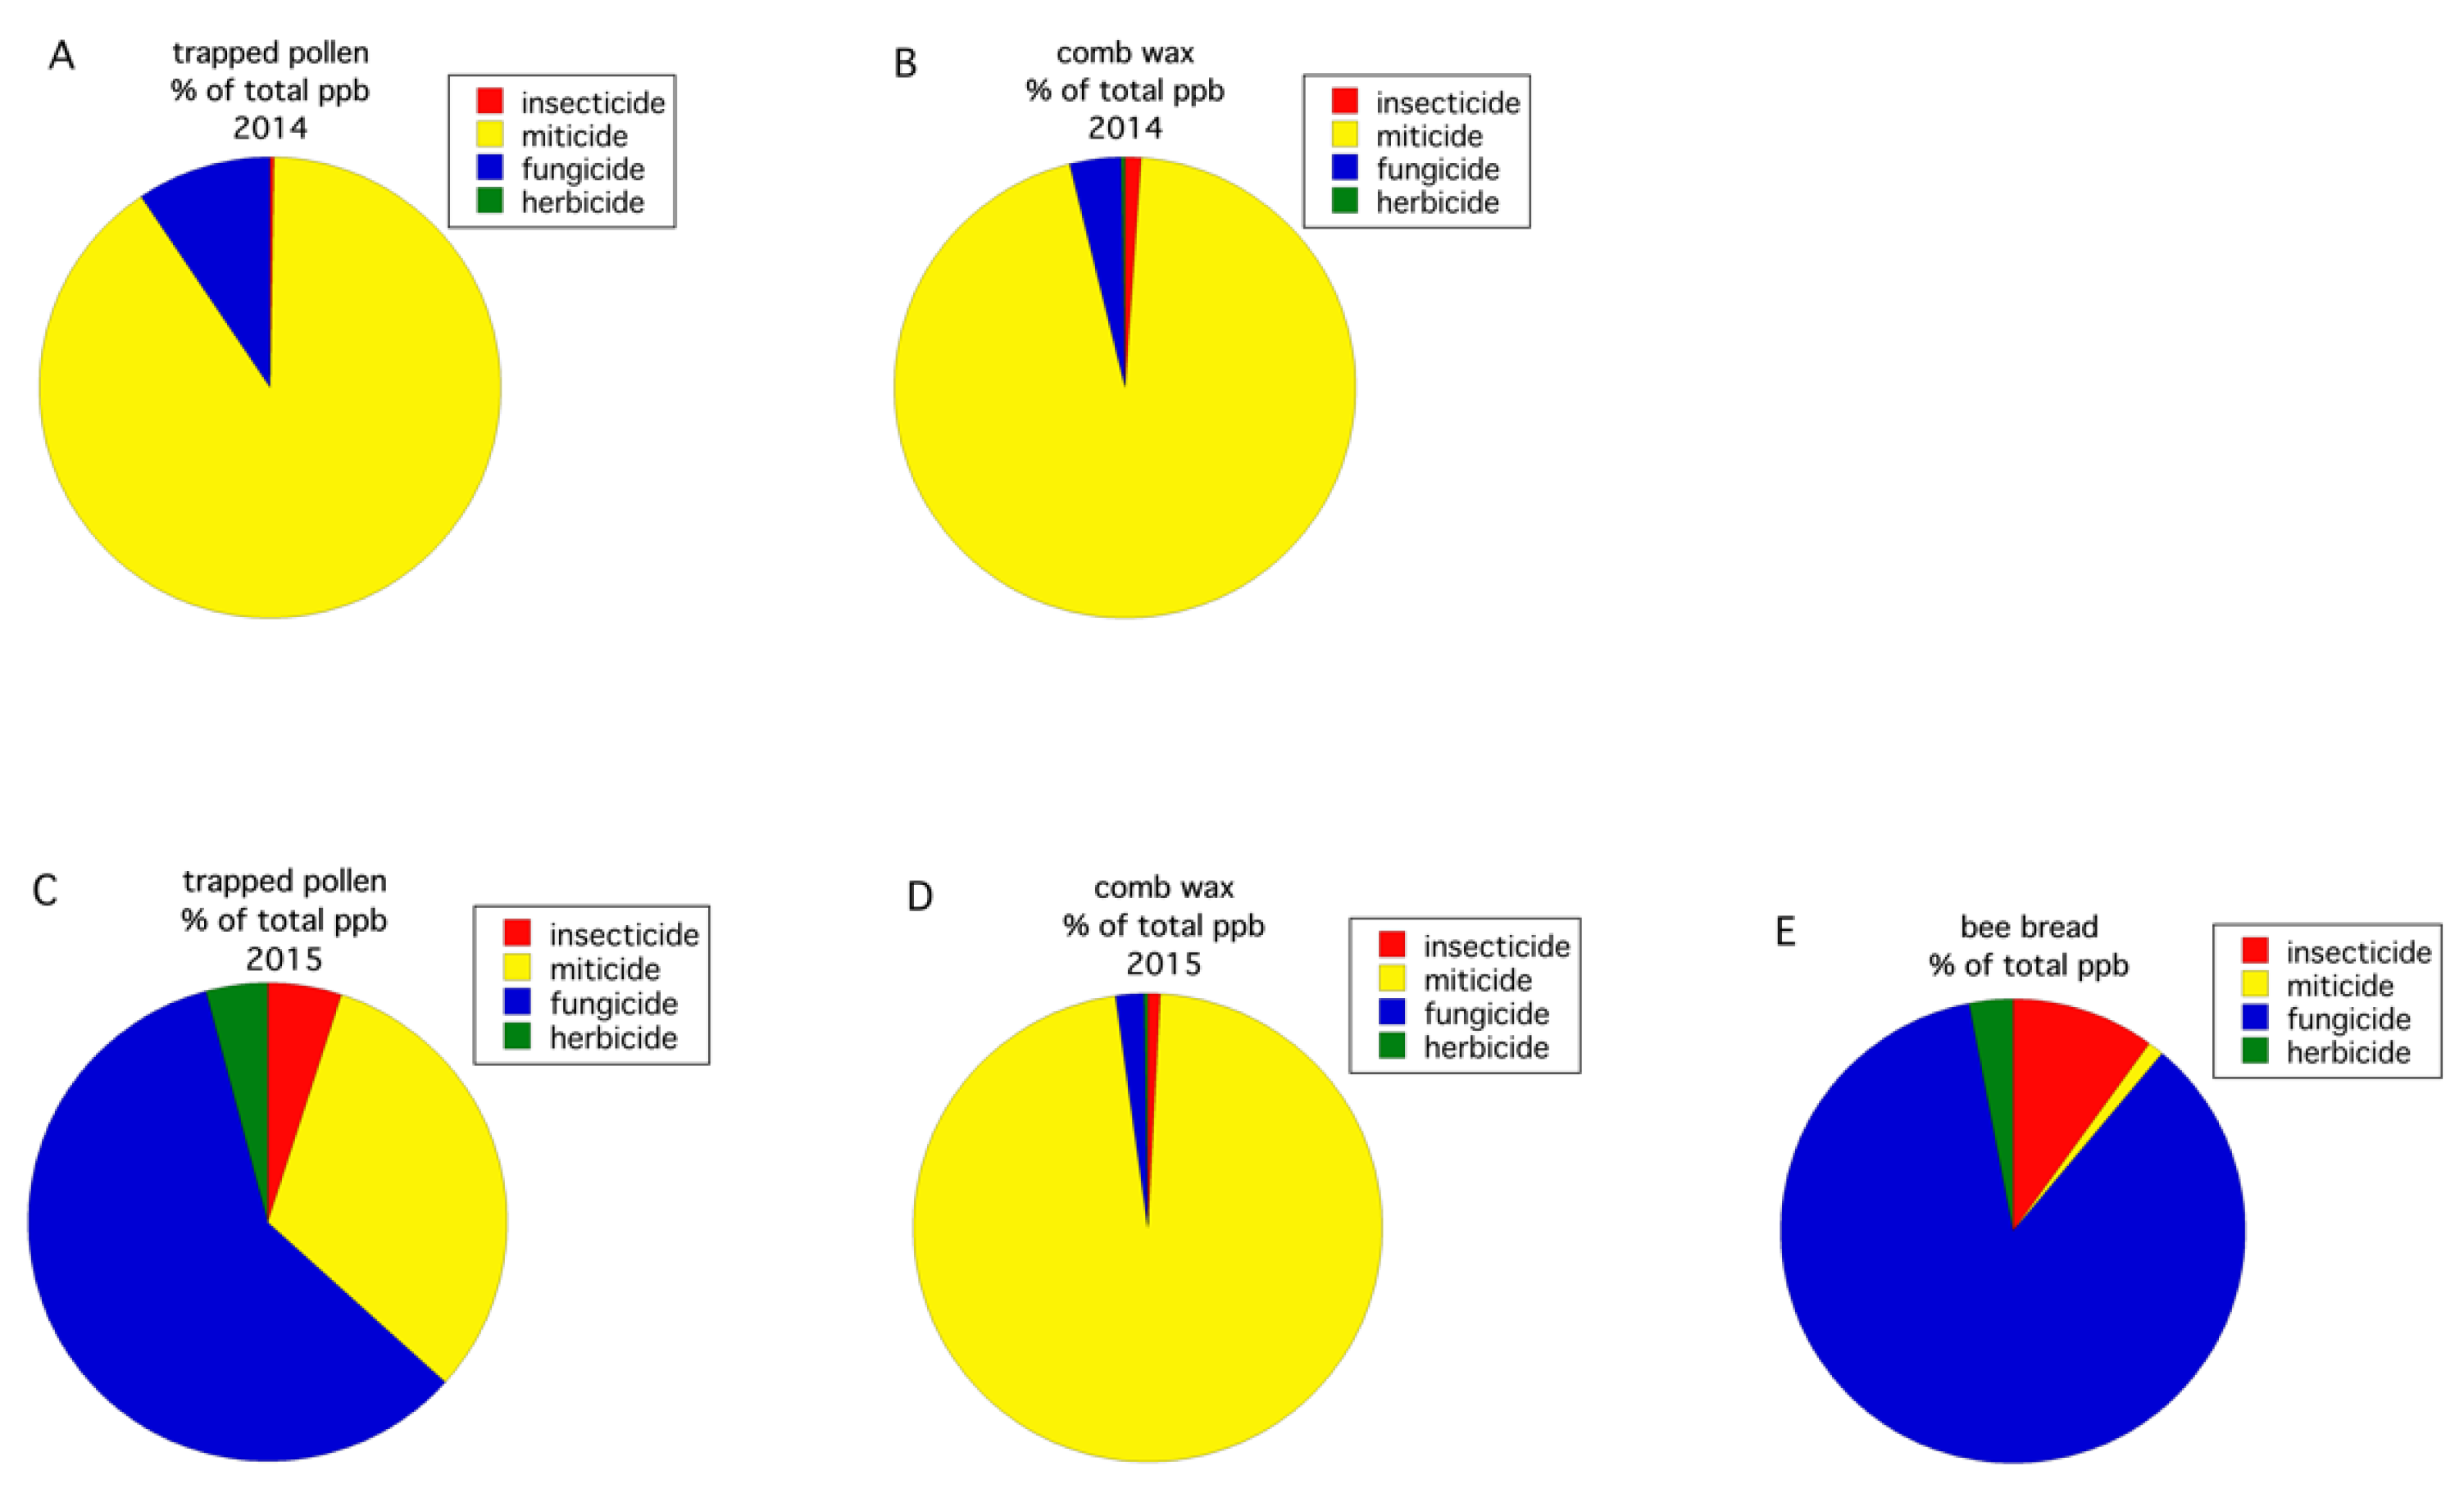
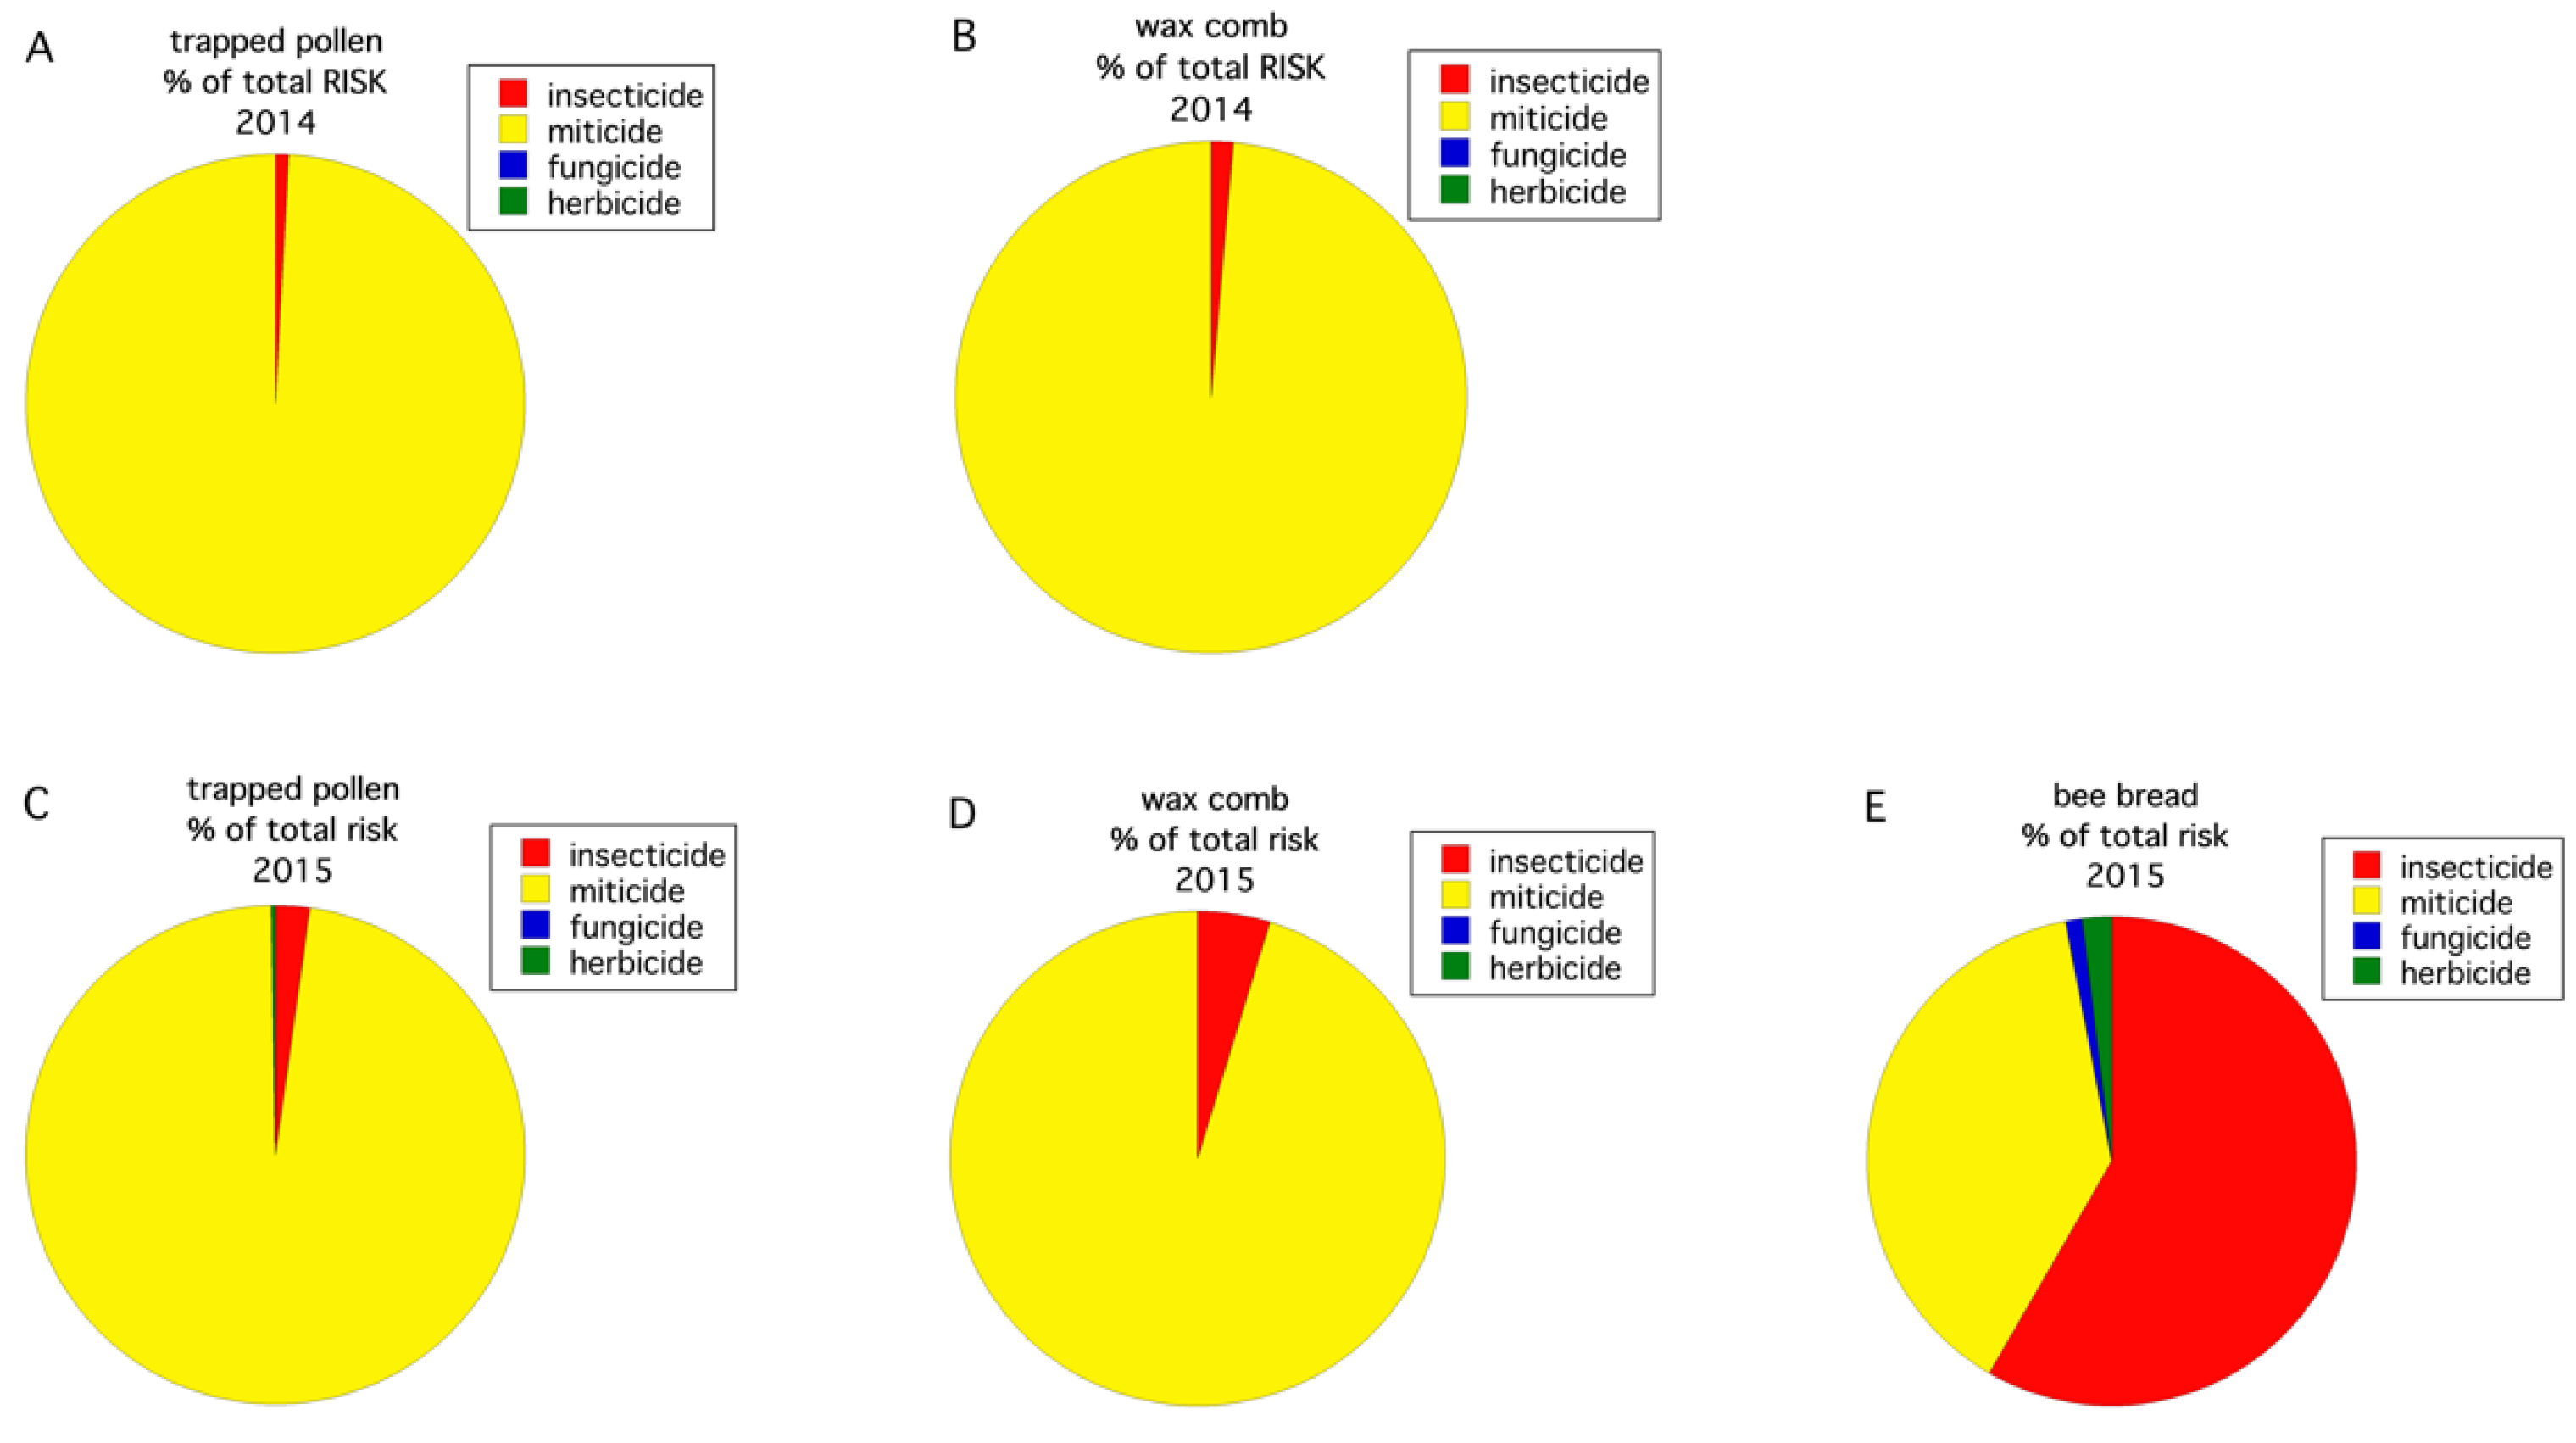
3.2. Pesticides
4. Discussion
5. Conclusions
Author Contributions
Funding
Data Availability Statement
Acknowledgments
Conflicts of Interest
References
- Yarborough, D.E. Wild Blueberry Culture in Maine. In Wild Blueberry Factsheet; No. 220, Bulletin No. 2088; University of Maine Cooperative Extension, University of Maine: Orono, ME, USA, 2009; Available online: https://extension.umaine.edu/blueberries/factsheets/production/wildblueberryculture-inmaine/ (accessed on 6 March 2021).
- Jones, M.S.; Vanhanen, H.; Peltola, R.; Drummond, F.A. A global review of arthropod-mediated ecosystem-services in Vaccinium berry agroecosystems. Terr. Arthropod Rev. 2014, 7, 41–78. [Google Scholar] [CrossRef]
- Strik, B.C.; Yarborough, D.E. Blueberry production trends in North America, 1992 to 2003, and predictions for growth. HortTechnology 2005, 15, 391–398. [Google Scholar] [CrossRef]
- Eaton, L.J.; Murray, J.E. Relationships of pollinator numbers in blueberry fields to fruit development and yields. Acta Hortic. 1996, 446, 181–188. [Google Scholar] [CrossRef]
- Asare, E.; Hoshide, A.K.; Drummond, F.A.; Chen, X.; Criner, G.K. Economic risk of bee pollination in Maine wild blueberry, Vaccinium angustifolium Aiton. J. Econ. Entomol. 2017, 110, 1980–1992. [Google Scholar] [CrossRef]
- Yarborough, D.; Drummond, F.A.; Annis, S.; D’Appollonio, J. Maine Wild blueberry systems analysis. Acta Hortic. 2017, 1180, 151–160. [Google Scholar] [CrossRef]
- Bushmann, S.L.; Drummond, F.A. Abundance and diversity of wild bees (Hymenoptera: Apoidea) found in lowbush blueberry growing regions of Downeast Maine. Environ. Entomol. 2015, 43, 1–15. [Google Scholar] [CrossRef]
- Javorek, S.K.; Mackenzie, K.E.; Vander Kloet, S.P. Comparative pollination effectiveness among bees (Hymenoptera: Apoidea) on lowbush blueberry (Ericaceae: Vaccinium angustifolium). Ann. Entomol. Soc. Am. 2002, 95, 345–351. [Google Scholar] [CrossRef]
- Drummond, F.A. Behavior of bees associated with the wild blueberry agro-ecosystem in the USA. Int. J. Entomol. Nematol. 2016, 2, 27–41. [Google Scholar]
- Qu, H.; Drummond, F.A. Simulation-based modeling of wild blueberry pollination. Electron. Comp. Agric. 2018, 144, 94–101. [Google Scholar] [CrossRef]
- Stubbs, C.S.; Drummond, F.A. Bombus impatiens (Hymenoptera: Apidae): An alternative to Apis mellifera (Hymenoptera: Apidae) for lowbush blueberry production. J. Econ. Entomol. 2001, 94, 609–616. [Google Scholar] [CrossRef] [PubMed]
- Drummond, F.A. Commercial bumble bee pollination of lowbush blueberry. Int. J. Fruit Sci. 2012, 12, 54–64. [Google Scholar] [CrossRef]
- Drummond, F.A. Honeybees and Blueberry Pollination. In Cooperative Extension: Maine Wild Blueberry Fact Sheet; University of Maine Cooperative Extension, University of Maine: Orono, ME, USA, 2002; Volume 629, Available online: http://umaine.edu/blueberries/factsheets/bees/629-honey-bees-and-blueberry-pollination/ (accessed on 3 March 2021).
- Stubbs, C.S.; Drummond, F.A. Pollination of wild lowbush blueberry, Vaccinium angustifolium by the alfalfa leafcutting bee, Megachile rotundata. Acta Hortic. 1997, 446, 189–196. [Google Scholar] [CrossRef]
- Drummond, F.A.; Dibble, A.C.; Stubbs, C.; Bushmann, S.; Ascher, J.; Ryan, J. A natural history of change in native bees associated with lowbush blueberry in Maine. Northeast. Nat. 2017, 24, 49–68. [Google Scholar] [CrossRef]
- Girard, M.; Chagnon, M.; Fournier, V. Pollen diversity collected by honey bees in the vicinity of Vaccinium spp. crops and its importance for colony development. Botany 2012, 90, 545–555. [Google Scholar] [CrossRef]
- Koch, H.; Brown, M.J.; Stevenson, P.C. The role of disease in bee foraging ecology. Curr. Opin. Insect Sci. 2017, 21, 60–67. [Google Scholar] [CrossRef] [PubMed]
- Branchiccela, B.; Castelli, L.; Corona, M.; Díaz-Cetti, S.; Invernizzi, C.; de la Escalera, G.M.; Mendoza, Y.; Santos, E.; Silva, C.; Zunino, P.; et al. Impact of nutritional stress on the honeybee colony health. Sci. Rep. 2019, 9, 1–11. [Google Scholar] [CrossRef]
- Chauzat, M.P.; Carpentier, P.; Martel, A.C.; Bougeard, S.; Cougoule, N.; Porta, P.; Lachaize, J.; Madec, F.; Aubert, M.; Faucon, J.P. Influence of pesticide residues on honey bee (Hymenoptera: Apidae) colony health in France. Environ. Entomol. 2009, 38, 514–523. [Google Scholar] [CrossRef]
- Amiri, E.; Strand, M.K.; Rueppell, O.; Tarpy, D.R. Queen quality and the impact of honey bee diseases on queen health: Potential for interactions between two major threats to colony health. Insects 2017, 8, 48. [Google Scholar] [CrossRef]
- Jacques, A.; Laurent, M.; Epilobee Consortium; Ribière-Chabert, M.; Saussac, M.; Bougeard, S.; Budge, G.E.; Hendrikx, P.; Chauzat, M.P. A pan-European epidemiological study reveals honey bee colony survival depends on beekeeper education and disease control. PLoS ONE 2017, 12, e0172591. [Google Scholar]
- Rangel, J.; Fisher, A. Factors affecting the reproductive health of honey bee (Apis mellifera) drones—A review. Apidologie 2019, 50, 759–778. [Google Scholar] [CrossRef]
- Chauzat, M.P.; Jacques, A.; Laurent, M.; Bougeard, S.; Hendrikx, P.; Ribiere-Chabert, M. Risk indicators affecting honeybee colony survival in Europe: One year of surveillance. Apidologie 2016, 47, 348–378. [Google Scholar] [CrossRef]
- Evans, J.D.; Saegerman, C.; Mullin, C.; Haubruge, E.; Nguyen, B.K.; Frazier, M.; Frazier, J.; Cox-Foster, D.; Chen, Y.; Underwood, R.; et al. Colony collapse disorder: A descriptive study. PLoS ONE 2009, 4, e6481. [Google Scholar]
- Dainat, B.; Vanengelsdorp, D.; Neumann, P. Colony collapse disorder in Europe. Environ. Microbiol. Rep. 2012, 4, 123–125. [Google Scholar] [CrossRef]
- Delaplane, K.S.; van der Steen, J.; Guzman-Novoa, E. Standard methods for estimating strength parameters of Apis mellifera colonies. J. Apic. Res. 2013, 52, 1–12. [Google Scholar] [CrossRef]
- Miranda, M.A.; Bicout, D.; Bøtner, A.; Butterworth, A.; Calistri, P.; Depner, K.; Edwards, S.; Garin-Bastuji, B.; Good, M.; Gortazar Schmidt, C.; et al. EFSA Panel on Animal Health and Welfare (AHAW). Assessing the health status of managed honeybee colonies (HEALTHY-B): A toolbox to facilitate harmonised data collection. EFSA J. 2016, 14, e04578. Available online: https://efsa.onlinelibrary.wiley.com/doi/pdf/10.2903/j.efsa.2016.4578 (accessed on 27 March 2021).
- Drummond, F.A.; Ballman, E.S.; Eitzer, B.D.; Du Clos, B.; Dill, J. Exposure of honeybee colonies to pesticides in pollen, a statewide survey in Maine. Environ. Entomol. 2018, 47, 378–387. [Google Scholar] [CrossRef] [PubMed]
- Anastassiades, M.; Lehotay, S.J.; Stajnbaher, D.; Schenck, F.J. Fast and easy multiresidue method employing acetonitrile extraction/partitioning and “dispersive solid-phase extraction” for the determination of pesticide residues in produce. J. AOAC Int. 2003, 86, 412–431. [Google Scholar] [CrossRef] [PubMed]
- Ostiguy, N.; Drummond, F.A.; Aronstein, K.; Eitzer, B.; Ellis, J.D.; Spivak, M.; Shepherd, W.S. Pesticide exposure to honey bees in a four-year nationwide study. Insects 2019, 10, 13. [Google Scholar] [CrossRef]
- Stoner, K.A.; Eitzer, B.D. Using a hazard quotient to evaluate pesticide residues detected in pollen trapped from honey bees (Apis mellifera) in Connecticut. PLoS ONE 2013, 8, e77550. [Google Scholar] [CrossRef] [PubMed]
- Page, R.E.; Metcalf, R.A. A population investment sex ratio for the honey bee (Apis mellifera L.). Am. Nat. 1984, 5, 680–702. [Google Scholar] [CrossRef]
- Iverson, A.; Hale, C.; Richardson, L.; Miller, O.; McArt, S. Synergistic effects of three sterol biosynthesis inhibiting fungicides on the toxicity of a pyrethroid and neonicotinoid insecticide to bumble bees. Apidologie 2019, 50, 733–744. [Google Scholar] [CrossRef]
- Wang, Y.; Zhu, Y.C.; Li, W. Comparative examination on synergistic toxicities of chlorpyrifos, acephate, or tetraconazole mixed with pyrethroid insecticides to honey bees (Apis mellifera L.). Environ. Sci. Pollut. Res. 2020, 27, 6971–6980. [Google Scholar] [CrossRef] [PubMed]
- Hendrickson, R. Field alcohol wash provides a consistent sampling method for determining colony Varroa mite loads. Am. Bee J. 2009, 149, 55–56. [Google Scholar]
- Sammataro, D. An easy dissection technique for finding the tracheal mite, Acarapis woodi (Rennie)(Acari: Tarsonemidae), in honey bees, with video link. Int. J. Acarol. 2006, 32, 339–343. [Google Scholar] [CrossRef]
- Vandesompele, J.; De Preter, K.; Pattyn, F.; Poppe, B.; Van Roy, N.; De Paepe, A.; Speleman, F. Accurate normalization of real-time quantitative RT-PCR data by geometric averaging of multiple internal control genes. Gen. Biol. 2002, 3, 1–12. [Google Scholar] [CrossRef] [PubMed]
- SAS Institute. JMP® Version 14; SAS Institute Inc.: Cary, NC, USA, 2017; pp. 1989–2017. [Google Scholar]
- Giacobino, A.; Cagnolo, N.B.; Merke, J.; Orellano, E.; Bertozzi, E.; Masciangelo, G.; Pietronave, H.; Salto, C.; Signorini, M. Risk factors associated with the presence of Varroa destructor in honey bee colonies from east-central Argentina. Prev. Vet. Med. 2014, 115, 280–287. [Google Scholar] [CrossRef] [PubMed]
- Bell, D.J.; Rowland, L.J.; Smagula, J.; Drummond, F.A. Recent Advances in the Biology and Genetics of Lowbush Blueberry. In Technical Bulletin 203; Maine Agricultural & Forest Experiment Station, University of Maine: Orono, ME, USA, 2009; p. 36. [Google Scholar]
- Bushmann, S.L.; Drummond, F.A. Pollination Services Provided by Wild and Managed Bees (Apoidea) in Wild Blueberry (Vaccinium angustifolium Aiton) Production in Maine, USA, with a Literature Review. Agronomy 2020, 10, 1413. [Google Scholar] [CrossRef]
- Stubbs, C.S.; Drummond, F.A.; Ginsberg, H. Effects of Invasive Plant Species on Pollinator Service and Reproduction in Native Plants at Acadia National Park; Tech Report NPS/NER/NRTR; US Department of the Interior. National Park Service, Northeast Region: Washington, DC, USA, 2007; p. 96.
- Dufour, C.; Fournier, V.; Giovenazzo, P. Diversity and nutritional value of pollen harvested by honey bee (Hymenoptera: Apidae) colonies during lowbush blueberry and cranberry (Ericaceae) pollination. Can. Entomol. 2020, 152, 622–645. [Google Scholar] [CrossRef]
- Yarborough, D.; Drummond, F.A.; Collins, J.A. Insect control guide for wild blueberries. Univ. Maine Coop. Ext. Fact Sheet 2018, 209, 14. [Google Scholar]
- Calatayud-Vernich, P.; Calatayud, F.; Simó, E.; Picó, Y. Pesticide residues in honey bees, pollen and beeswax: Assessing beehive exposure. Environ. Pollut. 2018, 241, 106–114. [Google Scholar] [CrossRef]
- Pettis, J.S. A scientific note on Varroa destructor resistance to coumaphos in the United States. Apidologie 2004, 35, 91–92. [Google Scholar] [CrossRef]
- Elzen, P.J.; Baxter, J.R.; Spivak, M.; Wilson, W.T. Amitraz resistance in varroa: New discovery in North America. Am. Bee J. 1999, 139, 362. [Google Scholar]
- Mullin, C.A.; Chen, J.; Fine, J.D.; Frazier, M.T.; Frazier, J.L. The formulation makes the honey bee poison. Pest. Biochem. Physiol. 2015, 120, 27–35. [Google Scholar] [CrossRef]
- Wade, A.; Lin, C.H.; Kurkul, C.; Regan, E.R.; Johnson, R.M. Combined toxicity of insecticides and fungicides applied to California almond orchards to honey bee larvae and adults. Insects 2019, 10, 20. [Google Scholar] [CrossRef] [PubMed]
- Zhu, Y.C.; Yao, J.; Adamczyk, J.; Luttrell, R. Synergistic toxicity and physiological impact of imidacloprid alone and binary mixtures with seven representative pesticides on honey bee (Apis mellifera). PLoS ONE 2017, 12, e0176837. [Google Scholar] [CrossRef] [PubMed]
- De Oliveira, R.C.; do Nascimento Queiroz, S.C.; da Luz, C.F.P.; Porto, R.S.; Rath, S. Bee pollen as a bioindicator of environmental pesticide contamination. Chemosphere 2016, 163, 525–534. [Google Scholar] [CrossRef] [PubMed]
- Buchmann, S.L.; Shipman, C.W.; Hansen, H.M. Pollen residing in safe sites on honey bee foragers. Am. Bee J. 1990, 130, 798–799. [Google Scholar]
- Graystock, P.; Goulson, D.; Hughes, W.O. Parasites in bloom: Flowers aid dispersal and transmission of pollinator parasites within and between bee species. Proc. Roy. Soc. B Biol. Sci. 2015, 282, 20151371. [Google Scholar] [CrossRef]
- Milone, J.P.; Tarpy, D.R. Effects of developmental exposure to pesticides in wax and pollen on honey bee (Apis mellifera) queen reproductive phenotypes. Sci. Rep. 2021, 11, 1–12. [Google Scholar] [CrossRef]
- Wu, J.Y.; Anelli, C.M.; Sheppard, W.S. Sub-lethal effects of pesticide residues in brood comb on worker honey bee (Apis mellifera) development and longevity. PLoS ONE 2011, 6, e14720. [Google Scholar] [CrossRef]
- Meikle, W.G.; Adamczyk, J.J.; Weiss, M.; Gregorc, A.; Johnson, D.R.; Stewart, S.D.; Zawislak, J.; Carroll, M.J.; Lorenz, G.M. Sublethal effects of imidacloprid on honey bee colony growth and activity at three sites in the US. PLoS ONE 2016, 11, e0168603. [Google Scholar] [CrossRef]
- Goñalons, C.M.; Farina, W.M. Impaired associative learning after chronic exposure to pesticides in young adult honey bees. J. Exp. Biol. 2018, 221, jeb176644. [Google Scholar] [CrossRef]
- Kang, M.; Jung, C. Avoidance behavior of honey bee, Apis mellifera from commonly used fungicides, acaricides and insecticides in apple orchards. J. Apic. 2017, 32, 295–302. [Google Scholar] [CrossRef]
- Johnson, R.M.; Pollock, H.S.; Berenbaum, M.R. Synergistic interactions between in-hive miticides in Apis mellifera. J. Econ. Entomol. 2009, 102, 474–479. [Google Scholar] [CrossRef]
- Calatayud-Vernich, P.; Calatayud, F.; Simó, E.; Aguilar, J.A.P.; Picó, Y. A two-year monitoring of pesticide hazard in-hive: High honey bee mortality rates during insecticide poisoning episodes in apiaries located near agricultural settings. Chemosphere 2019, 232, 471–480. [Google Scholar] [CrossRef] [PubMed]
- Traynor, K.S.; Pettis, J.S.; Tarpy, D.R.; Mullin, C.A.; Frazier, J.L.; Frazier, M. In-hive pesticide exposome: Assessing risks to migratory honey bees from in-hive pesticide contamination in the Eastern United States. Sci. Rep. 2016, 6, 1–16. [Google Scholar] [CrossRef]
- Evans, J.D.; Schwarz, R.S. Bees brought to their knees: Microbes affecting honey bee health. Trends Microbiol. 2011, 19, 614–620. [Google Scholar] [CrossRef] [PubMed]
- Runckel, C.; Flenniken, M.L.; Engel, J.C.; Ruby, J.G.; Ganem, D.; Andino, R.; DeRisi, J.L. Temporal analysis of the honey bee microbiome reveals four novel viruses and seasonal prevalence of known viruses, Nosema, and Crithidia. PLoS ONE 2011, 6, e20656. [Google Scholar] [CrossRef] [PubMed]
- Daughenbaugh, K.F.; Martin, M.; Brutscher, L.M.; Cavigli, I.; Garcia, E.; Lavin, M.; Flenniken, M.L. Honey bee infecting Lake Sinai viruses. Viruses 2015, 7, 3285–3309. [Google Scholar] [CrossRef]
- Faurot-Daniels, C.; Glenny, W.; Daughenbaugh, K.F.; McMenamin, A.J.; Burkle, L.A.; Flenniken, M.L. Longitudinal monitoring of honey bee colonies reveals dynamic nature of virus abundance and indicates a negative impact of Lake Sinai virus 2 on colony health. PLoS ONE 2020, 15, e0237544. [Google Scholar] [CrossRef]
- Core, A.; Runckel, C.; Ivers, J.; Quock, C.; Siapno, T.; DeNault, S.; Brown, B.; DeRisi, J.; Smith, C.D.; Hafernik, J. A new threat to honey bees, the parasitic phorid fly Apocephalus borealis. PLoS ONE 2012, 7, e29639. [Google Scholar] [CrossRef] [PubMed]
- Cohen, H.; Quistberg, R.D.; Philpott, S.M. Vegetation management and host density influence bee–parasite interactions in urban gardens. Environ. Entomol. 2017, 46, 1313–1321. [Google Scholar] [CrossRef] [PubMed]
- Ravoet, J. Exploring the Involvement of Honey Bee Pathogens in Colony Collapses from Epidemiological Data, Pathogen Genotyping and Host Immune Responses. Ph.D. Thesis, Ghent University, Ghent, Belgium, 2015. [Google Scholar]
- Khattab, M.M.; El-Hosseny, E.N. The first records of the parasite zombie fly (Apocephalus borealis Brues) on honeybee, Apis mellifera in Egypt. Int. J. Agric. Res. 2014, 4, 37–42. [Google Scholar]
- Schwarz, R.S.; Bauchan, G.R.; Murphy, C.A.; Ravoet, J.; De Graaf, D.C.; Evans, J.D. Characterization of two species of Trypanosomatidae from the honey bee Apis mellifera: Crithidia mellificae Lagridge and McGhee, 1967 and Lotmaria passim n. gen., n. sp. J. Euk. Microbiol. 2015, 62, 567–583. [Google Scholar] [CrossRef]
- Gómez-Moracho, T.; Buendía-Abad, M.; Benito, M.; García-Palencia, P.; Barrios, L.; Bartolomé, C.; Maside, X.; Meana, A.; Jiménez-Antón, M.D.; Olías-Molero, A.I.; et al. Experimental evidence of harmful effects of Crithidia mellificae and Lotmaria passim on honey bees. Int. J. Parasitol. 2020, 50, 1117–1124. [Google Scholar] [CrossRef] [PubMed]
- DeGrandi-Hoffman, G.; Chen, Y. Nutrition, immunity and viral infections in honey bees. Cur. Opin. Insect Sci. 2015, 10, 170–176. [Google Scholar] [CrossRef] [PubMed]


| Year | Trapped Pollen (ppb) 1 | Wax Comb (ppb) | Bee Bread (ppb) |
|---|---|---|---|
| 2014 | DMPF 2 (3853.7 3262.9) M 3 tau-Fluvalinate (462.3 280.8) M Chlorothalonil metabolite 4 (257.9 118.9) F Boscalid (47.9 81.7) F Propiconazole (24.8 9.9) F | tau-Fluvalinate (3849.0 3756.6) M DMPF 3 (1458.6 1219.4 Chlorothalonil metabolite 4 (107.4 73.5) F Coumaphos (54.1 29.8) M Propiconazole (54.0 46.9) F | Not sampled in 2014 |
| 2015 | Fludioxonil (98.8 68.5) F DMPF 3 (95.5 Cyprodinil (85.7 Phosmet (16.3 Sethoxydim (13.3 7.4) H | DMPF 3 (588.9 471.5 Tebuconazole (6.0 6.0) F Coumaphos (5.9 1.5) M tau-Fluvalinate (5.3 5.3) M Pyrimethanil (2.2 2.2) F | Fludioxonil (621.1 614.9) F Cyprodinil (475.8 468.1) F Phosmet (143.0 114.7) I Chlorothalonil metabolite 4 (117.8 116.5) F Sethoxidym (42.3 39.6) H |
Publisher’s Note: MDPI stays neutral with regard to jurisdictional claims in published maps and institutional affiliations. |
© 2021 by the authors. Licensee MDPI, Basel, Switzerland. This article is an open access article distributed under the terms and conditions of the Creative Commons Attribution (CC BY) license (https://creativecommons.org/licenses/by/4.0/).
Share and Cite
Drummond, F.A.; Lund, J.; Eitzer, B. Honey Bee Health in Maine Wild Blueberry Production. Insects 2021, 12, 523. https://doi.org/10.3390/insects12060523
Drummond FA, Lund J, Eitzer B. Honey Bee Health in Maine Wild Blueberry Production. Insects. 2021; 12(6):523. https://doi.org/10.3390/insects12060523
Chicago/Turabian StyleDrummond, Francis A., Jennifer Lund, and Brian Eitzer. 2021. "Honey Bee Health in Maine Wild Blueberry Production" Insects 12, no. 6: 523. https://doi.org/10.3390/insects12060523
APA StyleDrummond, F. A., Lund, J., & Eitzer, B. (2021). Honey Bee Health in Maine Wild Blueberry Production. Insects, 12(6), 523. https://doi.org/10.3390/insects12060523