Floral Plantings in Large-Scale Commercial Agroecosystems Support Both Pollinators and Arthropod Predators


Abstract
Simple Summary
Abstract
1. Introduction
- What impact do floral plantings have on pollinators in the margins of commercial agricultural fields?
- How do floral plantings affect pollinators within agricultural fields?
- What impact do floral plantings have on predators in the margins of commercial agricultural fields?
- How do floral plantings affect predators within agricultural fields?
2. Materials and Methods
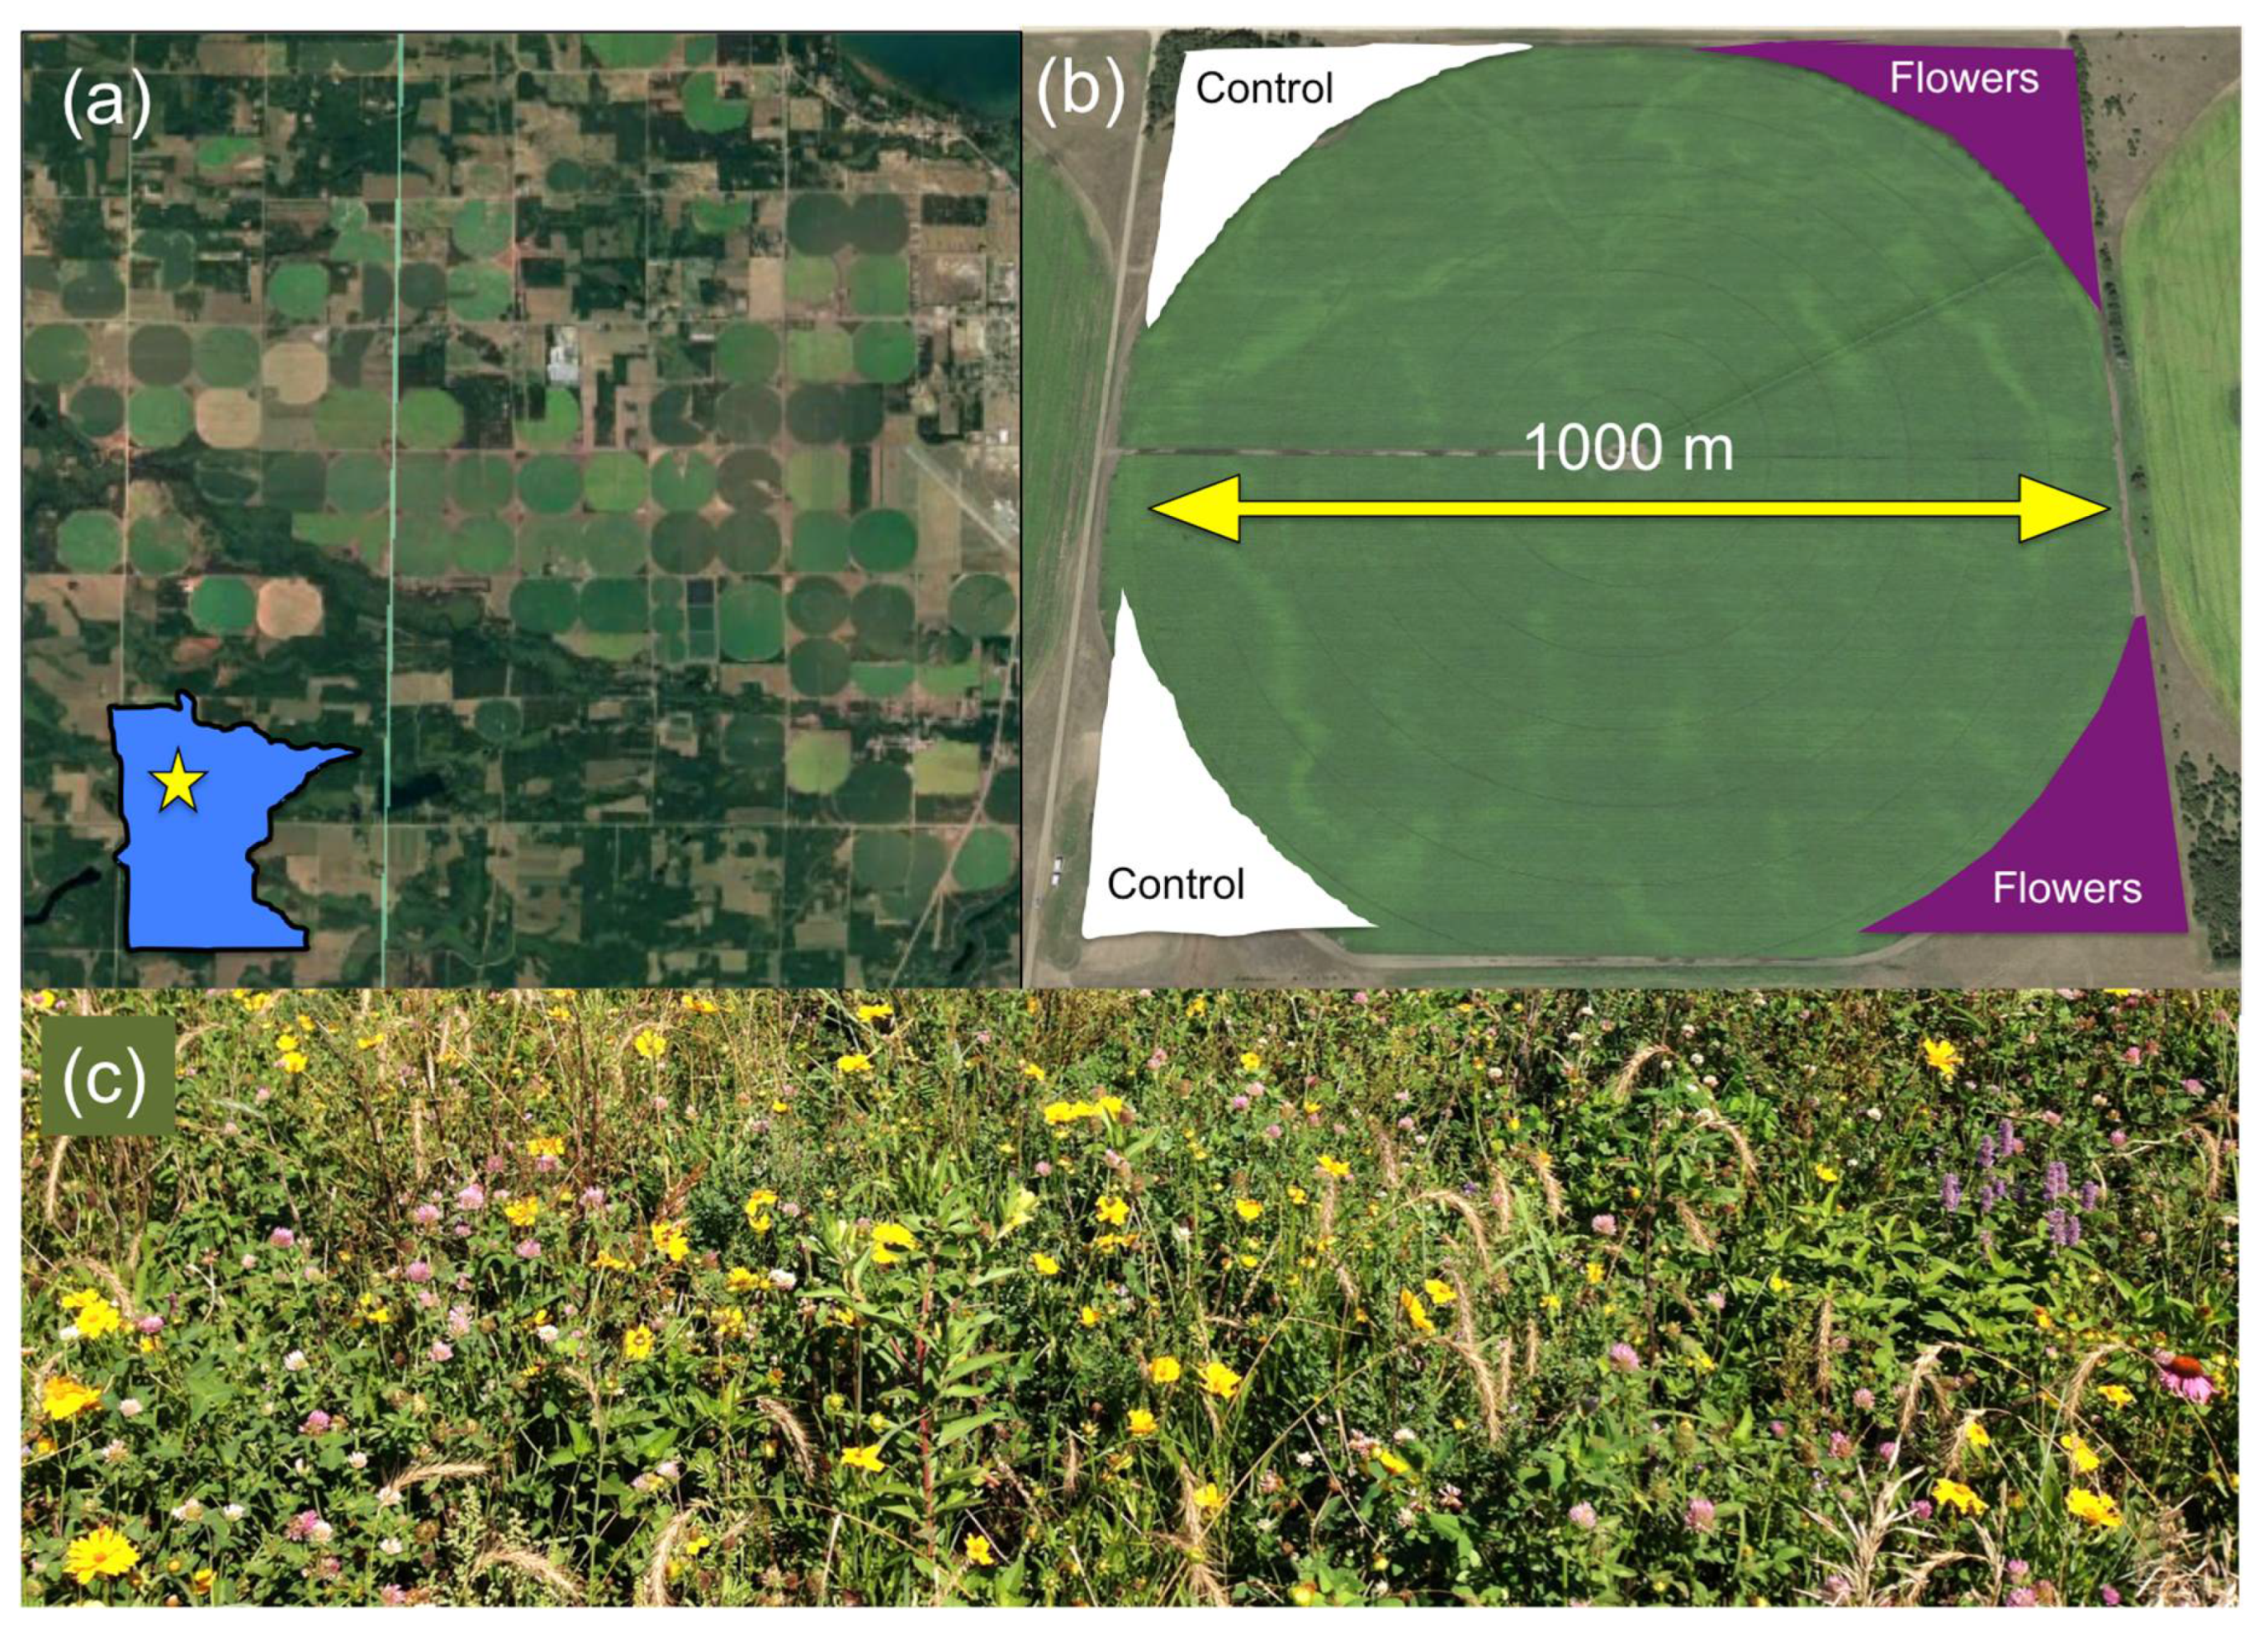
2.1. Experimental Design
2.2. Floral Sampling
2.3. Pollinator Sampling
2.4. Predator Sampling
2.5. Data Analysis
3. Results
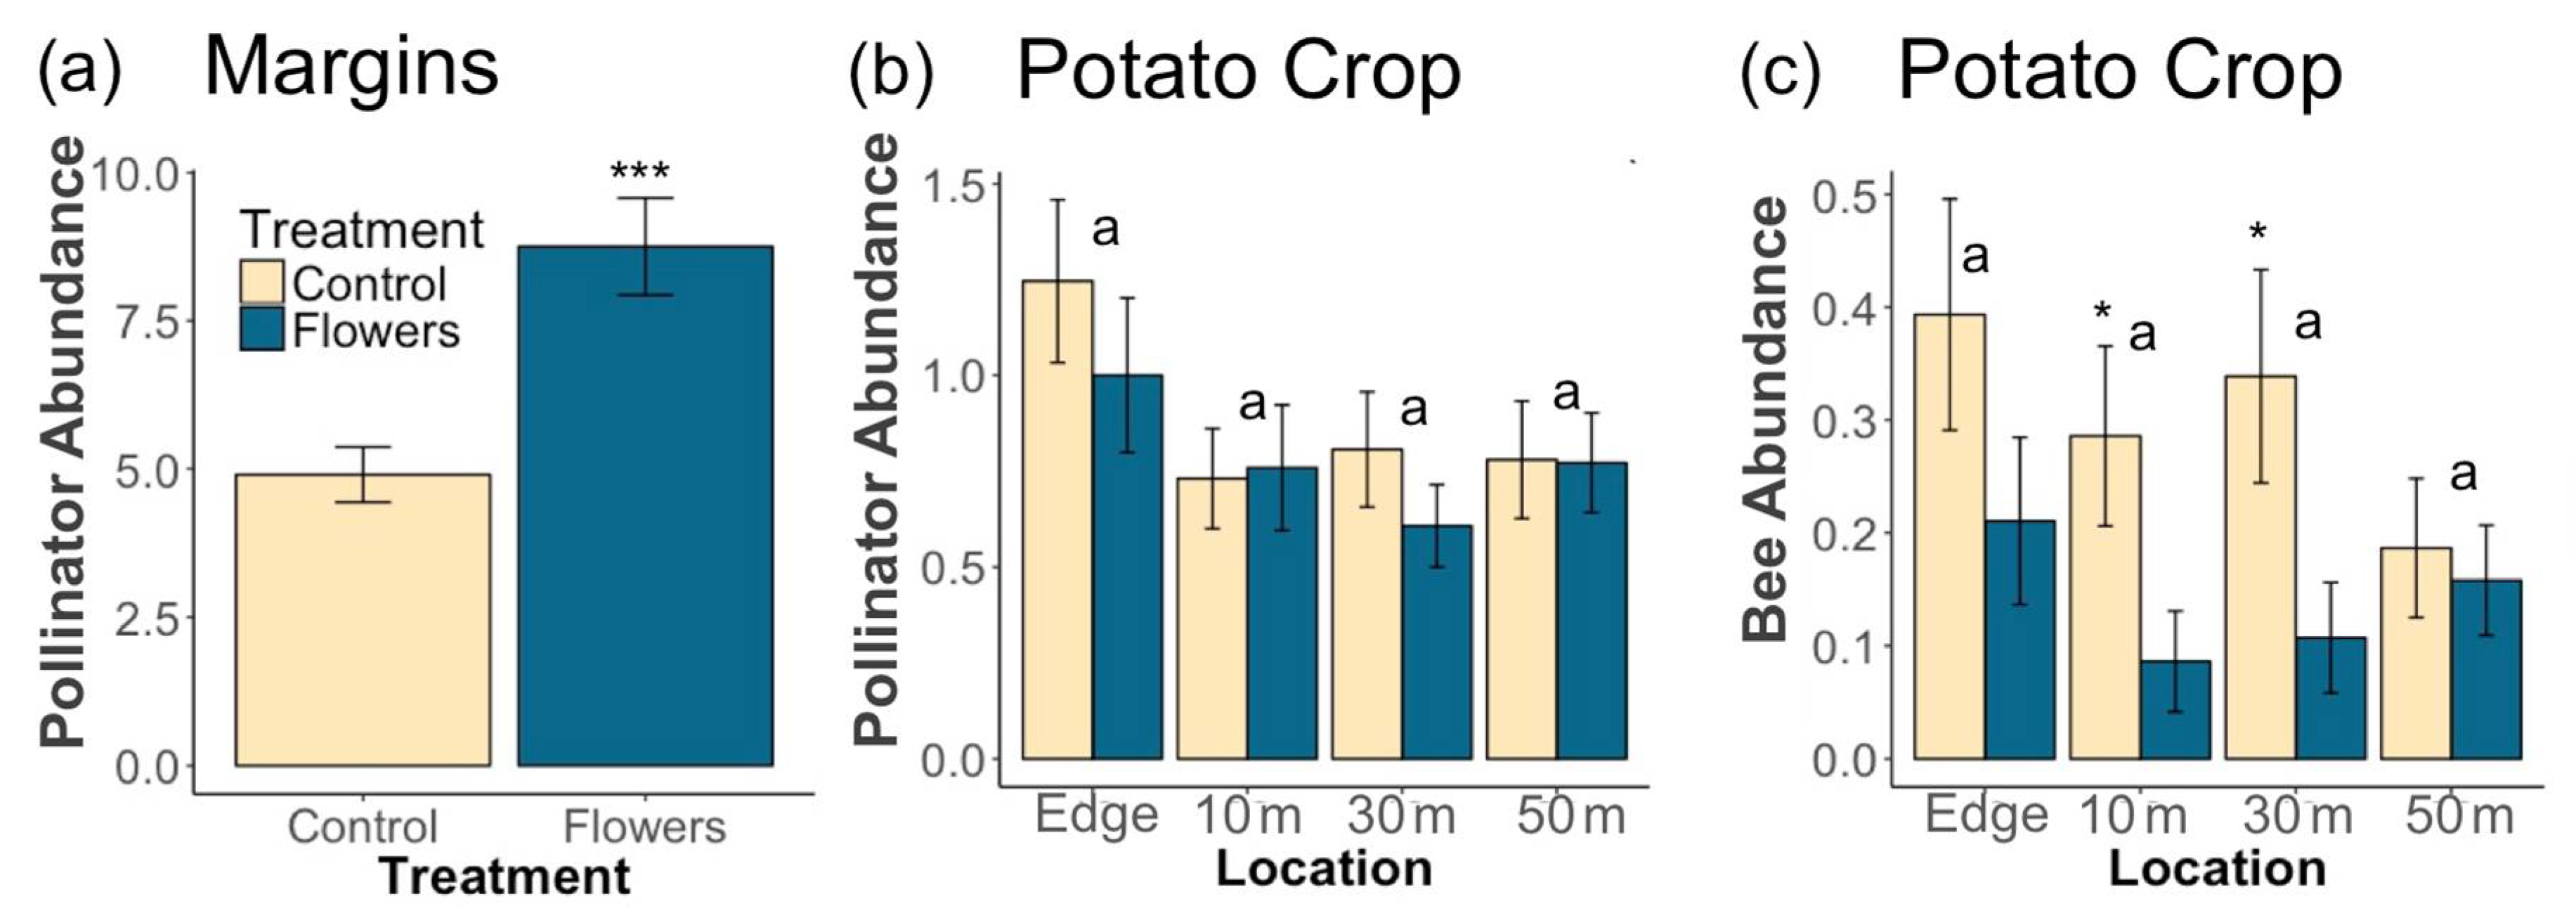
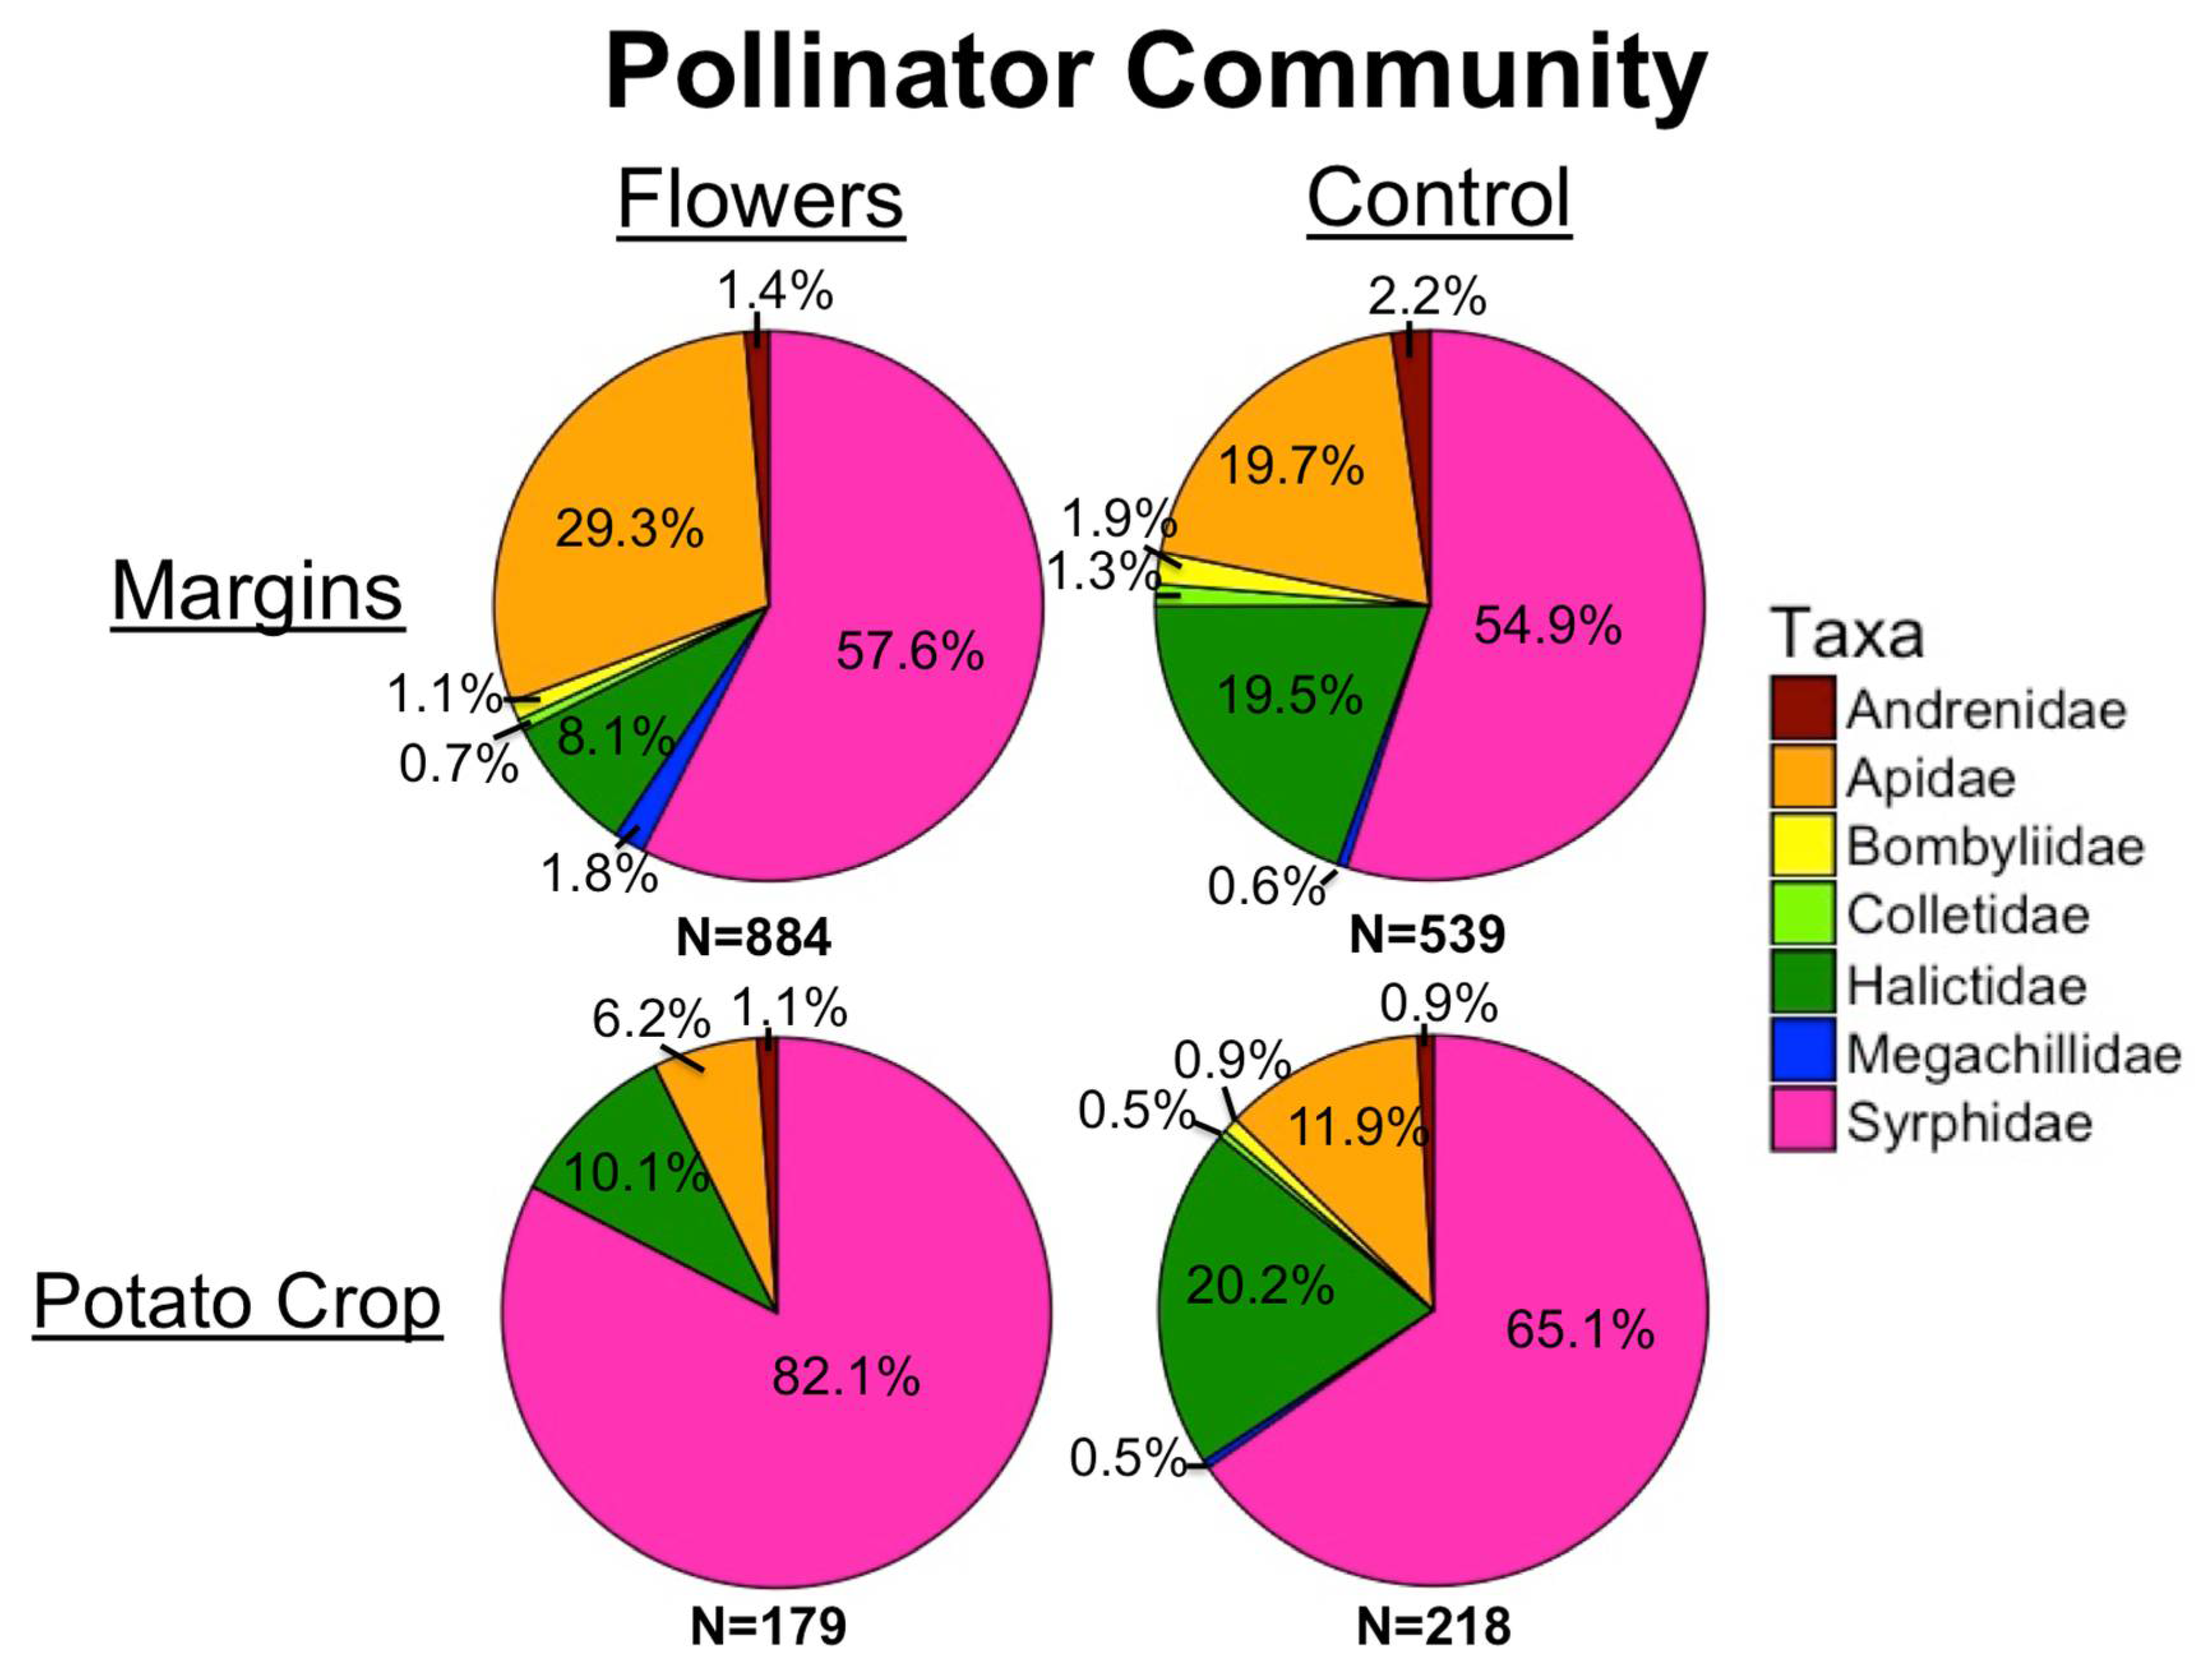
3.1. Pollinators
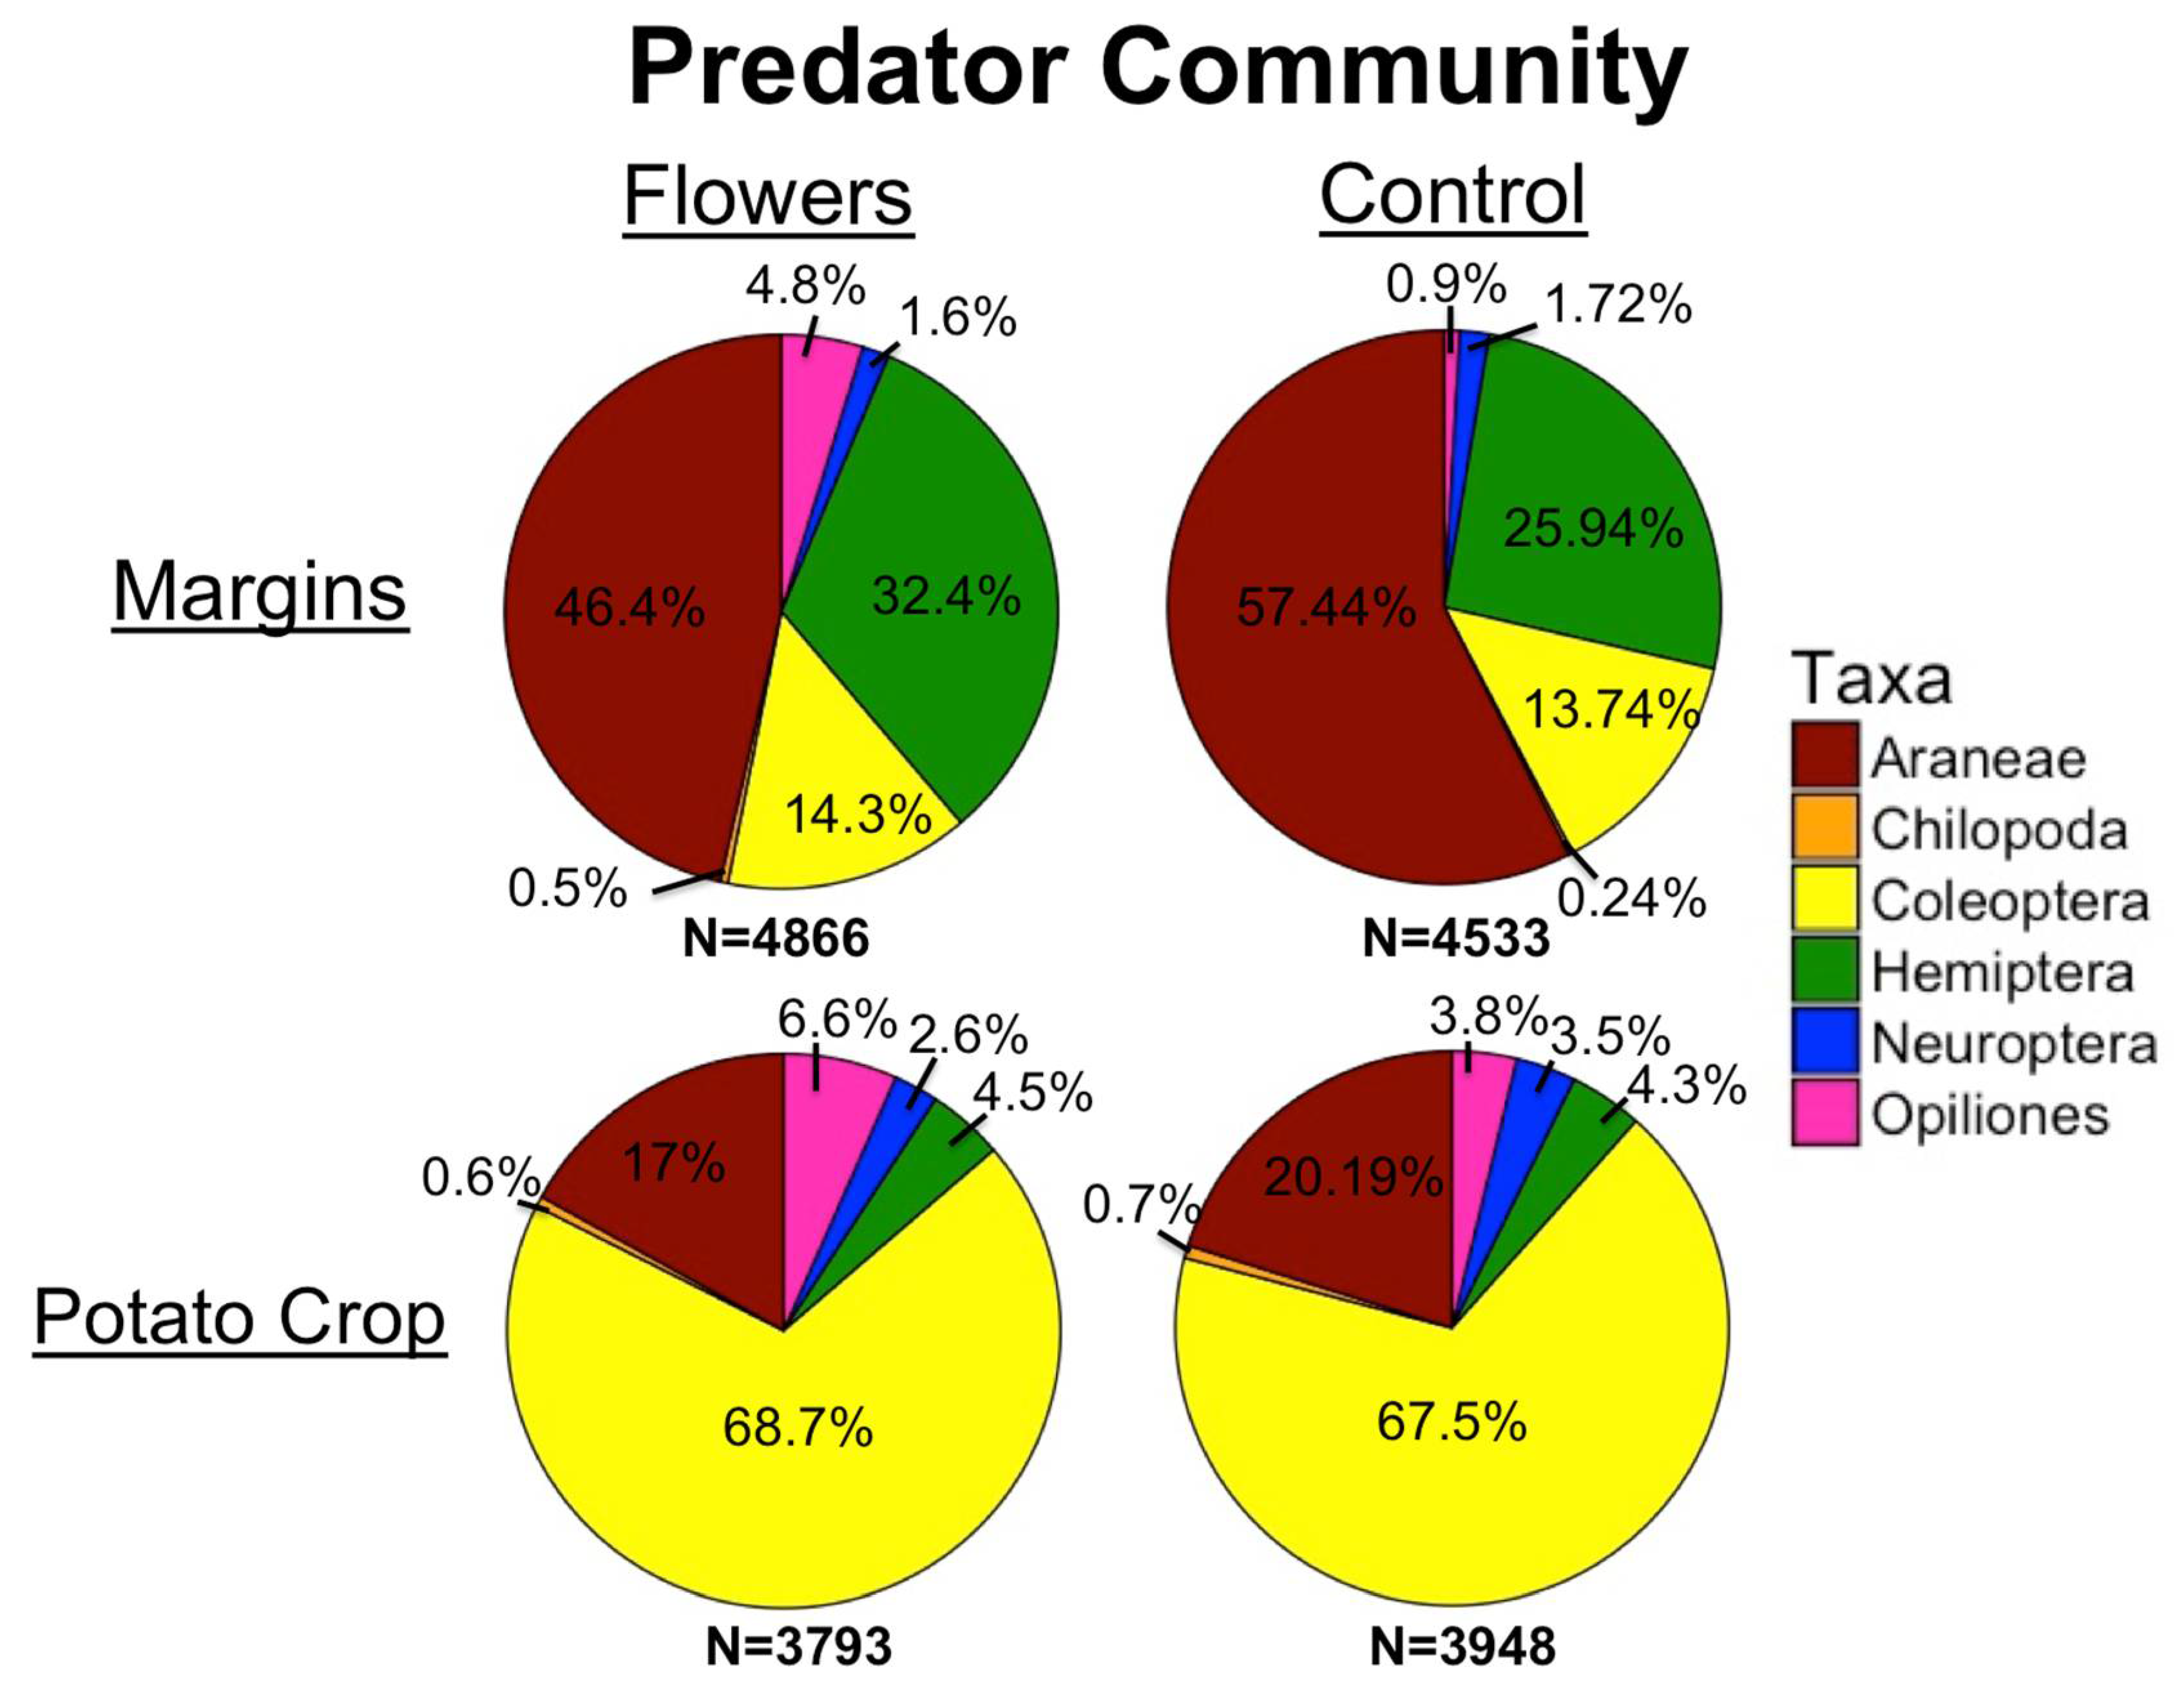
3.2. Predators
4. Discussion
4.1. Pollinators and Predators in Margins
4.2. Pollinators and Predators in Crops
5. Conclusions
Author Contributions
Funding
Institutional Review Board Statement
Informed Consent Statement
Data Availability Statement
Acknowledgments
Conflicts of Interest
Appendix A

| Monarch Seed Mixture | ||
| Common Name | Scientific Name | % of Mixture |
| Alfalfa SD Common | Medicago sativa | 3.25 |
| Alsike Clover | Trifolium hybridum | 6.52 |
| Birdsfoot Trefoil | Lotus corniculatus | 4.30 |
| Crimson Clover | Trifolium incarnatum | 6.43 |
| Sainfoin | Onobrychis viciifolia | 2.81 |
| Black-Eyed Susan | Rudbeckia hirta | 9.03 |
| Canada Milkvetch | Astragalus canadensis | 0.97 |
| Common Milkweed | Asclepias syriaca | 2.92 |
| Evening Primrose | Oenothera biennis | 0.79 |
| Ox-Eye Sunflower | Heliopsis helianthoides | 0.58 |
| Foxglove Beardtongue | Penstemon digitalis | 0.72 |
| Hoary Vervain | Vergena stricta | 1.96 |
| Ironweed | Veronia fasciculata | 0.55 |
| Maximillian Sunflower | Helianthus maxmilliani | 0.84 |
| New England Aster | Aster novae-angliae | 0.76 |
| Pale Purple Coneflower | Echinacea pallida | 0.30 |
| Partridge Pea | Chamaecrista fasciculata | 0.77 |
| Phacelia | Phacelia angelia | 4.08 |
| Blue Sage | Salvia azurea | 0.21 |
| Prairie Cinquefoil | Potentilla arguta | 2.21 |
| Prairie Coneflower | Ratibida columnifera | 2.64 |
| Purple Coneflower | Echinacea purpurea | 0.75 |
| Purple Prairie Clover | Dalea purpurea | 1.59 |
| Rough Blazingstar | Liatris aspera | 0.15 |
| Sawtooth Sunflower | Liatris aspera | 0.68 |
| Shell Leaf Penstemon | Penstemon grandiflorus | 0.38 |
| Showy Goldenrod | Solidago speciosa | 0.65 |
| Showy Tick Trefoil | Desmodium canadense | 0.13 |
| Sky Blue Aster | Aster azureus | 0.94 |
| Smooth Blue Aster | Aster laevis | 0.73 |
| Stiff Goldenrod | Solidago rigida | 1.86 |
| Stiff Sunflower | Helianthus pauciflorus | 0.09 |
| Tall Boneset | Eupatorium altissimum | 0.92 |
| White Prairie Clover | Dalea candidum | 2.20 |
| White Yarrow | Achillea millefolium | 6.13 |
| Wild Bergamont | Monarda fistulosa | 1.82 |
| Big Bluestem-Bison | Andropogon gerardii | 3.54 |
| Canada Wildrye | Elymus canadensis | 3.29 |
| Little Bluestem-Itasca | Schizachyrium scoparium | 4.65 |
| Prairie June Grass | Koeleria cristata | 8.29 |
| Sideoats Grama-Pierre | Bouteloua curtipendula | 4.10 |
| Western Wheatgrass | Agropyron smithii | 3.15 |
| Plains Oval Sedge | Carex brevior | 1.33 |
| Honeybee Seed Mixture | ||
| Common Name | Scientific Name | % of Mixture |
| Alfalfa SD Common | Medicago sativa | 7.25 |
| Alsike Clover | Trifolium hybridum | 13.41 |
| Birdsfoot Trefoil | Lotus corniculatus | 7.18 |
| Crimson Clover | Trifolium incarnatum | 5.74 |
| Ladino White Clover | Trifolium repens | 22.26 |
| Medium Red Clover | Trifolium pratense | 17.56 |
| Sainfoin | Onobrychis viciifolia | 2.12 |
| White Blossom Sweet Clover | Melilotus officinalis | 4.15 |
| Yellow Blossom Sweet Clover | Melilotus officinalis | 4.15 |
| Hoary Vervain | Vergena stricta | 0.87 |
| Maximillian Sunflower | Helianthus maxmilliani | 0.50 |
| Partridge Pea | Chamaecrista fasciculata | 0.41 |
| Phacelia | Phacelia angelia | 3.64 |
| Showy Goldenrod | Solidago speciosa | 0.58 |
| Sky Blue Aster | Aster azureus | 0.42 |
| Smooth Blue Aster | Aster laevis | 0.32 |
| Canada Wildrye | Elymus canadensis | 2.20 |
| Indiangrass-Tomahawk | Sorghastrum nutans | 2.23 |
| Little Bluestem-Itasca | Schizachyrium scoparium | 4.98 |
References
- Potts, S.G.; Biesmeijer, J.C.; Kremen, C.; Neumann, P.; Schweiger, O.; Kunin, W.E. Global pollinator declines: Trends, impacts and drivers. Trends Ecol. Evol. 2010, 25, 345–353. [Google Scholar] [CrossRef] [PubMed]
- Dirzo, R.; Young, H.S.; Galetti, M.; Ceballos, G.; Isaac, N.J.B.; Collen, B. Defaunation in the Anthropocene. Science 2014, 345, 401–406. [Google Scholar] [CrossRef] [PubMed]
- Hallmann, C.A.; Sorg, M.; Jongejans, E.; Siepel, H.; Hofland, N.; Schwan, H.; de Kroon, H. More than 75 percent decline over 27 years in total flying insect biomass in protected areas. PLoS ONE 2017, 12, 1–21. [Google Scholar] [CrossRef] [PubMed]
- Sandhu, H.S.; Wratten, S.D.; Cullen, R.; Case, B. The future of farming: The value of ecosystem services in conventional and organic arable land. An experimental approach. Ecol. Econ. 2008, 64, 835–848. [Google Scholar] [CrossRef]
- Foley, J.A.; Ramankutty, N.; Brauman, K.A.; Cassidy, E.S.; Gerber, J.S.; Johnston, M.; Zaks, D.P.M. Solutions for a cultivated planet. Nature 2011, 478, 337–342. [Google Scholar] [CrossRef]
- Kotze, D.J.; O’Hara, R.B. Species decline–but why? Explanations of carabid beetle (Coleoptera, Carabidae) declines in Europe. Conserv. Ecol. 2003, 135, 138–148. [Google Scholar] [CrossRef]
- Tscharntke, T.; Klein, A.M.; Kruess, A.; Steffan-Dewenter, I.; Thies, C. Landscape perspectives on agricultural intensification and biodiversity-ecosystem service management. Ecol. Lett. 2005, 8, 857–874. [Google Scholar] [CrossRef]
- Carvell, C.; Roy, D.B.; Smart, S.M.; Pywell, R.F.; Preston, C.D.; Goulson, D. Declines in forage availability for bumblebees at a national scale. Biol. Conserv. 2006, 132, 481–489. [Google Scholar] [CrossRef]
- Koh, I.; Lonsdorf, E.V.; Williams, N.M.; Brittain, C.; Isaacs, R.; Gibbs, J.; Ricketts, T.H. Modeling the status, trends, and impacts of wild bee abundance in the United States. Proc. Natl. Acad. Sci. USA 2016, 113, 140–145. [Google Scholar] [CrossRef]
- Losey, J.E.; Vaughn, M. The economic value of ecological services provided by insects. Bioscience 2006, 56, 311–323. [Google Scholar] [CrossRef]
- Klein, A.; Vaissie, B.E.; Cane, J.H.; Steffan-dewenter, I.; Cunningham, S.A.; Kremen, C.; Tscharntke, T. Importance of pollinators in changing landscapes for world crops. Proc. R. Soc. B 2007, 274, 303–313. [Google Scholar] [CrossRef] [PubMed]
- Aizen, M.A.; Garibaldi, L.A.; Cunningham, S.A.; Klein, A.M. How much does agriculture depend on pollinators? Lessons from long-term trends in crop production. Ann. Bot. 2009, 103, 1579–1588. [Google Scholar] [CrossRef] [PubMed]
- Calderone, N.W. Insect pollinated crops, insect pollinators and US agriculture: Trend analysis of aggregate data for the period 1992–2009. PLoS ONE 2012, 7, 1–27. [Google Scholar] [CrossRef] [PubMed]
- Oliver, T.H.; Isaac, N.J.B.; August, T.A.; Woodcock, B.A.; Roy, D.B.; Bullock, J.M. Declining resilience of ecosystem functions under biodiversity loss. Nat. Commun. 2015, 6, 1–8. [Google Scholar] [CrossRef]
- Grab, H.; Branstetter, M.G.; Amon, N.; Urban-mead, K.R.; Park, M.G.; Gibbs, J.; Danforth, B.N. Agriculturally dominated landscapes reduce bee phylogenetic diversity and pollination services. Science 2019, 363, 282–284. [Google Scholar] [CrossRef]
- Perfecto, I.; Vandermeer, J. The agroecological matrix as alternative to the land-sparing/agriculture intensification model. Proc. Natl. Acad. Sci. USA 2010, 107, 5786–5791. [Google Scholar] [CrossRef]
- Korpela, E.L.; Hyvönen, T.; Lindgren, S.; Kuussaari, M. Can pollination services, species diversity and conservation be simultaneously promoted by sown wildflower strips on farmland? Agric. Ecosyst. Environ. 2013, 179, 18–24. [Google Scholar] [CrossRef]
- Westphal, C.; Vidal, S.; Horgan, F.G.; Gurr, G.M.; Escalada, M.; van Chien, H.; Settele, J. Promoting multiple ecosystem services with flower strips and participatory approaches in rice production landscapes. Basic Appl. Ecol. 2015, 16, 681–689. [Google Scholar] [CrossRef]
- Barone, M.; Frank, T. Habitat age increases reproduction and nutritional condition in a generalist arthropod predator. Oecologia 2003, 135, 78–83. [Google Scholar] [CrossRef]
- Haaland, C.; Naisbit, R.E.; Bersier, L.F. Sown wildflower strips for insect conservation: A review. Insect Conserv. Divers. 2011, 4, 60–80. [Google Scholar] [CrossRef]
- Ramsden, M.W.; Menendez, R.; Leather, S.R.; Wackers, F. Optimizing field margins for biocontrol services: The relative role of aphid abundance, annual floral resources, and overwinter habitat in enhancing aphid natural enemies. Agric. Ecosyst. Environ. 2014, 199, 94–104. [Google Scholar] [CrossRef]
- Hoffmann, U.S.; Jauker, F.; Lanzen, J.; Warzecha, D.; Wolters, V.; Diekötter, T. Prey-dependent benefits of sown wildflower strips on solitary wasps in agroecosystems. Insect Conserv. Divers. 2018, 11, 42–49. [Google Scholar] [CrossRef]
- Ganser, D.; Knop, E.; Albrecht, M. Sown wildflower strips as overwintering habitat for arthropods: Effective measure or ecological trap? Agric. Ecosyst. Environ. 2019, 275, 123–131. [Google Scholar] [CrossRef]
- Scheper, J.; Bommarco, R.; Holzschuh, A.; Potts, S.G.; Riedinger, V.; Roberts, S.P.M.; Kleijn, D. Local and landscape-level floral resources explain effects of wildflower strips on wild bees across four European countries. J. Appl. Ecol. 2015, 52, 1165–1175. [Google Scholar] [CrossRef]
- Kleijn, D.; Linders, T.E.W.; Stip, A.; Biesmeijer, J.C.; Wäckers, F.L.; Bukovinszky, T. Scaling up effects of measures mitigating pollinator loss from local- to landscape-level population responses. Methods Ecol. Evol. 2018, 9, 1727–1738. [Google Scholar] [CrossRef]
- Carvell, C.; Meek, W.R.; Pywell, R.F.; Goulson, D.; Nowakowski, M. Comparing the efficacy of agri-environment schemes to enhance bumble bee abundance and diversity on arable field margins. J. Appl. Ecol. 2007, 44, 29–40. [Google Scholar] [CrossRef]
- Williams, N.M.; Ward, K.L.; Pope, N.; Isaacs, R.; Wilson, J.; May, E.A.; Peters, J. Native wildflower plantings support wild bee abundance and diversity in agricultural landscapes across the United States. Ecol. Appl. 2015, 25, 2119–2131. [Google Scholar] [CrossRef]
- Blaauw, B.R.; Isaacs, R. Flower plantings increase wild bee abundance and the pollination services provided to a pollination-dependent crop. J. Appl. Ecol. 2014, 51, 890–898. [Google Scholar] [CrossRef]
- Feltham, H.; Park, K.; Minderman, J.; Goulson, D. Experimental evidence that wildflower strips increase pollinator visits to crops. Ecol. Evol. 2015, 5, 3523–3530. [Google Scholar] [CrossRef]
- Sutter, L.; Albrecht, M.; Jeanneret, P. Landscape greening and local creation of wildflower strips and hedgerows promote multiple ecosystem services. J. Appl. Ecol. 2018, 55, 612–620. [Google Scholar] [CrossRef]
- Balzan, M.V.; Bocci, G.; Moonen, A.C. Utilisation of plant functional diversity in wildflower strips for the delivery of multiple agroecosystem services. Entomol. Exp. Appl. 2016, 158, 304–319. [Google Scholar] [CrossRef]
- Tschumi, M.; Albrecht, M.; Collatz, J.; Dubsky, V.; Entling, M.H.; Najar-Rodriguez, A.J.; Jacot, K. Tailored flower strips promote natural enemy biodiversity and pest control in potato crops. J. Appl. Ecol. 2016, 53, 1169–1176. [Google Scholar] [CrossRef]
- Blaauw, B.R.; Isaacs, R. Wildflower plantings enhance the abundance of natural enemies and their services in adjacent blueberry fields. Biol. Control 2015, 91, 94–103. [Google Scholar] [CrossRef]
- Woodcock, B.A.; Bullock, J.M.; McCracken, M.; Chapman, R.E.; Ball, S.L.; Edwards, M.E.; Pywell, R.F. Spill-over of pest control and pollination services into arable crops. Agric. Ecosyst. Environ. 2016, 231, 15–23. [Google Scholar] [CrossRef]
- Pywell, R.F.; Heard, M.S.; Woodcock, B.A.; Hinsley, S.; Ridding, L.; Nowakowski, M.; Bullock, J.M.; Nowakowski, M.; Wildlife-, B.J.M.; Pywell, R.F. Wildlife-friendly farming increases crop yield: Evidence for ecological intensification. Proc. R. Soc. B 2015, 282, 1–8. [Google Scholar] [CrossRef]
- Campbell, A.J.; Wilby, A.; Sutton, P.; Wäckers, F. Getting more power from your flowers: Multi-functional flower strips enhance pollinators and pest control agents in apple orchards. Insects 2017, 8, 101. [Google Scholar] [CrossRef]
- Quinn, N.F.; Brainard, D.C.; Szendrei, Z. Floral strips attract beneficial insects but do not enhance yield in cucumber fields. J. Econ. Entomol. 2017, 110, 517–524. [Google Scholar] [CrossRef]
- Blaauw, B.R.; Isaacs, R. Larger patches of diverse floral resources increase insect pollinator density, diversity, and their pollination of native wildflowers. Basic Appl. Ecol. 2014, 15, 701–711. [Google Scholar] [CrossRef]
- Operation Pollinator. 2020. Available online: http://www.syngenta-us.com/beehealth/operationpollinator.aspx (accessed on 5 May 2020).
- Tekiela, S. Wildflowers of Minnesota: A Field Guide; Adventure Publications: Cambridge, MA, USA, 1999. [Google Scholar]
- Minnesota Wildflowers. 2020: A Field Guide to the Flora of Minnesota. Available online: https://www.minnesotawildflowers.info/ (accessed on 27 April 2020).
- Discover Life. 2020. Available online: https://www.discoverlife.org/ (accessed on 27 April 2020).
- Skaug, H.; Fournier, D.; Bolker, B.; Magnusson, A.; Nielsen, A. Generalized Linear Mixed Models Using ‘AD Model Builder’. R Package Version 0.8.3.3. 2016. Available online: https://rdrr.io/rforge/glmmADMB/ (accessed on 21 January 2021).
- R Core Team. R: A Language and Environment for Statistical Computing. R Foundation for Statistical Computing; R Core Team: Vienna, Austria, 2020; Available online: https://www.r-project.org/ (accessed on 18 January 2021).
- Venturini, E.M.; Drummond, F.A.; Hoshide, A.K.; Dibble, A.C.; Stack, L.B. Pollination reservoirs for wild bee habitat enhancement in cropping systems: A review. Agroecol. Sustain. Food Syst. 2017, 41, 101–142. [Google Scholar] [CrossRef]
- Jacot, K.; Eggenschwiler, L.; Junge, X.; Luka, H.; Bosshard, A. Improved field margins for a higher biodiversity in agricultural landscapes. Asp. Appl. Biol. 2007, 81, 1–7. [Google Scholar]
- Isaacs, R.; Tuell, J.; Fiedler, A.; Gardiner, M.; Landis, D. Maximizing arthropod-mediated ecosystem services in agricultural landscapes: The role of native plants. Front. Ecol. Environ. 2009, 7, 196–203. [Google Scholar] [CrossRef]
- Tonietto, R.K.; Ascher, J.S.; Larkin, D.J. Bee communities along a prairie restoration chronosequence: Similar abundance and diversity, distinct composition. Ecol. Appl. 2017, 27, 705–717. [Google Scholar] [CrossRef] [PubMed]
- Cox, R.; O’Neal, M.; Hessel, R.; Schulte, L.A.; Helmers, M. The impact of prairie strips on aphidophagous predator abundance and soybean aphid predation in agricultural catchments. Environ. Entomol. 2014, 43, 1185–1197. [Google Scholar] [CrossRef] [PubMed]
- Roulston, T.H.; Goodell, K. The role of resources and risks in regulating wild bee populations. Annu. Rev. Entomol. 2011, 56, 293–312. [Google Scholar] [CrossRef]
- Dicks, L.V.; Baude, M.; SRoberts, P.M.; Phillips, J.; Green, M.; Carvell, C. How much flower-rich habitat is enough for wild pollinators? Answering a key policy question with incomplete knowledge. Ecol. Entomol. 2015, 40, 22–35. [Google Scholar] [CrossRef]
- Thomas, M.B.; Wratten, S.D.; Sotherton, N. Creation of ’Island’ habitats in farmland to manipulate populations of beneficial arthropods: Predator densities and emigration. J. Appl. Ecol. 1991, 28, 906–917. [Google Scholar] [CrossRef]
- Prasad, R.P.; Snyder, W.E. Polyphagy complicates conservation biological control that targets generalist predators. J. Appl. Ecol. 2006, 43, 343–352. [Google Scholar] [CrossRef]
- Pywell, R.F.; Warman, E.A.; Carvell, C.; Sparks, T.H.; Dicks, L.V.; Bennett, D.; Sherwood, A. Providing foraging resources for bumblebees in intensively farmed landscapes. Biol. Conserv. 2005, 121, 479–494. [Google Scholar] [CrossRef]
- Greenleaf, S.S.; Williams, N.M.; Winfree, R.; Kremen, C. Bee foraging ranges and their relationship to body size. Oecologia 2007, 152, 589–596. [Google Scholar] [CrossRef]
- Balduf, W.V. Food Habits of Phymata pennsylvanica americana Melin (Hemip.). Can. Entomol. 1939, 71, 66–74. [Google Scholar] [CrossRef]
- Lundgren, J.G.; Wyckhuys, K.A.G.; Desneux, N. Population responses by Orius insidiosus to vegetational diversity. BioControl 2009, 54, 135–142. [Google Scholar] [CrossRef]
- Atakan, E. Influence of weedy field margins on abundance patterns of the predatory bugs Orius spp. and their prey, the western flower thrips (Frankliniella occidentalis), on faba bean. Phytoparasitica 2010, 38, 313–325. [Google Scholar] [CrossRef]
- Chittka, L. Camouflage of predatory crab spiders on flowers and the colour perception of bees (Aranida:Thomisidae/Hymenoptera:Apidae). Entomol. Gen. 2001, 25, 181–187. [Google Scholar] [CrossRef]
- Williams, A.H. A friend unmasked: Notes on Chauliognathus Pensylvanicus (Coleoptera: Cantharidae) and the nature of natural history. Gt. Lakes Entomol. 2006, 39, 200–218. [Google Scholar]
- Frank, T.; Reichhart, B. Staphylinidae and Carabidae overwintering in wheat and sown wildflower areas of different age. Bull. Entomol. Res. 2004, 94, 209–217. [Google Scholar] [CrossRef]
- Bertolaccini, I.; Nunez-Perez, E.; Tizado, E.J. Effect of wild flowers on oviposition of Hippodamia variegata (Coleoptera: Coccinellidae) in the laboratory. Ecol. Behav. 2008, 101, 1792–1797. [Google Scholar] [CrossRef]
- Lundgren, J.G. Nutritional aspects of non-prey foods in the life histories of predaceous Coccinellidae. Biol. Control. 2009, 51, 294–305. [Google Scholar] [CrossRef]
- Batra, S.W.T. Male-fertile potato flowers are selectively buzz-pollinated only by Bombus terricola Kirby in Upstate New York. J. Kansas Entomol. Soc. 1993, 66, 252–254. [Google Scholar]
- Morandin, L.A.; Long, R.F.; Kremen, C. Hedgerows enhance beneficial insects on adjacent tomato fields in an intensive agricultural landscape. Agric. Ecosyst. Environ. 2014, 189, 164–170. [Google Scholar] [CrossRef]
- Osborne, J.L.; Clark, S.J.; Morris, R.J.; Williams, I.H.; Riley, J.R.; Smith, A.D.; Edwards, A.S. A landscape-scale study of bumble bee foraging range and constancy, using harmonic radar. J. Appl. Ecol. 1999, 36, 519–533. [Google Scholar] [CrossRef]
- Pinto da Rocha, R.; Machado, G.; Giribet, G. Harvestmen: The Biology of Opiliones; Harvard University Press: Cambridge, MA, USA, 2007. [Google Scholar]
- Macfadyen, S.; Davies, A.P.; Zalucki, M.P. Assessing the impact of arthropod natural enemies on crop pests at the field scale. Insect Sci. 2015, 22, 20–34. [Google Scholar] [CrossRef] [PubMed]


| Margins | |||||||
|---|---|---|---|---|---|---|---|
| Pollinators | Numbers of Individuals | Treatment | Floral Cover | ||||
| Family | Genus | Flowers | Control | z Value | Significance | z Value | Significance |
| Bombyliidae | 10 | 10 | 0.67 | 0.5 | −0.16 | 0.88 | |
| Syrphidae | 509 | 296 | 4.06 | 4.9 × 10⁻⁵ | 1.38 | 0.16897 | |
| Andrenidae | 12 | 12 | −0.22 | 0.82 | 3.53 | 4.1 × 10⁻⁴ | |
| Andrena | 12 | 10 | 0.13 | 0.9 | 2.73 | 0.0063 | |
| Calliopsis | 0 | 1 | --- | --- | --- | --- | |
| Perdita | 0 | 1 | --- | --- | --- | --- | |
| Apidae | 259 | 106 | 5.15 | 2.60 × 10⁻⁷ | 4 | 6.40 × 10⁻⁵ | |
| Anthophora | 0 | 1 | --- | --- | --- | --- | |
| Apis | 88 | 33 | 2.43 | 0.015 | 3.28 | 0.001 | |
| Bombus | 128 | 49 | 4.17 | 3.1 × 10⁻⁵ | 3.78 | 1.5 × 10⁻⁴ | |
| Ceratina | 5 | 12 | −0.99 | 0.32261 | −0.93 | 0.3535 | |
| Epeolus | 1 | 0 | --- | --- | --- | --- | |
| Melissodes | 36 | 10 | 2.86 | 0.0042 | 2.69 | 0.0071 | |
| Nomada | 1 | 1 | --- | --- | --- | --- | |
| Colletidae | 6 | 7 | −0.22 | 0.82 | 0.82 | 0.41 | |
| Colletes | 0 | 1 | --- | --- | --- | --- | |
| Hylaeus | 6 | 6 | 0.02 | 0.98 | −1.24 | 0.22 | |
| Halictidae | 72 | 105 | −0.5 | 0.62 | 0.01 | 0.988 | |
| Agapostemon | 6 | 4 | 0.71 | 0.47 | −1.06 | 0.29 | |
| Augochlora | 1 | 0 | --- | --- | --- | --- | |
| Augochlorella | 7 | 11 | −0.29 | 0.77138 | −1.14 | 0.25394 | |
| Halictus | 4 | 7 | −0.44 | 0.66 | 0.25 | 0.81 | |
| Lassioglossum | 52 | 79 | −1.03 | 0.303 | −0.47 | 0.6349 | |
| Sphecodes | 2 | 4 | −0.51 | 0.613 | 2.02 | 0.0429 | |
| Megachilidae | 16 | 3 | 2.69 | 0.0071 | 1 | 0.32 | |
| Ashmeadiella | 1 | 0 | --- | --- | --- | --- | |
| Heriades | 0 | 1 | --- | --- | --- | --- | |
| Hoplitis | 2 | 0 | --- | --- | --- | --- | |
| Megachile | 10 | 1 | 2.39 | 0.017 | 1 | 0.3164 | |
| Osmia | 3 | 1 | --- | --- | --- | --- | |
| Margins | ||||||||
|---|---|---|---|---|---|---|---|---|
| Predator | Number of Individuals | Treatment | Floral Cover | |||||
| Order | Family | Genus | Flowers | Control | z Value | Significance | z Value | Significance |
| Araneae | 2260 | 2604 | −0.39 | 0.7 | −2.69 | 0.0072 | ||
| Salticidae | 156 | 212 | −0.11 | 0.91 | 0.65 | 0.52 | ||
| Thomisidae | 271 | 180 | 3.22 | 0.0013 | 0.39 | 0.696 | ||
| Other spp | 1833 | 2212 | −0.91 | 0.36 | −3.34 | 8.5 × 10⁻⁴ | ||
| Chilopoda | 22 | 11 | 1.76 | 0.079 | 0.68 | 0.5 | ||
| Coleoptera | 697 | 623 | 1.6 | 0.11 | 2.85 | 0.0043 | ||
| Cantharidae | 209 | 100 | 1.96 | 0.0501 | 2.39 | 0.017 | ||
| Carabidae | 218 | 132 | 3.68 | 2.3 × 10⁻⁴ | −0.08 | 0.94 | ||
| Coccinellidae | 96 | 289 | −3.39 | 6.9 × 10⁻⁴ | 1.29 | 0.2 | ||
| Adults | 79 | 169 | −2.68 | 0.0074 | 1.58 | 0.11 | ||
| Larvae | 17 | 120 | −2.39 | 0.017 | −0.12 | 0.903 | ||
| Staphylinidae | 174 | 102 | 2.51 | 0.012 | 1.72 | 0.085 | ||
| Hemiptera | 1579 | 1176 | 3.62 | 3.00 × 10⁻⁴ | 2.97 | 0.003 | ||
| Anthocoridae | 759 | 680 | 2.1 | 0.036 | 3.83 | 1.3 × 10⁻⁴ | ||
| Lygaeidae | Geocoris spp | 77 | 80 | 0.88 | 0.377 | −0.9 | 0.366 | |
| Nabidae | 255 | 232 | 1.29 | 0.2 | −0.28 | 0.78 | ||
| Pentatomidae | Podisus maculiventris | 1 | 0 | --- | --- | --- | --- | |
| Phymatinae | 245 | 97 | 4.88 | 1.00 × 10⁻⁶ | 1.05 | 0.29 | ||
| Reduviidae | 242 | 87 | 5.5 | 3.70 × 10⁻⁸ | 0.58 | 0.56 | ||
| Neuroptera | 76 | 78 | 0.26 | 0.798 | 1.4 | 0.1617 | ||
| Chrysopidae | 73 | 77 | 0.09 | 0.926 | 1.38 | 0.1668 | ||
| Chrysopa spp Adult | 25 | 27 | −0.24 | 0.81 | 2.11 | 0.035 | ||
| Chrysopa spp Larvae | 48 | 50 | 0.24 | 0.8137 | 0.7 | 0.48242 | ||
| Hemerobiidae | 3 | 1 | --- | --- | --- | --- | ||
| Opiliones | 232 | 41 | 4.71 | 2.50 × 10⁻⁶ | 0.47 | 0.642 | ||
| Potato Crop | ||||||||
|---|---|---|---|---|---|---|---|---|
| Predator | Number of Individuals | Treatment | Floral Cover | |||||
| Order | Family | Genus | Flowers | Control | z Value | Significance | z Value | Significance |
| Araneae | 644 | 797 | −0.19 | 0.84577 | −1.11 | 0.26908 | ||
| Salticidae | 25 | 24 | 0.09 | 0.93 | 2 | 0.045 | ||
| Thomisidae | 54 | 62 | 0.09 | 0.93 | −2.2 | 0.028 | ||
| Other spp | 565 | 711 | −0.26 | 0.7913 | −0.75 | 0.454 | ||
| Chilopoda | 23 | 29 | −0.17 | 0.86 | 0.74 | 0.46 | ||
| Coleoptera | 2606 | 2664 | 0.04 | 0.97 | −0.68 | 0.5 | ||
| Cantharidae | 7 | 9 | 0.12 | 0.902 | 2.01 | 0.045 | ||
| Carabidae | 1493 | 1590 | −0.03 | 0.97 | 0.35 | 0.72 | ||
| Coccinellidae | 26 | 30 | −0.06 | 0.95 | −0.06 | 0.96 | ||
| Adults | 25 | 24 | 0.53 | 0.6 | 0.21 | 0.83 | ||
| Larvae | 1 | 6 | −1.46 | 0.14497 | −0.59 | 0.55305 | ||
| Staphylinidae | 1080 | 1035 | 0.85 | 0.3972 | −2.01 | 0.04473 | ||
| Hemiptera | 169 | 169 | −0.14 | 0.892 | −1 | 0.315 | ||
| Anthocoridae | 153 | 147 | 0.36 | 0.716 | −1.14 | 0.2528 | ||
| Lygaeidae | Geocoris spp | 3 | 3 | −0.26 | 0.8 | −0.01 | 0.99 | |
| Nabidae | 9 | 14 | −0.7 | 0.49 | 0.12 | 0.9 | ||
| Pentatomidae | Podisus maculiventris | 0 | 0 | --- | --- | --- | --- | |
| Phymatinae | 0 | 3 | --- | --- | --- | --- | ||
| Reduviidae | 4 | 2 | 0.89 | 0.37 | −0.17 | 0.87 | ||
| Neuroptera | 99 | 139 | −0.82 | 0.4145 | 0.64 | 0.5223 | ||
| Chrysopidae | 96 | 135 | −0.85 | 0.398 | 0.57 | 0.5694 | ||
| Chrysopa spp Adult | 33 | 42 | −0.46 | 0.65 | 0.41 | 0.68 | ||
| Chrysopa spp Larvae | 63 | 93 | −1.12 | 0.2635 | 0.08 | 0.9331 | ||
| Hemerobiidae | 3 | 4 | −0.31 | 0.75 | 0.9 | 0.367 | ||
| Opiliones | 252 | 149 | 4.05 | 5.2 × 10⁻⁵ | 0.8 | 0.423 | ||
Publisher’s Note: MDPI stays neutral with regard to jurisdictional claims in published maps and institutional affiliations. |
© 2021 by the authors. Licensee MDPI, Basel, Switzerland. This article is an open access article distributed under the terms and conditions of the Creative Commons Attribution (CC BY) license (http://creativecommons.org/licenses/by/4.0/).
Share and Cite
Middleton, E.G.; MacRae, I.V.; Philips, C.R. Floral Plantings in Large-Scale Commercial Agroecosystems Support Both Pollinators and Arthropod Predators. Insects 2021, 12, 91. https://doi.org/10.3390/insects12020091
Middleton EG, MacRae IV, Philips CR. Floral Plantings in Large-Scale Commercial Agroecosystems Support Both Pollinators and Arthropod Predators. Insects. 2021; 12(2):91. https://doi.org/10.3390/insects12020091
Chicago/Turabian StyleMiddleton, Eric G., Ian V. MacRae, and Christopher R. Philips. 2021. "Floral Plantings in Large-Scale Commercial Agroecosystems Support Both Pollinators and Arthropod Predators" Insects 12, no. 2: 91. https://doi.org/10.3390/insects12020091
APA StyleMiddleton, E. G., MacRae, I. V., & Philips, C. R. (2021). Floral Plantings in Large-Scale Commercial Agroecosystems Support Both Pollinators and Arthropod Predators. Insects, 12(2), 91. https://doi.org/10.3390/insects12020091