The Modeling and Forecasting of Carabid Beetle Distribution in Northwestern China


Abstract
Simple Summary
Abstract
1. Introduction
2. Materials and Methods
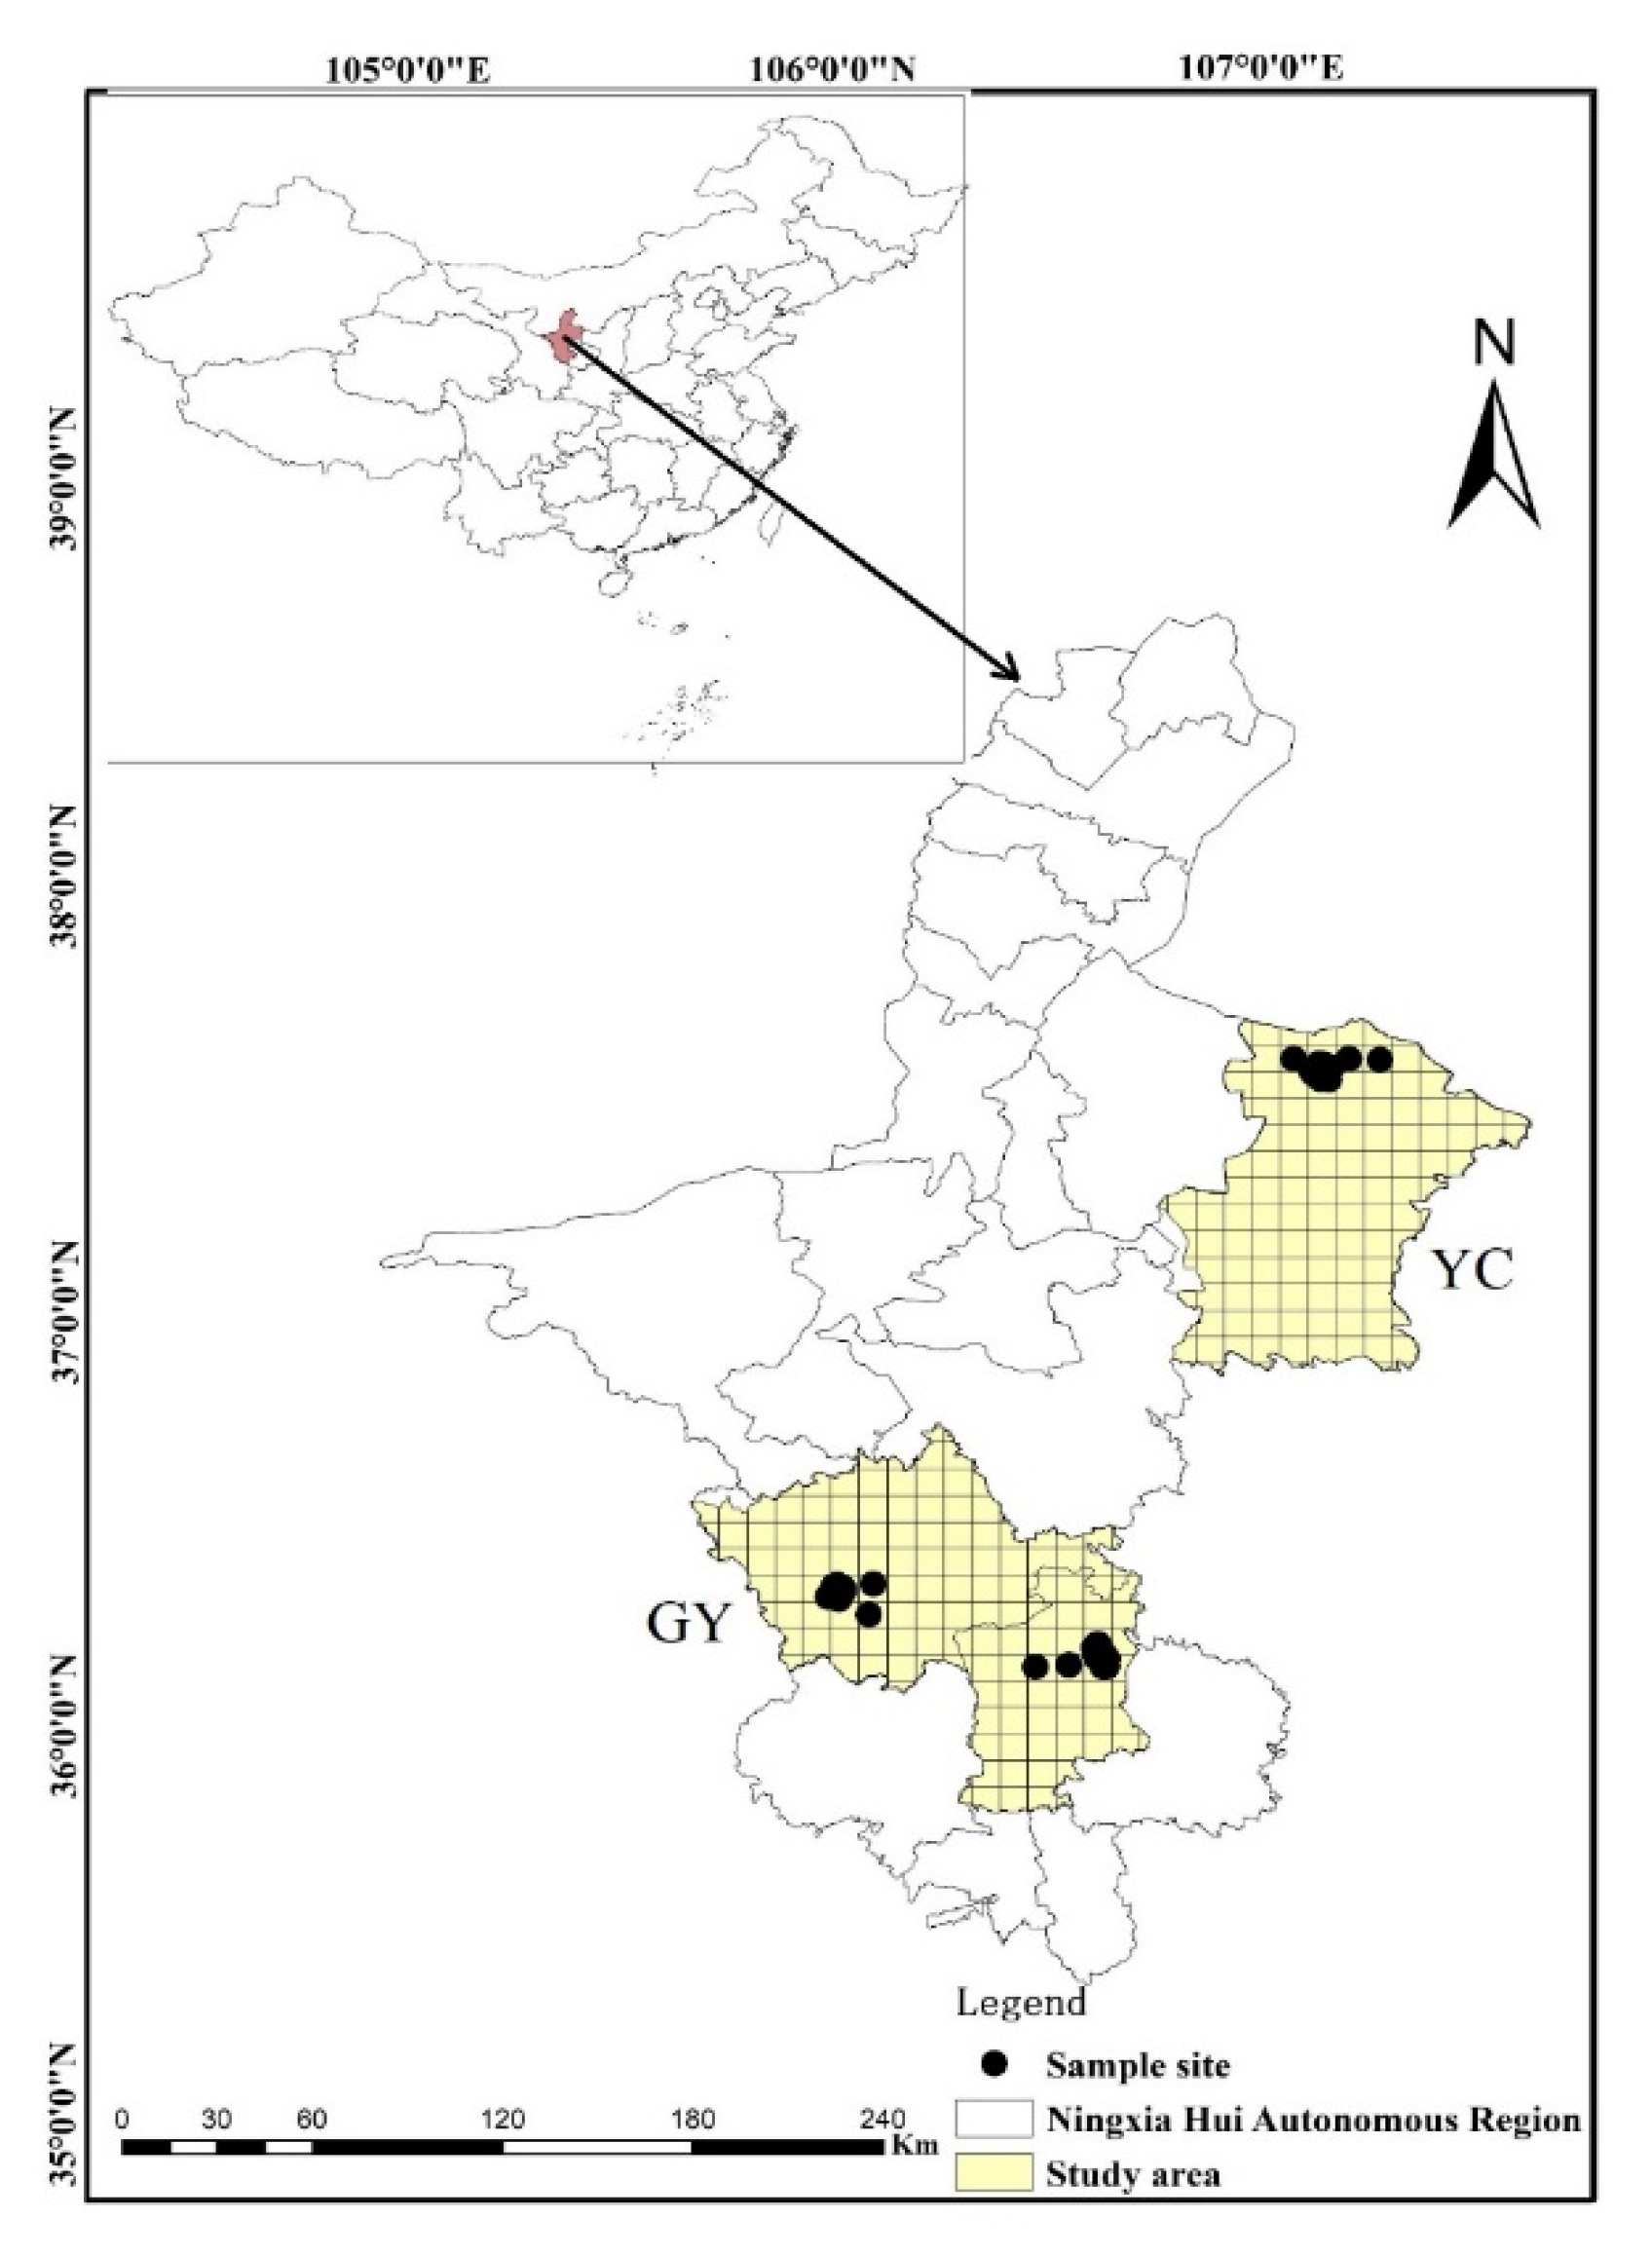
2.1. Study Area
- (1)
- Yanchi region, characterized by a cold, semi-arid continental monsoon-influenced climate, with a mean annual temperature of 5.7 °C and mean annual precipitation of 200 mm [44]. The soil was of sierozem and the representative vegetation is Agropyron mongolicum, Artemisia desertorum, Lespedez adavurica and Artemisia blepharolepis.
- (2)
- Guanyuan region, characterized by a semi-arid continental monsoon-influenced climate, with a mean annual temperature of 7 °C and mean annual precipitation of 400 mm [44]. The soil was of black thorn and brown and the representative vegetation is Stipa bungeana, Artemisia frigida, Potentilla acaulis and Stipa grandis.
2.2. Beetle Data
2.3. Environmental, Spatial and Climatic Data
2.4. Data Processing and Statistical Analyses
2.5. Model Building
2.6. Model Fitting and Selection
3. Results
3.1. Population Size
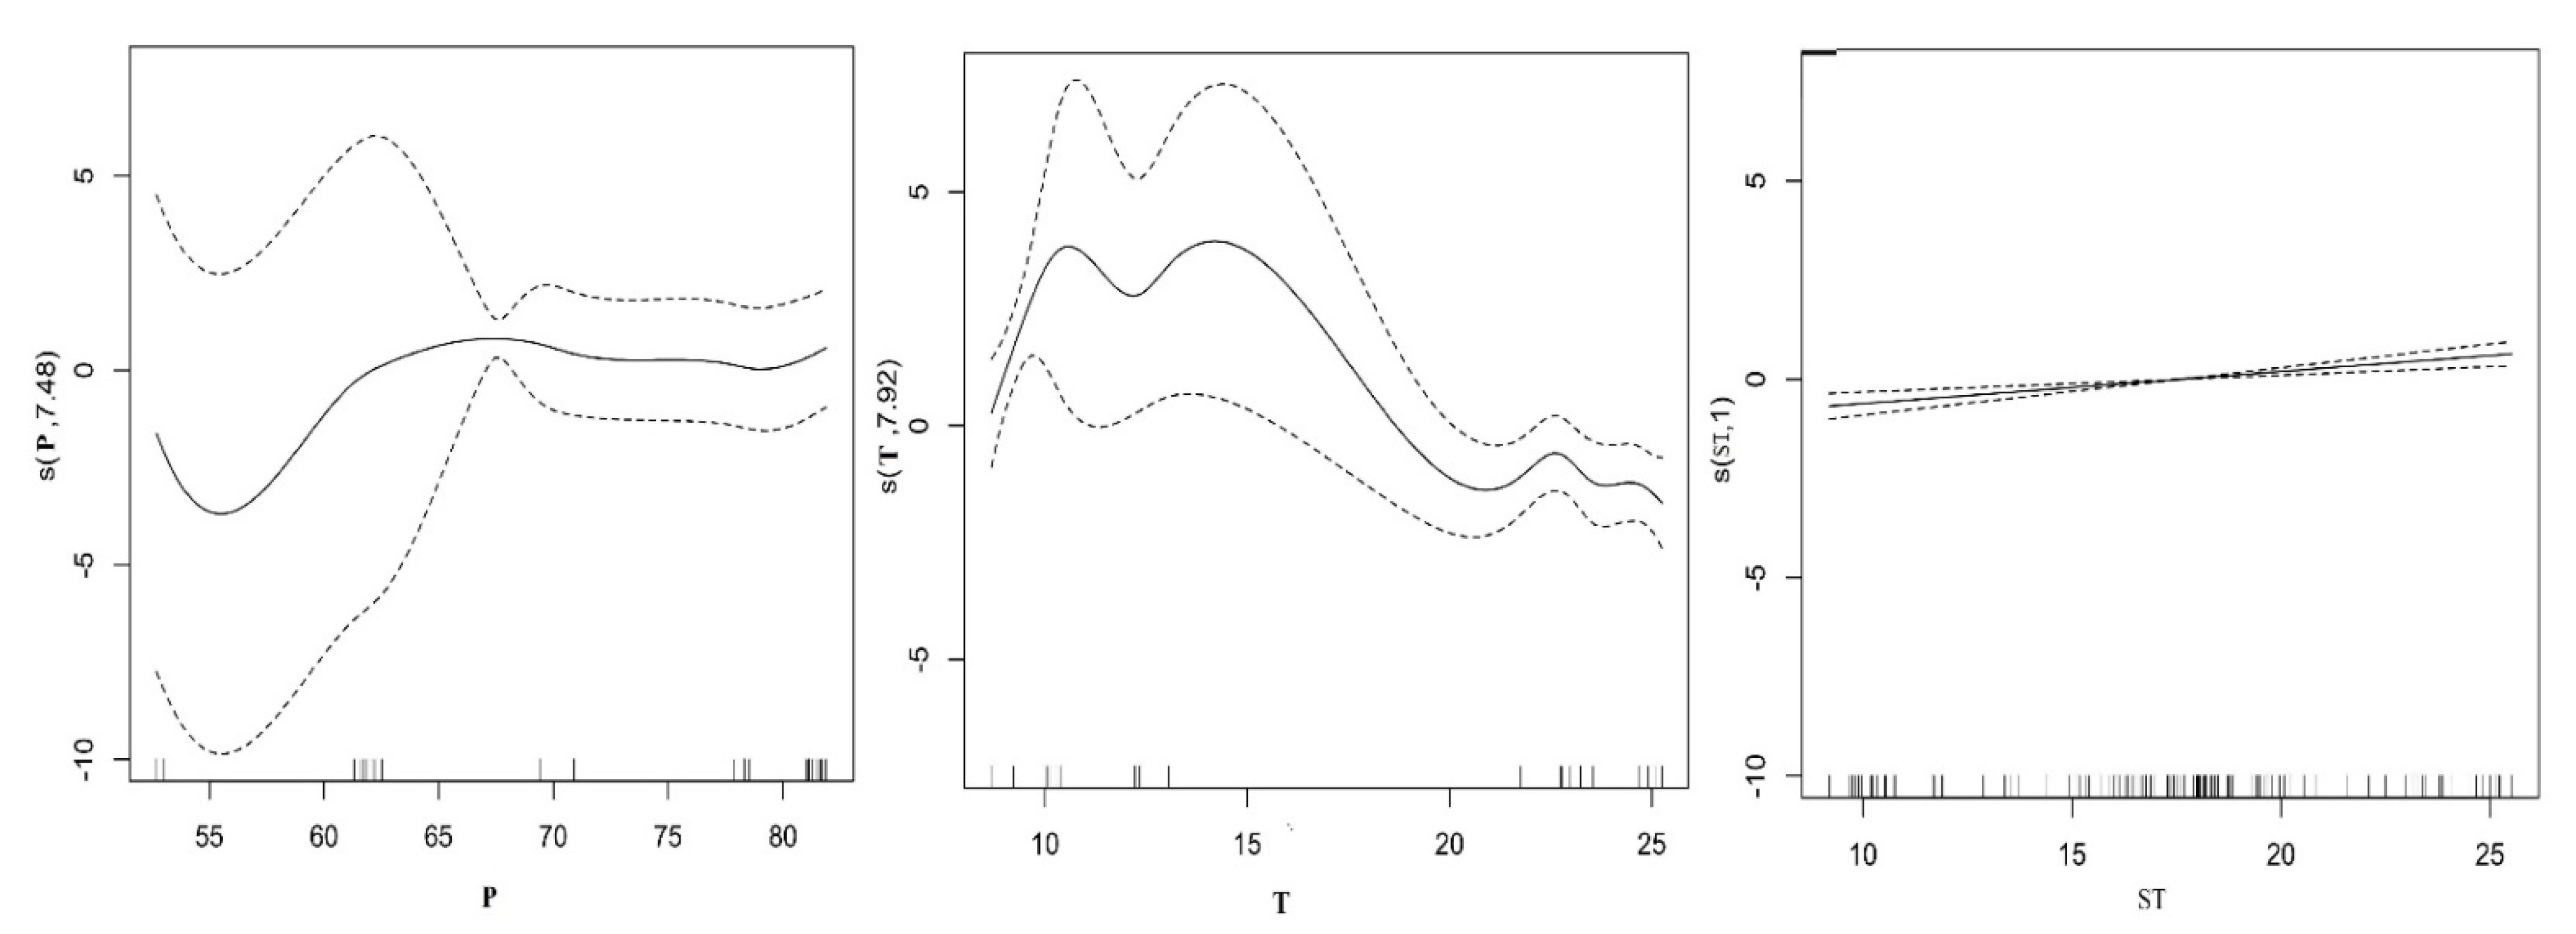
3.2. Fitted Model
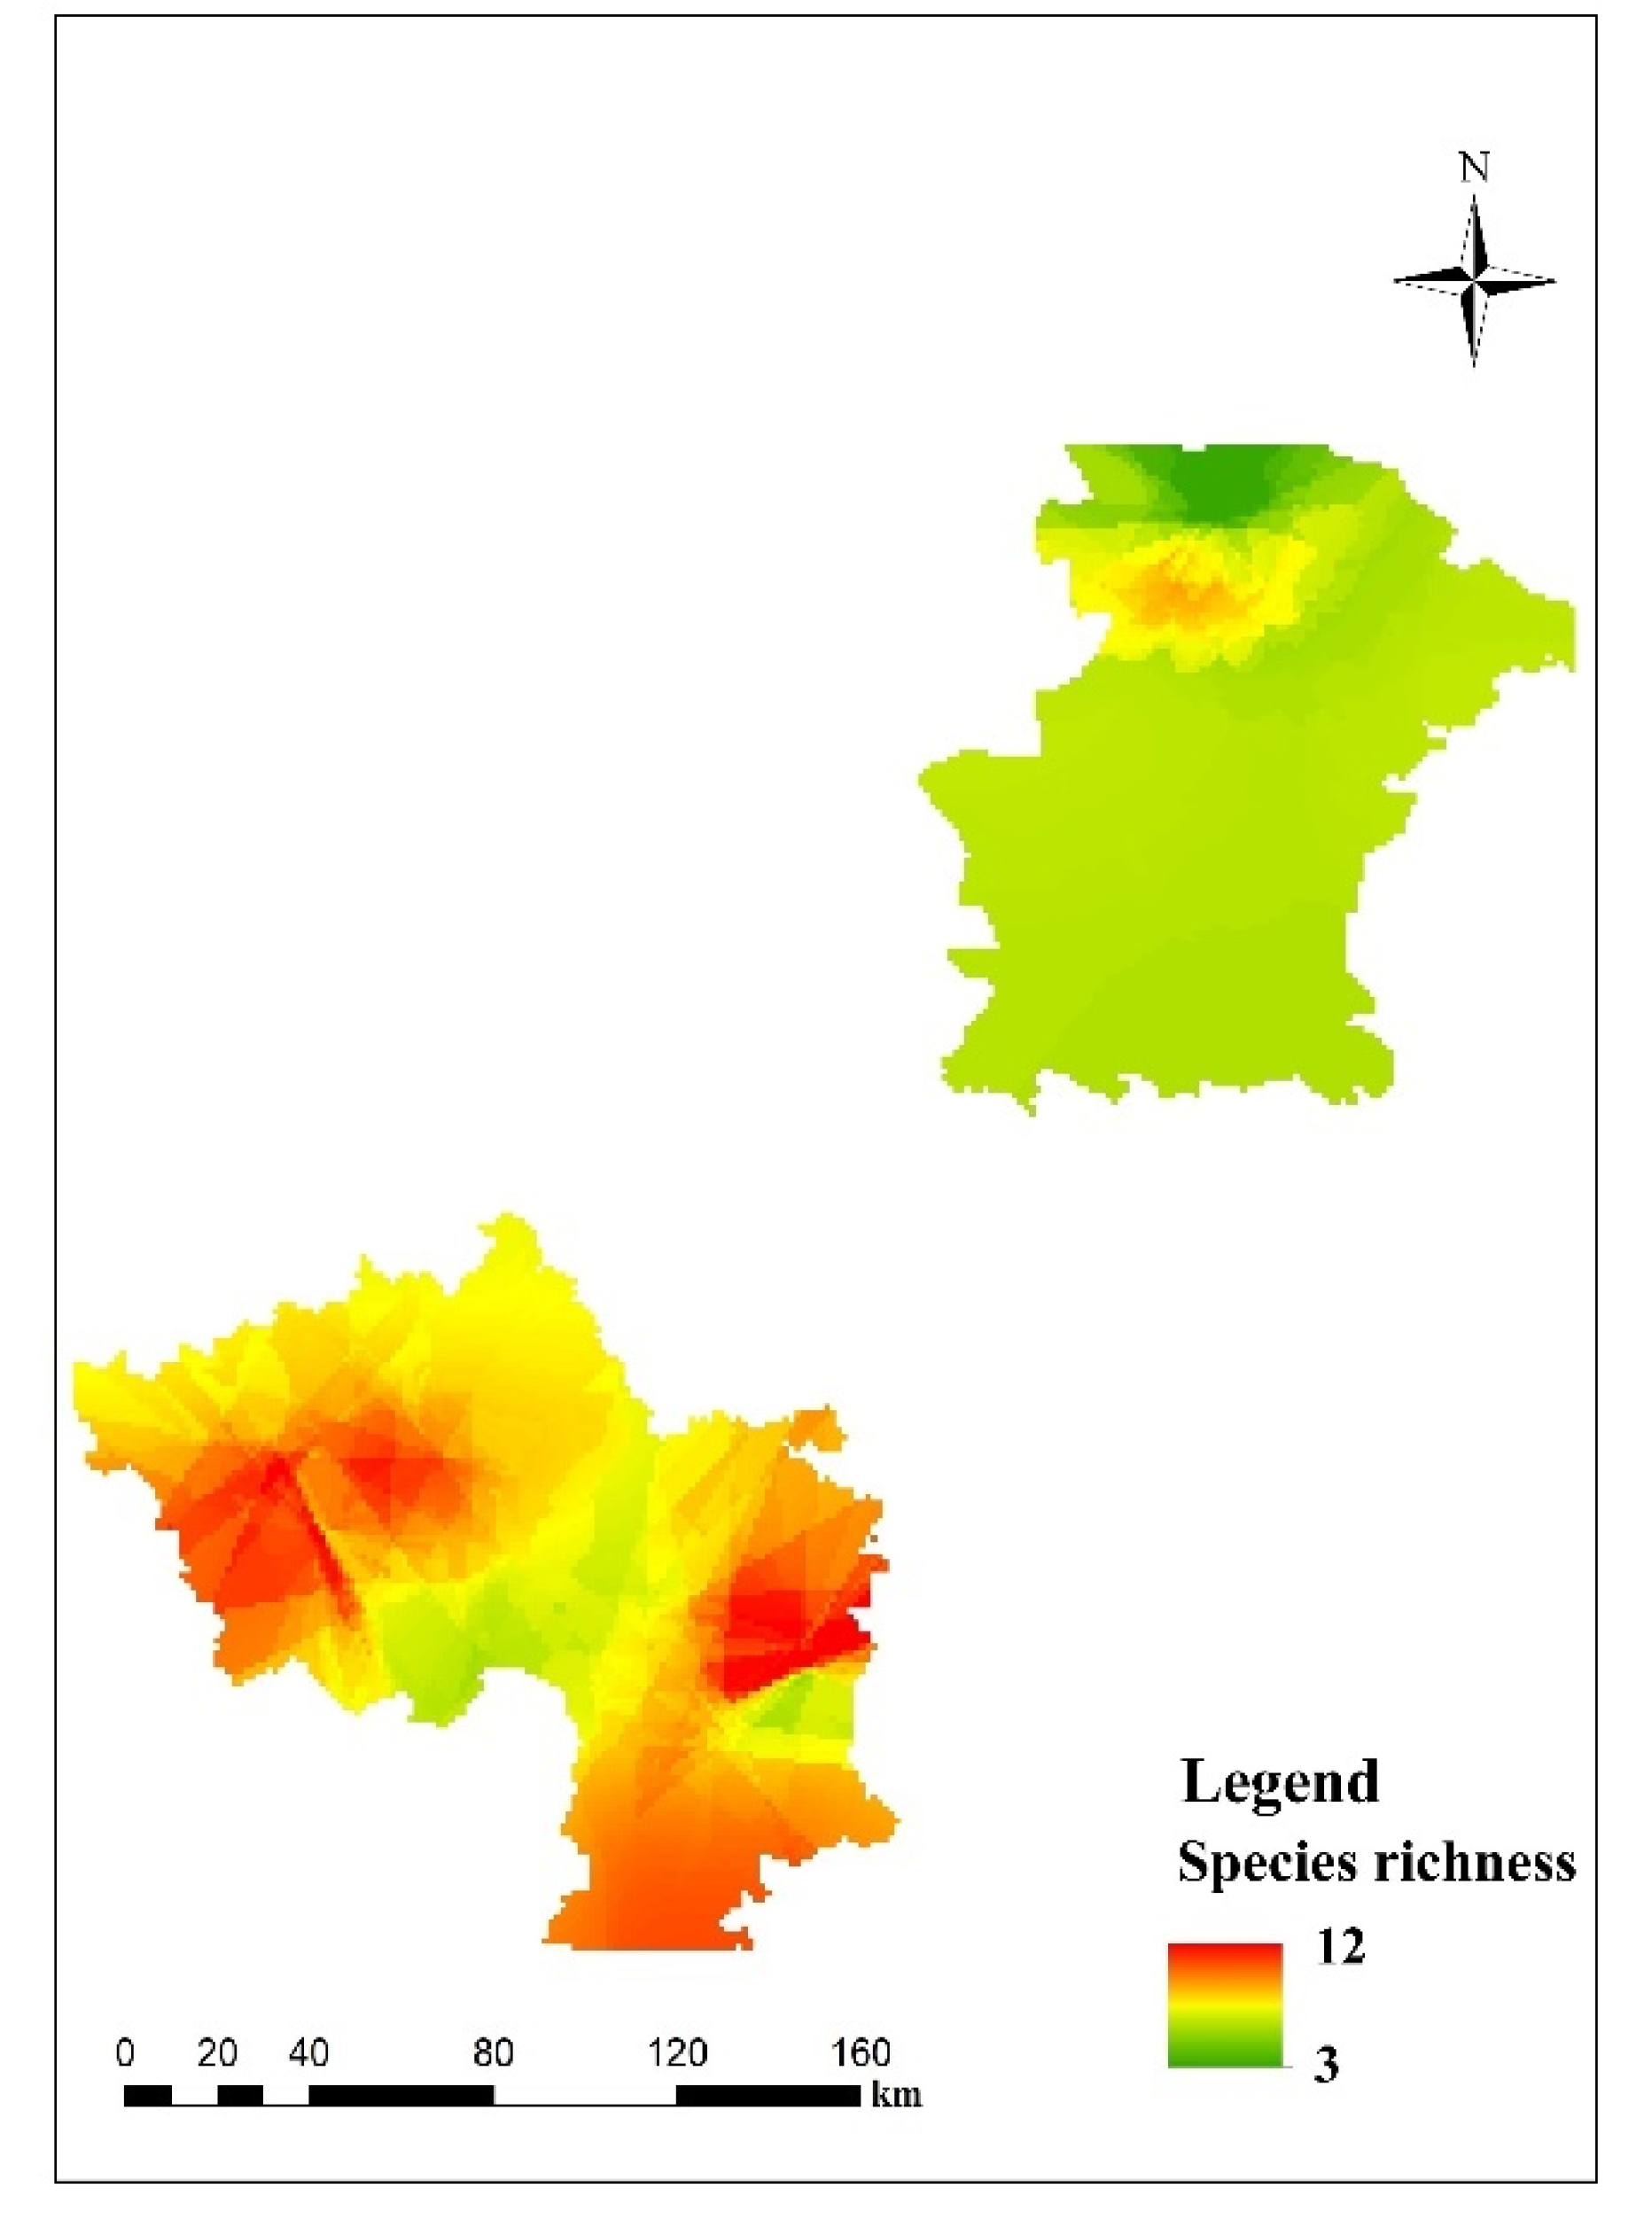
3.3. Predictive Mapping
4. Discussion
5. Conclusions
Author Contributions
Funding
Institutional Review Board Statement
Data Availability Statement
Acknowledgments
Conflicts of Interest
Appendix A

| Genera | Species | Abbreviation | 2017 | 2018 | 2019 | Total | ||||||
|---|---|---|---|---|---|---|---|---|---|---|---|---|
| Yanchi Region | Guyuan Region | Total | Yanchi Region | Guyuan Region | Total | Yanchi Region | Guyuan Region | Total | ||||
| Amara | Amara helva | AmarHel | 9 | 0 | 9 | 40 | 0 | 40 | 4 | 0 | 4 | 53 |
| Amara dux | AmarDux | 6 | 61 | 67 | 4 | 13 | 17 | 7 | 8 | 15 | 99 | |
| Amara sp | Amarsp | 0 | 15 | 15 | 13 | 3 | 16 | 0 | 0 | 0 | 31 | |
| Amara harpaloides | AmarHar | 7 | 4 | 11 | 1 | 4 | 5 | 5 | 7 | 12 | 28 | |
| Broscus | Broscus kozlovi | BrosKoz | 0 | 8 | 8 | 0 | 3 | 3 | 4 | 0 | 4 | 15 |
| Carabus | Carabus ladimirskyi | CaraVla | 3 | 2036 | 2039 | 0 | 316 | 316 | 4 | 466 | 470 | 2825 |
| Carabus glyptoterus | CaraGly | 252 | 634 | 886 | 85 | 92 | 177 | 55 | 75 | 130 | 1193 | |
| Carabus assesculptus | CaraCra | 0 | 339 | 339 | 0 | 198 | 198 | 0 | 88 | 88 | 625 | |
| Carabus culptipennis | CaraScu | 0 | 404 | 404 | 0 | 73 | 73 | 1 | 61 | 62 | 539 | |
| Carabu anchocephalus | CaraAnc | 0 | 85 | 85 | 0 | 21 | 21 | 0 | 0 | 0 | 106 | |
| Carabus modestulus | CaraMod | 0 | 84 | 84 | 0 | 88 | 88 | 0 | 192 | 192 | 364 | |
| Carabus gigoloides | CaraGig | 0 | 267 | 267 | 0 | 329 | 329 | 0 | 7 | 7 | 603 | |
| Calosoma | Calosoma lugens | CaloLug | 0 | 11 | 11 | 0 | 0 | 0 | 2 | 1 | 3 | 14 |
| Calosoma anthrax | CaloAnt | 0 | 41 | 41 | 0 | 7 | 7 | 0 | 11 | 11 | 59 | |
| Calosoma chinense | CaloChi | 1 | 2 | 3 | 0 | 0 | 0 | 0 | 0 | 0 | 3 | |
| Cymindis | Cymindis binotata | CymiBin | 19 | 0 | 19 | 8 | 1 | 9 | 9 | 3 | 12 | 3 |
| Cymindis daimio | CymiDai | 0 | 0 | 0 | 0 | 2 | 2 | 1 | 0 | 1 | 10 | |
| Corsyra | Corsyra fusula | CorsFus | 3 | 0 | 3 | 4 | 0 | 4 | 3 | 0 | 3 | 3 |
| Dolichus | Dolichus halensis | DoliHal | 0 | 3 | 3 | 0 | 0 | 0 | 0 | 0 | 0 | 15 |
| Harpalus | Harpalus lumbaris | HarpLum | 11 | 0 | 11 | 2 | 1 | 3 | 1 | 0 | 1 | 1329 |
| Poecillus | Poecillus gebleri | PoecGeb | 0 | 1145 | 1145 | 0 | 158 | 158 | 5 | 21 | 26 | 687 |
| Poecillus fortipes | PoecFor | 0 | 552 | 552 | 0 | 53 | 53 | 3 | 79 | 82 | 411 | |
| Pseudotaphoxenus | Pseudotaphoxenus rugipennis | PesuRug | 3 | 307 | 310 | 0 | 62 | 62 | 3 | 36 | 39 | 123 |
| Pseudotaphoxenus mongolicus | PesuMon | 23 | 54 | 77 | 13 | 1 | 14 | 25 | 7 | 32 | 466 | |
| Reflexisphodrus | Reflexisphodrus reflexipennis | ReflRef | 0 | 368 | 368 | 0 | 78 | 78 | 0 | 20 | 20 | 133 |
| Zabrus | Zabrus potanini | ZabrPot | 1 | 115 | 116 | 0 | 8 | 8 | 4 | 5 | 9 | 30 |
| Total | 338 | 6535 | 6873 | 170 | 1511 | 1681 | 136 | 1087 | 1223 | 9767 | ||
| Variables | Code | Unit | Maximum Value | Minimum Value | Remark |
|---|---|---|---|---|---|
| Spatial data: | |||||
| Latitude | LAT | ° | 38.03 | 36.2 | Converted to WGS 1984 |
| Longitude | LON | ° | 107.08 | 105.6 | Converted to WGS 1984 |
| Geographical data: | |||||
| Altitude range | Alt | km | 2804 | 1411 | GPS |
| Climatic data: | |||||
| Annual mean temperature | TM | °C | 17.08 | 11.3 | www.worldclim.org (accessed on 1 December 2020) |
| Maximum mean temperature | T | °C | 25.24 | 17.08 | www.worldclim.org (accessed on 1 December 2020) |
| Minimum mean temperature | t | °C | 24.99 | 12.23 | www.worldclim.org (accessed on 1 December 2020) |
| Mean annual precipitation | pp | mm | 81.9 | 52.6 | www.worldclim.org (accessed on 1 December 2020) |
| Vegetation data: | |||||
| Plant biomass | PB | g/m2 | 143.79 | 17.08 | At sample site surface (1 × 1 m) |
| Plant height | PHe | cm | 71 | 11.4 | At sample site surface (1 × 1 m) |
| Plant density | PD | individuals/m2 | 125.8 | 25.31 | At sample site surface (1 × 1 m) |
| Plant coverage | PC | % | 87.75 | 21.13 | At sample site surface (1 × 1 m) |
| Plant richness | PR | individuals | 8.6 | 4.3 | At sample site surface (1 × 1 m) |
| Aboveground litter | Lit | g | 189.68 | 21.76 | At sample site surface (1 × 1 m) |
| Soil data: | |||||
| Soil moisture | SM | % | 31.67 | 2.6 | underground 10 cm |
| Soil bulk density | SBD | g/cm3 | 1.45 | 1.23 | underground 10 cm |
| Soil temperature | ST | °C | 25.5 | 9.2 | underground 10 cm |
| Soil organic matter | C | g/kg | 40.82 | 0.17 | At sample site, random sample |
| Total phosphorus | p | g/kg | 35.01 | 0 | At sample site, random sample |
| Total nitrogen | N | g/kg | 5.62 | 0.005 | At sample site, random sample |
| PH value | PH | - | 8.9 | 7.7 | At sample site, random sample |
| Variables | Code | F | p | sig |
|---|---|---|---|---|
| Full model | −5.405 | <0.0001 | *** | |
| Latitude | LAT | 5.084 | 0.00884 | ** |
| Longitude | LON | 2.198 | 0.02995 | |
| Altitude range | Alt | 1.149 | 0.21610 | - |
| Climatic data: | ||||
| Annual mean temperature | TM | −0.577 | 0.56492 | - |
| Maximum mean temperature | T | 6.106 | <0.001 | *** |
| Minimum mean temperature | t | −0.967 | 0.33581 | - |
| Mean annual precipitation | p | 2.565 | 0.01163 | * |
| Plant biomass | PB | −1.111 | 0.26935 | - |
| Plant height | PHe | −0.150 | 0.88118 | - |
| Plant density | PD | −4.449 | 0.00118 | ** |
| Plant coverage | PC | 0.338 | 0.73574 | - |
| Plant richness | PR | 0.902 | 0.36897 | - |
| Aboveground litter | Lit | 0.636 | 0.52639 | - |
| Soil moisture | SM | 0.850 | 0.39747 | - |
| Soil bulk density | SBD | 2.840 | 0.00534 | ** |
| Soil temperature | ST | 6.163 | <0.001 | *** |
| Soil organic matter | C | 1.567 | 0.12008 | - |
| Total phosphorus | P | 0.997 | 0.32098 | - |
| Total nitrogen | N | 0.741 | 0.46016 | - |
| PH value | PH | 4.963 | <0.001 | *** |
References
- Guisan, A.; Zimmermann, N.E. Predictive habitat distribution models in ecology. Ecol. Model. 2000, 135, 147–186. [Google Scholar] [CrossRef]
- Bongaarts, J.; Settele, J.; Díaz, S.; Ngo, H.T. Global Assessment Report on Biodiversity and Ecosystem Services; Intergovernmental Science-Policy Platform on Biodiversity and Ecosystem Services: Bonn, Germany, 2019. [Google Scholar]
- Cardinale, B.; Emmett Duffy, J.; Gonzalez, A.; Hooper, D.; Perrings, C.; Venail, P.; Narwani, A.; Mace, G.; Tilman, D.A.; Wardle, D.E. Biodiversity loss and its impact on humanity. Nature 2012, 486, 59–67. [Google Scholar] [CrossRef]
- Isbell, F.; Calcagno, V.; Hector, A.; Connolly, J.; Harpole, W.S.; Reich, P.B.; Scherer-Lorenzen, M.; Schmid, B.; Tilman, D.; Ruijven, J.V.; et al. High plant diversity is needed to maintain ecosystem services. Nature 2011, 477, 199–202. [Google Scholar] [CrossRef]
- Van Strien, A.J.; Van Swaay, C.A.M.; Willy, T.F.H.; Van Strien-Van Liempt, W.T.; Poot, M.J.M.; WallisDeVries, M.F. Over a century of data reveal more than 80% decline in butterflies in the Netherlands. Biol. Conserv. 2019, 234, 116–122. [Google Scholar] [CrossRef]
- Raffini, F.; Bertorelle, G.; Biello, R.; D’Urso, G.; Russo, D.; Bosso, L. Supplementary Materials—From Nucleotides to Satellite Imagery: Approaches to Identify and Manage the Invasive Pathogen Xylella fastidiosa and Its Insect Vectors in Europe. Sustainability 2020, 12, 4508. [Google Scholar] [CrossRef]
- Vila-Viosa, C.M.; Arenas-Castro, S.; Marcos, B.; Honrado, J.; Gonalves, J. Combining Satellite Remote Sensing and Climate Data in Species Distribution Models to Improve the Conservation of Iberian White Oaks (Quercus L.). Int. J. Geo-Inf. 2020, 9, 735. [Google Scholar] [CrossRef]
- Leathwick, J.R. Incorporating the effects of inter-specific competition when modelling species distributions at landscape scales. Biodivers. Conserv. 2002, 11, 2177–2187. [Google Scholar] [CrossRef]
- Lucas, F.; Abraham, E.G.; Isabelle, L.; Bernadette, J.; Gatan, L. A generic individual-based model can predict yield, nitrogen content, and species abundance in experimental grassland communities. J. Exp. Bot. 2018, 70, 2491–2504. [Google Scholar]
- Pozsgai, G.; Baird, J.; Littlewood, N.; Pakeman, R. Phenological changes of the most commonly sampled ground beetle (Coleoptera: Carabidae) species in the UK environmental change network. Int. J. Biometeorol. 2018, 62, 1063–1074. [Google Scholar] [CrossRef]
- Rainio, J.; Niemel, J. Ground beetles (Coleoptera: Carabidae) as bioindicators. Biodivers. Conserv. 2003, 12, 487–506. [Google Scholar] [CrossRef]
- Massaloux, D.; Sarrazin, B.; Roume, A.; Tolon, V.; Wezel, A. Complementarity of grasslands and cereal fields ensures carabid regional diversity in French farmlands. Biodivers. Conserv. 2020, 29, 2861–2882. [Google Scholar] [CrossRef]
- Szabolcs, L.; Eszter, D.; Tibor, M.; Bazartseren, B. Species Richness Responses to Structural or Compositional Habitat Diversity between and within Grassland Patches: A Multi-Taxon Approach. PLoS ONE 2016, 11, e0149662. [Google Scholar]
- Sánchez-Bayo, F.; Wyckhuys, K.A.G. Worldwide decline of the entomofauna: A review of its drivers. Biol. Conserv. 2019, 232, 8–27. [Google Scholar] [CrossRef]
- Eyre, M.D.; Lott, D.A.; Garside, A. Assessing the potential for environmental monitoring using ground beetles (Coleoptera: Carabidae) with riverside and Scottish data. Ann. Zool. Fenn. 1996, 33, 157–163. [Google Scholar]
- Barber, N.A.; Lamagdeleine-Dent, K.A.; Willand, J.E.; Jones, H.P.; Mccravy, K.W. Species and functional trait re-assembly of ground beetle communities in restored grasslands. Biodivers. Conserv. 2017, 26, 3481–3498. [Google Scholar] [CrossRef]
- Baselga, A. Determinants of species richness, endemism and turnover in European longhorn beetles. Ecography 2008, 31, 263–271. [Google Scholar] [CrossRef]
- Eyre, M.; Rushton, S.; Telfer, M.G.L. Investigating the relationships between the distribution of British ground beetle species (Coleoptera, Carabidae) and temperature, precipitation and altitude. J. Biogeogr. 2010, 32, 973–983. [Google Scholar] [CrossRef]
- Ribera, I.; Foster, G.N.; Vogler, A.P. Does habitat use explain large scale species richness patterns of aquatic beetles in Europe? Ecography 2003, 26, 145–152. [Google Scholar] [CrossRef]
- Saska, P.; Martinkova, Z.; Honek, A. Temperature and rate of seed consumption by ground beetles (Carabidae). Biol. Control 2010, 52, 91–95. [Google Scholar] [CrossRef]
- Tsafack, N.; Xie, Y.Z.; Wang, X.P.; Fattorini, S. Influence of Climate and Local Habitat Characteristics on Carabid Beetle Abundance and Diversity in Northern Chinese Steppes. Insects 2020, 11, 19. [Google Scholar] [CrossRef] [PubMed]
- Marques, D.D.S.; Costa, P.G.; Souza, G.M.; Cardozo, J.G.; Barcarolli, I.F.; Bianchini, A. Selection of biochemical and physiological parameters in the croaker Micropogonias furnieri as biomarkers of chemical contamination in estuaries using a generalized additive model (GAM). Sci. Total Environ. 2019, 647, 1456–1467. [Google Scholar] [CrossRef]
- Lu, Y.; Fu, B.; Wei, W.; Yu, X.; Sun, R. Major Ecosystems in China: Dynamics and Challenges for Sustainable Management. Environ. Manag. 2011, 48, 13–27. [Google Scholar] [CrossRef] [PubMed]
- Lohr, C.A.; Hone, J.; Bode, M.; Dickman, C.R.; Wenger, A.; Pressey, R.L. Modeling dynamics of native and invasive species to guide prioritization of management actions. Ecosphere 2017, 8, e01822. [Google Scholar] [CrossRef]
- Hang, J.; Shi, Y.; Liu, W.; He, D.H. Diversity of ground-dwelling beetles (Coleoptera) in restored habitats in the hill and gully area of Loess Plateau, Ningxia Hui Autonomous Region. Biodivers. Sci. 2014, 22, 516–526. [Google Scholar]
- Tsafack, N.; Rebaudo, F.; Wang, H.; Nagy, D.; Xie, Y.Z.; Wang, X.P.; Fattorini, S. Carabid community structure in northern China grassland ecosystems: Effects of local habitat on species richness, species composition and functional diversity. PeerJ 2019, 6, e2197. [Google Scholar] [CrossRef]
- Bai, L.; Ren, G.D. Diversity and Geographic Distribution of Beetles in Ningxia of China. Acta Agric. Boreali Sinica 2015, 24, 133–140. [Google Scholar]
- Wei, S.H.; Huang, W.G.; Zhu, M.M.; Gao, L.Y.; Wang, Y.; Zhang, R.; Zhao, Z.H. The asymmetric responses of carabid beetles to steppe fragmentation in Northwest China. Glob. Ecol. Conserv. 2020, 23, e01058. [Google Scholar] [CrossRef]
- He, Q.; Wang, X.P.; Yang, G.J. Species diversity of carabid beetles in desert-steppe in Yanchi of Ningxia, China. Acta Ecol. Sinica 2011, 31, 923–932. [Google Scholar]
- Liu, Y.; Yu, Z.; Wang, C.; Li, L.; Chang, H. The Diversity of Ground-dwelling Beetles at Cultivated Land and Restored Habitats on the Bashang Plateau. Acta Ecol. Sinica 2011, 31, 465–473. [Google Scholar]
- Li, X.; Liu, Y.; Duan, M.; Yu, Z.; Axmacher, J. Different response patterns of epigaeic spiders and carabid beetles to varying environmental conditions in fields and semi-natural habitats of an intensively cultivated agricultural landscape. Agric. Ecosyst. Environ. 2018, 264, 54–62. [Google Scholar] [CrossRef]
- Niemela, J. Carabid beetles (Coleoptera: Carabidae) and habitat fragmentation: A review. Eur. J. Entomol. 2001, 98, 127–132. [Google Scholar] [CrossRef]
- Kromp, B. Carabid beetles in sustainable agriculture: A review on pest control efficacy, cultivation impacts and enhancement. Agric. Ecosyst. Environ. 1999, 174, 187–228. [Google Scholar] [CrossRef]
- Wei, S.H.; Ma, L.J.; Bai, L.; Zhang, K.Y.; Zhang, R.; Gao, L.Y.; Wang, Y.; Zhu, M.M.; Huang, W.G. Preliminary Studies on Species Diversity of Beetles in Temperate Grassland and their Value as Bioindicators. J. Environ. Entomol. 2017, 39, 1287–1298. [Google Scholar]
- Benito, B.M.; Cayuela, L.; Albuquerque, F.S. The impact of modelling choices in the predictive performance of richness maps derived from species distribution models: Guidelines to build better diversity models. Methods Ecol Evol. 2013, 4, 327–335. [Google Scholar] [CrossRef]
- Bertolino, S.; Sciandra, C.; Bosso, L.; Russo, D.; Lurz, P.W.W.; Di Febbraro, M. Spatially explicit models as tools for implementing effective management strategies for invasive alien mammals. Mamm. Rev. 2020, 50, 187–199. [Google Scholar] [CrossRef]
- Cerrejón, C.; Valeria, O.; Mansuy, N.; Barbé, M.; Fenton, N.J. Predictive mapping of bryophyte richness patterns in boreal forests using species distribution models and remote sensing data. Ecol. Indic. 2020, 119, 106826. [Google Scholar] [CrossRef]
- Guillera-Arroita, G.; Lahoz-Monfort, J.J.; Elith, J.; Gordon, A.; Kujala, H.; Lentini, P.E.; Mccarthy, M.A.; Tingley, R.; Wintle, B.A. Is my species distribution model fit for purpose? Matching data and models to applications. Glob. Ecol. Biogeogr. 2015, 24, 276–292. [Google Scholar] [CrossRef]
- Mateo, R.G.; Felicisimo, A.M.; Munoz, J. Species distributions models: A synthetic revision. Rev. Chil. Hist. Nat. 2011, 84, 217–240. [Google Scholar] [CrossRef]
- Lobo, J.M.; Lumaret, J.R.P. Modelling the species richness distribution for French AphodiN1ae (Coleoptera, ScarabaeoN1ea). Ecography 2010, 27, 145–156. [Google Scholar] [CrossRef]
- Colwell, R.K.; Gotelli, N.J.; Ashton, L.A.; Beck, J.; Brehm, G.; Fayle, T.M.; Fiedler, K.; Forister, M.L.; Kessler, M.; Kitching, R.L. Midpoint attractors and species richness: Modelling the interaction between environmental drivers and geometric constraints. Ecol. Lett. 2016, 19, 1009–1022. [Google Scholar] [CrossRef]
- Jiang, Y.; De Bie, C.A.J.M.; Wang, T.J.; Skidmore, A.K.; Liu, X.H.; Song, S.S.; Shao, X.M. Hyper-temporal remote sensing helps in relating epiphyllous liverworts and evergreen forests. J. Veg. Sci. 2013, 24, 214–226. [Google Scholar] [CrossRef]
- Lehmann, A.; Overton, J.M.; Leathwick, J.R. GRASP: Generalized regression analysis and spatial prediction. Ecol. Model. 2002, 160, 165–183. [Google Scholar] [CrossRef]
- Kang, L.; Han, X.; Zhang, Z.; Sun, O.J. Grassland ecosystems in China: Review of current knowledge and research advancement. Philos. Trans. R. Soc. B 2007, 362, 997–1008. [Google Scholar] [CrossRef] [PubMed]
- Heikkinen, R.K.; Neuvonen, S. Species richness of vascular plantsin the subarctic landscape of northern Finland: Modelling relationships to the environment. Biodiver. Conserv. 1997, 6, 1181–1201. [Google Scholar] [CrossRef]
- Bozdogan, T. Akaike’s information criterionand recent developments in information complexity. J. Math. Psychol. 2000, 44, 62–91. [Google Scholar] [CrossRef] [PubMed]
- Hastie, T.; Tibshirani, R. Generalized Additive Models; Chapman & Hall/CRC: London, UK, 2006; p. 335. [Google Scholar]
- Austin, M.P.; Meyers, J.A. Current approaches to modelling the environmental niche of eucalypts: Implication for management of forest biodiversity. Forest Ecol. Manag. 1996, 85, 95–106. [Google Scholar] [CrossRef]
- Guisan, A.; Edwards, T.C.; Hastie, T. Generalized linear and generalized additive models in studies of species distributions: Setting the scene. Ecol. Model. 2002, 157, 89–100. [Google Scholar] [CrossRef]
- Kosicki, J.Z. Generalised Additive Models and Random Forest Approach as effective methods for predictive species density and functional species richness. Environ. Ecol. Stat. 2020, 27, 273–292. [Google Scholar] [CrossRef]
- Carrasco, L.; Mashiko, M.; Toquenaga, Y. Application of random forest algorithm for studying habitat selection of colonial herons and egrets in human-influenced landscapes. Ecol. Res. 2014, 29, 483–491. [Google Scholar] [CrossRef]
- Vorpah, P.; Elsenbeer, H.; Märker, M.; Schröder, B. How can statistical models help to determine driving factors of landslides? Ecol. Model. 2012, 239, 27–39. [Google Scholar] [CrossRef]
- Burnhan, K.P.; Anderson, D.R. Model selection and multi-model inference: A practical Information-theoretic approach. Technometrics 2002, 45, 181. [Google Scholar]
- Potts, S.E.; Rose, K.A. Evaluation of GLM and GAM for estimating population indices from fishery independent surveys. Fish. Res. 2018, 208, 167–178. [Google Scholar] [CrossRef]
- Chiang, A.Y. Generalized Additive Models: An Introduction with R. Technometrics 2012, 49, 360–361. [Google Scholar] [CrossRef]
- Lobo, J.M.; Lumaret, J.P.; Jay-Robert, P. Modelling the Species Richness Distribution of French Dung Beetles (Coleoptera, Scarabaeidae) and Delimiting the Predictive Capacity of Different Groups of Explanatory Variables. Global Ecol. Biogeogr. 2002, 11, 265–277. [Google Scholar]
- Kotze, D.J.; Brandmayr, P.; Casale, A.; Emmanuelle, D.R.; Dekoninck, W.; Koivula, M.J.; Lövei, G.L.; Mossakowski, D.; Noordijk, J.; Paarmann, W.; et al. Forty years of carabid beetle research in Europe—From taxonomy, biology, ecology and population studies to bioindication, habitat assessment and conservation. ZooKeys 2011, 100, 55–148. [Google Scholar] [CrossRef] [PubMed]
- Kosicki, J.Z. Should topographic metrics be considered when predicting species density of birds on a large geographical scale? A case of Random Forest approach. Ecol. Model. 2017, 349, 76–85. [Google Scholar] [CrossRef]
- Magura, T.; Elek, B.T. Diversity and composition of carabids during a forestry cycle. Biodiver. Conserv. 2003, 12, 73–85. [Google Scholar] [CrossRef]
- Yang, Y.; Dou, Y.; An, S. Environmental driving factors affecting plant biomass in natural grassland in the Loess Plateau, China. Ecol. Indic. 2017, 82, 250–259. [Google Scholar] [CrossRef]
- Niemela, J.; Haila, Y.; Halme, E.; Pajunen, T.; Puntilla, P. Small scale heterogeneity in the spatial distribution of carabid beetles in the southern Finnish taiga. J. Biogeogr. 1992, 19, 173–181. [Google Scholar] [CrossRef]
- Yang, G.J.; Wang, M.; Yang, Y.; Li, X.; Wang, X.P. Distribution patterns and environmental interpretation of beetle species richness in Helan Mountain of northern China. Biodiver. Sci. 2019, 27, 1309–1319. [Google Scholar]
- Wang, Y.; Shi, X.; Yang, G.J.; Jia, L. Beetle species diversity distribution patterns and its environmental associations in Ningxia in Northwest China. Chin. J. Ecol. 2020, 39, 3738–3747. [Google Scholar]
- Fattorini, S. Beetle Species–Area Relationships and Extinction Rates in Protected Areas. Insects 2020, 11, 646. [Google Scholar] [CrossRef]
- Uzman, D.; Entling, M.H.; Leyer, I.; Reineke, A. Mutual and Opposing Responses of Carabid Beetles and Predatory Wasps to Local and Landscape Factors in Vineyards. Insects 2020, 11, 746. [Google Scholar] [CrossRef]
- Tong, Y.J.; Yang, H.D.; Jenkins Shaw, J.; Yang, X.K.; Bai, M. The Relationship between Genus/Species Richness and Morphological Diversity among Subfamilies of Jewel Beetles. Insects 2021, 12, 24. [Google Scholar] [CrossRef]
- Thacker, J.R.M. Carabidologists and fragmented habitats. Trends Ecol. Evol. 1996, 11, 103–104. [Google Scholar] [CrossRef]
- Pineda, E.; Lobo, J.M. Assessing the accuracy of species distribution models to predict amphibian species richness patterns. J. Anim. Ecol. 2009, 78, 182–190. [Google Scholar] [CrossRef]
- Fung, T.; Verma, S.; Chisholm, R. Probability distributions of extinction times, species richness, and immigration and extinction rates in neutral ecological models. J. Theor. Biol. 2020, 485, 110051. [Google Scholar] [CrossRef] [PubMed]


| Model | GLM | GAM | |||||
|---|---|---|---|---|---|---|---|
| Variables | Deviance Residual | Df. Residual Deviance | F | p | df | F | p |
| Latitude | 11.53 | 148.67 | 5.872 | 0.635 | 1 | 1.436 | 0.23360 |
| Maximum mean temperature | 3.35 | 144.17 | 6.725 | 0.005 *** | 3.734 | 5.336 | 0.00060 *** |
| Mean annual precipitation | 11.2 | 137.47 | 0.094 | 0.925 | 6.071 | 9.013 | <0.05 * |
| Plant density | 9.67 | 138.05 | −2.406 | 0.016 * | 5.861 | 0.773 | 0.49420 |
| Soil bulk density | 6.45 | 117.9 | 0.465 | 0.465 | 6.428 | 4.333 | 0.03988 |
| Soil temperature | 29.42 | 137.87 | 1.967 | 0.049 * | 1 | 3.285 | 0.00499 *** |
| PH value | 18.43 | 106.27 | 5.660 | <0.001 *** | 1 | 1.486 | 0.22563 |
| AIC | 609.54 | 598.04 | |||||
| R2 | 0.682 | 0.774 | |||||
| p-value | <0.001 | <0.001 | |||||
| correlation coefficient | 0.907 | 0.923 | |||||
| Environmental Factor | df | F | Adjust the Fit Factor (R2) | Generalized Cross Validation (GCV) | Deviance Explained (%) |
|---|---|---|---|---|---|
| p | 8.991 | <0.001 | 0.727 | 0.073 | 74.7% |
| T | 8.999 | <0.001 | 0.694 | 0.08 | 71.6% |
| ST | 8.626 | <0.001 | 0.455 | 0.1449 | 49% |
| p+T | 8.856 | <0.001 | 0.729 | 0.0737 | 75.2% |
| p+ST | 8.991 | <0.001 | 0.753 | 0.066 | 77.3% |
| T+ST | 8.981 | <0.001 | 0.758 | 0.068 | 78.5% |
| p+T+ST | 8.689 | <0.001 | 0.774 | 0.062 | 79.8% |
Publisher’s Note: MDPI stays neutral with regard to jurisdictional claims in published maps and institutional affiliations. |
© 2021 by the authors. Licensee MDPI, Basel, Switzerland. This article is an open access article distributed under the terms and conditions of the Creative Commons Attribution (CC BY) license (http://creativecommons.org/licenses/by/4.0/).
Share and Cite
Liu, X.; Wang, H.; He, D.; Wang, X.; Bai, M. The Modeling and Forecasting of Carabid Beetle Distribution in Northwestern China. Insects 2021, 12, 168. https://doi.org/10.3390/insects12020168
Liu X, Wang H, He D, Wang X, Bai M. The Modeling and Forecasting of Carabid Beetle Distribution in Northwestern China. Insects. 2021; 12(2):168. https://doi.org/10.3390/insects12020168
Chicago/Turabian StyleLiu, Xueqin, Hui Wang, Dahan He, Xinpu Wang, and Ming Bai. 2021. "The Modeling and Forecasting of Carabid Beetle Distribution in Northwestern China" Insects 12, no. 2: 168. https://doi.org/10.3390/insects12020168
APA StyleLiu, X., Wang, H., He, D., Wang, X., & Bai, M. (2021). The Modeling and Forecasting of Carabid Beetle Distribution in Northwestern China. Insects, 12(2), 168. https://doi.org/10.3390/insects12020168