Article

Synthesis of a Lubricant to Mimic the Biorheological Behavior of Osteoarthritic and Revision Synovial Fluid

1
Institute of Materials and Joining Technology, Otto-von-Guericke University, 39106 Magdeburg, Germany
2
Department of Orthopaedic Surgery, Otto-von-Guericke University, 39106 Magdeburg, Germany
3
Institute of Machine Elements and Tribology, Otto-von-Guericke University, 39106 Magdeburg, Germany
*
Author to whom correspondence should be addressed.
Lubricants 2021, 9(9), 87; https://doi.org/10.3390/lubricants9090087
Submission received: 9 August 2021 / Revised: 19 August 2021 / Accepted: 23 August 2021 / Published: 1 September 2021
(This article belongs to the Special Issue Green Tribology: New Insights toward a Sustainable World)

Abstract

:
The rheological properties of synovial fluid (SF) are essential for the friction behavior and wear performance of total joint replacements. Standardized in vitro wear tests for endoprosthesis recommend diluted calf serum, which exhibits substantial different rheological properties compared to SF. Therefore, the in vitro test conditions do not mimic the in vivo conditions. SF samples from osteoarthritis knee patients and patients undergoing knee endoprosthesis revision surgery were compared biochemically and rheologically. The flow properties of SF samples were compared to synthetic fluid constituents, such as bovine serum albumin (BSA) and hyaluronic acid (HA). Interestingly, HA was identified as a significant contributor to shear-thinning. Using the acquired data and mathematical modelling, the flow behavior of human SF was modelled reliably by an adapted adjustment of biorelevant fluid components. Friction tests in a hard/soft bearing (ceramic/UHMWPE) demonstrated that, in contrast to serum, the synthetic model fluids generate a more realistic friction condition. The developed model for an SF mimicking lubricant is recommended for in vitro wear tests of endoprostheses. Furthermore, the results highlight that simulator tests should be performed with a modified lubricant considering an addition of HA for clinically relevant lubrication conditions.

1. Introduction

Several studies have emphasized the dominant effect of the lubricant on the tribological performance of endoprosthesis in vivo [1,2,3,4]. Joint simulators are used to test novel implant designs, improve the wear resistance of implants, and explore in vivo wear mechanisms. These tests are normed for knee-joint prostheses in the ISO standard 14243-1 and ASTM test method F1715-96 [5,6]. Both standards require water-diluted calf serum (CS) as a lubricant for the test. The lubricant in the test contains antimicrobial reagents to prevent contamination, and the protein concentration has to be adjusted [5]. Nevertheless, this standard allows great variations because the commercial available serum batches vary in their composition, with regard to protein content and salt concentration, and due to the type and amount of additives that can be added [7]. This leads to an experimental variability that restricts inter-laboratory reproducibility of these tests [8]. Furthermore, wear rates and observed failure modes in the simulator test do not always correlate with in vivo occurring damage patterns [9]. In order to identify critical implants in simulator tests, it is necessary to harmonize the in vitro test setups and to mimic in vivo conditions.
One key problem of the current in vitro simulator testing is that diluted CS does not mimic the in vivo situation due to diverging rheological properties from synovial fluid (SF). SF has very special lubricating characteristics that are closely related to the chemical composition [10,11,12]. In general, SF is a dialysate of blood plasma of the same electrolyte composition without coagulation factors. It consists of 85% water with plasma proteins (albumin, immunoglobulins, etc.), hyaluronic acid (HA), lipids, salts, enzymes, inflammatory cytokines, and a small cellular fraction of predominantly synoviocytes, monocytes, and lymphocytes [13,14]. The porous capillaries of the synovial membrane, as well as the high molecular weight of HA in the interstitial space of the synovial cells, act as a filter that generates the increased albumin content (40–70%) and albumin/globulin ratio in the range of 1.2–2.3 in comparison to blood (ratio of 0.75) [15]. The protein concentration and composition vary among the synovial joints as well as intra- and inter-individually, also depending on the health status, such as progression of osteoarthritis (OA), and joint inflammation [16,17]. The protein concentration is increased in patients with OA, as well as in patients with an endoprosthesis, due to an increased permeability of the synovial membrane [10,12,13,14,16,17,18]. The primary lubricating macromolecule in SF is HA that is secreted by B-synoviocytes of the synovial membrane [17]. HA is a high molecular weight non-sulfated glycosaminogylcan and consists of a linear polysaccharide with alternating glucuronic acid and N-acetyl-glucosamine units. The molecular weight depends on the chain length, which varies in vivo between 1–10 MDa [19]. HA binds large quantities of water. Due to this specific property, the viscoelastic behavior, which is characterized by a shear rate dependent viscosity and frequency dependent elasticity, can be explained [20,21,22]. At low shear rates, a solution with high molecular HA exhibits high viscosities and low elasticity, while it acts in an elastic way at increasing shear rates or sliding speeds [23]. This shear-thinning behavior influences the lubrication mode (boundary or fluid film) as well as the tribological properties of articulating joints [24]. The lubrication mode mediates frictional properties and can consequently be essential in reducing friction at the start of movements [24]. Although HA does not provide an interfacial lubricating effect in vitro [25,26], its presence between two tribological surfaces determines friction [27]. As shown by Bonnevie et al., the lubricating effect of HA can be described by a Stribeck-like elastoviscous transition that allows deriving effective lubricating viscosities [28]. These values and friction coefficients correlate well with an improved clinical outcome.
The viscous behavior of SF decreases with osteoarthritis, or the implantation of an endoprosthesis. Despite an increased protein concentration in SF, a similar or decreased HA content has been described in OA and patients with an endoprosthesis [12,29]. The influence of the protein concentration on the wear mechanisms has been investigated in different simulator tests [30,31]. An increased protein concentration of more than 20 g/L is associated with decreased ultrahigh molecular weight polyethylene (UHMWPE) wear [30,31,32]. Moreover, the specific protein types and their proportion, as well as the surrounding temperature, influence the friction and wear generation [2,3,31,33,34]. Different studies have focused on the development of a lubricant to mimic healthy SF. Bortel et al. evolved a synthetic fluid in a stepwise approach by adding typical reagents of native SF, such as HA and bovine serum albumin (BSA), as substitutes for albumin and immunoglobulin G (IgG). In tribological tests using UHMWPE pins against CoCrMo discs, the newly developed lubricant shows more realistic results in comparison to serum test liquid [10]. Smith et al. showed that a biopolymer blend of polysaccharides sodium alginate and gellan gum exhibits similar rheological properties to SF and lubricates the surfaces more effectively than BSA [35]. As a suitable biomimetic SF, Sava et al. demonstrated that phospholipid vesicles filled with a glycoprotein gel ideally resembled the tribological behavior of healthy SF [36].
However, there is only a limited number of studies that describe the properties of SF from joints with endoprosthesis as well as an appropriate adaption of simulator test fluids. On the one hand, the aim of this study was a rheological and tribological characterization of OA and revision SF in comparison to serum-based test fluid. On the other hand, the development of artificial SF that better mimics the rheological properties of OA and revision SF was envisaged. Therefore, the following research questions were addressed:
  • How does the composition of the SF differ among patients undergoing primary implantation due to OA and revision surgery?
  • How is the flow behavior related to changes in the chemical composition regarding protein and HA concentration?
  • How can the flow behavior of human SF be mimicked by synthetic fluids?

2. Materials and Methods

2.1. Test Fluids

A total of 18 OA patient samples were aspirated prior to implantation of primary total knee arthroplasty (OA, N = 18). In addition, 18 fluid samples were aspirated from patients before they underwent a revision surgery of a total knee arthroplasty (Rev SF, N = 18). All human samples were obtained at the Department of Orthopaedic Surgery at the Magdeburg University Hospital after given written consent. Institutional review board (IRB) approval for the study was provided by the local Ethical Committee of the Otto-von-Guericke University Medical School, Magdeburg, prior to commencement of the study (IRB No. 25_17). All SF samples were stored at −80 °C after aspiration until further use.
Hip simulator test fluid (serum) was prepared according to ISO 14243-1:2014 by diluting calf serum (BioWest, Nuaillé, France) to a protein concentration of 20 g/L, adding 10 mL/L gentamycin, 250 µg/mL amphotericin B (both p.a. Biochrom GmbH, Berlin, Germany), and 20 mM/L EDTA (Carl Roth GmbH, Karlsruhe, Germany) [5]. The used lot number of calf serum was used for hip implant tests before and generated reasonable wear rates.
In order to determine an applicable model to mimic the properties of human SF, components and compositions of synthetic SF were varied. The protein composition was modified for pure bovine serum albumin (BSA Fraktion V, AppliChem GmbH, Darmstadt, Germany) and calf serum (BioWest, Nuaillé, France) in different concentrations from 10 to 40 g/L. In addition, the HA concentration (molecular weight 1.7 × 10⁶ Da, Euro OCT Pharma GmbH, Bönen, Germany) was varied from 0.25 to 6 g/L. The influence of salts was investigated by balancing either with Ringer solution (composition: 8.6 g/L sodium chloride, 0.3 g/L potassium chloride, and 0.33 g/L calcium chloride, Fresenius Kabi AG, Bad Homburg, Germany) or with deionized water (B. Braun Melsungen AG, Melsungen, Germany). Four milliliters of each fluid sample was generated, and 44 different samples were tested (see Table A1). All test fluids were prepared in sterile conditions and stored at −80 °C until they were used for measurements.

2.2. Chemical Composition

2.2.1. Total Protein Concentration of SF

Total protein concentration was measured biochemically using a bicinchoninic acid (BCA)-containing protein assay. In this process, divalent copper ions react quantitatively with the proteins to form monovalent copper ions. In combination with BCA, these agents result in a purple colored reaction product whose absorption can be evaluated photometrically. In this study, the Pierce™ BCA protein assay kit (Thermo Scientific, Waltham, MA, USA) was applied. A BSA standard curve was included to determine the protein concentrations of the samples. The Assay was conducted as described in the manufacturer’s manual using a 96-well plate setup. SF samples were diluted 1:50 (final dilution in the well) with PBS and measured as duplets. The absorbance was measured using a Tecan Infinite 200 PRO spectrophotometer at 560 nm. The mean absorbance of the blank (PBS) was subtracted from the mean absorbance of the SF samples. Total protein concentrations were interpolated from the BSA standard curve.

2.2.2. Hyaluronic Acid Concentration in SF

An enzyme-linked immunosorbent assay (ELISA) was used to quantify levels of Hyaluronan (HA) in SF samples. This analytical detection method relies on a specific antibody that is fixed on a 96-well plate to bind the target antigen, in this case HA. A secondary antibody is given to the samples, which is previously labeled with an enzyme and then also binds to the HA antigen in the sample. A color change is initiated by a substance containing the enzyme’s substrate, which can then be detected by a photometer. The Hyaluronan Immunoassay Quantikine ELISA Kit (DHYAL0, R&D Systems Inc., Abingdon, UK) was applied. Therefore, the SF samples were diluted 1:100,000 using the assay diluent. Subsequently, the ELISA was performed as described in the manufactures’ manual. The absorbance was measured at 430 nm (Tecan Infinite 200 PRO). A HA standard curve was included, and the HA content in the SF was determined by interpolation from the standard curve.

2.3. Rheological Investigations

A rotational rheometer (MCR 502, Anton Paar, Graz, Austria) with a parallel plate system was used with a 0.2 mm gap at 30 °C to determine the rheological properties of seven OA and seven Rev SF test fluids. A minimum aspired volume of 7 mL determined the selection of the 14 fluid samples from the total study group (N = 36). The top plate (radius 25 mm, V4A) rotated on the fixed lower part. The viscosity was calculated from the measured torque. The shear rate dependence of the viscosity was measured under a logarithmic shear rate increase from 0.001 to 1000 s−1 over 500 s (Figure 1A). The retention time of one measuring point was one second. After a rest time of 5 min, each sample was measured in triplicate.

2.4. Mathematical Modelling of Flow Behavior

The flow behavior of all test samples was modelled mathematically according to the Ostwald–deWaele model for pseudo-plastic fluids according to the standard DIN 1342-3:2003-11 [37]. Therefore, shear stress, τ , is determined by a consistency factor, A , which is equal to the zero viscosity at the shear rate of 1 s−1, the shear rate, γ ˙ , and the exponential flow index, n , which considers the shear-thinning effect.
τ = A · γ ˙   n ,   ƞ = A · γ ˙ ( n 1 )
Dynamic viscosity, ƞ, is defined as the relationship between shear stress, τ , to shear rate, γ ˙ . To obtain the proper model parameters, the viscosity-shear rate curves were approximated with the bisquare-weighted least-squares method, optimized on the relevant data range γ ˙ > 1   s 1 . The parameters of the approximation were assumed to be dependent on the chemical composition of the fluid, i.e., on protein and HA content.
A = A   ( c HA ) ,   n = n   ( c pr , c HA )
For the consistency factor, A , it was assumed that it depends only on the HA concentration. This assumption is based on experimental data, which shows a much higher sensibility concerning HA content in comparison to all other tested constituents (Figures 4 and 5). In addition, it was observed that data changes rapidly in the HA axis and also behaves non-linearly in logarithmic and semi-logarithmic space. Therefore, it was decided to describe its dependence as a logistic curve, using the following equation:
A = a 1 + exp ( b · ( c HA c ) )
where parameters a ,   b , and c are usually calculated based on the maximal gradient, the amplitude of function, and the symmetry point location, respectively. In this case, this function is used as an approximation of damped exponent, because it behaves almost exponentially until c HA = 2   g / L and grows slower after that threshold point. Therefore, the parameters are calculated via the bisquare-weighted least-squares method using the approximated data.
The exponent parameter, n , is approximated as a linear function of HA concentration ( c HA ) and protein content ( c pr ) , which can be expressed as follows:
n = α · c HA + β · c pr + 1
To estimate α and β , the linear least-square method was used. It is worth mentioning that this model considers a Newton-behavior of Ringer solution as a limit case of the model liquid.
In order to mimic native flow curves by adjusting the constituents of HA and protein content, interior-point nonlinear optimization was used with the following parameters:
  • error function, which should be minimized
E ( c HA , c pr ) = ( A ( c HA ) A OA A OA ) 2 + ( n ( c HA , c pr ) n OA n OA ) 2 = E A + E n
  • gradient tolerance of tol ( | E ( c HA , c pr ) | ) = 1 × 10 6
  • variable bounds 0.0   g / L < c HA < 6.0   g / L and 0.0   g / L < c pr < 60.0   g / L
All analyses were performed using Matlab Software (Mathworks Inc., Natick, MA, USA).

2.5. Friction Measurements

A hard/soft pairing typical for joint arthroplasty was simulated in a ball-on-three plates friction test. Stribeck curves were recorded using a compartment cell in a tribometer (MCR 502 with T-PTD 200 tribology cell, Anton Paar, Graz, Austria). The test setup is illustrated in Figure 1B and resembles a hip joint, yet the joint geometry is negligible for the abstracted study of friction [38]. A Biolox®delta femoral head (CeramTec GmbH, Plochingen, Germany, r1 = 14 mm, E1 = 350 GPa, ν1 = 0.25) was tested against a specimen of ultra-high molecular weight polyethylene (UHMWPE, Chirulen® GUR 1020, ISO 5834-2, E2 = 500 MPa, v2 = 0.32). Therefore, plates with a diameter of 6 mm and a length of 6 mm were turned from UHMWPE (Ra = 1.6 µm). For one test, three UHMWPE pins were mounted in a three-point sample holder with a radial distance of 120° and an angle of 45° to the vertical plane (Figure 1B). The femoral head of zirconia toughened alumina with additives of SrO, Y2O3, and Cr2O3 (d = 28 mm, Ra = 6.3 nm ± 2.2 nm) was inserted in the measuring shaft, which rotates [36]. Then, 1.5 mL of the test fluid was filled in the sample holder. The test was started, consisting of two intervals. For the first five minutes, a normal force of 5 N was applied, resulting in a contact pressure of 9.5 MPa in each UHMWPE pin (physiological joint contact pressures for hip approximately 10 MPa [39,40] and for knee inlays, 5–21 MPa [41,42]). The system was allowed to relax at 37 °C, simulating body temperature. Then, the sliding velocity was increased logarithmically from 0.001 to 1000 mm/s at a constant normal load of 5 N, and a total of 81 data points were determined. The data point ramp was determined, decreasing logarithmically, starting with 10 to 1 s. Each data point was calculated from the individual values over 10 s. All tests were carried out in triplicate, always changing the contact points of the femoral head against new, unused UHMWPE pins with a new fluid charge.

2.6. Statistical Analysis

The descriptive data are given as median or mean ± standard deviation (SD). Differences between the study groups were investigated using either a one-way analysis of variance (ANOVA) as parametric method with a Holm–Šidák post-hoc test [43]. For non-parametric data, a Kruskal–Wallis test [44] was applied, together with a Dunn’s test to identify the explicit groups [45]. For all statistical tests, the level of significance was set to significant at p < 0.05 (*), very significant at p < 0.01 (**), extremely significant at p < 0.001 (***) and at p < 0.0001 (****). The statistical analysis was performed using Origin software 2018 (OriginLab Corporation, Northampton, MA, USA).

3. Results

3.1. Patient Data of Human Samples

The aspirated SF volumes from the human knee joints varied between 2 to 11 mL. All tested SF exhibited a yellow transparent color and were free from blood contamination. The indication for the primary implantation of a knee arthroplasty was osteoarthritis. The primary human OA samples were classified according to the Kellgren–Lawrence score (KLS), which grades the severity of OA according to radiographic features, such as presence of osteophytes, joint space narrowing, and subchondral sclerosis, in five groups: from non (grade 0), light (grade 1), minimal (grade 2), moderate (grade 3), to severe (grade 4) [46]. The patient characteristics are listed in Table 1 along with as the demographic patient data.
Regarding the Rev SF samples, all TKA exhibited an ultra-high molecular weight polyethylene (UHMWPE) bearing that was paired with a femur component of Co-28Cr-6Mo alloy. The tibial component was either made of Ti-6Al-4V alloy (N = 10) or Co-28Cr-6Mo alloy (N = 8). The mean implantation time was 8.5 ± 6.4 years and ranged from 1 to 17 years. The manufacturers included the companies Link, Centerpulse, Sulzer Medica, Zimmer, Peter Brehm, and Mathys. The reason for revision surgery was sepsis (N = 9) or aseptic implant loosening (N = 9) that was accompanied by very severe inlay wear on both condyle sides (N = 4) or mild inlay wear (N = 5).

3.2. Concentration of Proteins and HA

The total protein and HA concentrations for the analyzed SF are listed in Table 2. The range among the investigated groups of primary and revision surgery shows large inter-individual differences, as shown by the standard deviations.
The mean protein content of revision SF is increased by 6.3% compared to OA SF. HA concentration varied inter-individually in a range between 0.2 g/L and 5.9 g/L, but not between the groups. Based on the limited number of samples, the influence of patient demographics, such as gender, age or Kellgren–Lawrence score, could not be evaluated.

3.3. Rheological Properties

The influence of the applied shear-rate on the viscosities of 14 selected SF are illustrated as flow curves in Figure 2. In contrast to human SF, simulator test serum with a protein concentration of 20 g/L shows a decreased viscosity at all applied shear rates from 0.001 to 1000 s−1. However, human OA and Rev SF exhibit a pronounced shear-thinning with increasing shear rates; diluted serum demonstrates a pseudo-Newtonian behavior at a shear rate above 50 s−1. The viscosity of human SF is reduced by a maximum factor of 10,000 at the highest shear rate in comparison to zero viscosity. With increasing shear rates (>2 s−1), the viscosity of human SF from OA patients and revision SF converge in similar magnitudes.
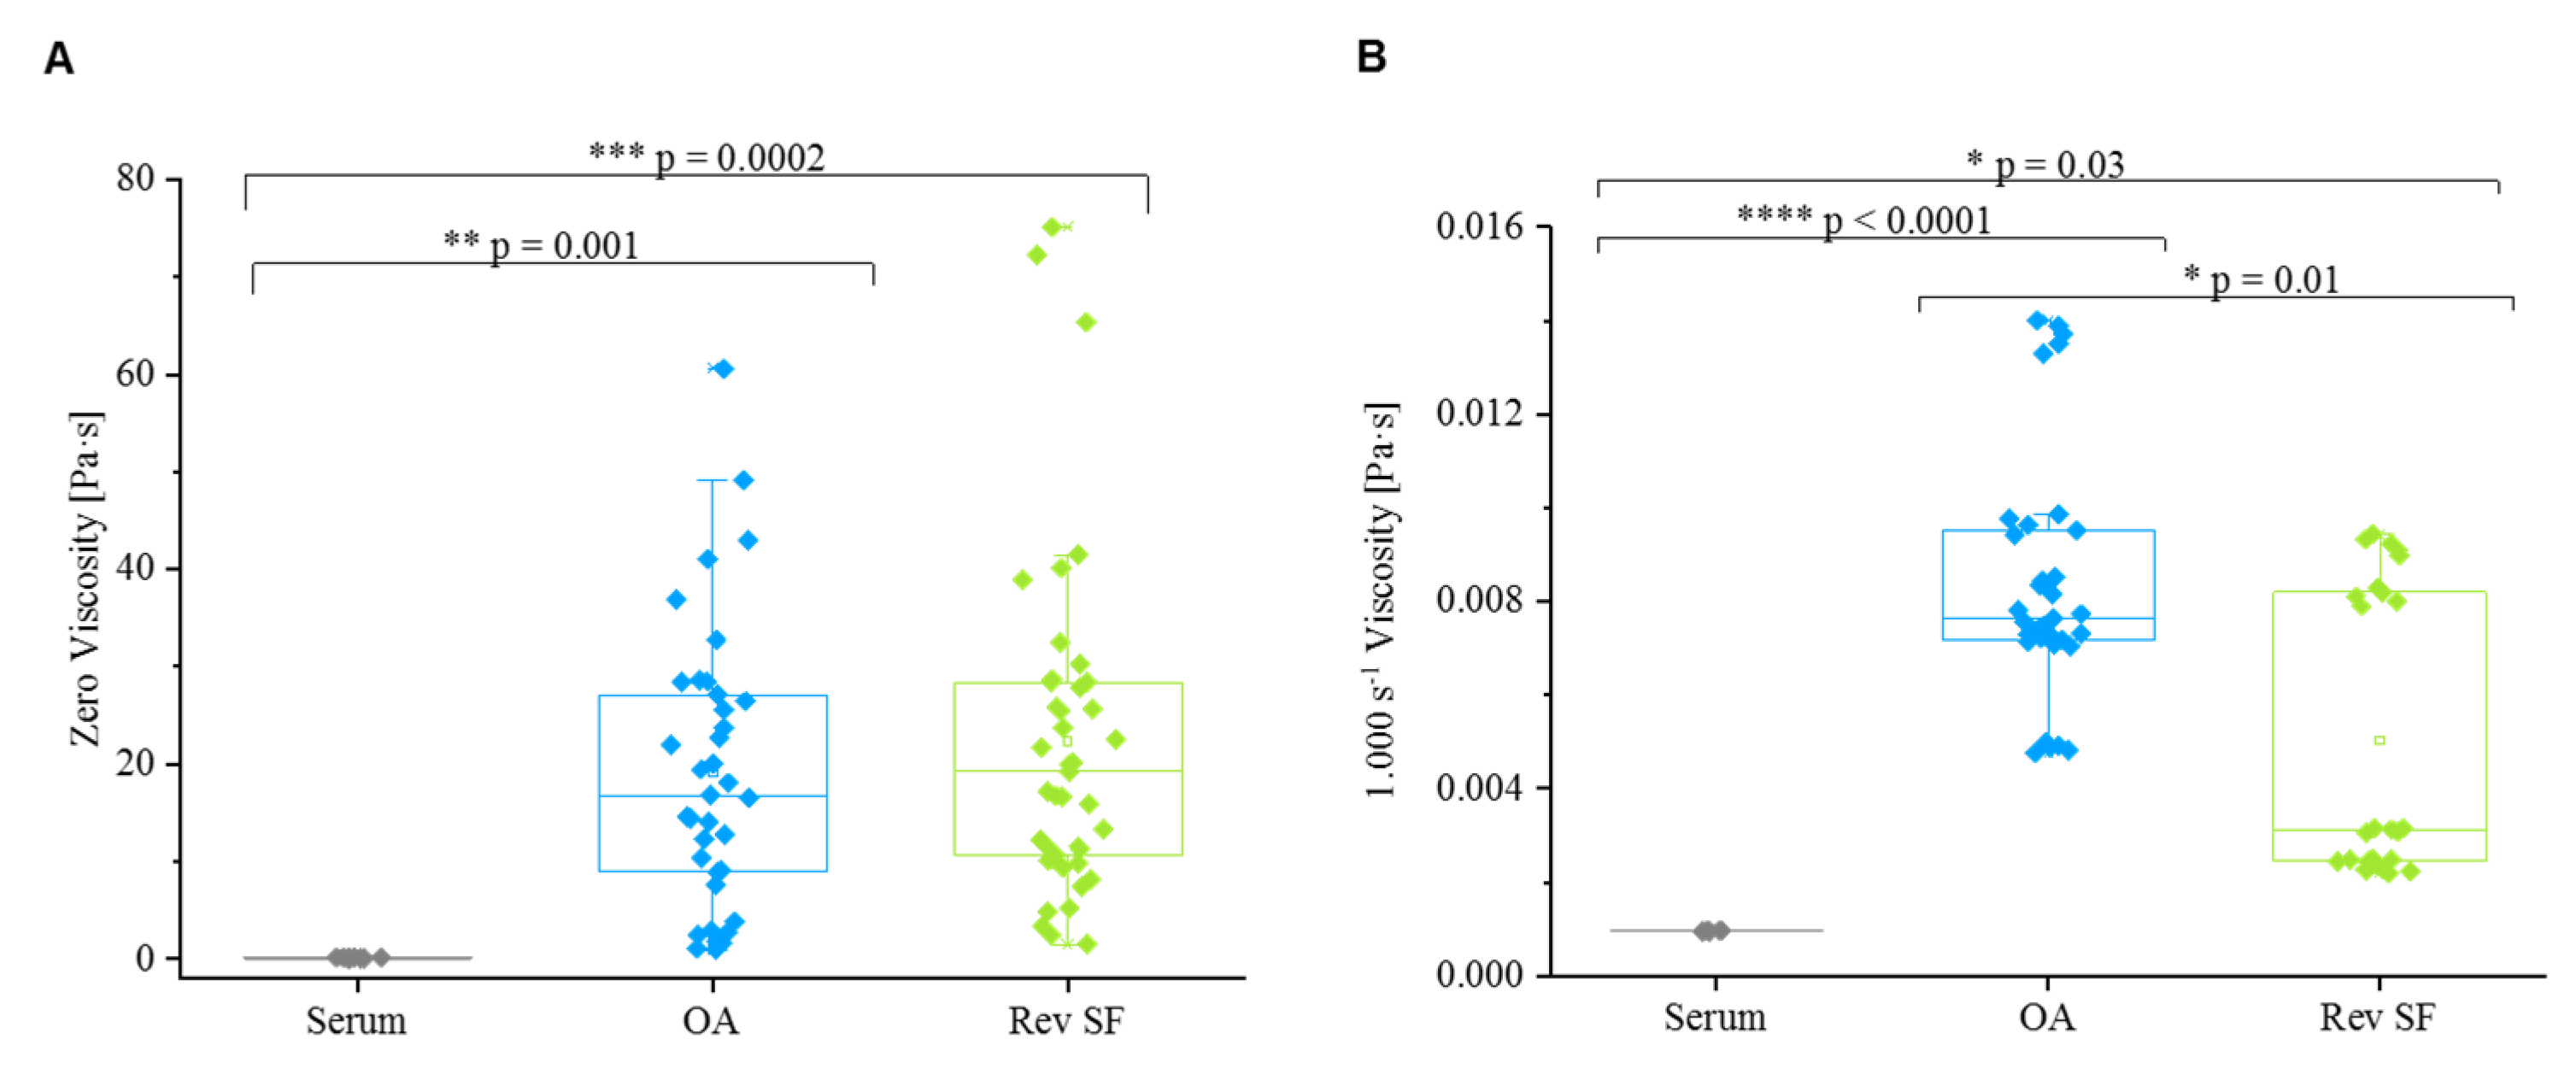
In addition, zero-viscosity was determined at a shear rate of 0.001 s−1 and compared to the viscosities at a shear-rate of 1000 s−1. The results are illustrated in Figure 3. As already indicated by the graphs in Figure 2, serum exhibits a significantly lower viscosity in comparison to the human SF samples. It can be observed that human OA and revision SF samples exhibit a wide inter-individual variation in terms of viscosity, ranging from 0.002 to 0.013 Pa·s at 1000 s−1.
As the human SF was markedly different in several rheological parameters compared to serum, the effect of the chemical composition of proposed biorelevant model fluids on the rheological properties was investigated. Therefore, the flow curves of relevant fluid components with variation of protein composition and content, HA, and physiological salt concentration were determined and are shown in Figure 4.
Standardized wear tests for knee endoprostheses require the use of diluted calf serum [5]. The comparison of flow behavior between the standard model liquids, serum, or BSA (Figure 4A) reveals a similar behavior. Different protein concentrations in serum and BSA show higher variation at smaller shear rate, γ ˙ < 1 s−1, but behave similar at higher shear rates. This fact demonstrates that an increase in protein content also slightly increases the viscosity for serum and BSA. For the tested protein concentrations, Ringer solution, as a physiological source of salt, as a diluent for BSA in comparison to water diluted serum, does not influence the flow behavior (Figure 4B). The influence of a Ringer solution in combination with HA was measured and is shown in Figure 4C. For very low shear rates, γ ˙ < 0.1 s−1, a physiological salt condition simulated by the Ringer solution seems to slightly deteriorate the shear-thinning effect of the model liquids with 2 g/L HA. Interestingly for an increased shear rate, γ ˙ > 1 s−1, the shear-thinning effect is reduced for Ringer diluted HA model liquids in comparison to water diluted HA model liquids. This marked influence can only be seen in the presence of HA and not for fluids without HA. As illustrated in Figure 4D, HA exhibits the biggest impact on the flow curves and accordingly represents the main parameter for the flow behavior of any model fluid. An increased HA concentration increases the zero viscosity, raises the curve magnitudes, and reduces the slop of the flow curve. For the physiological relevant HA concentrations (0–6 g/L), the viscosity increases with increasing HA content by up to 100-fold. Consequently, HA was identified as the key parameter to model the rheological behavior of synthetic SF.

3.4. Modelling of Flow Behavior

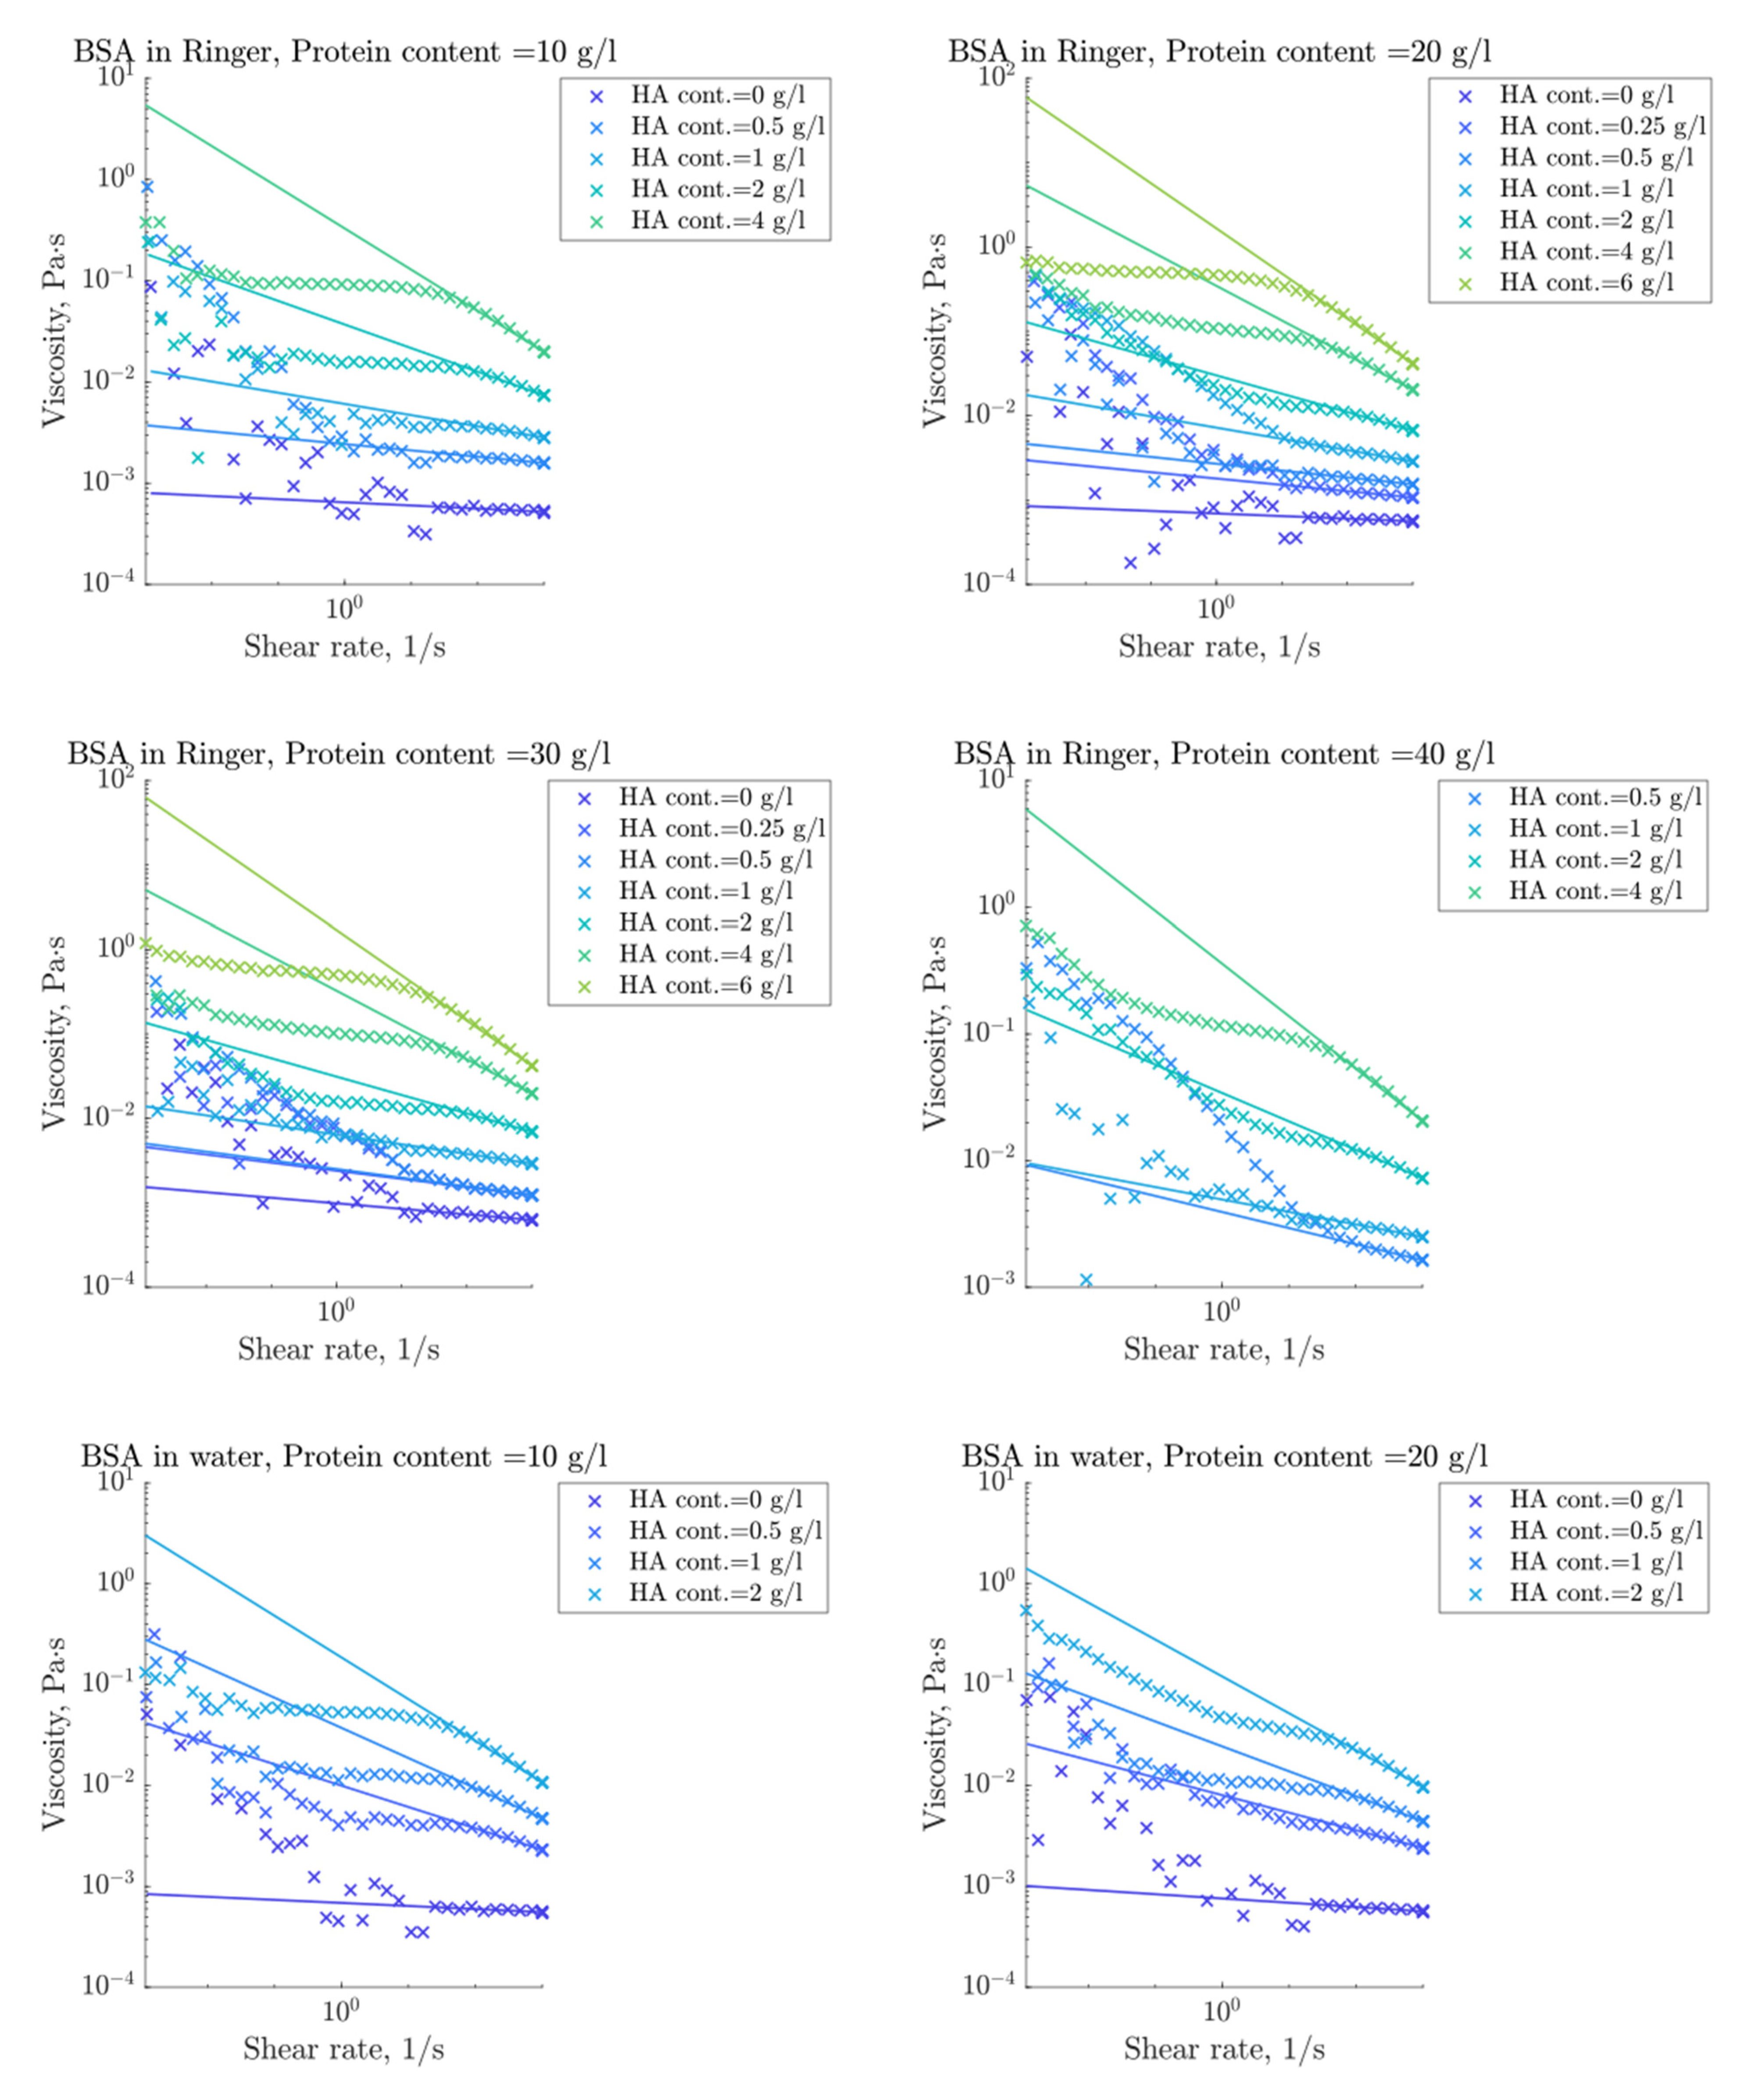
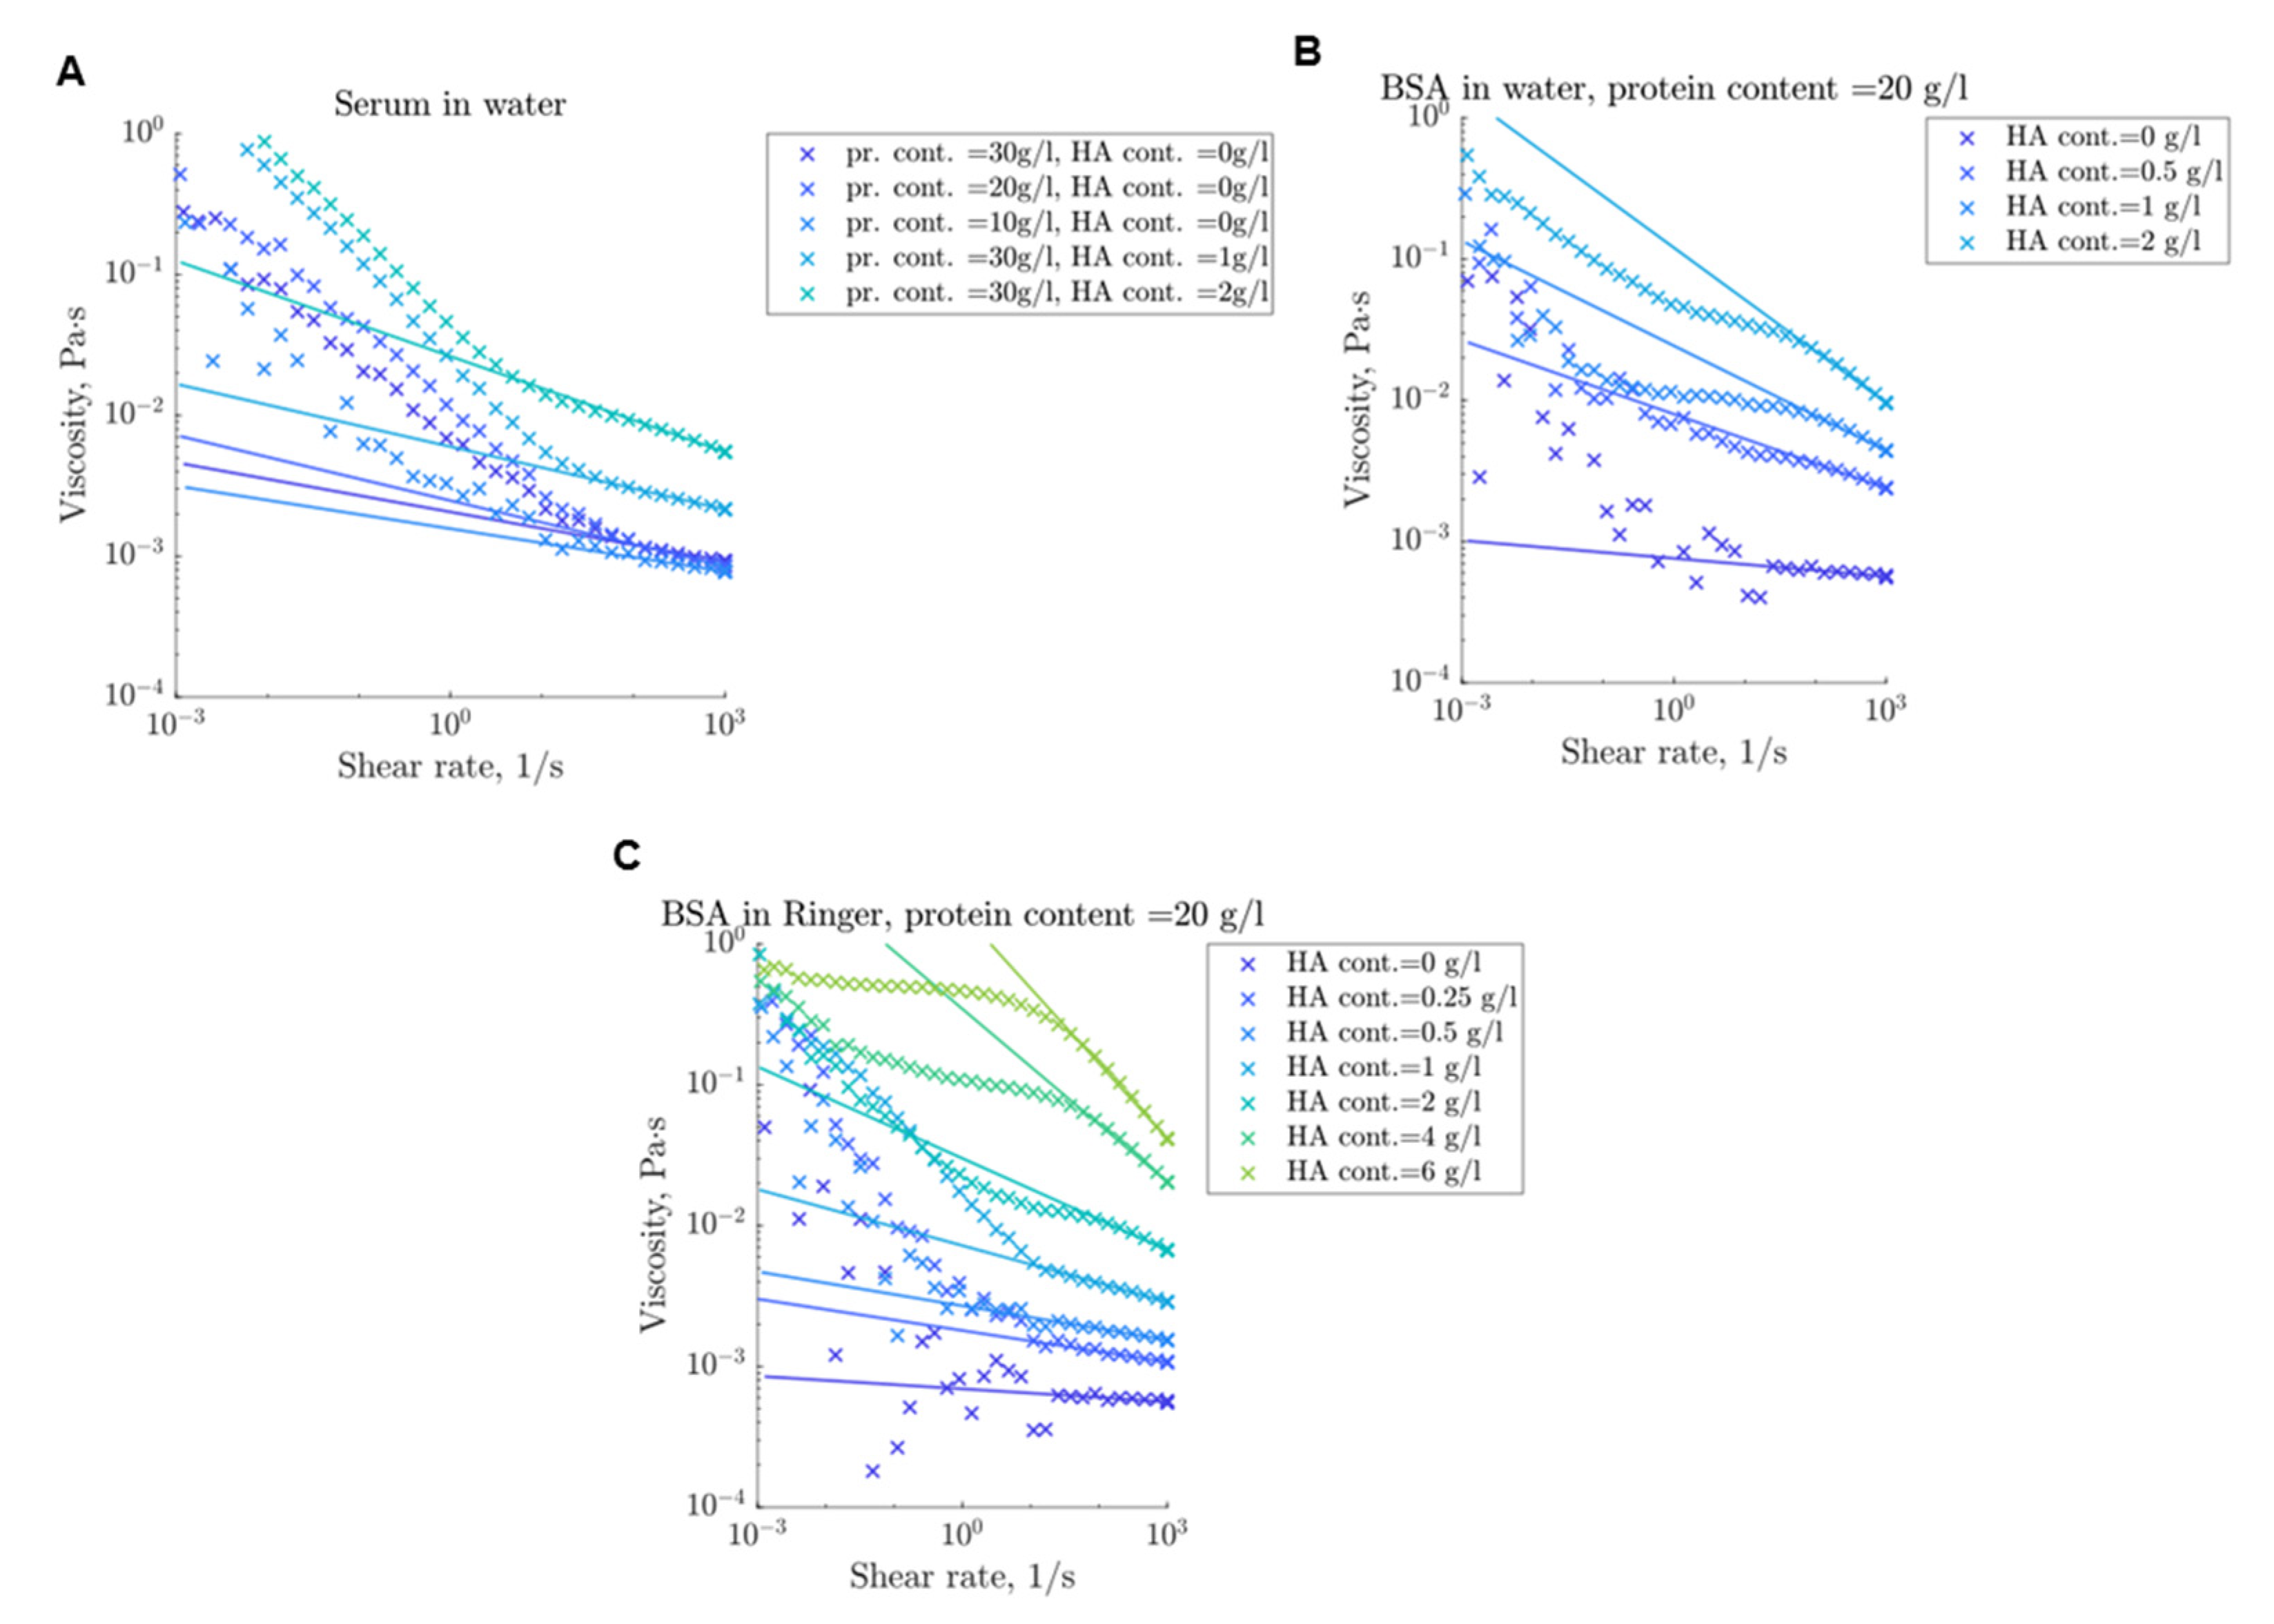
The flow curves of all tested model liquids were mathematically modelled using the Ostwald–de Waele equation. Exemplary solid line curves for the curve fit of the tested components are shown in Figure 5 (further liquid compositions are given in Figure A1).
The results show that protein content has only a minor influence on the flow behavior in comparison to the marked increase of the viscosity due to HA as constituent (Figure 5A). Independent of the protein composition (serum or BSA), the HA content exhibits a marked influence on the flow curves (Figure 5B,C, Appendix A). The variation in HA concentration determines the zero viscosity as well as the curve’s inclination, as illustrated for water diluted 20 g/L BSA base solution in Figure 5B. Consequently, an increase in HA concentration causes a stronger shear-thinning. Regarding a physiological salt concentration, no influence can be observed in samples without HA, but a pronounced effect occurs with increasing HA content (Figure 5B in comparison to Figure 5C).
The parameters of the flow behavior approximation were assumed to be dependent on the chemical composition of the model liquids, i.e., on protein and HA content. Therefore, the parameters are calculated via the bisquare-weighted least-squares method using the approximated data from the BSA in Ringer solution curves. The parameters of the consistency factor, A , are equal to a = 2.30   Pa · s , b = 1.37   L / g , c = 5.27   g / L . The adjusted R-square of approximation is equal to R 2 = 0.99 , demonstrating an ideal match. The results of the approximation are shown in Figure 6.
The results show a strong correlation between the approximated function and the experimental data of BSA diluted with Ringer solution. Interestingly, a good correlation is also shown for the serum-based fluids at varying HA content (Figure 6B). At very low HA content (<1 g/L), the scattering of the parameter values is bigger in contrast to an increased HA. This trend is also displayed in the variability coefficient instead of the standard deviation with a variability coefficient of 0.2412 for 0.5 g/L HA and a reduced value of only 0.0463 for 4 g/L HA content.
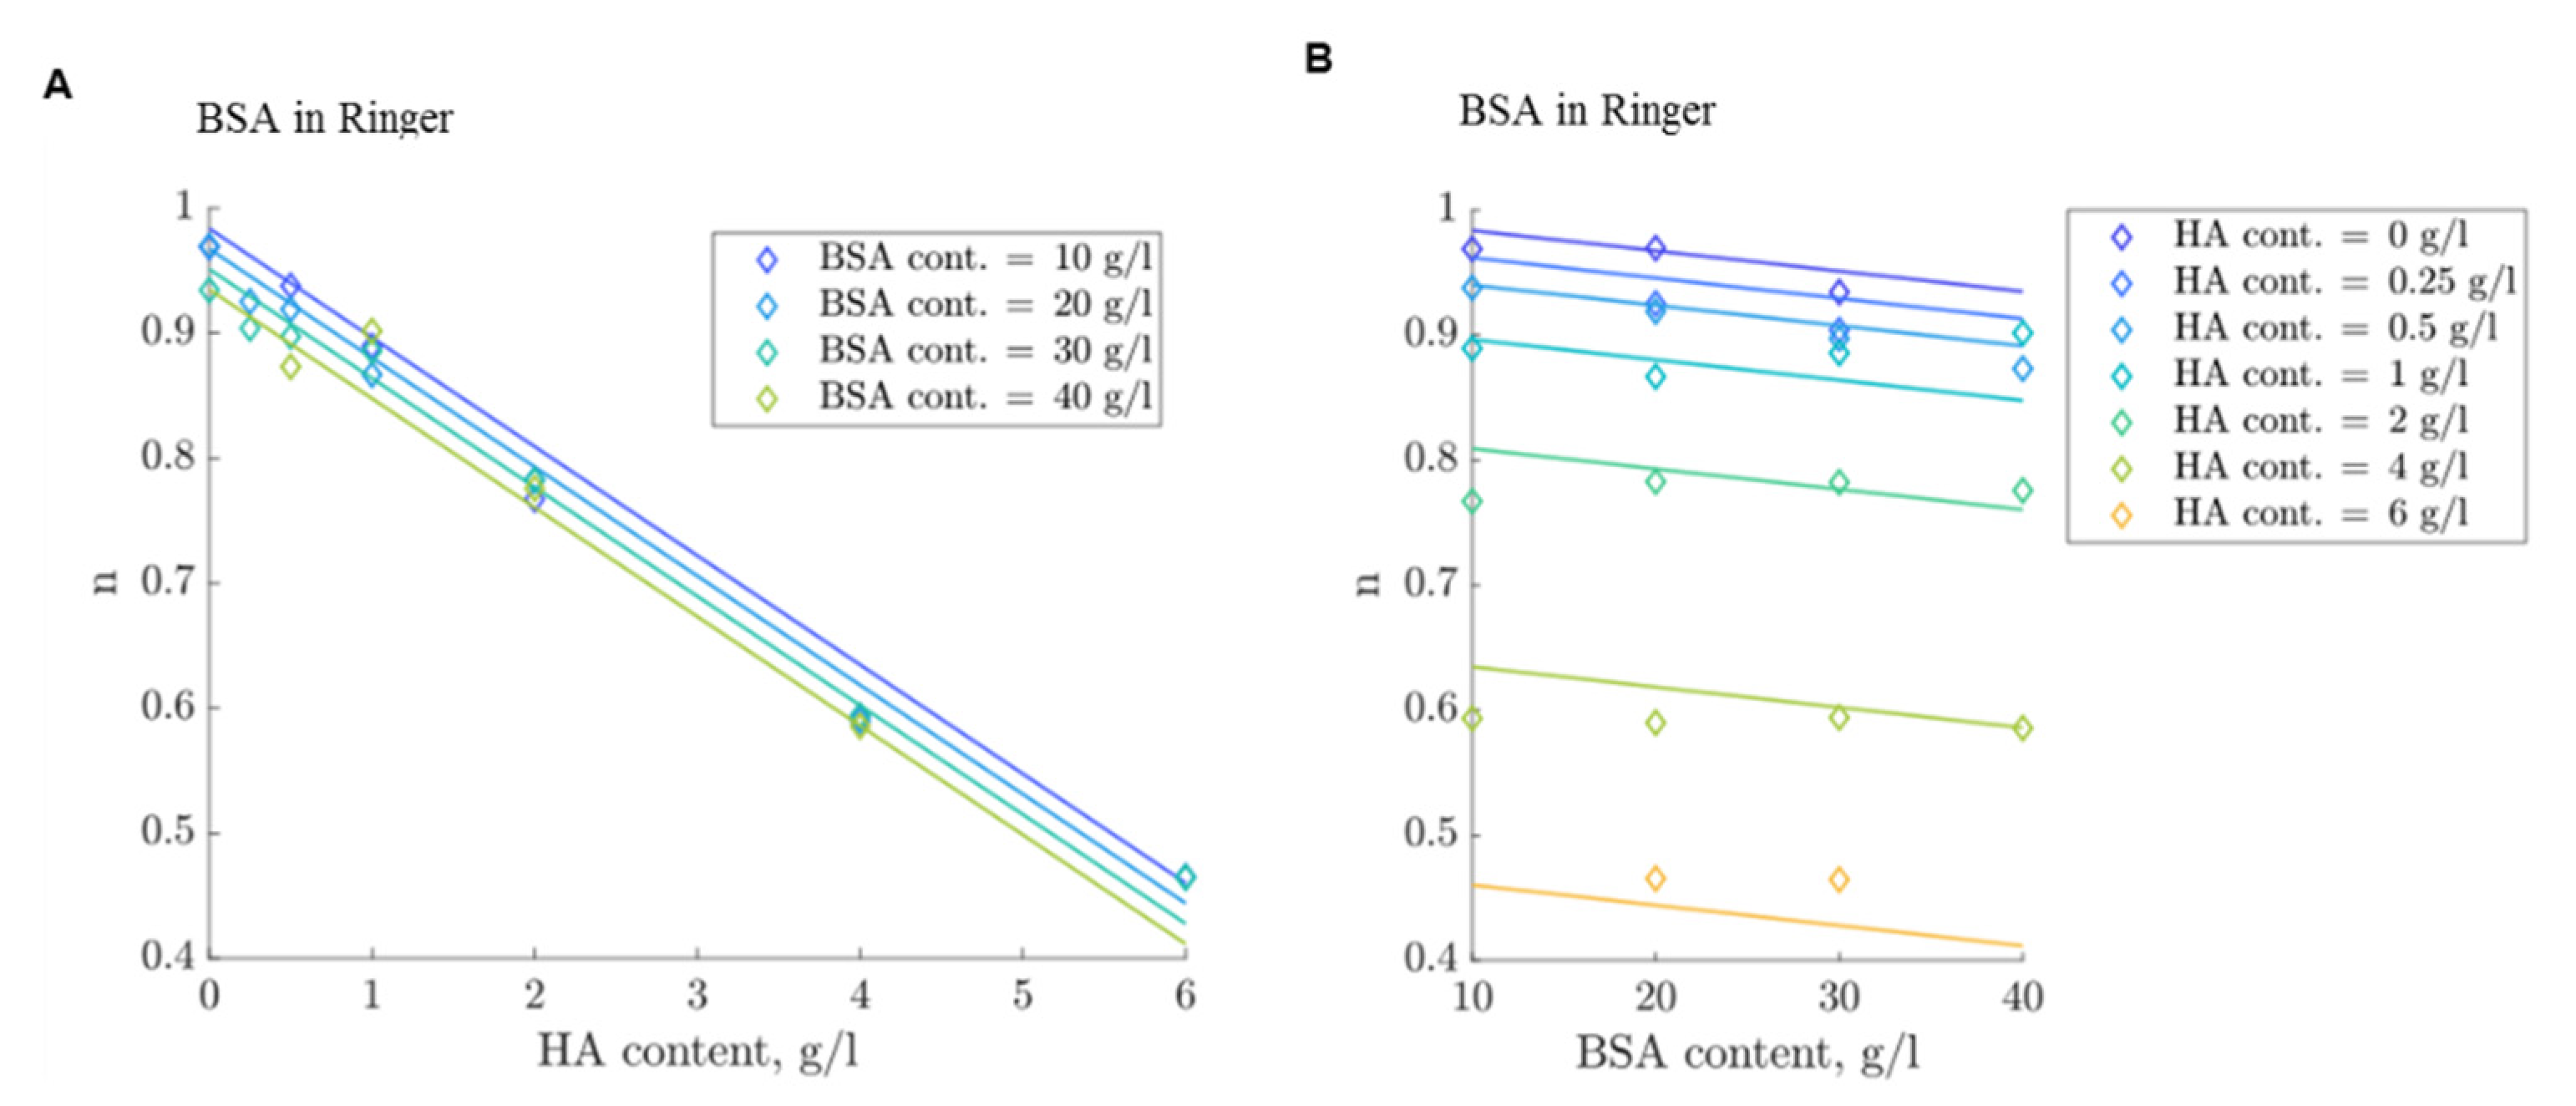
Furthermore, the exponent parameter, n , is approximated as a linear function of HA and protein content. The results of the approximation are shown in Figure 7. The parameters α = 8.73 × 10 2   L / g and β = 1.63 × 10 3   L / g indicate a significant contribution of HA to the viscosity formation of the model liquids. The adjusted R-squared of approximation is equal to R 2 = 0.978 , which demonstrates a strong correlation between the real and approximated data. It can also be observed in Figure 7A,B that the protein content of a model liquid has a stronger influence on the flow index when HA content is lower than 1 g/L. For example, the standard deviation of the n parameter is 2.79 × 10 2 for 0.5 g/L HA content in comparison to 3.87 × 10 3 for 4 g/L HA content.
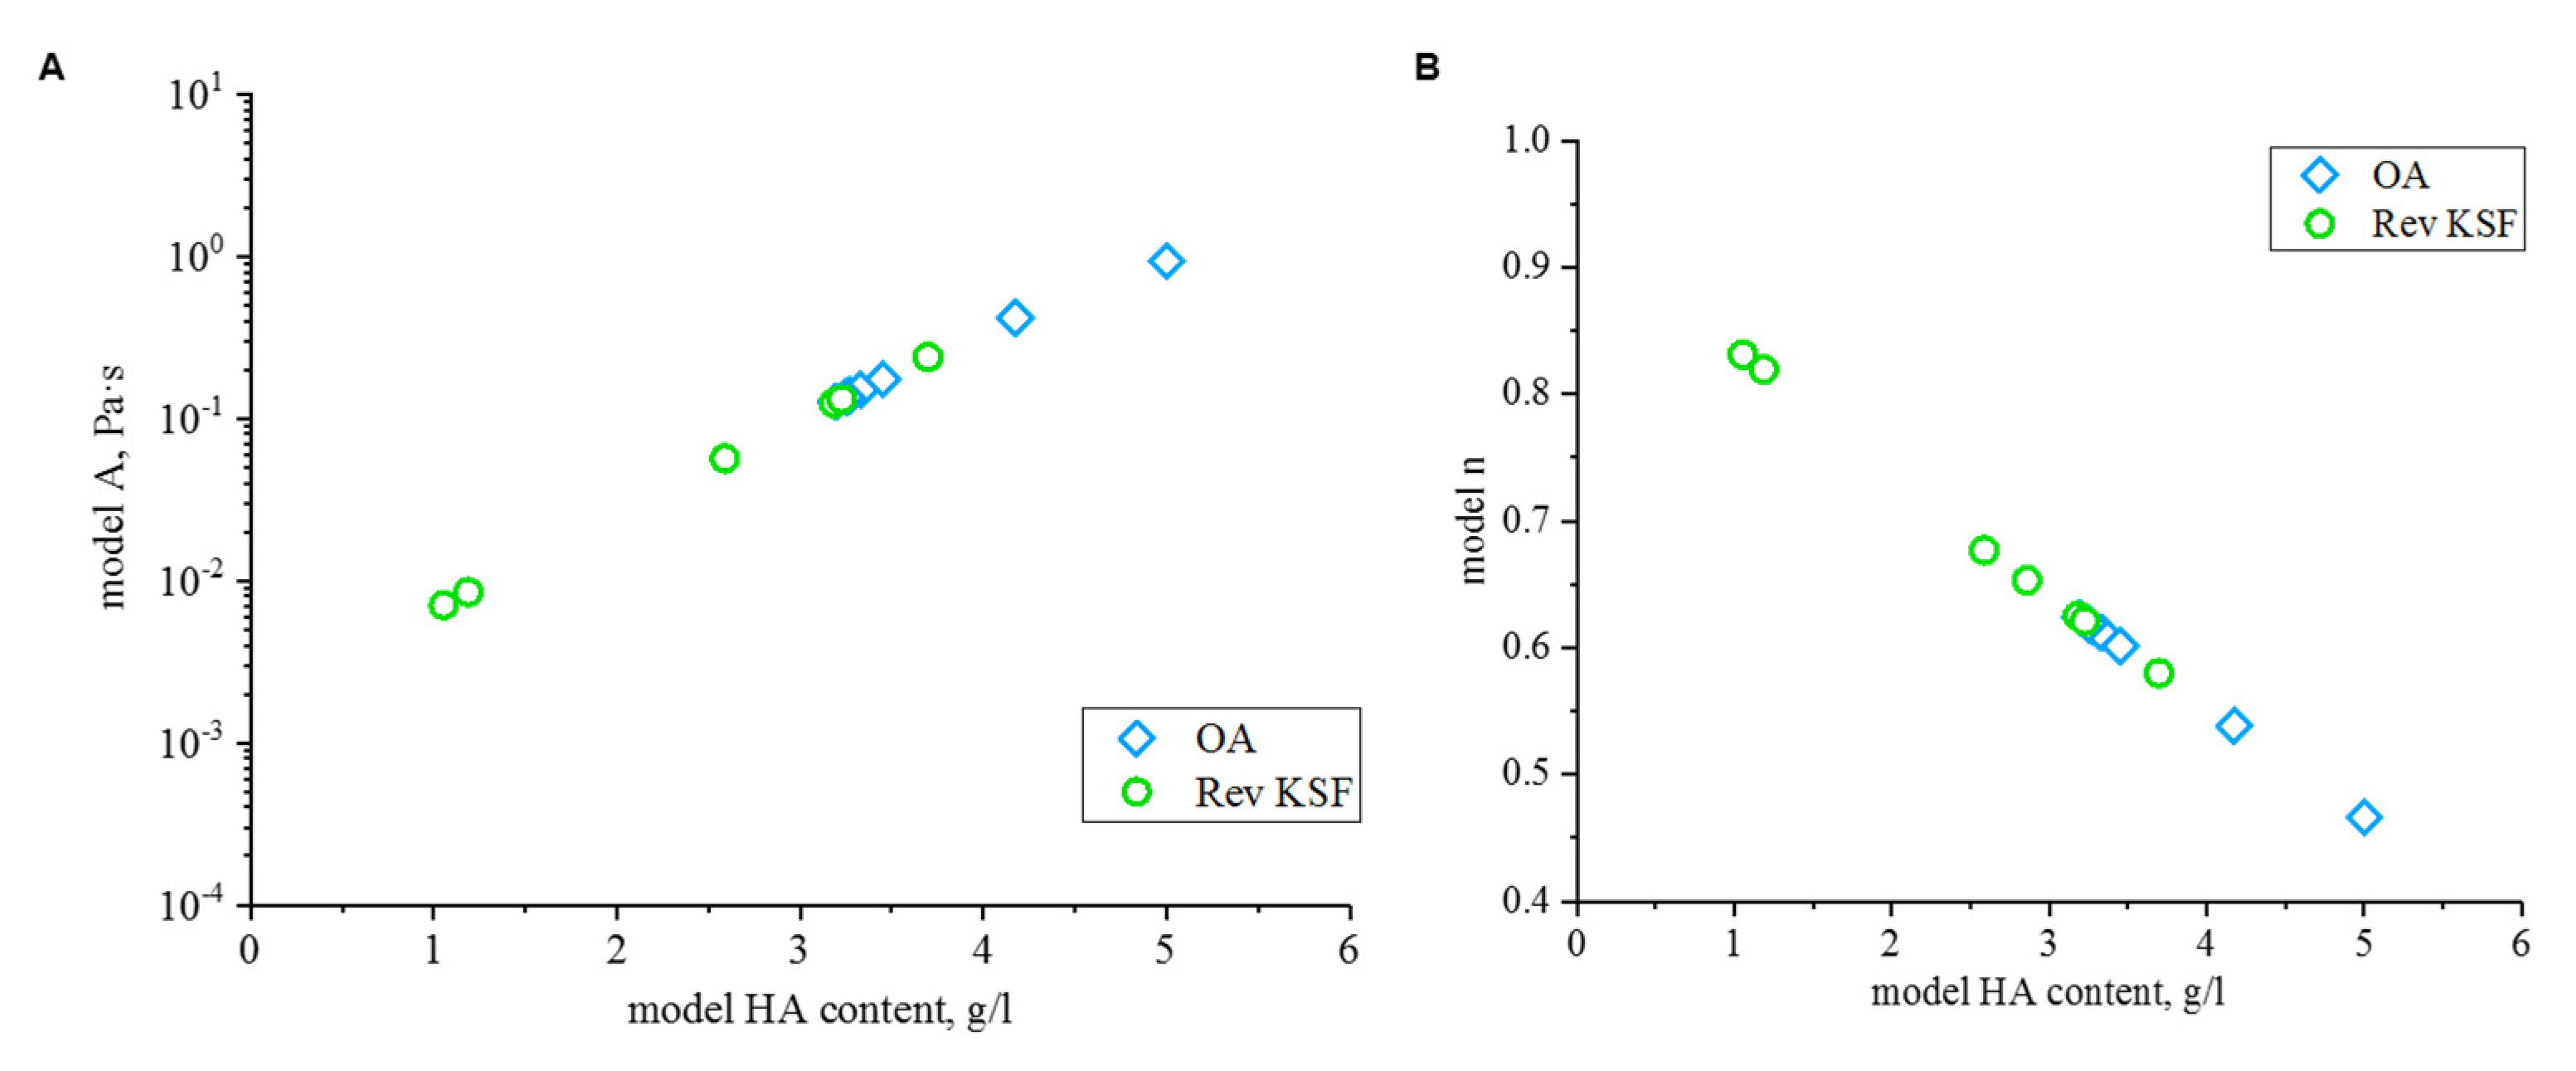
BSA diluted in Ringer solution as well as serum represent distinctive rheological behavior in comparison to human SF. In order to mimic each patient’s individual flow behavior, interior-point nonlinear optimization is used to determine the appropriate chemical composition, namely HA and BSA concentration, of a synthetic fluid so that consistency factor, A , and flow index, n, of the shear-thinning resemble the patient’s data. The results of approximation are shown in Figure 8 and Table A2. The median of error values is equal to 5.7 × 10 3 , which indicates a good compliance of the optimization. Based on the model parameters, it can be observed that there is a tendency of an increased HA content (>3.5 g/L), which is required to model the OA samples, and a decreased HA content (<3.5 g/L) is necessary to simulate the revision samples. For human OA samples, the mean values of the HA and total protein content of the model liquids are equal to c HA = 3.67   g / L ±   0.62   g / L and c pr = 58.95   g / L ± 3.47   g / L   , respectively. In the case of revision SF, the following mean concentrations for HA and total protein were determined: c HA = 2.43   g / L   ±   0.96   g / L and c pr = 56.41   g / L ± 5.67   g / L   . These values are relevant concentrations for the model liquids to mimic ideally the biorheological behavior of human OA and revision SF.

3.5. Friction Behavior

The results of the friction tests of human SF samples and serum in a hard/soft pairing of UHMWPE against alumina ceramic are illustrated as mean Stribeck plots in Figure 9A. As the sliding speed increases from 0.001 to 1000 mm/s, the friction coefficients decrease slightly. The serum test fluid exhibits the highest friction, starting with a mean friction coefficient of 0.14 at low speed, which decreases to 0.05 at 1000 mm/s. Based on the course of the mean friction coefficient, the serum values are widely scattered. In contrast, the OA samples exhibit a mean friction coefficient of 0.1 at lowest sliding speed that decreases to a minimum of 0.03 at maximum speed. A similar course of curve reveal the Rev SF samples that start at a mean value of 0.09 at low speed and end with 0.04 at the highest speed of 1000 mm/s. Interestingly, the human samples are constantly below the serum friction coefficients.
Furthermore, mean Stribeck plots of the synthetic model fluids in a similar UHMWPE/ceramic pairing for different HA concentrations were determined and are shown in Figure 9B. In contrast to serum, the addition of HA to BSA-Ringer solution with a protein content of 30 g/L reduces markedly the friction coefficients, starting at 0.09 to 0.011 at lowest speed and decreasing to 0.04 at the highest speed. The mean curves demonstrate that, at a lower shear rate, the mean friction coefficients overlap, whereas, at shear rates of >1 mm/s, a distinct trend in the dependence of HA concentration is present. Consequently, the highest HA concentration of 6 g/L exhibits the lowest friction, followed by the test fluid with 1 g/L HA in contrast to the fluid samples with only 0.25 g/L or 0.5 g/L HA. The results show that varying the HA content of the model fluid results in Stribeck curves that resemble those of human samples (Figure 9A,B).

4. Discussion

The study was aimed at the understanding of the influencing factors on the rheological properties of human SF. Therefore, biochemical composition and rheological properties of OA and revision SF from the knee joint were investigated. In a further approach, a synthetic fluid model was developed to mimic the rheological properties with biorelevant components.

4.1. Chemical Composition

The composition of human SF was determined regarding total protein and HA concentrations (Table 2). In comparison to healthy SF with a mean protein concentration of 20 g/L [10,31], the protein concentration is about two-fold increased for OA and revision surgery SF. This increase in total protein content is proposed to be a marker of degenerative processes in the joint, causing higher permeability of the synovial membrane for serum contents, such as albumin [10,12,13,14,17,18]. The HA concentration in the tested SF was similar between OA and revision SF, with a range from 0.2 to 5.9 g/L. The measured HA concentrations are comparable to previously described levels of HA in the SF of OA joints [12,19,47,48].

4.2. Rheological Properties

It was observed that diluted serum does not represent the biorheology that is present in artificial joints. The tested human OA and revision SF exhibit a non-Newtonian behavior with a shear-rate dependent viscosity. At lower shear rate, the investigated groups show a pronounced variation, whereas at higher shear rates this difference was not detectable. The results are in concordance with the findings published by Schurz and Ribitsch, who found distinct viscosity ranges for healthy and pathological SF at lower shear rates [16]. Interestingly, the flow curves of revision SF exhibit a wider inter-individual variation of the shear-thinning decrease in contrast to the tested OA samples (Figure 2). While some samples exhibit a high zero-viscosity similar to OA samples, other samples reveal a lower zero-viscosity with a minor shear-thinning drop. The great variances in flow behavior can be attributed to the individual status of degeneration and inflammation, as well as the synovial membrane integrity of each patient [19]. Furthermore, multiple factors influence the postoperative formation of a pseudo synovial membrane and consequently the secretion of SF after implantation of an endoprosthesis [49]. Consequently, the best possible preservation of synovial structures during any surgical intervention is of uppermost importance. Particularly in patients with total joint arthroplasty, attention should be paid to a sustained regeneration of the synovial fluid [50].
Regarding the influence of the typical constituents of human SF, we identified a predominant effect of the HA concentration on the flow properties (Figure 4). Without HA, a comparison between bovine serum and BSA shows a similar shear-thinning. However, in order to exclude the batch dependence of bovine serum, BSA as the main protein in SF is recommended as a basic compound for any synthetic test fluid. Furthermore, our results show that an increased total protein concentration, from 10 to 30g/L, has only a minor influence on viscosity increase especially at lower shear rates (Figure 4A). In order to set a physiological salt concentration, Ringer solution is added to the test liquids. At similar protein concentrations, the addition of Ringer solution results in a slight viscosity decrease at lower shear rates (Figure 4B,C). HA addition to the model liquid increases the viscosity for all shear rates and consequently intensifies the shear-thinning, as shown in Figure 4C,D. This effect has been shown in previous studies that investigated the influence of HA supplemented fluids on the flow behavior [10,51].

4.3. Flow Curve Simulation Model

Based on the determined influence of the tested chemical composition of SF, a phenomenological model was proposed to describe the shear-thinning depending on the chemical composition of biorelevant components. The generated model shows a good fit with the determined experimental data. BSA-Ringer base solution is suggested as a suitable model liquid, to which increasing amounts of HA are included. The rheological properties of the different model liquids were compared to serum as the standard simulator test fluid. The consistency factors, A , and exponents, n, of both base substances with varying HA content are illustrated in Figure 10.
An influence of serum protein content can be observed on both parameters A and n for samples without HA content. However, a good correlation is given when HA is added to the serum test fluid, particularly at 1 g/L and 2 g/L. Due to the batch-dependent variation of serum protein composition, pure BSA is suggested as the dominant serum protein to allow a better reproducibility in comparison to calf serum.
In order to mimic the flow behavior of patient samples, the chemical composition of a synthetic model fluid was determined based on the developed model. The results report a sufficient correlation of the flow curves between the native samples to the synthetic model fluids (Table A2). The variation of HA for OA (3–5 g/L) and revision SF (1–3.7 g/L) in a BSA-Ringer base solution allows one to mimic individual flow properties (Figure 8).

4.4. Friction Behavior

As the rheological properties directly influence the friction behavior of a tribological pairing [2,10,35], friction tests were performed with the human OA, Rev SF, and model fluids in a hard/soft paring of UHMWPE against alumina ceramic (Figure 9). The friction coefficients for serum are within the range of 0.05 to 0.12, which is similar to other studies [10,52]. However, human OA and revision SF exhibit comparable friction coefficients in the range of 0.03 to 0.1, which are far below the serum. This demonstrates that bovine serum test fluid exhibits inferior friction properties in comparison to pathological and revision SF, thus not representing the in vivo lubrication condition. The addition of HA lowers the friction coefficients for the model liquids in the tested material pairing, which can be attributed to the viscosity increase [10,52]. Consequently, HA is an indispensable constituent for the characteristic flow behavior in artificial joints. The derived model fluids result in similar friction behavior to human OA and revision SF in contrast to serum. However, there is only a limited number of studies that investigated the effect of HA addition to a serum lubricant on wear rates of simulator studies [10,31,51]. Wang et al. found no different wear rates when adding 0.34 g/L HA to serum in a simulator study [31]. In contrast, Desjardins et al. found a significantly increased UHMWPE wear rate using bovine serum with 1.5 g/L HA in comparison to serum standard lubricant, but with damage patterns similar to in vivo retrievals [51]. Mazzucco et al. described a correlation of lower HA concentration in SF, causing diminished flow properties in wear related failure [12]. Nevertheless, the results of this study demonstrate that the representative HA concentrations are insufficient in modelling the flow behavior of periprosthetic SF. Rather, a combination of increased BSA protein concentration with HA addition is needed in order to mimic ideally the flow behavior. Simulator studies have to verify HA as a supplement lubricant constituent for realistic wear testing. In this context, long-term wear tests on knee implants according to ISO 14243-1 are planned to evaluate the wear behavior of the artificial lubricants.
There are some limitations regarding the presented study. Only a small number of human SF samples was investigated, and the determined chemical composition is limited to protein and HA concentration. Further parameters, including salt concentration, protein composition (e.g., albumin/globulin ratio), lipids, and enzymes should be measured in future studies, as these will clearly influence the rheological properties of SF. For simplification, some effects have been omitted from the mathematical model function. For instance, the dependency of the consistency factor, A , on the protein content and digression of its influence by significant HA amounts. The recommended synthetic model fluids are limited to the applied HA, which exhibits a molecular weight of 1.7 × 10⁶ Dalton.
This is currently the most comprehensive study investigating the influence of HA and protein content on the flow behavior, presenting a first model to mimic ideally human OA and periprosthetic SF samples.

5. Conclusions

The biochemical composition of joint fluids influences the rheological, and consequently the tribological, performance of native and artificial joints. Based on the presented experimental approach, a suitable model was developed to describe the effect of biorelevant components (BSA and HA content) on the rheological behavior. It was observed that diluted serum does not resemble the biorheology of human SF, but the simple addition of HA and an increased BSA content adapts the rheological behavior to make the test fluid more comparable to realistic physiological conditions.

Author Contributions

Conceptualization, M.H.; methodology, M.H. and R.N.; software, R.N.; validation, M.B., D.B. and J.B.; formal analysis, M.B., D.B. and M.K.; investigation, M.H.; resources, C.H.L. and J.B.; data curation, C.H.L. and J.B.; writing—original draft preparation, M.H. and R.N.; writing—review and editing, M.H., R.N. and J.B.; visualization, M.H.; supervision, M.K. and T.H.; project administration, M.K. and T.H.; funding acquisition, T.H. All authors have read and agreed to the published version of the manuscript.

Funding

This work was in part conducted within the context of the International Graduate School MEMoRIAL at Otto von Guericke University (OVGU), Magdeburg, Germany, kindly supported by the European Structural and Investment Funds (ESF) under the program “Sachsen-Anhalt WISSENSCHAFT Internationalisierung” (project no. ZS/2016/08/80646).

Institutional Review Board Statement

The study was conducted according to the guidelines of the Declaration of Helsinki, and approved by the Institutional Review Board (or Ethics Committee) of the Otto-von-Guericke University Medical School, Magdeburg, (protocol code IRB No. 25_17 from 13 March 2017).

Informed Consent Statement

Informed consent was obtained from all subjects involved in the study.

Data Availability Statement

The data presented in this study are available on request from the corresponding author. The data are not publicly available as the data also forms part of an ongoing study.

Acknowledgments

The authors would like to thank Anja Schröder, Carolin Schneider, Mandy Könecke, and Michael Reppin for their excellent technical assistance and valuable support.

Conflicts of Interest

The authors declare no conflict of interest.

Appendix A

Figure A1. Approximation of the flow behavior via the Ostwald–de Waele model for BSA test fluids diluted either with Ringer solution or deionized water, varying the protein content from 10 to 40 g/L and HA concentration from 0 g/L up to 6 g/L.
Lubricants 09 00087 g0a1aLubricants 09 00087 g0a1b
Table A1. Chemical composition of the synthetic lubricants.
No.Serum (g/L)BSA (g/L)HA (g/L)Deionised WaterRinger SolutionVolume (mL)
1 300.25 balance4
2 300.5 balance4
3 301 balance4
4 302 balance4
5 304 balance4
6 306 balance4
7 200.25 balance4
8 200.5 balance4
9 201 balance4
10 202 balance4
11 204 balance4
12 206 balance4
13 100.5 balance4
14 101 balance4
15 102 balance4
16 104 balance4
17 400.5 balance4
18 401 balance4
19 402 balance4
20 404 balance4
21 30 balance4
22 20 balance4
23 10 balance4
24 400.5balance 4
25 401balance 4
26 402balance 4
27 300.5balance 4
28 301balance 4
29 302balance 4
30 200.5balance 4
31 201balance 4
32 202balance 4
33 100.5balance 4
34 101balance 4
35 102balance 4
36 30 balance 4
37 20 balance 4
38 10 balance 4
3930 balance 4
4020 balance 4
4110 balance 4
4230 0.5balance 4
4330 1balance 4
4430 2balance 4
Table A2. Optimized chemical composition of model liquids to mimic human OA and revision SF data. C H A o p t : HA content, C p r o p t : protein content, E: error function parameter, EA: error function of consistency factor, A, En: error function of exponent parameter, n.
Sample C H A o p t   [ g / L ] C p r o p t   [ g / L ] EEAEn
OA 13.2600.00961830.00023750.0093808
OA 23.27600.04694580.00084020.0461056
OA 35600.00733760.00023460.0071031
OA 43.33600.01098730.00025710.0107302
OA 53.25600.00528490.00013640.0051485
OA 63.45600.00321268.18 × 10−50.0031307
OA 74.17600.00532630.00012430.005202
Rev KS 11.0547.458.58 × 10−119.00 × 10−127.68 × 10⁻¹¹
Rev KS 23.23600.00381820.00010190.0037163
Rev KS 33.7600.01342390.00028450.0131395
Rev KS 42.86600.00569880.0001670.0055317
Rev KS 52.0959.994.40 × 10−52.18 × 10−64.19 × 10−5
Rev KS 62.59600.05854430.00125870.0572856
Rev KS 73.18600.00915940.00022840.008931

References

  1. Damm, P.; Bender, A.; Bergmann, G. Postoperative changes in in vivo measured friction in total hip joint prosthesis during walking. PLoS ONE 2015, 10, e0120438. [Google Scholar] [CrossRef] [Green Version]
  2. Ghosh, S.; Choudhury, D.; Roy, T.; Moradi, A.; Masjuki, H.H.; Pingguan-Murphy, B. Tribological performance of the biological components of synovial fluid in artificial joint implants. Sci. Technol. Adv. Mater. 2015, 16, 45002. [Google Scholar] [CrossRef] [Green Version]
  3. Gispert, M.P.; Serro, A.P.; Colaço, R.; Saramago, B. Friction and wear mechanisms in hip prosthesis: Comparison of joint materials behaviour in several lubricants. Wear 2006, 260, 149–158. [Google Scholar] [CrossRef]
  4. Yao, J.Q.; Laurent, M.P.; Johnson, T.S.; Blanchard, C.R.; Crowninshield, R.D. The influences of lubricant and material on polymer/CoCr sliding friction. Wear 2003, 255, 780–784. [Google Scholar] [CrossRef]
  5. ISO 14243-1. Implants for Surgery—Wear of Total Knee-Joint Prostheses: Part 1, Loading and Displacement Parameters for Wear-Testing Machines with Load Control and Corresponding Environmental Conditions for Test, 2nd ed.; Beuth Verlag GmbH: Berlin, Germany, 2009. [Google Scholar]
  6. F04 Committee. ASTM F1715-00e1 Standard Guide for Wear Assessment of Prosthetic Knee Designs in Simulator Devices; ASTM International: West Conshohocken, PA, USA, 2006. [Google Scholar] [CrossRef]
  7. Price, P.J.; Gregory, E.A. Relationship between in vitro growth promotion and biophysical and biochemical properties of the serum supplement. In Vitro 1982, 18, 576–584. [Google Scholar] [CrossRef] [PubMed]
  8. Schwenke, T.; Kaddick, C.; Schneider, E.; Wimmer, M.A. Fluid composition impacts standardized testing protocols in ultrahigh molecular weight polyethylene knee wear testing. Proc. IMechE 2005, 219, 457–464. [Google Scholar] [CrossRef] [PubMed]
  9. Trommer, R.M.; Maru, M.M. Importance of preclinical evaluation of wear in hip implant designs using simulator machines. Rev. Bras. Ortop. 2017, 52, 251–259. [Google Scholar] [CrossRef] [PubMed]
  10. Bortel, E.; Charbonnier, B.; Heuberger, R. Development of a Synthetic Synovial Fluid for Tribological Testing. Lubricants 2015, 3, 664–686. [Google Scholar] [CrossRef] [Green Version]
  11. Murakami, T.; Yarimitsu, S.; Nakashima, K.; Sawae, Y.; Sakai, N. Influence of synovia constituents on tribological behaviors of articular cartilage. Friction 2013, 1, 150–162. [Google Scholar] [CrossRef] [Green Version]
  12. Mazzucco, D.; Scott, R.; Spector, M. Composition of joint fluid in patients undergoing total knee replacement and revision arthroplasty: Correlation with flow properties. Biomaterials 2004, 25, 4433–4445. [Google Scholar] [CrossRef] [PubMed]
  13. Furey, M.J.; Burkhardt, B.M. Biotribology: Friction, wear, and lubrication of natural synovial joints. Lubr. Sci. 1997, 9, 255–271. [Google Scholar] [CrossRef]
  14. Larsen, N.E.; Balazs, E.A. Drug delivery systems using hyaluronan and its derivatives. Adv. Drug Deliv. Rev. 1991, 7, 279–293. [Google Scholar] [CrossRef]
  15. Bennike, T.; Ayturk, U.; Haslauer, C.M.; Froehlich, J.W.; Proffen, B.L.; Barnaby, O.; Birkelund, S.; Murray, M.M.; Warman, M.L.; Stensballe, A.; et al. A normative study of the synovial fluid proteome from healthy porcine knee joints. J. Proteome Res. 2014, 13, 4377–4387. [Google Scholar] [CrossRef] [PubMed]
  16. Schurz, J.; Ribitsch, V. Rheology of synovial fluid. Biorheology 1987, 24, 385–399. [Google Scholar] [CrossRef]
  17. Hui, A.Y.; McCarty, W.J.; Masuda, K.; Firestein, G.S.; Sah, R.L. A systems biology approach to synovial joint lubrication in health, injury, and disease. Wiley Interdiscip. Rev. Syst. Biol. Med. 2012, 4, 15–37. [Google Scholar] [CrossRef] [Green Version]
  18. Dumbleton, J.H. Tribology of Natural and Artificial Joints; Elsevier: Amsterdam, The Netherlands, 1981. [Google Scholar]
  19. Fam, H.; Bryant, J.T.; Kontopoulou, M. Rheological properties of synovial fluids. Biorheology 2007, 44, 59–74. [Google Scholar]
  20. Rainer, F.; Ribitsch, V. Viskoelastische Eigenschaften der intakten Human-Synovia und ihr Bezug zur Biomechanik. Z Rheumatol. 1985, 44, 114–119. [Google Scholar] [PubMed]
  21. Cowman, M.K.; Schmidt, T.A.; Raghavan, P.; Stecco, A. Viscoelastic Properties of Hyaluronan in Physiological Conditions. F1000Research 2015, 4, 622. [Google Scholar] [CrossRef] [PubMed] [Green Version]
  22. Cook, R.B.; Bolland, B.J.R.F.; Wharton, J.A.; Tilley, S.; Latham, J.M.; Wood, R.J.K. Pseudotumour formation due to tribocorrosion at the taper interface of large diameter metal on polymer modular total hip replacements. J. Arthroplast. 2013, 28, 1430–1436. [Google Scholar] [CrossRef]
  23. Simon, L.S. Viscosupplementation therapy with intra-articular hyaluronic acid. Fact or fantasy? Rheum. Dis. Clin. N. Am. 1999, 25, 345–357. [Google Scholar] [CrossRef]
  24. Link, J.M.; Salinas, E.Y.; Hu, J.C.; Athanasiou, K.A. The tribology of cartilage: Mechanisms, experimental techniques, and relevance to translational tissue engineering. Clin. Biomech. 2020, 79, 104880. [Google Scholar] [CrossRef] [PubMed]
  25. Waller, K.A.; Zhang, L.X.; Fleming, B.C.; Jay, G.D. Preventing friction-induced chondrocyte apoptosis: Comparison of human synovial fluid and hylan G-F 20. J. Rheumatol. 2012, 39, 1473–1480. [Google Scholar] [CrossRef] [Green Version]
  26. Jay, G.D.; Lane, B.P.; Sokoloff, L. Characterization of a bovine synovial fluid lubricating factor III. The interaction with hyaluronic acid. Connect. Tissue Res. 1992, 28, 245–255. [Google Scholar] [CrossRef]
  27. Lee, D.W.; Banquy, X.; Das, S.; Cadirov, N.; Jay, G.; Israelachvili, J. Effects of molecular weight of grafted hyaluronic acid on wear initiation. Acta Biomater. 2014, 10, 1817–1823. [Google Scholar] [CrossRef]
  28. Bonnevie, E.D.; Galesso, D.; Secchieri, C.; Bonassar, L.J. Frictional characterization of injectable hyaluronic acids is more predictive of clinical outcomes than traditional rheological or viscoelastic characterization. PLoS ONE 2019, 14, e0216702. [Google Scholar] [CrossRef]
  29. Kwiecinski, J.J.; Dorosz, S.G.; Ludwig, T.E.; Abubacker, S.; Cowman, M.K.; Schmidt, T.A. The effect of molecular weight on hyaluronan’s cartilage boundary lubricating ability--alone and in combination with proteoglycan 4. Osteoarthr. Cart. 2011, 19, 1356–1362. [Google Scholar] [CrossRef] [Green Version]
  30. McNulty, D.; Swope, S.; Liao, Y.S.; McKellop, H.; Shen, F.W.; Galvin, A.; Fisher, J. Multi-lab evaluation of hip simulator test conditions on relative wear rates of crosslinked polyethylenes. In Proceedings of the 52nd Annual Meeting of the Orthopaedic Research Society, Chicago, IL, USA, 19–22 March 2006; p. 649. [Google Scholar]
  31. Wang, A.; Essner, A.; Schmidig, G. The effects of lubricant composition on in vitro wear testing of polymeric acetabular components. J. Biomed. Mater. Res. 2004, 68, 45–52. [Google Scholar] [CrossRef]
  32. Saikko, V. Effect of Lubricant Protein Concentration on the Wear of Ultra-High Molecular Weight Polyethylene Sliding Against a CoCr Counterface. J. Tribol. 2003, 125, 638–642. [Google Scholar] [CrossRef]
  33. Liao, Y.-S.; McKellop, H.; Lu, Z.; Campbell, P.; Benya, P. The effect of frictional heating and forced cooling on the serum lubricant and wear of UHMW polyethylene cups against cobalt–chromium and zirconia balls. Biomaterials 2003, 24, 3047–3059. [Google Scholar] [CrossRef]
  34. Roba, M.; Naka, M.; Gautier, E.; Spencer, N.D.; Crockett, R. The adsorption and lubrication behavior of synovial fluid proteins and glycoproteins on the bearing-surface materials of hip replacements. Biomaterials 2009, 30, 2072–2078. [Google Scholar] [CrossRef] [PubMed]
  35. Smith, A.M.; Fleming, L.; Wudebwe, U.; Bowen, J.; Grover, L.M. Development of a synovial fluid analogue with bio-relevant rheology for wear testing of orthopaedic implants. J. Mech. Behav. Biomed. Mater. 2014, 32, 177–184. [Google Scholar] [CrossRef] [PubMed]
  36. Sava, M.-M.; Boulocher, C.; Matei, C.I.; Munteanu, B.; Schramme, M.; Viguier, E.; Roger, T.; Berthier, Y.; Blanchin, M.G.; Trunfio-Sfarghiu, A.M. Structural and tribological study of healthy and biomimetic SF. Comput. Methods Biomech. Biomed. Eng. 2013, 16, 216–218. [Google Scholar] [CrossRef]
  37. Deutsches Institut für Normung, e.V. Viscosity—Part 3; Non-Newtonian Liquids 2003-11; Beuth Verlag GmbH: Berlin, Germany, 2003.
  38. Poliakov, A.; Pakhaliuk, V.; Popov, V.L. Current Trends in Improving of Artificial Joints Design and Technologies for Their Arthroplasty. Front. Mech. Eng. 2020, 6, 4. [Google Scholar] [CrossRef]
  39. Afoke, N.Y.; Byers, P.D.; Hutton, W.C. Contact pressures in the human hip joint. J. Bone Jt. Surg. Br. 1987, 69, 536–541. [Google Scholar] [CrossRef]
  40. Yoshida, H.; Faust, A.; Wilckens, J.; Kitagawa, M.; Fetto, J.; Chao, E.Y.-S. Three-dimensional dynamic hip contact area and pressure distribution during activities of daily living. J. Biomech. 2006, 39, 1996–2004. [Google Scholar] [CrossRef] [PubMed]
  41. Stukenborg-Colsman, C.; Ostermeier, S.; Hurschler, C.; Wirth, C.J. Tibiofemoral contact stress after total knee arthroplasty: Comparison of fixed and mobile-bearing inlay designs. Acta Orthop. Scand. 2002, 73, 638–646. [Google Scholar] [CrossRef] [PubMed] [Green Version]
  42. Moewis, P.; Checa, S.; Kutzner, I.; Hommel, H.; Duda, G.N. Physiological joint line total knee arthroplasty designs are especially sensitive to rotational placement—A finite element analysis. PLoS ONE 2018, 13, e0192225. [Google Scholar] [CrossRef] [Green Version]
  43. Holm, S. A Simple Sequentially Rejective Multiple Test Procedure. Scand. J. Stat. 1979, 6, 65–70. [Google Scholar]
  44. Kruskal, W.H.; Wallis, W.A. Use of Ranks in One-Criterion Variance Analysis. J. Am. Stat. Assoc. 1952, 47, 583–621. [Google Scholar] [CrossRef]
  45. Dunn, O.J. Multiple Comparisons Using Rank Sums. Technometrics 1964, 6, 241. [Google Scholar] [CrossRef]
  46. Kellgreen, J.H.; Lawrence, J.S. Radiological assessment of osteo-arthrosis. Ann. Rheum. Dis. 1957, 16, 494–502. [Google Scholar] [CrossRef] [PubMed] [Green Version]
  47. Dunn, S.; Kolomytkin, O.V.; Marino, A.A. Pathophysiology of osteoarthritis: Evidence against the viscoelastic theory. Pathobiology 2009, 76, 322–328. [Google Scholar] [CrossRef] [PubMed]
  48. Ceylan, H.H.; Erdil, M.; Polat, G.; Kara, D.; Kilic, E.; Kocyigit, A.; Tuncay, I. Does intra-articular fracture change the lubricant content of synovial fluid? J. Orthop. Surg. Res. 2015, 10, 89. [Google Scholar] [CrossRef] [Green Version]
  49. Kung, M.; Markantonis, J.; Nelson, S.; Campbell, P. The Synovial Lining and Synovial Fluid Properties after Joint Arthroplasty. Lubricants 2015, 3, 394–412. [Google Scholar] [CrossRef] [Green Version]
  50. Burkandt, A.; Katzer, A.; Thaler, K.; Baehr, V.; von Friedrich, R.E.; Rüther, W.; Amling, M.; Zustin, J. Proliferation of the Synovial Lining Cell Layer in Suggested Metal Hypersensitivity. In Vivo 2011, 25, 679–686. [Google Scholar]
  51. DesJardins, J.; Aurora, A.; Tanner, S.L.; Pace, T.B.; Acampora, K.B.; LaBerge, M. Increased Total Knee Arthroplasty Ultra-High Molecular Weight Polyethylene Wear Using a Clinically Relevant Hyaluronic Acid Simulator Lubricant. Proc. Inst. Mech. Eng. H 2006, 220, 609–623. [Google Scholar] [CrossRef]
  52. Sawae, Y.; Murakami, T.; Chen, J. Effect of synovia constituents on friction and wear of ultra-high molecular weight polyethylene sliding against prosthetic joint materials. Wear 1998, 216, 213–219. [Google Scholar] [CrossRef]
Figure 1. Details on the performed rheological and friction tests. (A) Measurement protocol for the flow behavior of the tested fluids with linear shear rate increase. (B) Ball-on-three plates test setup for friction tests with the hard/soft pairing of ceramic against UHMWPE.
Lubricants 09 00087 g001
Figure 2. Shear rate dependent flow curves of the different tested fluids at 30 °C. (A) Osteoarthritic synovial fluid samples (N = 7) and serum. (B) Patient samples from revision surgery (N = 7) and simulator test serum.
Lubricants 09 00087 g002
Figure 3. Results of the viscosity measurements for OA (N = 7) and Rev SF (N = 7) as well as serum test fluid at 30 °C (data as median). (A) Zero viscosities at a shear rate of 0.001 s−1 exhibit significant differences between the test groups (p < 0.01, ANOVA with Holm–Šidák post-hoc test). (B) Viscosities at a shear rate of 1000 s−1 converge in magnitude and significant differences are present in all study groups (p < 0.01, Kruskal–Wallis with Dunn’s test).
Lubricants 09 00087 g003
Figure 4. Flow curves for model fluids of different chemical compositions over a shear rate range from 0.001 to 1000 s−1. (A) Influence of the protein content on the flow behavior of water diluted BSA and serum. (B) Comparison of serum diluted with deionized water and BSA diluted with Ringer solution to the protein contents of 10 g/L, 20 g/L and 30 g/L without HA. (C) Influence of physiological salt concentration on the flow behavior by comparing Ringer solution to deionized water at a constant protein concentration of 30 g/L without HA (0 g/L) and a HA content of 2 g/L. (D) Flow curves of fluids with different concentrations of HA in BSA with Ringer solution and a constant protein content of 30 g/L.
Lubricants 09 00087 g004
Figure 5. Viscosity dependence on the tested shear rate approximated via the Ostwald–de Waele model (solid lines). (A) Variation of HA concentration from 0 to 2 g/L for water diluted serum. (B) Approximation of flow curves for water diluted BSA at a protein concentration of 20 g/L for different HA content from 0 to 2 g/L. (C) Mathematical model curves for 20 g/L BSA diluted with Ringer solution for varying HA concentration from 0 to 6 g/L.
Lubricants 09 00087 g005
Figure 6. Description of consistency factor, A , with logistic function according to the HA content. (A) Approximated curve based on Ringer diluted BSA in comparison with the experimental data of varying BSA protein content (10–40 g/L) in Ringer solution. (B) Approximated function of BSA in Ringer solution with the test data of different water diluted serum contents (10–30 g/L).
Lubricants 09 00087 g006
Figure 7. Solid line curves of the approximated flow index, n , of the Ostwald–de Waele model based on the double-linear law. (A) Iso-BSA lines for different protein concentrations (10 to 40 g/L) dependent on the HA content. (B) Iso-HA lines for a concentration range from 0 to 6 g/L according to BSA content.
Lubricants 09 00087 g007
Figure 8. Chemical composition of synthetic model fluids to mimic the flow behavior of human OA and Rev SF samples. (A) Determined consistency factors, A, and (B) flow indexes, n, for the representative model fluids.
Lubricants 09 00087 g008
Figure 9. Stribeck curves show the mean friction coefficients for increasing sliding speed of ultra-high molecular weight polyethylene (UHMWPE) pins against alumina ceramic lubricated with different test fluids. (A) Comparison of friction coefficients between serum (n = 3), human OA (N = 7, n = 3), and Rev SF (N = 7, n = 3). (B) Friction coefficients of different synthetic model fluids with increasing HA concentration (0.25–6 g/L) (data as mean, n = 3).
Lubricants 09 00087 g009
Figure 10. Rheological properties of serum test fluid samples in comparison to the model liquid of BSA-Ringer solution. (A) Consistency factor, A, and (B) shear-thinning exponent, n, according to HA content.
Lubricants 09 00087 g010
Table 1. Patient demographics of the aspirated SF samples (values are given as mean ± SD).
ParameterOARev SF
Number of patients1818
Age (years)59 ± 13 (26–80)72 ± 9 (56–84)
Gender
Female6 (33 %)9 (50 %)
Male12 (67 %)9 (50 %)
KLS/Implant material of each componentGrade 2 (N = 7)
Grade 3 (N = 7)
Grade 4 (N = 4)
Femur: Co-28Cr-6Mo (N = 18)
Tibia: Ti-6Al-4V (N = 10),
Co-28Cr-6Mo (N = 8)
Inlay: UHMWPE (N = 18)
Implantation time (years)n.a.8.5 ± 6.4 (1–17)
Side of the joint
Left10 (56%)12 (67%)
Right8 (44%)6 (33%)
BMI (kg/m2)32.3 ± 6.6 (24.5–50.3)30.7 ± 5.2 (22.4–38.7)
Table 2. Protein and HA concentration of the tested human joint fluids (values given as mean ± SD (minimum–maximum)).
Protein [g/L]HA [g/L]Number of Samples
OA38.1 ± 8.9 (21.5–55.3)2.8 ± 1.1 (0.4–5.9)N = 18
Rev SF40.5 ± 9.8 (24.1–59.3)1.7 ± 1.5 (0.2–5.2)N = 18
Publisher’s Note: MDPI stays neutral with regard to jurisdictional claims in published maps and institutional affiliations.