Abstract
The micro-abrasion wear mechanisms for CoCrMo against variable size alumina balls, representing typical artificial femoral head sizes, were investigated over a range of applied loads in foetal calf serum solution. SEM analysis of resulting wear scars displayed two-body and mixed-mode abrasion modes of wear. The wear factor, κ, was found to range between 0.86 and 22.87 (10−6 mm3/Nm). Micro-abrasion mechanism and wastage maps were constructed for the parameter range tested. A dominant two- to three-body abrasion regime was observed with an increasing load and ball diameter. The 28-mm ball diameter displayed the lowest wastage, with an increasing load. Proteins may act to reduce the severity of contact between abrasive particles and bearing surfaces. Wear volumes did not necessarily increase linearly with applied load and ball diameter; therefore, there is a need to develop more accurate models for wear prediction during micro-abrasion conditions. Wear mapping for hip replacements could provide a useful aid for pre-clinical hip wear evaluations and long-term performance.
1. Introduction
Total hip arthroplasty (THA) has become one of the most successful and cost-effective procedures in modern medicine [1] since its introduction and advancement in the 1960s by the British orthopaedic surgeon Sir John Charnley [2]. Each year, approximately one million patients undergo (THA) surgery worldwide, owing to pain and discomfort due to osteoarthritis [3]. The National Joint Registry indicates there are over 83,000 such operations carried out across England and Wales yearly [4], and this is likely to rise by an estimated 170% by 2030 [2]. The increasing trend in the number of people undergoing primary THA and revision surgery is being driven by an ageing population, an increasing rate of obesity, a decreasing average age at the first operation, and the limited life span of prostheses [2,3].
Hip prostheses have been subject to continuous research and development in order to increase their lifespan and reduce the likelihood of complications and revision surgery. This is reflected by the large variety of hip prostheses currently on the market, and rapid innovations in the field. Several cup–head material combinations are currently used, namely ultra-high molecular weight polyethylene (UHMWPE) with cobalt–chromium–molybdenum (CoCrMo) alloys or alumina heads, or hard-on-hard bearings where both the cup and head are made of CoCrMo or alumina [3,5,6]. As a result of the poor clinical performance and high rates of failure, the use of metal-on-metal (MoM) implants has virtually ceased across England and Wales due to wear and metallic ion release [4].
1.1. Hip Replacement Wear
The most important limiting factor in the long-term survival and lifespan of hip prostheses is recognised as wear; therefore, extensive research in hip prostheses has been focussed on the tribological aspects of THA [5,7,8,9]. Even though technological advances in hip prostheses have reduced many of the problems associated with these devices, hip prostheses currently average a service life of 15–20 years [3]. Modularity, larger femoral heads and bone conservation are the present trends in implant design.
In evaluating the wear of a tribological system, it is very important to understand the types of wear that are involved. Retrieval studies on Total Hip Replacements (THR) show clear evidence of micro-scale abrasive wear [5,10,11,12], polishing wear [5,12,13,14], and the significance of tribocorrosion layers formed on hip bearing surfaces [15,16,17]. Wear debris due to the abrasive action of carbides has been shown in CoCrMo alloys [7] and there is clear evidence of the action of third-body particles such as bone or bone cement [7,18]. In addition, hip simulator studies have shown that the wear of ceramic-on-metal (alumina head articulating against a CoCrMo metal cup) decreases by up to 100 times relative to MoM hip-bearing couples, and up to five times compared with ceramic-on-ceramic couples [19,20], attributed to their improved lubrication and low surface roughness values. Ceramic components in hip replacement are increasingly being used in THA due to the potential advantage of lower wear rates compared with metallic components [3,21]. In addition to lower wear rates, ceramic heads also have the potential to reduce the risk of modular taper corrosion at the head–neck junction, and decrease the risk of instability or dislocation [5]. The main limiting factor of ceramic as a load-bearing joint replacement is the risk of fracture due to impact and associations with an intolerable bearing noise or squeaking [5,21,22].
1.2. Micro-Scale Abrasion
While hip retrieval studies and hip simulator studies are essential for understanding wear in hip replacement, these can often be lengthy and costly procedures. Micro-scale abrasion testing allows for rapid, low-cost and repeatable wear studies for small samples of materials [23] for dry or lubricated conditions, which often include abrasive particles to accelerate the wear process. Several researchers have developed modified test rigs to include an integrated electrochemical three-electrode setup, in order to investigate the corrosion aspect of wear, in addition to the mechanical wear during micro-abrasion in simulated physiological conditions [24,25,26]. Abrasion, or micro-scale abrasion wear can be broadly characterised as a two-body, or three-body process [27], depending on system parameters, such as the applied load, sliding distance, volume fraction of abrasive particles and material hardness and roughness [1,28]. In hip replacements the two bodies refer to the two bearing surfaces, the femoral head and acetabular cup, where a third body may be any material present between the contacting surfaces interface; which as mentioned includes bone or bone cement particles, and also wear debris generated from either of the contacting surfaces.
1.3. Importance of Femoral Head Diameter
The Charnley low-friction arthroplasty is still regarding as the ‘gold standard’ for hip replacement [5], consisting of a relatively small stainless steel head diameter between 22.225 mm 25.75 mm coupled against a polymeric cup. With the occurrences of implant dislocations, newer designs such as the Müller and Exeter hip employed larger head sizes up to 32 mm [5] to reduce this risk, but also contributed to the increasing use of cobalt–chromium–molybdenum (CoCrMo) as a hip bearing material. The various clinical issues associated with implant loosening due to polymer debris in metal-on-polymer hips are well documented [3,5,9]. With the rising use of metal-on-metal, or hard-on-hard bearings as an alternative to metal-on-polymer designs, larger femoral head sizes, typically above 36 mm, were introduced, increasing joint stability, the range of motion and reducing the risk of dislocation [3,5,29]. Despite newer larger metal-on-metal bearings eliminating concerns over polymeric wear, national joint registries [4] showed significantly higher failure rates for large head metal-on-metal hips, and are now virtually been abandoned in clinical practice [29]. As mentioned previously, ceramic femoral heads are increasingly being used in THA due to their lower wear rates and improved lubrication, commonly paired with a polymer or ceramic cup [5,29]. Firkins et al. [19] found that ceramic-on-metal can dramatically reduce the wear rates during hip simulations compared to metal-on-metal. The ceramic head appears to polish the metallic cup, improving the surface finish with time and enhancing lubrication [5]. However, despite these promising findings, little work has been done towards investigating the micro-abrasion mechanisms in a ceramic-on-metal cup. The question in this study is focussed on establishing a clearer understanding of the micro-abrasion behaviour of a ceramic-on-metal bearing in abrasive conditions.
1.4. Wear Mapping
Wear mapping is a two-dimensional or three-dimensional user-friendly representation of wear data [30]. Such a tool in engineering can provide a powerful means to describe wear mechanisms, interactions and transitions during the wear process [31,32] serving as a quick, albeit approximate, guide of suitable operating conditions for components intended for tribological interactions in a larger system. Lim and Ashby demonstrated mapping of wear mechanisms as early as 1987 [33], and in more recent times, wear behaviours for biomedical implant materials [34,35], and biological materials [36] have been demonstrated. Wear mapping for biomedical implants is a developing and essential area of research.
The purpose of this preliminary study is to investigate and evaluate the micro-abrasion wear behaviour of CoCrMo and Al2O3 (aluminium oxide or alumina) metal-on-ceramic couples under abrasive and idealised hip contact conditions; to construct corresponding micro-abrasion wear maps for a range of ball sizes, representing femoral head diameters, over a range of applied loads. The objective is therefore to identify and evaluate the basic wear mechanisms and transitions occurring during micro-abrasion, and to establish micro-abrasion wear maps for the test parameter range.
2. Materials and Methods
2.1. Experimental Overview
Figure 1 shows a schematic diagram of the micro-scale abrasion apparatus (Plint TE-66, Phoenix Tribology, Reading, UK). Briefly, an alumina (Al2O3) ball is clamped between coaxial shafts and driven by a variable speed DC motor. Shaft revolutions are counted by a batch counter connected to the shaft. A flat cobalt chromium molybdenum (CoCrMo) sample is mounted vertically on a pivoted arm and is loaded against the ball by a dead weight hanging from the horizontal shaft. An abrasive slurry of silicon carbide (SiC) particles suspended in a mixture of foetal calf serum and sodium chloride (NaCl) solution is fed to a point proximal to the contact interface. The slurry is stored in a glass container and constantly agitated with a mechanical stirrer during the test. The slurry is pumped by an integral peristaltic pump at a pump feed rate of 1 mL s−1. Tests are repeated for a range of applied loads and different ball radii.
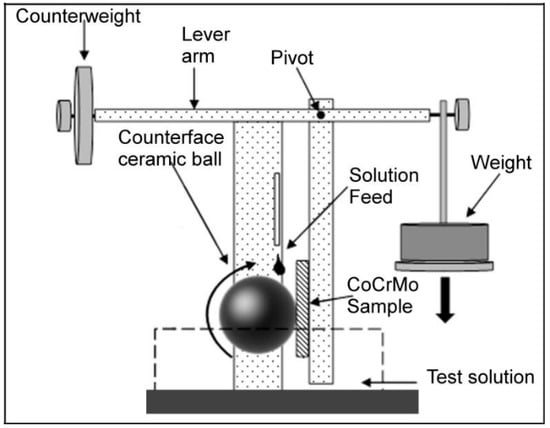
Figure 1.
Schematic diagram showing the micro-abrasion apparatus.
2.2. Test Materials
Low-carbon CoCrMo alloy samples (ASTM F-1537) (ATI, Pittsburgh, PA, USA), supplied as flat 4-mm-thick disks 29-mm in diameter, were used in the micro-abrasion tests. The chemical composition for the CoCrMo alloy is shown in Table 1. Prior to testing, the samples (Table 2) were ground and polished by conventional metallographic techniques using SiC paper up to 2000 grit and were subsequently polished to a mirror finish. The sample was polished to a mirror finish using a 0.05-µm colloidal silica paste (surface roughness: Ra = 0.002 ± 0.01 µm), representing the polished surface materials used in hip implants. The surface roughness of the CoCrMo sample was measured using an MFP-3D Atomic Force Microscope (Asylum Research, Goleta, CA, USA).

Table 1.
Chemical composition for the CoCrMo (ASTM F-1537).

Table 2.
Material properties used for the micro-abrasion tests.
Aluminium oxide, more commonly known as alumina (Al2O3) (Redhill Precision, Czech Republic), grade 28 balls were supplied in varying sizes (25, 28, 32, and 35 mm) for the counter-face rotating ball, representing a range of femoral head diameters. The alumina balls were unused prior to testing (surface roughness: Ra = 0.050 ± 1.4 µm). The ball diameters were selected to investigate the effect of varying femoral head sizes in a ceramic-on-metal bearing.
The slurry solution is composed of 0.9 wt. % sodium chloride (NaCl) (Sigma-Aldrich, Darmstadt, Germany) with 10 vol. % foetal calf serum (FCS) (Biosera, Nuaillé, France). The solution represents a simple simulated biological fluid with a pH value of 7.3, containing a similar level of chloride occurring in the human body. The FCS was stored in a freezer and defrosted to room temperature within 24 h of testing to prevent the decomposition of the protein. Grade F-1200 silicon carbide (SiC) particles (UKGE Ltd., Suffolk, UK) were used as third-body abrasive particles, with a mean particle size of 3.5 ± 0.5 μm. The particle grains were highly irregular and angular. The final slurry volume fraction used in this study was 0.0078 (0.025 g mL−1) and remained constant for each test.
2.3. Testing Procedure
The CoCrMo sample is prepared and mounted securely in the vertical specimen holder as described earlier. The specimen holder is fitted to a pivoted L-shape arm, which can be rotated to bring the sample into contact with the alumina ball. Each test is conducted for a duration of 30 min, equivalent to a sliding distance of 235.53 m for the 28-mm ball, and up to 329.74 m for the 35-mm ball. The slurry solution is pumped at a feed rate of 1 mL s−1, based on the 0.5mm bore at the head of the pump. Table 3 provides of summary of the testing conditions.

Table 3.
Micro-abrasion experimental parameters.
A load is applied by adding dead weights to the cantilever arm (Figure 1). The range of applied loads tested during this study was 0.5–5 N. The sample is brought to a position just in front of the ball, using the counterweight to ensure that all force applied to the specimen is exerted from the dead weights. In this position, the appropriate weights are added. It is possible to conduct several tests on a single specimen by shifting the sample holder arm in a horizontal direction. In this study, a new specimen was used for each ball size. In total, 20 tests were carried out over five loads (0.5, 1, 2, 3, 5 N) and four ball radii (25, 28, 32, 35 mm), representing different femoral head sizes. Prior to testing, the CoCrMo specimens were washed ultrasonically and air dried. After completion of testing, the specimens were rinsed with distilled water and dried in air to retain the proteinaceous surface material.
2.4. Wear Data Analysis
Following micro-abrasion testing, the wear scars were observed by scanning electron microscopy (SEM) to identify the dominant wear mechanisms and wear features. In this study, the surface topography analysis and resulting micrographs were acquired using a tungsten filament SEM (Hitachi S-3700, Hitachi, Krefeld, Germany). Prior to imaging, the specimen was rinsed in distilled water and allowed to dry in air. Each resulting wear scar was imaged at varying magnifications to capture and measure the details of the wear scar diameter and surface wear scar features or patterns. An example of a typical wear scar micrograph is shown in Figure 2.
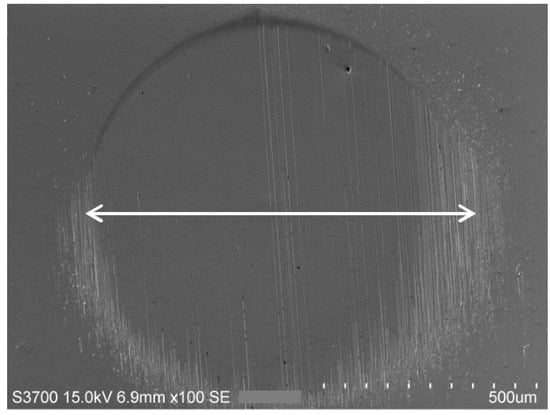
Figure 2.
Typical wear scar following micro-abrasion testing on CoCrMo surface.
The volume of material loss (V) can be calculated using an established method for measuring the wear of a spherical geometry in Equation (1) [37], by measuring the crater diameter (b) (Figure 2), and the ball radius R (for b << R), i.e., it is assumed that the shape of the wear crater conforms to the shape of the ball.
It is conventional to interpret wear loss data in terms of an Archard or Rabinowicz wear equation [38], as given by Equation (2). This simple model (as proposed by Rutherford and Hutchings [37]) is obeyed well under most conditions for bulk materials experiencing abrasive wear, and is completely equivalent to the Archard equation for sliding wear, where the volume of wear V is dependent on the sliding distance S and the applied normal load N, and κ is the specific wear rate or wear coefficient. Each wear scar represents one experimental result; in this study, the error in the results was estimated to be ±9% based on the average of results from three consecutive tests. Wear loss data based on this analysis was evaluated and mapped to identify regions of micro-abrasion wastage and transitioning behaviours.
3. Results
3.1. SEM Analysis of Wear Scars
Wear scars formed on the CoCrMo surface following the micro-abrasion tests were inspected using SEM, as described earlier. Micro-abrasion wear regimes, processes and scar diameters could be determined under high magnification. The volume loss V of the material was estimated from the wear scar diameter, as given by Equation (1).
Generally, the wear scars could be clearly classified as either exhibiting uniform parallel grooves, as shown in Figure 3a,b, associated with the micro-cutting action of abrasive particles entrained through the contact surface by the ball, or as effectively remaining in a fixed position on the ball—usually referred to as two-body abrasion. The grooves formed on the surface are likely to be due to the SiC particles becoming entrained between the ball and CoCrMo. On the other hand, the scars could be classified as exhibiting a lesser groove formation, often prominent towards the centre of the scar and surrounded by multiple indents or no visible indication of groove formation (Figure 3c,d), associated with the motion of particles rolling (as a third body) between the sample and ball surface, referred to as third-body abrasion. Conglomerates of wear debris were a common feature found on the wear scars in this study, seen as dark patches and shown in Figure 3d circled in white. It has been established in other work [39] that proteins are likely to adsorb to the metallic surface when immersed in a protein-containing solution. Since a protein solution was constantly fed to the sample and ball contact, a protein layer is expected to form on the material surfaces; therefore, wear debris are likely to become entwined with the protein in the wear area during the sliding process.
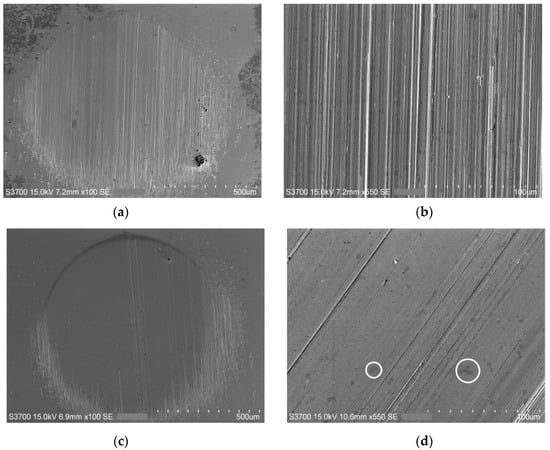
Figure 3.
SEM images of representative surface wear scars produced during micro-scale abrasion with a 0.0078 volume fraction (0.025 g mL−1) SiC slurry: (a,b) two-body (grooving) abrasion; (c,d) mixed-mode abrasion. Conglomerates of protein shown circled in white.
3.2. Wear Volumes
The variation of wear volumes for CoCrMo during micro-abrasion under different applied loads and ball sizes are shown in Figure 4. The error in wear volume measurement was estimated to be ±9% based on the average of three consecutive tests. The corresponding mass losses, Kac (defined as the mass loss due to abrasion and corrosion) can be determined by multiplying the wear volumes by the density of CoCrMo and are shown in Figure 5. It is important to note that the electrochemical (corrosion) behaviour of CoCrMo is an important aspect of the overall wear process; however, the present study was focussed on evaluating the overall wear volumes during the micro-abrasion process. Over the parameter test range investigated, CoCrMo generally exhibited a nonlinear wear loss trend. A maximum wear volume loss occurred at a load of 3 N and for the 32-mm ball, whereas minimal wear loss occurred at a load of 1 N for the 28-mm ball. It can also be seen that there was a general reduction in wear volume for the larger 35-mm ball relative to the smaller 32-mm ball, except during a load of 2 N, where the 35-mm ball exhibited a higher wear loss relative to the smaller ball diameters. Overall, the wear volumes did not appear to follow a linear trend when increasing the applied load or ball size—instead, they fluctuates over the parameter range, indicating there are other factors involved during the micro-abrasion wear process, independent of the applied load and ball size contributing to the wear process. This suggests a simple wear model, as proposed in the Archard wear equation (Equation (2)), in which the wear volume increases linearly with the applied load or sliding distance, which may not accurately predict wear behaviours during micro-abrasion conditions. There is no evidence to suggest a larger ball size or applied load, under the conditions tested, result in increased wear and vice versa.
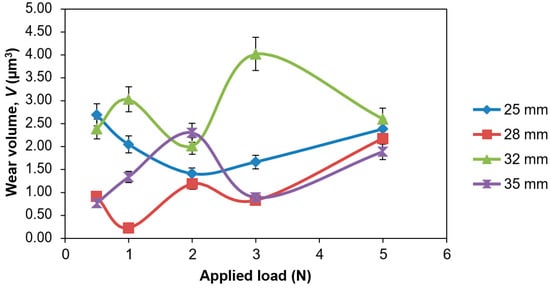
Figure 4.
Variation of CoCrMo wear volumes, V with applied loads after 3000 ball rotations for ball diameters (25, 28, 32, and 35 mm). The error in measurement was ±9% based on the average of three consecutive tests as shown.
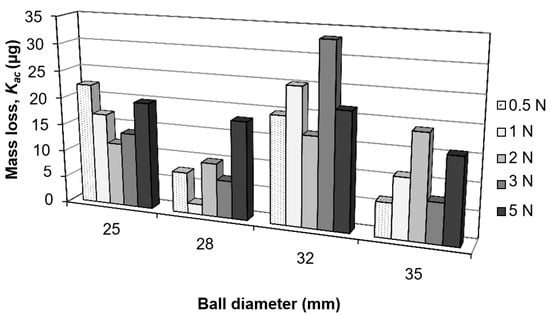
Figure 5.
Variation of CoCrMo mass losses, Κac after 3000 ball rotations for different ball diameters and applied loads.
The dimensional wear coefficient, κ, commonly referred to as the wear factor in orthopaedic hip wear studies [5], is determined from the equivalent Archard wear equations, as given in Equation (2). κ is commonly quoted in terms of wear volume per unit load per unit sliding distance (mm3/Nm), indicating the severity of wear, and allows for comparisons of materials for engineering applications [40]. A summary of the wear factors, κ, for the present study are provided in Table 4. It can be seen from Figure 6 the CoCrMo displays a wear factor of around 10−6 mm3/Nm over the test parameter range. The smallest ball size, 25 mm, exhibited a maximum wear factor, κ, of 22.87 at 0.5 N and is seen to dramatically reduce with increasing load. In a similar fashion, the wear factor, κ, was shown to decrease linearly for the range of ball sizes with an increasing load. A minimum wear factor, κ, was displayed by the 28-mm ball at a load 1 N. These results indicate the wear process may not necessarily decrease with an increasing ball size, suggesting that other factors, independent of bearing radius, could be involved during the micro-abrasion wear process.

Table 4.
Summary of results for the micro-abrasion of CoCrMo over a range of applied loads and ball diameters conducted in a protein solution and SiC abrasive particle slurry. The wear volumes, V, specific wear rate (wear factor), κ, and severities of contact S and S/S* are shown.
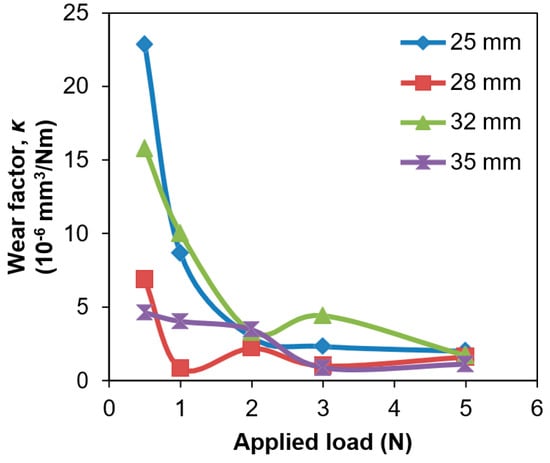
Figure 6.
Variation of the wear coefficient (wear factor), κ, for CoCrMo determined by the equivalent Archard wear equation and shown as a function of ball diameter over the range of applied loads.
3.3. Contact Pressures
To fully appreciate the overall wear processes during micro-abrasion, it is useful to estimate the pressures generated at the bearing contact interface. The contact radius between the CoCrMo and alumina ball may be determined, where the radius of the contact, a, is given by the well-known Hertzian contact equation (Equation (3)) [41]:
where N is the applied load, and R is the ball radius. The equivalent Young’s modulus, E* may be determined as given by Equation (4):
where E and v are the Young’s modulus and Poisson’s ratio for the contact bearings; the suffices one and two refer to the CoCrMo and alumina. Moreover, the Hertzian contact stress equation, as given by Equation (5) [42], may be used to estimate the theoretical maximum contact stress pmax as:
The Hertzian maximum contact pressures, pmax over the test parameter range are shown in Figure 7. It can be seen that there is a clear linear trend: as the applied load is increased there is an increase in the contact pressures. Similarly, with an increasing ball radius, the contact pressure is reduced, indicating larger ball sizes that experience lower contact pressures. Naturally, larger ball sizes provide a larger surface area for the pressure to be distributed and therefore lower pressures should be expected. It should be noted that the contact pressures shown in Figure 7 are shown for the initial contact between the ball and sample. As the wear scar is generated and increases in size during micro-abrasion, the pressure between the bearings is significantly reduced. It is therefore useful to determine the final contact pressures acting on the wear scar following wear scar formation (3000 ball revolutions). With knowledge of the measured wear scar diameter, this may be estimated in the same way using the Hertizian stress equation (Equation (5)) shown in Figure 8. It is interesting to observe the significantly reduced contact pressures relative to the initial contact pressures, ranging between 1 and 8 MPa. The final contact pressures, as with the initial ones, exhibit a linear increase with an applied load for the range of ball sizes. These results, however, indicate the lowered contact pressure from the initial to the final contact may not decline at a constant predictable rate. It can be seen that the 28-mm ball displays the highest final contact pressures relative to the range of ball sizes, whereas the 32-mm ball generally displays the lowest values over the range of applied loads. Therefore, it is clear that the contact pressure, during micro-abrasion, is significantly reduced with increasing wear but not necessarily at a predictable rate.
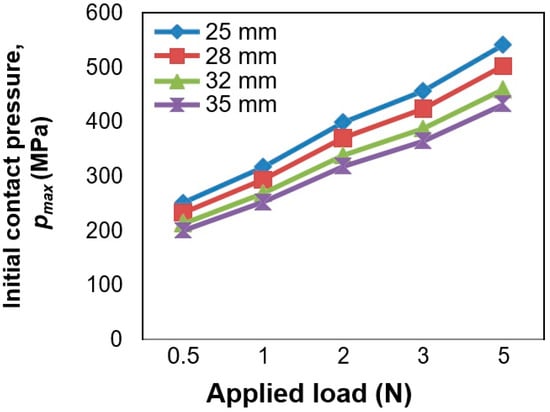
Figure 7.
Variation of the initial Hertzian maximum contact pressures, pmax generated between the CoCrMo sample and alumina balls, over the parameter range of applied loads and ball diameters.
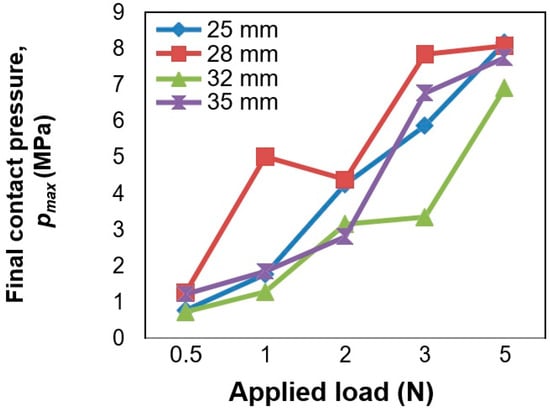
Figure 8.
Variation of the final Hertzian maximum contact pressures, pmax generated between the CoCrMo sample and alumina balls, over the parameter range of applied loads and ball diameters.
3.4. Severity of Contact, S
Adachi and Hutchings [1,43] developed, and have demonstrated, the usefulness of the term severity of contact, a dimensionless quantity relevant to micro-abrasion investigations. The severity of contact describes the dominant wear mode during the micro-abrasion of a material couple, which can be a three-body rolling or two-body grooving wear mode. It is important to know the precise wear mode occurring in the wear area. The wear mode is closely related to the severity of contact and the hardness ratio between the sample and ball. The severity of contact Sc is given by Equation (6):
This relates the applied load, N, equivalent material hardness for the bearing materials, H′, abrasive volume fraction, v, and the interaction area A; the equivalent hardness H′ is given by Equation (7), where Hb and Hs represent the hardness of the ball and sample, respectively:
The interaction area A, is an estimation of the true area of contact between the surfaces of the ball, sample and abrasive particles, as given by Equation (8) [1]:
where a is the Hertzian contact radius determined by Equation (3), R the ball radius, and D is the diameter of the abrasive particles.
The severity of contact, Sc, has been plotted as a function of the applied load over the different ball diameters shown in Figure 9. The severity of contact, Sc for the range of balls and applied loads is found to range between values of 10−2 and 1. It can be clearly seen that the severity of contact, Sc increases with increasing applied load, suggesting an increasing load intensifies the wear process, i.e., increasing severity. In terms of ball size, the severity of contact, Sc is shown to reduce with increasing ball radius, indicating reduced severity with increasing ball size as shown Figure 9.
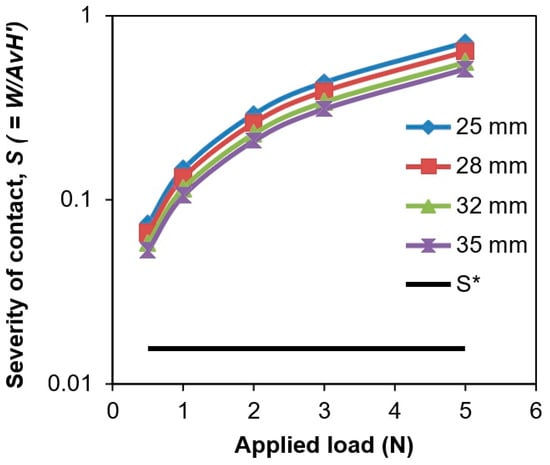
Figure 9.
Severity of contact, S a dimensionless group (W/AvH′) developed by Adachi and Hutchings [1], shown as a function of ball diameters over the range of applied loads. S* indicates the theoretical threshold where it has been suggested a three-body rolling mode transitions to two-body grooving mode.
It is further useful to inspect the quantity, S*, developed by Adachi and Hutchings [1]; a threshold value used to define the transition boundary from three-body rolling to two-body grooving, during micro-abrasion, which is likely to occur when the severity of contact, Sc exceeds this value. The condition, therefore, defining the threshold, where three-body rolling will likely occur below, and two-body grooving likely above the threshold value is given by Equation (9) [1]:
α and β are empirical constants for which the values and have been shown to be valid over a wide range of experimental conditions [1], and so the given values were employed in the present analysis for conventional and comparative purposes. A summary of the results is provided in Table 4. The threshold value, S* as shown in relation to the severity of contact, Sc Figure 9. The severity of contact, in the present study, far exceed the threshold value S* over the entire parameter range. This suggests, theoretically, the dominant wear mode likely to be observed over the parameter range is a two-body grooving mode; and since the severity of contact values far exceed threshold, S*, it should be unlikely to observe three-body rolling mode [1].
4. Discussion
4.1. Wear Scar Topography
Over a range of applied loads and ball sizes, in the presence of a protein and abrasive particle solution during micro-abrasion, the wear scars displayed a dominant ridged or grooved topography. This indicates a two-body abrasion regime dominated for most of the wear tests as shown in Figure 3a,b. Earlier work conducted by Trezonna et al. [44] concluded that the formation of ridges on the wear scar surface form as a result of entrainment of abrasive particles in the wear contact. Similarly, this has been found to be the case in studies conducted by Stack et al. [45] investigating the micro-abrasion transitions of metallic materials. In this work it has been observed, the ridge formation is more likely at higher loads, but this is not necessarily a linear relationship, since evidence of a mixed-mode (two-body grooving and three-body rolling) has been observed (Figure 3c,d) at intermediate applied loads and ball diameters; and so there are clearly other factors that must be considered to explain the complete wear mechanisms during the range of parameters investigated in this present study.
4.2. Wear Volumes
A simple abrasion wear model equivalent to the Archard model Equation (2) predicts that the wear volume should be directly proportional to the total sliding distance, such that the volume of wear loss per unit sliding distance remains constant. In the case of micro-abrasion testing, it should be recognised that the wear contact increases with the sliding distance. Furthermore, this can be verified by examining the wear scar surface after testing, which are clearly and distinctly formed on the sample surface. In addition, the initial Hertzian maximum contact pressures (Figure 7) have been estimated to range between 200 and 542 MPa for the conditions tested in this study. However, these values are significantly reduced reaching final Hertzian contact pressures (Figure 8) ranging between 1 and 8 MPa, for the conditions tested. Assuming that the concentration of the abrasive particle solution remains constant during testing, then the load per abrasive particles will decrease as the wear volume increases. Therefore, it is not certain that the wear volume per unit sliding distance should necessarily remain constant for the duration of micro-abrasion testing, and this may explain the variation of wear volumes as a result of abrasive particle activity and change of pressure in the wear contact. This was observed by the measured wear volumes (Figure 4) displaying a non-linear trend over the parameter range, suggesting the wear process, during micro-abrasion, is not a simple case of applying the Archard wear model to predict the wear volumes.
4.3. Wear Mapping
Micro-abrasion wear maps have been developed by several researchers [1,45], demonstrating a useful approach for characterising wear rates, modes and transitions over a given range of operating parameters. However, there has been limited work in mapping the micro-abrasion for biomaterials operating in simulated physiological solutions. In earlier work Stack et al. [45] proposed a technique for developing micro-abrasion transition maps, building on original analysis for abrasive wear developed by Williams and Hynica [46]. Williams and Hynica defined the transitioning boundaries, three-body rolling to two-body grooving abrasion during micro-abrasion, as determined by a critical ratio (D/h), between the abrasive particle major axis (D) and distance (h) between the two counter surfaces. Stack et al. [45,47] proposed dividing the micro-abrasion mechanism as a function of increasing load and wear volumes as:
- two- to three-body micro-abrasion: three-body rolling abrasion transitioning into two-body grooving, indicating a linearly increasing wear volume with increasing load.
- two-body ridging (two-body-r) micro-abrasion: for which ‘ridging’ (r) indicates a two-body grooving transition to ridge formation. A decreasing wear volume with increasing load is observed during this regime as a result of particle entrapment within the ridge spaces, or particles being forced out of the wear contact zone towards the outer wear scar.
The predicted wear mechanisms can be otherwise verified by means of SEM analysis of the surface topography. These images can be studied to determine which mechanisms appear to have been present. In this work, there is little indication of increase in wear volume with increasing load, hence, following the methodology devised by Stack et al. the regime corresponds to a two- to three-body regime, as defined above. A mixed-mode regime, corresponding to a two- to three-body abrasion scheme, was found to occur at loads less than 1 N. At larger ball diameters, above 28 mm, mixed-mode abrasion is prolonged to at least 2 N applied load. A mechanism map was constructed to map the transitions of the two-body-r and two- to three-body schemes shown in Figure 10, where the regions are clearly displayed over the test parameter range. It can be seen during light loads and large ball diameters that the acting wear mechanism is a two- to three-body regime, over which the wear volume increases with increasing load. As the ball diameter is decreased, it can be clearly seen there is a transition to two-body-r, suggesting the load per particle is probably higher, and therefore two-body abrasion occurs sooner at the light loads. The severity of contact, Sc, does not appear to increase with load, as Figure 9 suggests, and this may be due to the presence of the protein, which will be discussed later. Interestingly, at the 28-mm ball diameter, a two- to three-body regime occurs at a load of 2 N, but remains as two-body-r at both a lower and an increased load. Similarly, at the same ball diameter, both an increase and a reduction in ball size transition occurs from a two- to three-body to a two-body-r regime. This region corresponds to a higher final contact pressure, as shown in Figure 8 for the 28-mm ball at 2 N; however, there is no clear explanation for this sudden transition.
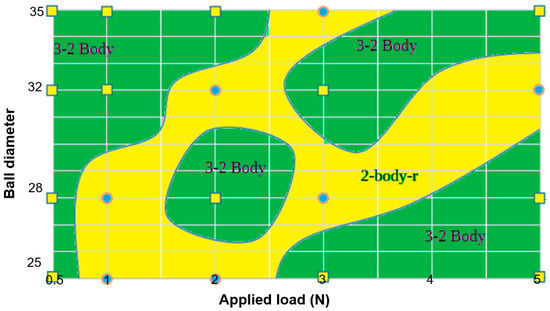
Figure 10.
Micro-abrasion mechanism map for CoCrMo alloy (flat) sliding against a rotating alumina (ball) in foetal calf serum (FCS) solution (pH 7.3, temperature 25 °C), displaying the wear mechanisms and transition regions over the testing parameters.
A wastage map may also be constructed, corresponding to the mechanism map, and identifying regions of material wastage. The wastage regions are shown as a function of increasing applied load; as shown in Figure 11, the boundaries of wastage, Kac (material loss due to abrasion and corrosion) follow those devised by Stack et al. [45] and given by:
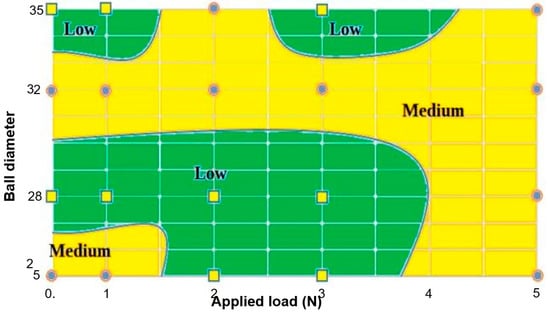
Figure 11.
Micro-abrasion wastage map for CoCrMo alloy (flat) sliding against a rotating alumina (ball) in FCS solution (pH 7.3, temperature 25 °C), displaying the regions of wear volume severities.
The wastage map shown (Figure 10) displays regions of low, medium or high wastage for each experimental data point and predictions for the surrounding areas. It can be seen from the wastage map that regions of low and medium wastage are displayed, and thus that high levels of wastage did not occur, which should be expected in a ceramic-on-metal coupling. There appears to be constant medium wear for the 32-mm radius ball across all loads and at 5 N across all ball sizes. For other data points, there appears to be no obvious trend based on our initial observations. The low wastage regions broadly correlate well with regions of two-body-r abrasion and, similarly, regions of medium wastage correlate with a two- to three-body regime, though not entirely. In combination, regions of ideal micro-abrasion, or optimal conditions may be identified. While two-body-r abrasion generates initial wear loss and the formation of ridges, particles are able to become entrapped within the ridges and therefore wear volume may not necessarily increase with applied load. The low wastage regions and indication of two-body-r by mapping, and the overall low wear factor and wear volumes exhibited by the 28-mm ball, suggest that there is scope to determine an optimal ball size, or femoral head diameter, for the conditions tested. Of course, due to the limited parameter range investigated in the present work, further studies must be done to map a wider range of conditions in determining the ideal ball size for patient specific and clinical factors. In this study, with the larger ball sizes, 32 and 35 mm, mixed-mode abrasion tends to dominate over the range of loads, reflected also in the high wear factors and wear volumes observed.
4.4. Effect of Applied Load and Ball Diameter
The equivalent Archard equation Equation (2) predicts that the abrasive wear volume should be directly proportional to the applied load, i.e., increasing wear volume with increasing load. The data presented in Figure 4 suggest that wear volume, for the test conditions in this study, do not necessarily exhibit a linear trend in all cases. This has also been found to be the case in other studies investigating micro-scale abrasion [35,45,48]. Trezona et al. [44] have previously shown that for two-body grooving wear with slurries of very low abrasive volume fractions, below 0.003, the wear volume is almost independent of the normal load. This is explained by the total embedding of the abrasive particles when there are very few of them in the contact. It is likely that a similar mechanism occurred during the present work for an abrasive volume fraction of 0.0078, where it can be seen that, in both micro-abrasion mechanisms and wastage maps (Figure 10 and Figure 11), there was a non-linear relationship between wear and applied load. Trezona et al. also found, for three-body rolling abrasion, that the abrasive volume fraction does appear to be proportional to the load. In this work, SEM analysis displayed no indication of entirely three-body abrasion over the tested parameter range, and thus could explain the non-linearity of wear volumes with the applied load, which would only be expected under three-body conditions. In terms of the equivalent Archard equation (Equation (2)), the wear volumes did not necessarily increase with increasing load. When determining the transitions between two-body and three-body abrasion, Trezona et al. found that with increasing load, particles may become embedded more deeply within the bearing surface, where the corresponding wear volume is not as great. It has been proposed that the particles embed so deeply that they no longer behave as wear particles, but this generally occurs at low abrasive volume fractions. It is very interesting, then, to find similar evidence of deep particle embedment in the present work, as shown in Figure 12. Parallel grooving or ridge formation is clearly visible, and circled in red is a particle embedded deeply in a large gouged ridge. This explains the non-linearity of the wear volume with the increasing load, as suggested by Trezona et al.; as the load increases, the particle no longer acts to abrade the surface, but becomes more deeply embedded. In the regions of two-body-r (Figure 10) it is not unreasonable, then, to suggest that the particles behave in this way at the abrasive volume fraction employed, and therefore that wear volume does not linearly increase with an increasing load. As the mechanism transitions to a two- to three-body regime, where wear volume does increase with load, the third-body abrasive particles are not embedded into the material surface, but roll between the bearing contacts, though not completely, as no evidence of an entirely three-body abrasion was found upon inspection of the wear scar topographies. Where a mixed-mode abrasion occurred, it is likely, then, that the particles become embedded only towards the centre of the ball and sample contact, as evidenced by SEM micrographs Figure 3. For each applied load, each ball size contributes differently to the overall wear. The 28-mm ball appears to consistently produce the least wear, except at the 5 N load, where all sizes display similar wear volumes and wear factors. This may be explained by the smaller Hertzian contact area for the 28-mm ball size, therefore reducing the area over which wear can occur and abrasive particles can become entrained. Similarly, this would also increase the contact pressure and stresses (Figure 8) and lower the severity of contact, Sc. Two-body-r wear is displayed for this ball size at loads of 1 and 3 N, and this is where wear tends to decrease, as mentioned, potentially as a result of ridges inhibiting the particles’ ability to abrade the specimen surface. As can be seen in Figure 12, there is good evidence of wide ridge formation, which could allow for particle entrainment without abrading either surface.
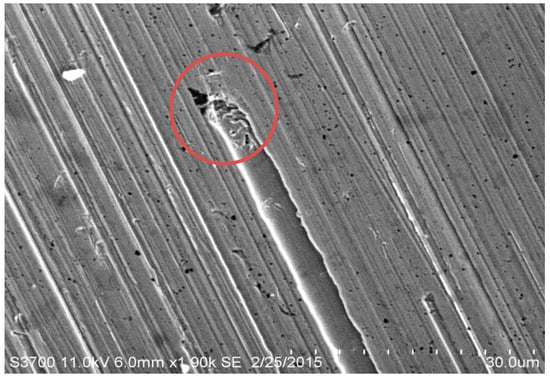
Figure 12.
SEM micrograph for 28-mm ball and 2 N load displaying a wide groove, several times that of those surrounding it. At the front of the groove, there are signs of compressed material being gouged through the surface. This groove may allow small particles to pass without abrading the surface.
It is interesting to see that the 35-mm ball displayed significantly less wear than the 32-mm ball over the range of applied loads, which could be explained by the improved lubrication of the contact area and the reduced contact stresses (Figure 8). The wear mechanisms also show that, for this ball size, the specimen undergoes predominantly two- to three-body wear in the form of abrasion, with two-body-r being predicted only at a load of 3N. At this load, the wear appears to decrease. It is worth noting that, with a larger ball diameter, the ball rotates at a higher velocity, which has been known to increase the lubricant viscosity and lower the pure abrasive wear [9]. Higher speeds at the contact could also result in an increased temperature, or frictional heating, resulting in the formation and removal of oxides on the surface [45]. The presence of protein may enhance the lubrication, due to faster protein precipitation and the formation of adherent layers acting as a film or rolling elements, which will be discussed next.
4.5. Presence of Protein
In this study, a 10 vol. % FCS in 0.9 wt. % NaCl solution was used for the micro-abrasion test slurry. In a previous study investigating the micro-abrasion–corrosion of CoCrMo under similar conditions but coupled with a polymer ball, energy dispersive X-ray analysis showed that the wear scar surfaces contained proteinaceous organic material [35], confirmed qualitatively by the energy dispersive spectrum high carbon and nitrogen peaks. In metal-on-metal hip implant studies, the presence of protein was shown to form a biofilm, or tribofilm, on the bearing surfaces, composed of inorganic graphitic carbon [7,49,50]. It has been shown by Wimmer et al. [49] that the tribofilms formed on metal hip-bearing surfaces originate from protein-containing fluid. In their implant retrieval studies, Wimmer et al. found that the tribolayers formed on CoCrMo surfaces are nanocrystalline in structure, incorporating organic material and linked to synovial fluid from patients. The tribolayers are formed by a mechanism termed ‘mechanical mixing’ with a thickness of up to 200 nm, in which the metal surface and organic material form a composite mixed layer, thus hindering direct metal contact and preventing adhesion in metal-on-metal implants. In other retrieval and hip simulation studies, Yan et al. [51,52] also found the presence of a tribofilm up to 80-nm thick. While details of their formation are still not fully understood, there is good evidence that tribofilms contain a mix of organic species (proteins) and metals, termed organometallics, and could improve wear rates due to their enhanced lubrication [11,49,50]. It is evident from the many studies of metal hip wear that the proteins in the fluid play a critical role in the lubrication [7], but not necessarily due to the protein themselves, but rather to a graphitic carbon material which may act as a solid lubricant [49].
Sun et al. investigated the micro-abrasion of CoCrMo in protein-containing slurry solutions coupled with a 25.4-mm ceramic ball [48,53]. In these studies, it was shown that the presence of protein enhances wear loss at high abrasive volume fractions (0.238) due to the enhanced particle entrainment, whereas, at low abrasive volume fractions (0.006), the protein reduced the wear loss. It is thought that the improved wear loss at lower abrasive fractions is due to the protein acting as a boundary lubricant, or rolling elements which reduced the abrasiveness of the abrasive particles. Wear rates and wear mechanisms for CoCrMo depend on the nature of the third body abrasives, the entrainment of abrasives into the contact, and the presence of proteins. Interestingly, in the present study, SEM micrographs Figure 3d were found to contain conglomerates of material embedded on the wear scar surface, similar to the findings of Sun et al., which have previously been found to contain high peaks of carbon and nitrogen in energy dispersive X-ray analysis [35]. In this study, an abrasive volume fraction of 0.0078 was employed, and the resulting wear scar morphologies are in good agreement with the findings of Sun et al., at similar volume fractions. SEM analysis, in this study of resulting wear scars, generally displayed a parallel grooving topography at low loads and at 25 mm ball diameters, likely as result of two-body abrasion [27], though mixed-mode abrasion was also observed at various loads and ball diameters.
The micro-abrasion mechanism map (Figure 10) clearly displays the two-body-r regions, defined as two-body wear, dominated by ridge formation and wear decreases with an increasing load. It has been shown by Stack et al. [45] that, in the regions of two-body-r, particles become entrained in the formed ridges and, at higher loads, protective layers of oxide are formed on the material surface as a result of frictional heating. In this study, it is not unreasonable to believe that there are certain interactions between the abrasive particles, wear debris, the presence of proteins and the formation of ridges. The severity of contact, Sc, in the present study, as shown in Figure 9, exceeds the transition threshold, S*, indicating an expected two-body abrasion over the parameter range and the volume fraction employed, as determined by Adachi and Hutchings [1]. However, it is clear from the wear scar results in this study that this was not always the case, particularly at light loading, where mixed-mode abrasion was found to occur. The presence of protein is the main important difference between the wear mode mapping developed by Adachi and Hutchings, and the difference in expected wear mode behaviour in this study. It therefore appears, very clearly, that the severity of contact is significantly reduced by the presence of protein, and the theoretical results shown in Figure 9 are, in reality, likely to be found closer to the threshold boundary, S*. The conglomerates of protein, as suggested by Sun et al., may act as boundary lubricants or rolling elements during the micro-abrasion process, which, in this study, would correspond to the regions of two-body-r. The micro-abrasion mechanisms and wastage maps clearly identify the optimal regions for two-body-r to occur, where ridge formation is found to occur and the wear rate is reduced with increasing loads.
5. Conclusions
The micro-abrasion wear mechanisms for CoCrMo against alumina balls of variable sizes, representing typical artificial femoral head sizes, over a range of applied loads, have been investigated in this study. From the experimental results obtained, the following conclusions can be drawn:
- (i)
- Contrary to the Archard or Rabinowicz equation, wear volumes may not necessarily occur linearly with an increasing load and sliding distance. Micro-abrasion involves additional factors, indicating a need to develop more accurate models for wear prediction.
- (ii)
- Micro-abrasion wear maps have been constructed as a function of ball diameter and applied load. The micro-abrasion mechanism map indicates significant differences between regions of three-body (mixed) and two-body abrasion regimes for CoCrMo. Similarly, the wastage map indicates significant regions of low and medium mass loss wastage.
- (iii)
- Generally, two- to three-body abrasion dominates. The morphological features of the wear scars often consist of mixed-mode abrasion during light loads, which appears to dominate at larger ball diameters over the applied load range.
- (iv)
- At a 28-mm ball diameter, the lowest wastage is generated with an increasing load. Transitions between two- to three-body and two-body-r abrasion occur most often for the 28-mm and 32-mm ball diameters, depending on the applied load.
- (v)
- The presence of protein may reduce of the severity of contact, Sc, between the abrasive particles and counter-bearing surfaces due to enhanced particle entrainment and increased particle rolling efficiency.
Overall, in this study, a hip replacement metal-on-ceramic couple has been studied under idealised hip contact conditions, and over a limited parameter range. While the corrosion during the micro-abrasion process, i.e., tribo-corrosion, has not been the focus of the current study, it is an important consideration for future work. The performance of hip replacements within a tribological system is multi-parameter and complex by nature. This is further complicated by the addition of patient-specific or clinical factors such as age, body weight, activity levels, joint kinematics and even implant alignments. Even though wear mapping specific to biomedical implants, demonstrated in this study, remain a developing area, longer term work will involve efforts to map over broader multi-parameter ranges geared towards patient-specific and clinical factors. Wear mapping for hip replacement could provide a useful aid in pre-clinical hip wear evaluations and long-term performance.
Author Contributions
Conceptualization, K.S., R.A.B., M.A.S. and M.M.S.; methodology, K.S.; software, K.S.; validation, K.S., formal analysis, K.S. and M.A.S.; investigation, K.S. and M.A.S.; resources, R.A.B. and M.M.S. through EPSRC CDT in Medical Devices; data curation, K.S.; writing—original draft preparation, K.S.; writing—review and editing, K.S., M.A.S., R.A.B. and M.M.S.; visualization, K.S.; supervision, M.M.S. and R.A.B.; project administration, M.M.S. and R.A.B.; funding acquisition, EPSRC grant below to PC. All authors have read and agreed to the published version of the manuscript.
Funding
This research was funded by EPSRC Centre for Doctoral Training on Medical Devices, grant number Ref. EP/F50036X/1, Principal Investigator, Professor Patricia Connolly, Department of Biomedical Engineering, University of Strathclyde, Glasgow.
Acknowledgments
The authors wish to thank Mathew T. Mathew (Rush University Medical Center, USA and University of Illinois) for supplying the CoCrMo specimens used in this study, and to acknowledge the UK Engineering & Physical Sciences Research Council (EPSRC) Doctoral Training Centre in Medical Devices, University of Strathclyde (Grant Ref. EP/F50036X/1) for sponsorship of this work.
Conflicts of Interest
The authors declare no conflict of interest.
References
- Adachi, K.; Hutchings, I. Wear-mode mapping for the micro-scale abrasion test. Wear 2003, 255, 23–29. [Google Scholar] [CrossRef]
- Holzwarth, U.; Cotogno, G. Total Hip Arthroplasty: State of the Art, Challenges and Prospects, JRC Scientific and Policy Reports; Publications Office of the European Union: Brussels, Belgium, 2012. [Google Scholar]
- 12th Annual Report 2015. In National Joint Registry for England, Wales, Northern Island and the Isle of Man; Registry, N.J., Ed.; NJR: London, UK, 2015. [Google Scholar]
- Malak, T.T.; Beard, D.; Glyn-Jones, S. Total Hip Arthroplasty: Recent Advances and Controversies; Topical Reviews No. 4; Nuffield Orthopaedic Centre: Oxford, UK, 2014; pp. 1–9. [Google Scholar]
- Dowson, D. New joints for the Millennium: Wear control in total replacement hip joints. Proc. Inst. Mech. Eng. Part H J. Eng. Med. 2001, 215, 335–358. [Google Scholar] [CrossRef]
- Gopinathan, P. The Hard on Hard Bearings in THA—Current concepts. J. Orthop. 2014, 11, 113–116. [Google Scholar] [CrossRef]
- Liao, Y.; Hoffman, E.; Wimmer, M.; Fischer, A.; Jacobs, J.J.; Marks, L. CoCrMo metal-on-metal hip replacements. Phys. Chem. Chem. Phys. 2013, 15, 746–756. [Google Scholar] [CrossRef]
- Affatato, S.; Spinelli, M.; Zavalloni, M.; Mazzega-Fabbro, C.; Viceconti, M. Tribology and total hip joint replacement: Current concepts in mechanical simulation. Med. Eng. Phys. 2008, 30, 1305–1317. [Google Scholar] [CrossRef] [PubMed]
- Jin, Z.M.; Stone, M.; Ingham, E.; Fisher, J. (V) Biotribology. Curr. Orthop. 2006, 20, 32–40. [Google Scholar] [CrossRef]
- Pourzal, R.; Urban, R.M.; Wimmer, M.A. What Do the Retrievals Really Tell Us? In Metal-on-Metal Bearings; Springer Science and Business Media LLC: Berlin/Heidelberg, Germany, 2013; pp. 173–193. [Google Scholar]
- Wimmer, M.; Loos, J.; Nassutt, R.; Heitkemper, M.; Fischer, A. The acting wear mechanisms on metal-on-metal hip joint bearings: In vitro results. Wear 2001, 250, 129–139. [Google Scholar] [CrossRef]
- Bhatt, H.; Goswami, T. Implant wear mechanisms—Basic approach. Biomed. Mater. 2008, 3, 42001. [Google Scholar] [CrossRef] [PubMed]
- Affatato, S.; Traina, F.; De Fine, M.; Carmignato, S.; Toni, A. Alumina-on-alumina hip implants: A wear study of retrieved components. J. Bone Jt. Surg. Br. 2012, 94, 37–42. [Google Scholar] [CrossRef] [PubMed]
- Bowsher, J.G.; Clarke, I.C.; Williams, P.; Donaldson, T.K. What is a “Normal” wear pattern for metal-on-metal hip bearings? J. Biomed. Mater. Res. Part B Appl. Biomater. 2009, 91, 297–308. [Google Scholar] [CrossRef]
- Wimmer, M.A.; Sprecher, C.; Hauert, R.; Tager, G.; Fischer, A. Tribochemical reaction on metal-on-metal hip joint bearings—A comparison between in-vitro and in-vivo results. Wear 2003, 255, 1007–1014. [Google Scholar] [CrossRef]
- Mathew, M.T.; Nagelli, C.; Pourzal, R.; Fischer, A.; Laurent, M.; Jacobs, J.J.; Wimmer, M. Tribolayer formation in a metal-on-metal (MoM) hip joint: An electrochemical investigation. J. Mech. Behav. Biomed. Mater. 2013, 29, 199–212. [Google Scholar] [CrossRef] [PubMed]
- Yan, Y.; Neville, A.; Dowson, D.; Williams, S.; Fisher, J. Tribofilm formation in biotribocorrosion—Does it regulate ion release in metal-on-metal artificial hip joints? Proc. Inst. Mech. Eng. Part J J. Eng. Tribol. 2010, 224, 997–1006. [Google Scholar] [CrossRef]
- Wang, A.; Essner, A. Three-body wear of UHMWPE acetabular cups by PMMA particles against CoCr, alumina and zirconia heads in a hip joint simulator. Wear 2001, 250, 212–216. [Google Scholar] [CrossRef]
- Firkins, P.; Tipper, J.; Ingham, E.; Stone, M.; Farrar, R.; Fisher, J. A novel low wearing differential hardness, ceramic-on-metal hip joint prosthesis. J. Biomech. 2001, 34, 1291–1298. [Google Scholar] [CrossRef]
- Barnes, C.L.; DeBoer, D.; Corpe, R.S.; Nambu, S.; Carroll, M.; Timmerman, I. Wear Performance of Large-Diameter Differential-Hardness Hip Bearings. J. Arthroplast. 2008, 23, 56–60. [Google Scholar] [CrossRef]
- Huet, R.; Sakona, A.; Kurtz, S.M. Strength and reliability of alumina ceramic femoral heads: Review of design, testing, and retrieval analysis. J. Mech. Behav. Biomed. Mater. 2011, 4, 476–483. [Google Scholar] [CrossRef]
- Jeffers, J.R. The role of biomechanics and engineering in total hip replacement. Why surgeons need technical help. Proc. Inst. Mech. Eng. Part H J. Eng. Med. 2012, 226, 947–954. [Google Scholar] [CrossRef] [PubMed]
- Gant, A.J.; Gee, M. A review of micro-scale abrasion testing. J. Phys. D Appl. Phys. 2011, 44, 73001. [Google Scholar] [CrossRef]
- Sinnett-Jones, P.; Wharton, J.; Wood, R.J. Micro-abrasion–corrosion of a CoCrMo alloy in simulated artificial hip joint environments. Wear 2005, 259, 898–909. [Google Scholar] [CrossRef]
- Stack, M.M.; Jawan, H.; Mathew, M.T. On the construction of micro-abrasion maps for a steel/polymer couple in corrosive environments. Tribol. Int. 2005, 38, 848–856. [Google Scholar] [CrossRef]
- Sadiq, K.; Black, R.A.; Stack, M.M. Bio-tribocorrosion mechanisms in orthopaedic devices: Mapping the micro-abrasion–corrosion behaviour of a simulated CoCrMo hip replacement in calf serum solution. Wear 2014, 316, 58–69. [Google Scholar] [CrossRef]
- Williams, J.A. Wear and wear particles—Some fundamentals. Tribol. Int. 2005, 38, 863–870. [Google Scholar] [CrossRef]
- Allsopp, D.; Trezona, R.; Hutchings, I. The effects of ball surface condition in the micro-scale abrasive wear test. Tribol. Lett. 1998, 5, 259–264. [Google Scholar] [CrossRef]
- Cooper, H.J.; Della Valle, C.J. Large diameter femoral heads. Bone Jt. J. 2014, 96, 23–26. [Google Scholar] [CrossRef] [PubMed]
- Lim, S.C. Wear Maps. In Encyclopedia of Tribology; Springer Science and Business Media LLC: Berlin/Heidelberg, Germany, 2013; pp. 4007–4012. [Google Scholar]
- Hsu, S.; Shen, M.; Ruff, A. Wear prediction for metals. Tribol. Int. 1997, 30, 377–383. [Google Scholar] [CrossRef]
- Stack, M.M. Bridging the gap between tribology and corrosion: From wear maps to Pourbaix diagrams. Int. Mater. Rev. 2005, 50, 1–17. [Google Scholar] [CrossRef]
- Lim, S.; Ashby, M. Overview no. 55 Wear-Mechanism maps. Acta Met. 1987, 35, 1–24. [Google Scholar] [CrossRef]
- Stack, M.M.; Rodling, J.; Mathew, M.T.; Jawan, H.; Huang, W.; Park, G.; Hodge, C. Micro-abrasion–corrosion of a Co–Cr/UHMWPE couple in Ringer’s solution: An approach to construction of mechanism and synergism maps for application to bio-implants. Wear 2010, 269, 376–382. [Google Scholar] [CrossRef]
- Sadiq, K.; Stack, M.M.; Black, R.A. Wear mapping of CoCrMo alloy in simulated bio-tribocorrosion conditions of a hip prosthesis bearing in calf serum solution. Mater. Sci. Eng. C 2015, 49, 452–462. [Google Scholar] [CrossRef]
- Amini, S.; Miserez, A. Wear and abrasion resistance selection maps of biological materials. Acta Biomater. 2013, 9, 7895–7907. [Google Scholar] [CrossRef]
- Petersen, D.R.; Link, R.E.; Rutherford, K.L.; Hutchings, I.M. Theory and Application of a Micro-Scale Abrasive Wear Test. J. Test. Eval. 1997, 25, 250. [Google Scholar] [CrossRef]
- Roylance, B.J.; Williams, J.A.; Dwyer-Joyce, R. Wear debris and associated wear phenomena—Fundamental research and practice. Proc. Inst. Mech. Eng. Part J J. Eng. Tribol. 2000, 214, 79–105. [Google Scholar] [CrossRef]
- Liao, Y.; Pourzal, R.; Wimmer, M.A.; Jacobs, J.J.; Fischer, A.; Marks, L.D. Graphitic Tribological Layers in Metal-on-Metal Hip Replacements. Science 2011, 334, 1687–1690. [Google Scholar] [CrossRef] [PubMed]
- Greer, A.L.; Rutherford, K.L.; Hutchings, I.M. Wear resistance of amorphous alloys and related materials. Int. Mater. Rev. 2002, 47, 87–112. [Google Scholar] [CrossRef]
- Hamilton, G.M. Explicit Equations for the Stresses beneath a Sliding Spherical Contact. Proc. Inst. Mech. Eng. Part C J. Mech. Eng. Sci. 1983, 197, 53–59. [Google Scholar] [CrossRef]
- Sharma, R.; Vannabouathong, C.; Bains, S.; Marshall, A.; Macdonald, S.J.; Parvizi, J.; Bhandari, M. Meta-Analyses in Joint Arthroplasty: A Review of Quantity, Quality, and Impact. J. Bone Jt. Surg. Am. Vol. 2011, 93, 2304–2309. [Google Scholar] [CrossRef]
- Adachi, K.; Hutchings, I. Sensitivity of wear rates in the micro-scale abrasion test to test conditions and material hardness. Wear 2005, 258, 318–321. [Google Scholar] [CrossRef]
- Trezona, R.; Allsopp, D.; Hutchings, I. Transitions between two-body and three-body abrasive wear: Influence of test conditions in the microscale abrasive wear test. Wear 1999, 225, 205–214. [Google Scholar] [CrossRef]
- Stack, M.M.; Mathew, M.T. Micro-abrasion transitions of metallic materials. Wear 2003, 255, 14–22. [Google Scholar] [CrossRef]
- Williams, J.; Hyncica, A. Mechanisms of abrasive wear in lubricated contacts. Wear 1992, 152, 57–74. [Google Scholar] [CrossRef]
- Stack, M.M.; Chi, K. Mapping sliding wear of steels in aqueous conditions. Wear 2003, 255, 456–465. [Google Scholar] [CrossRef]
- Sun, D.; Wharton, J.; Wood, R. Micro-abrasion mechanisms of cast CoCrMo in simulated body fluids. Wear 2009, 267, 1845–1855. [Google Scholar] [CrossRef]
- Wimmer, M.A.; Fischer, A.; Büscher, R.; Pourzal, R.; Sprecher, C.; Hauert, R.; Jacobs, J.J. Wear mechanisms in metal-on-metal bearings: The importance of tribochemical reaction layers. J. Orthop. Res. 2009, 28, 436–443. [Google Scholar] [CrossRef]
- Yan, Y.; Wang, L.; Neville, A.; Qiao, L. (IV) Tribofilm on hip implants. Orthop. Trauma 2013, 27, 93–100. [Google Scholar] [CrossRef]
- Yan, Y.; Neville, A.; Dowson, D. Biotribocorrosion of CoCrMo orthopaedic implant materials—Assessing the formation and effect of the biofilm. Tribol. Int. 2007, 40, 1492–1499. [Google Scholar] [CrossRef]
- Yan, Y.; Neville, A.; Dowson, D.; Williams, S.; Fisher, J. Tribo-corrosion analysis of wear and metal ion release interactions from metal-on-metal and ceramic-on-metal contacts for the application in artificial hip prostheses. Proc. Inst. Mech. Eng. Part J J. Eng. Tribol. 2008, 222, 483–492. [Google Scholar] [CrossRef]
- Sun, D.; Wharton, J.A.; Wood, R.J.K. The Effects of Protein and pH on the Tribo-Corrosion Performance of Cast CoCrMo—A Combined Electrochemical and Tribological Study. Adv. Tribol. 2009, 825–826. [Google Scholar] [CrossRef]
© 2020 by the authors. Licensee MDPI, Basel, Switzerland. This article is an open access article distributed under the terms and conditions of the Creative Commons Attribution (CC BY) license (http://creativecommons.org/licenses/by/4.0/).