On the Simulation of the Micro-Contact of Rough Surfaces Using the Example of Wet Friction Clutch Materials

 , , ,
, , , 
Abstract
:
1. Introduction
2. Methods and Materials
3. Results
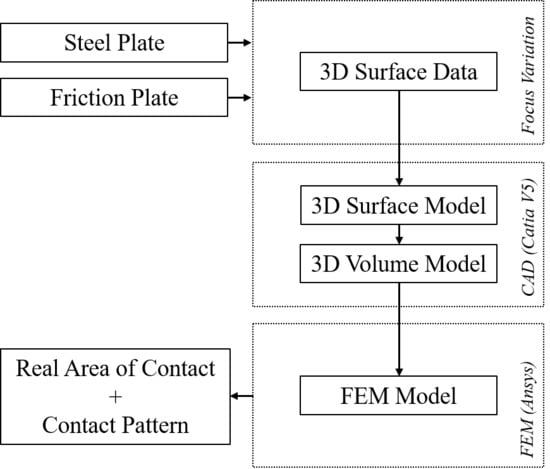
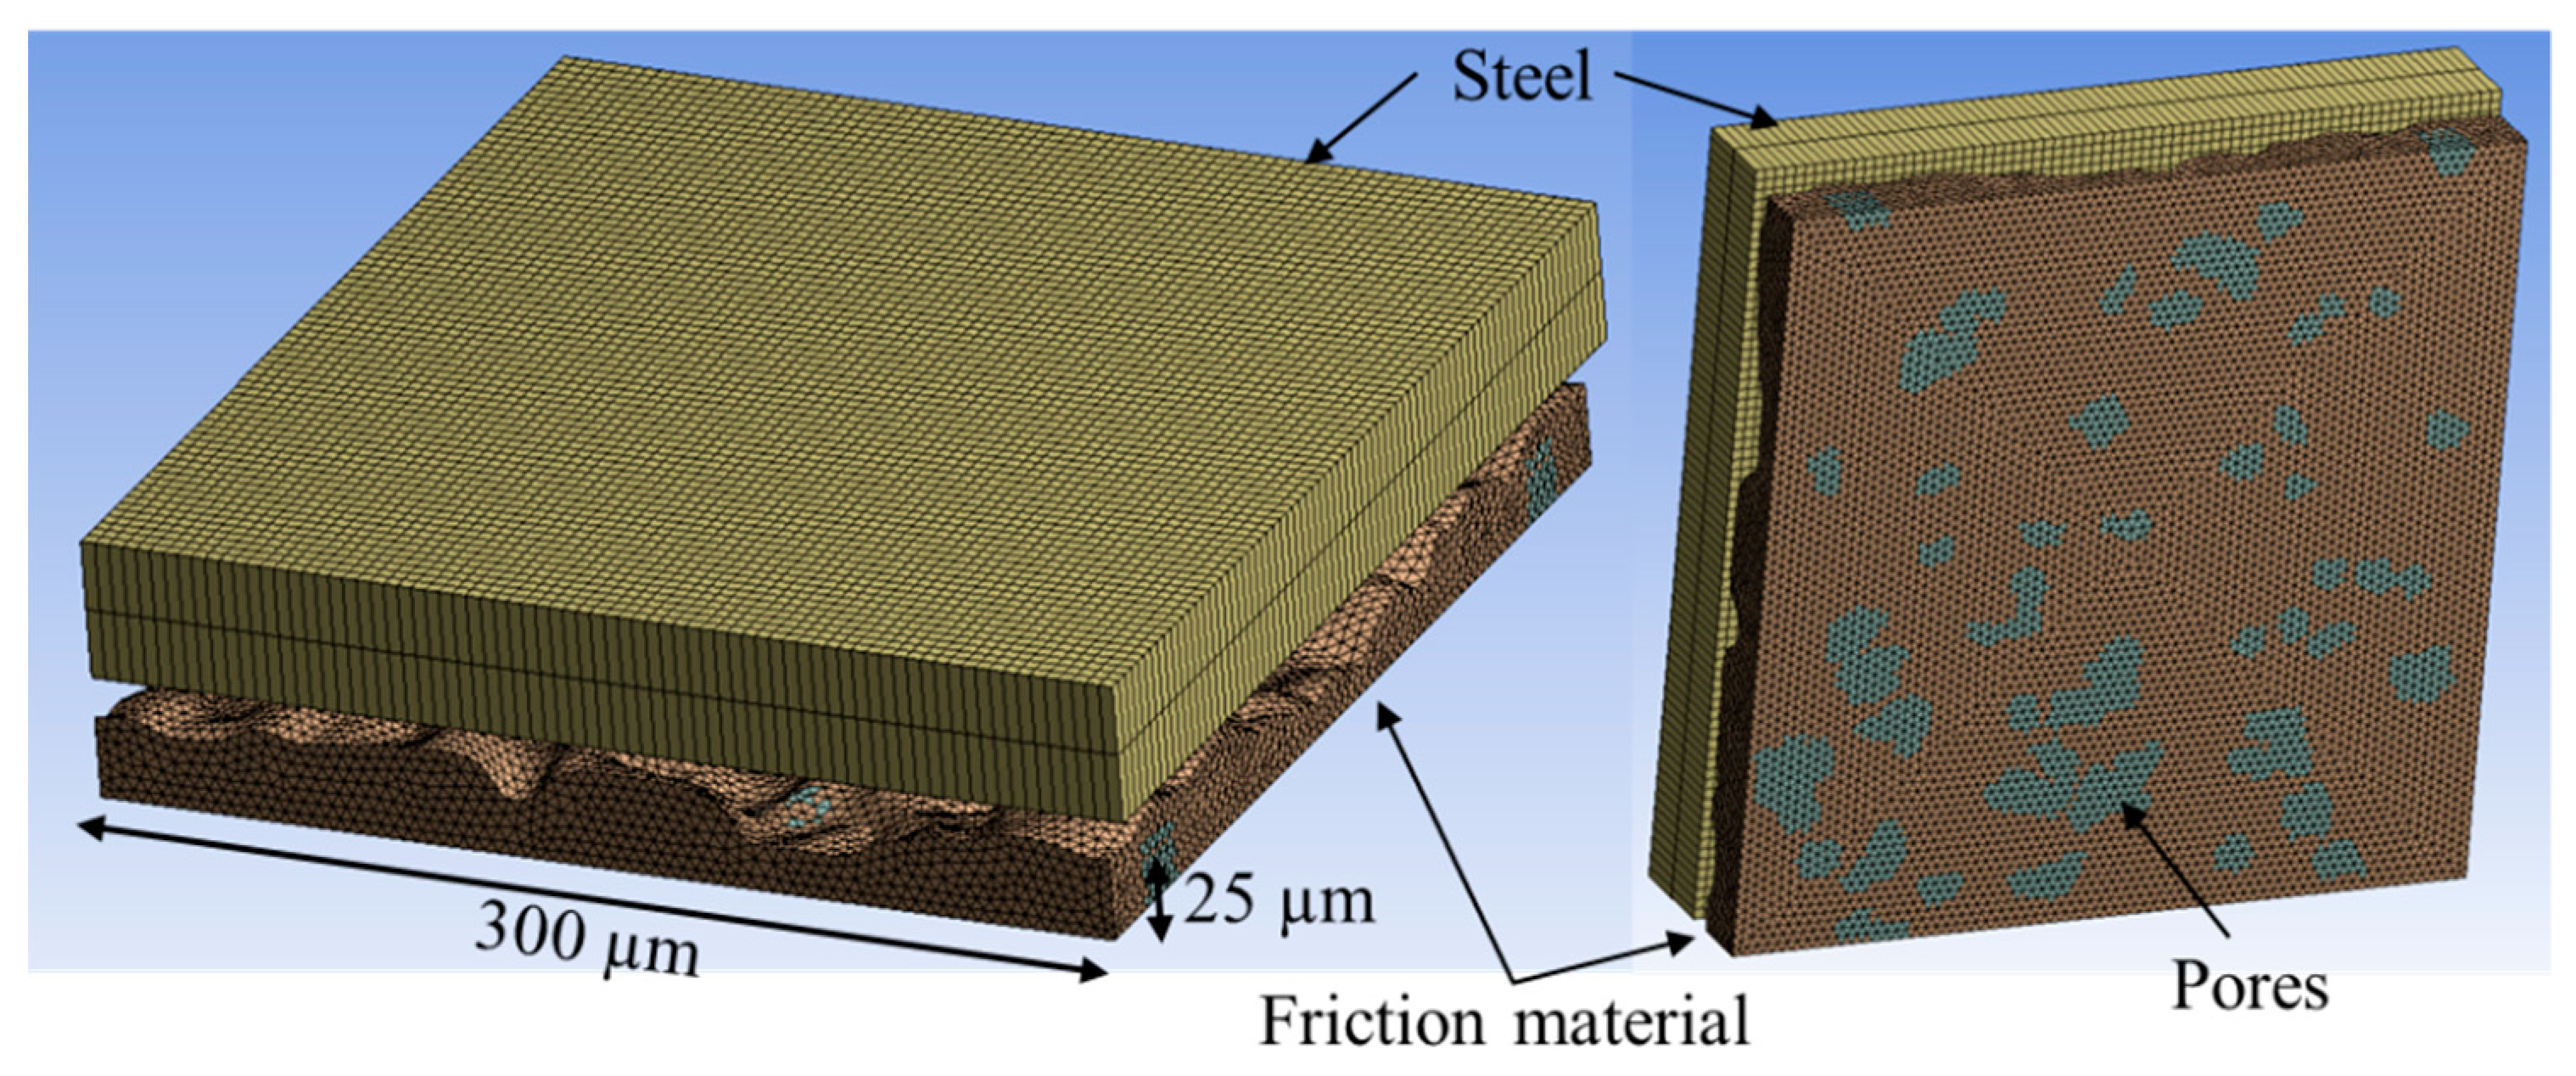
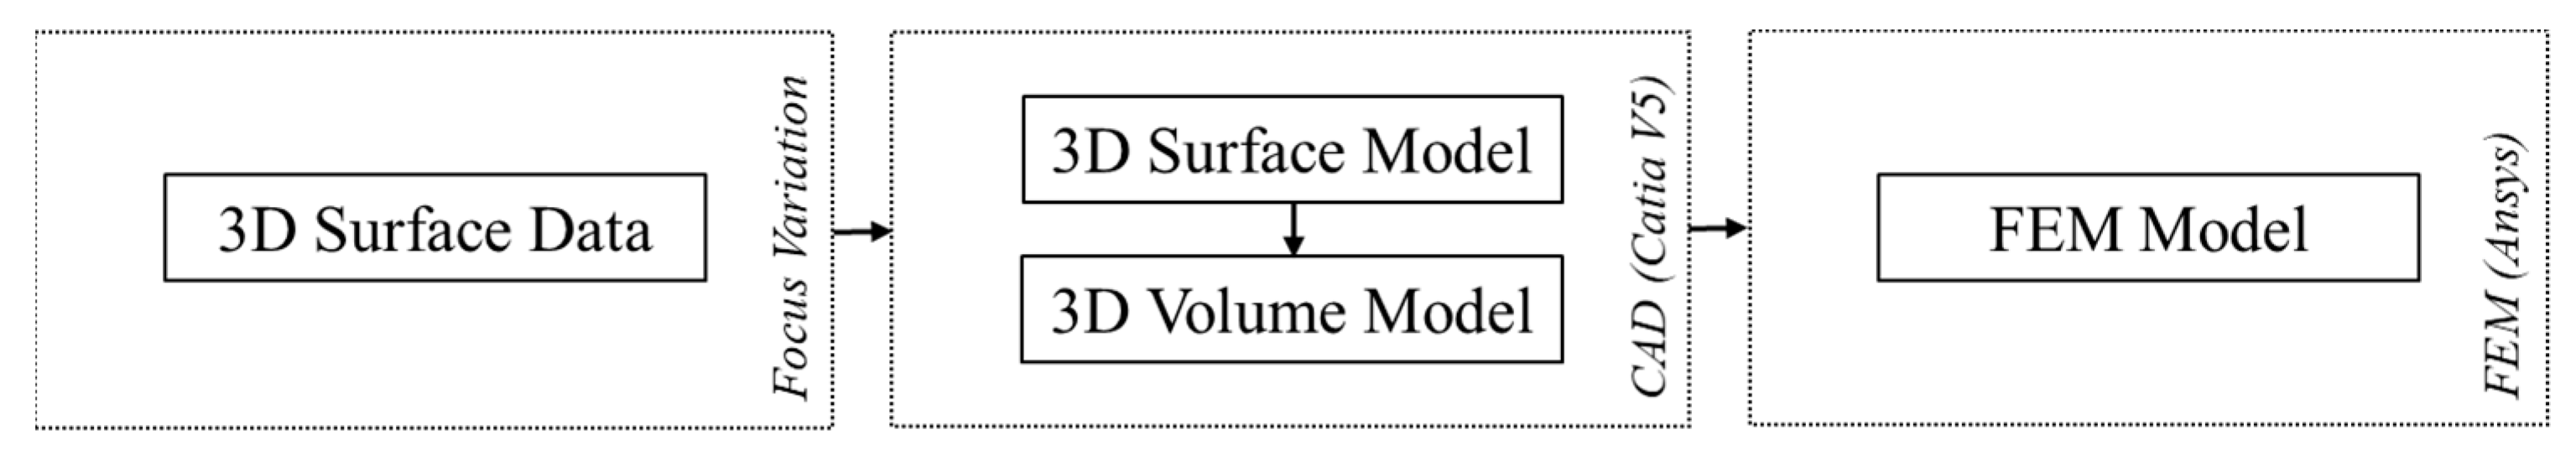
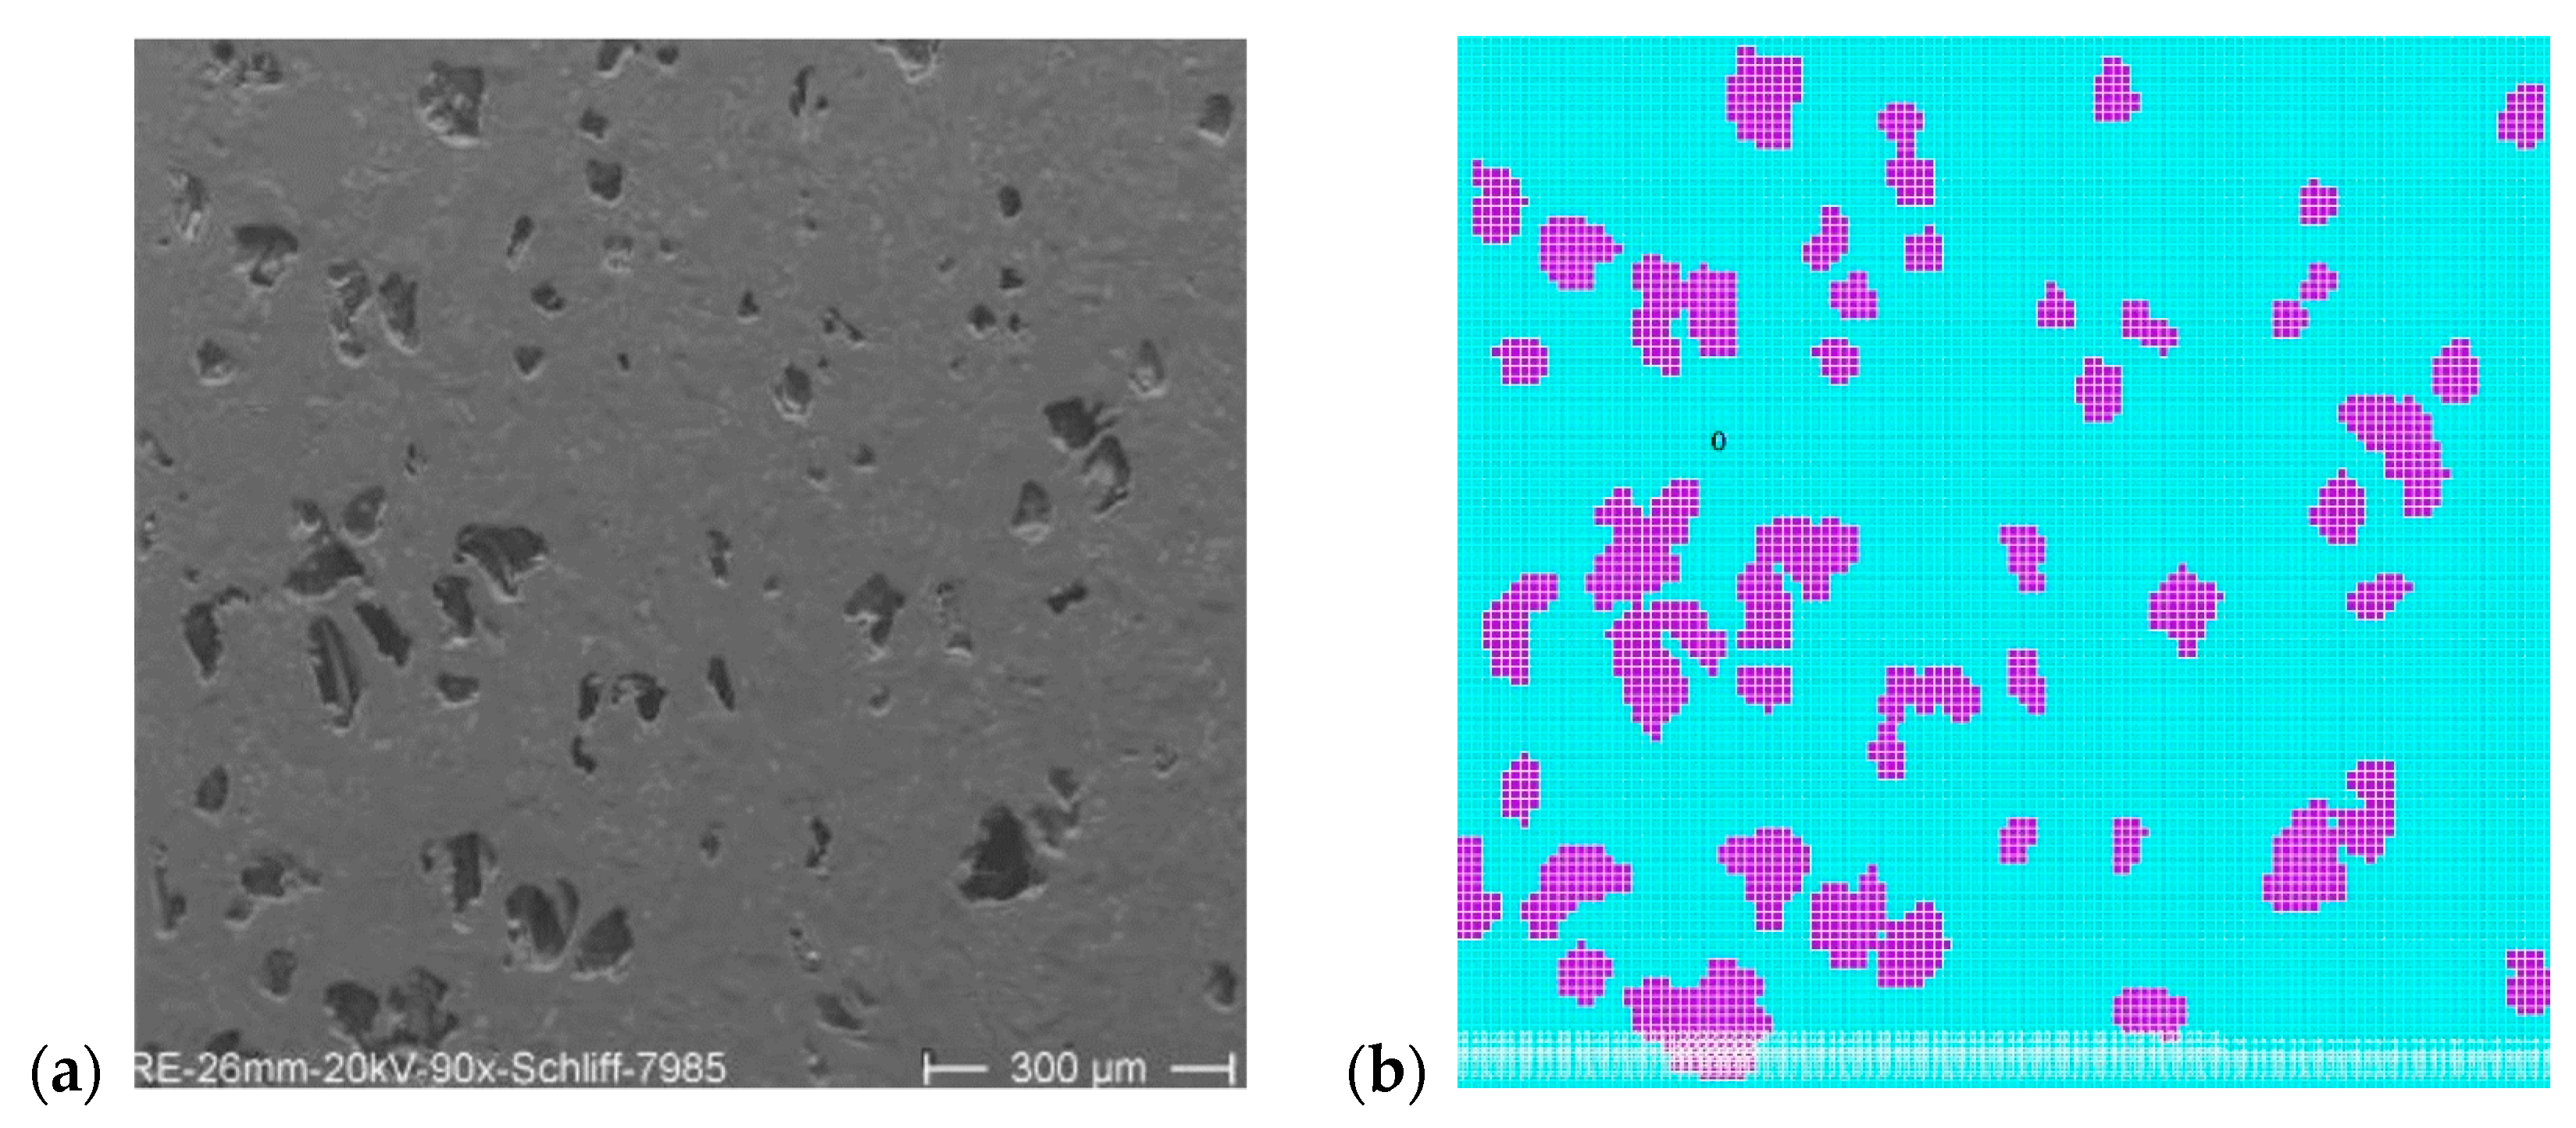
3.1. Derivation of a FEM Model from Surface Measurement
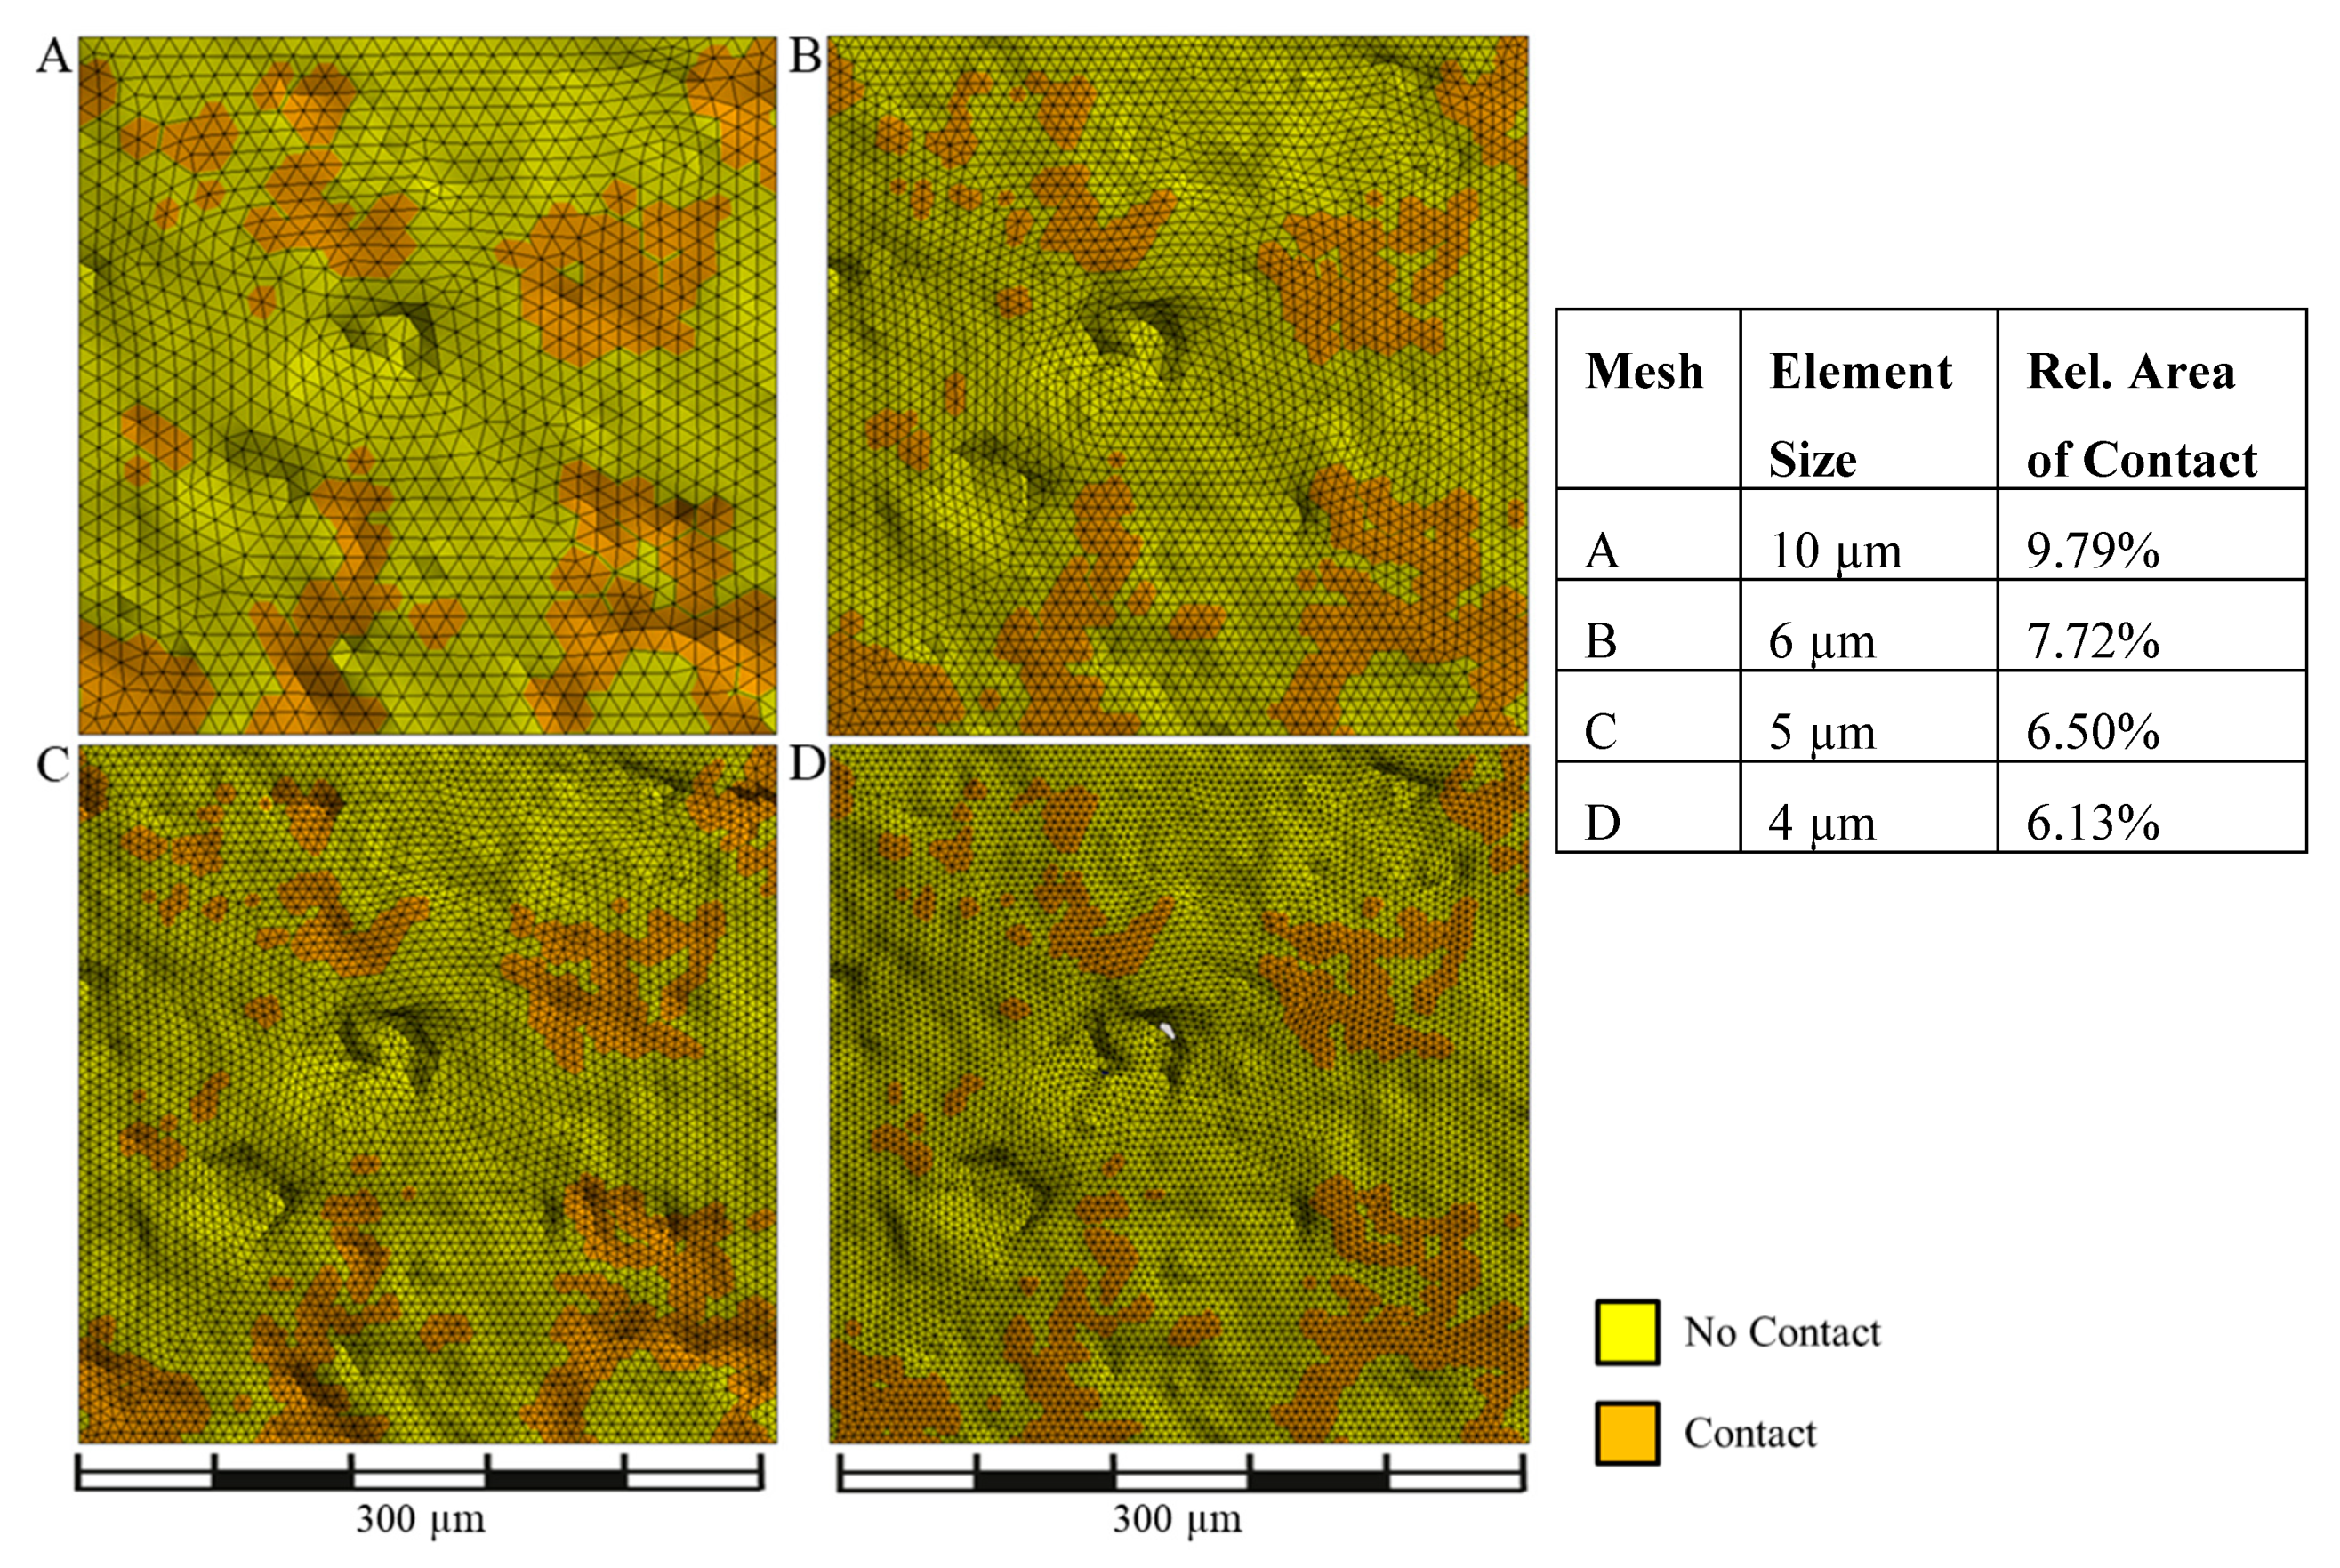
3.2. Meshing: Variation of Element Size
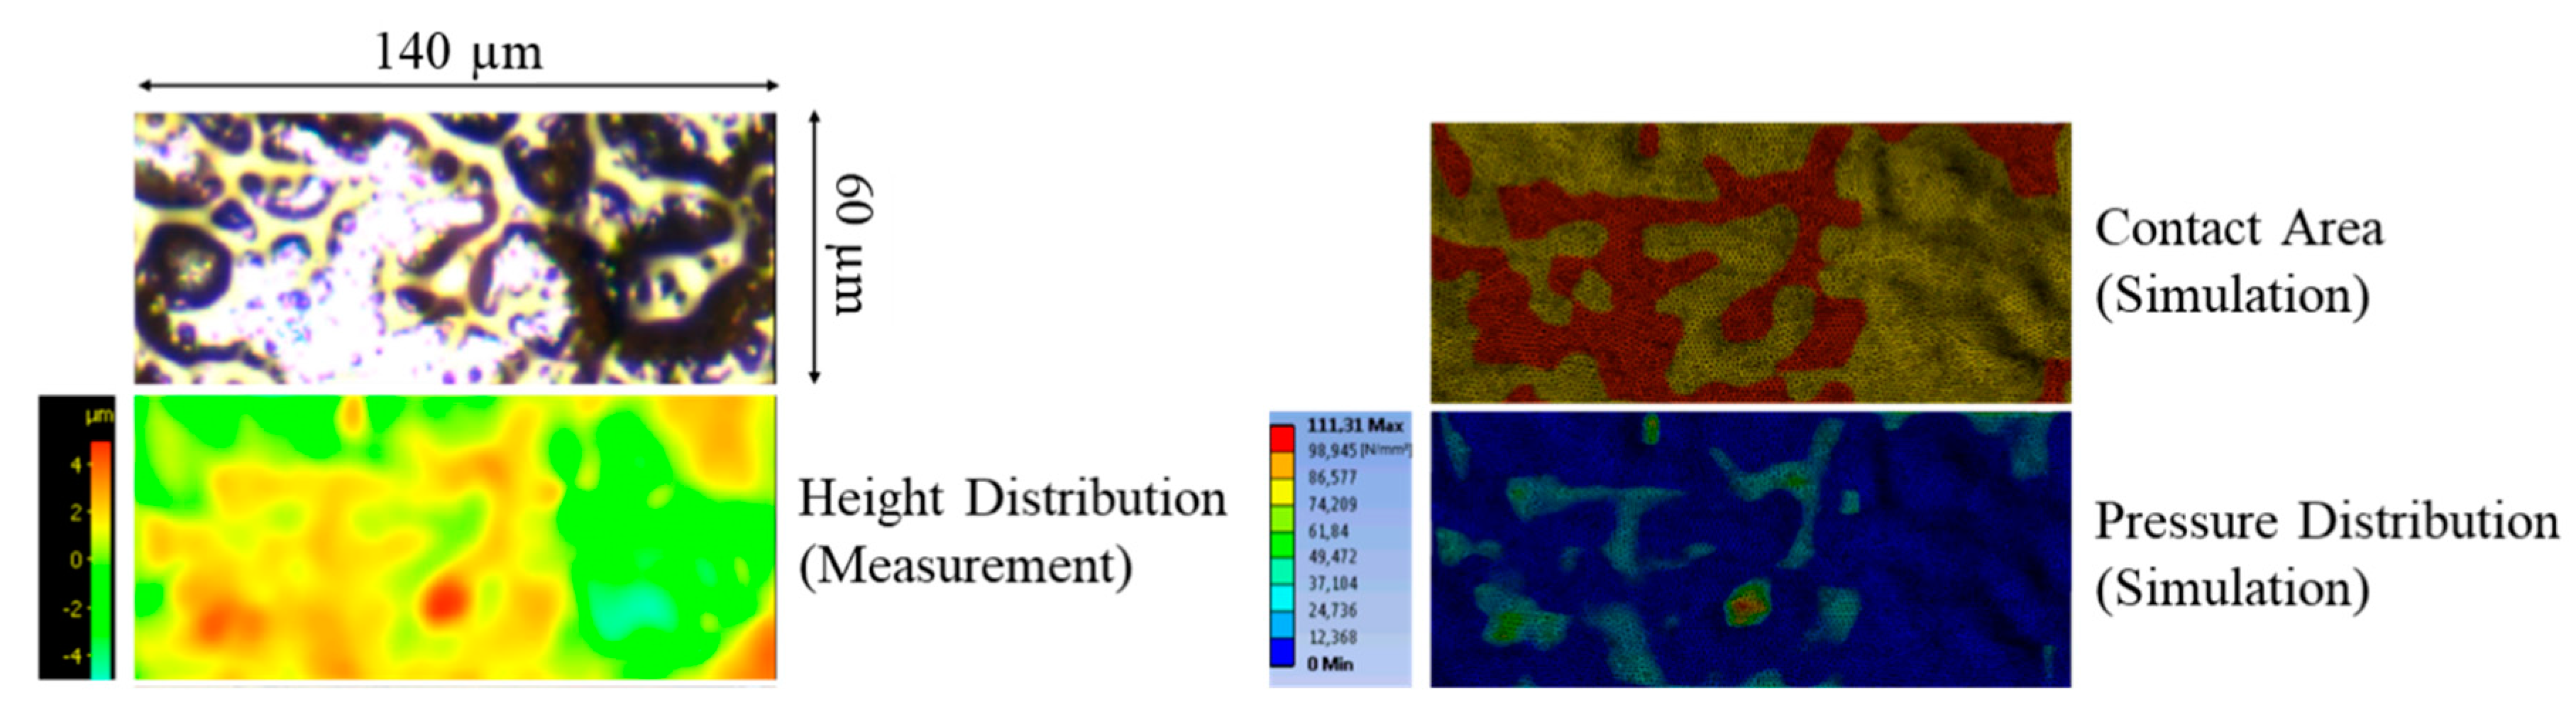
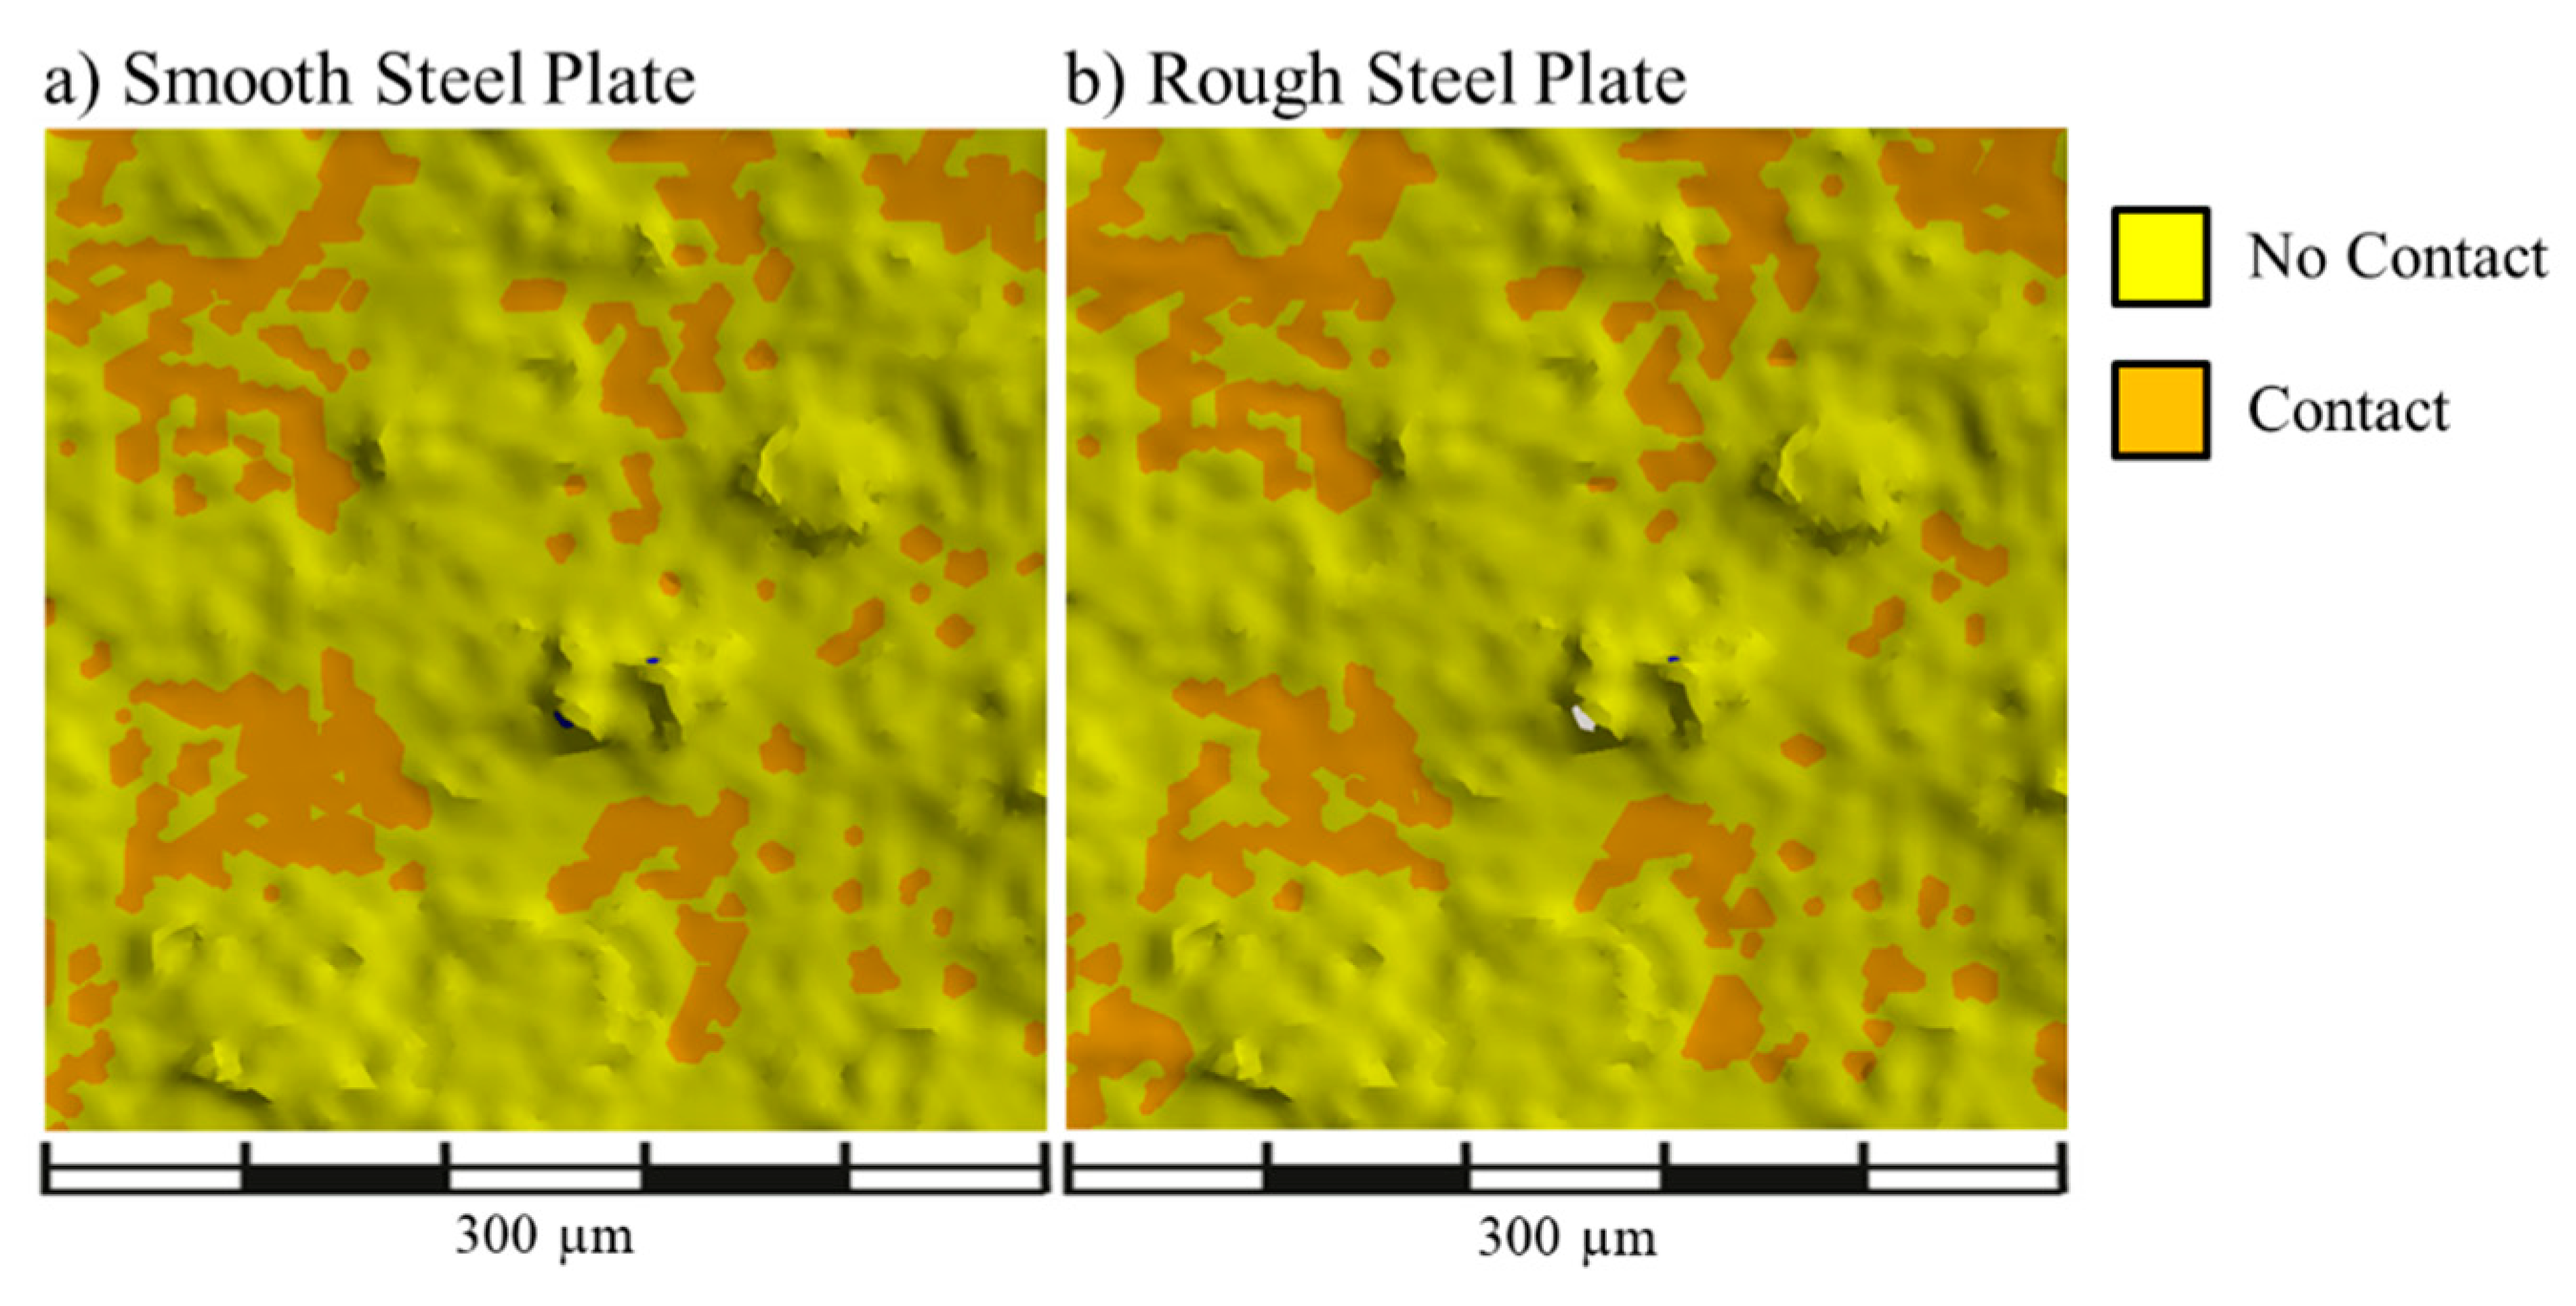
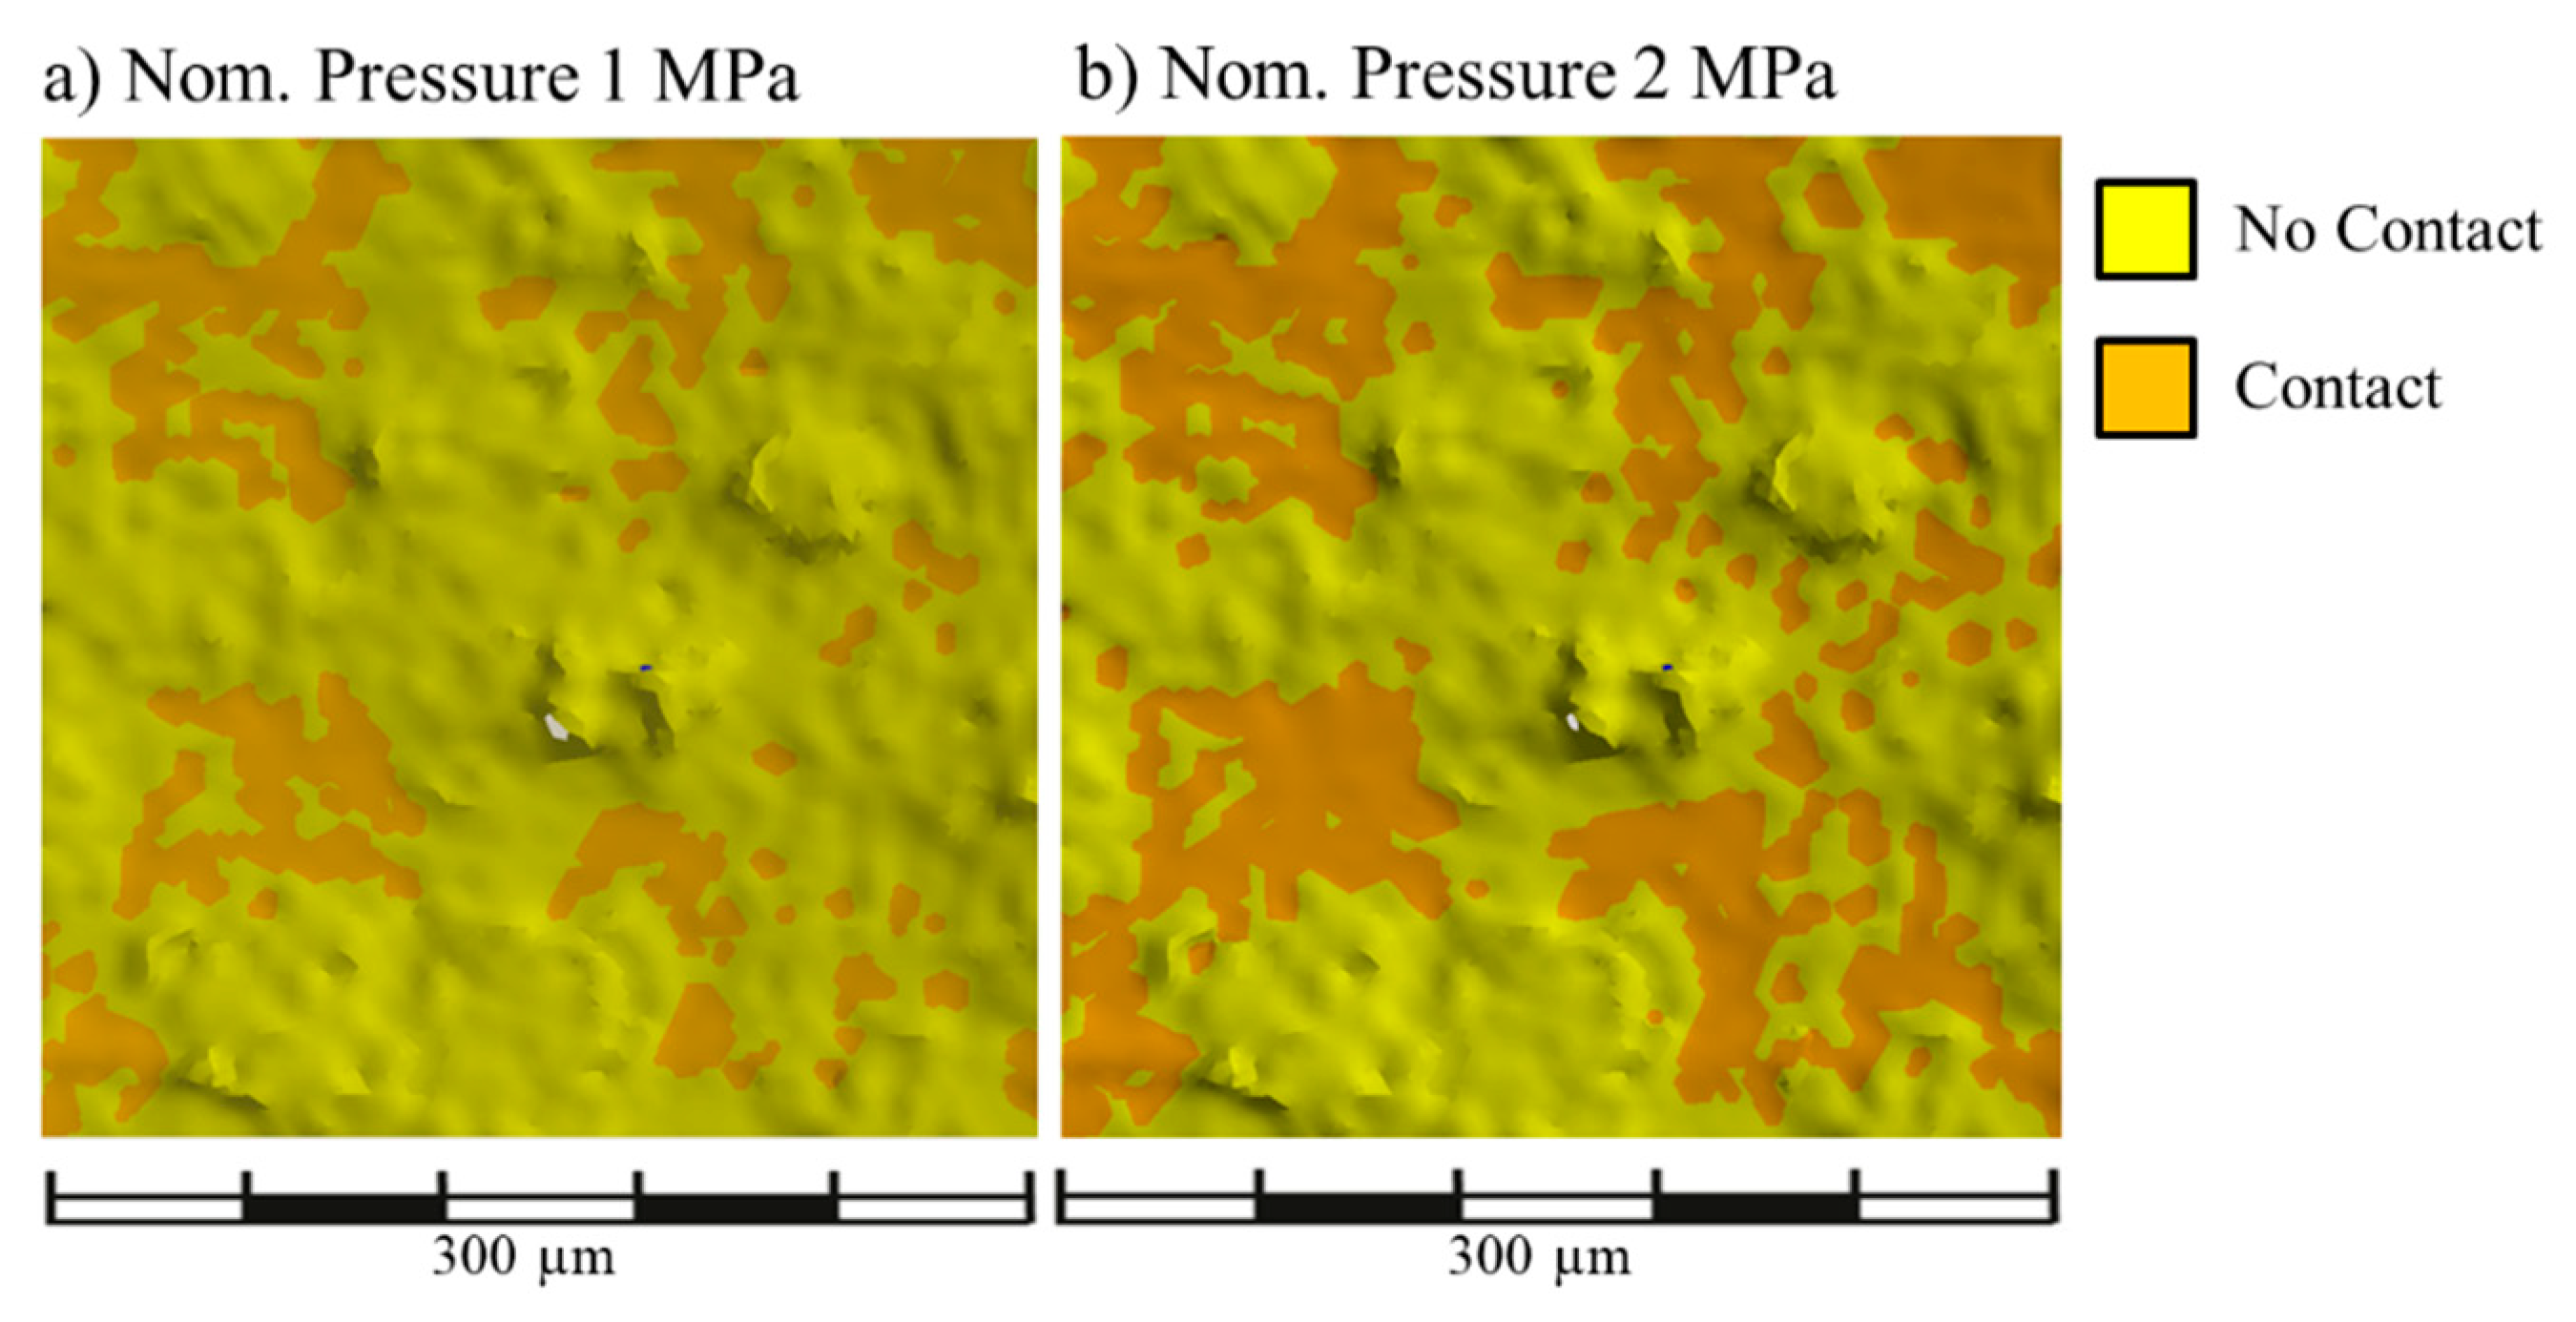
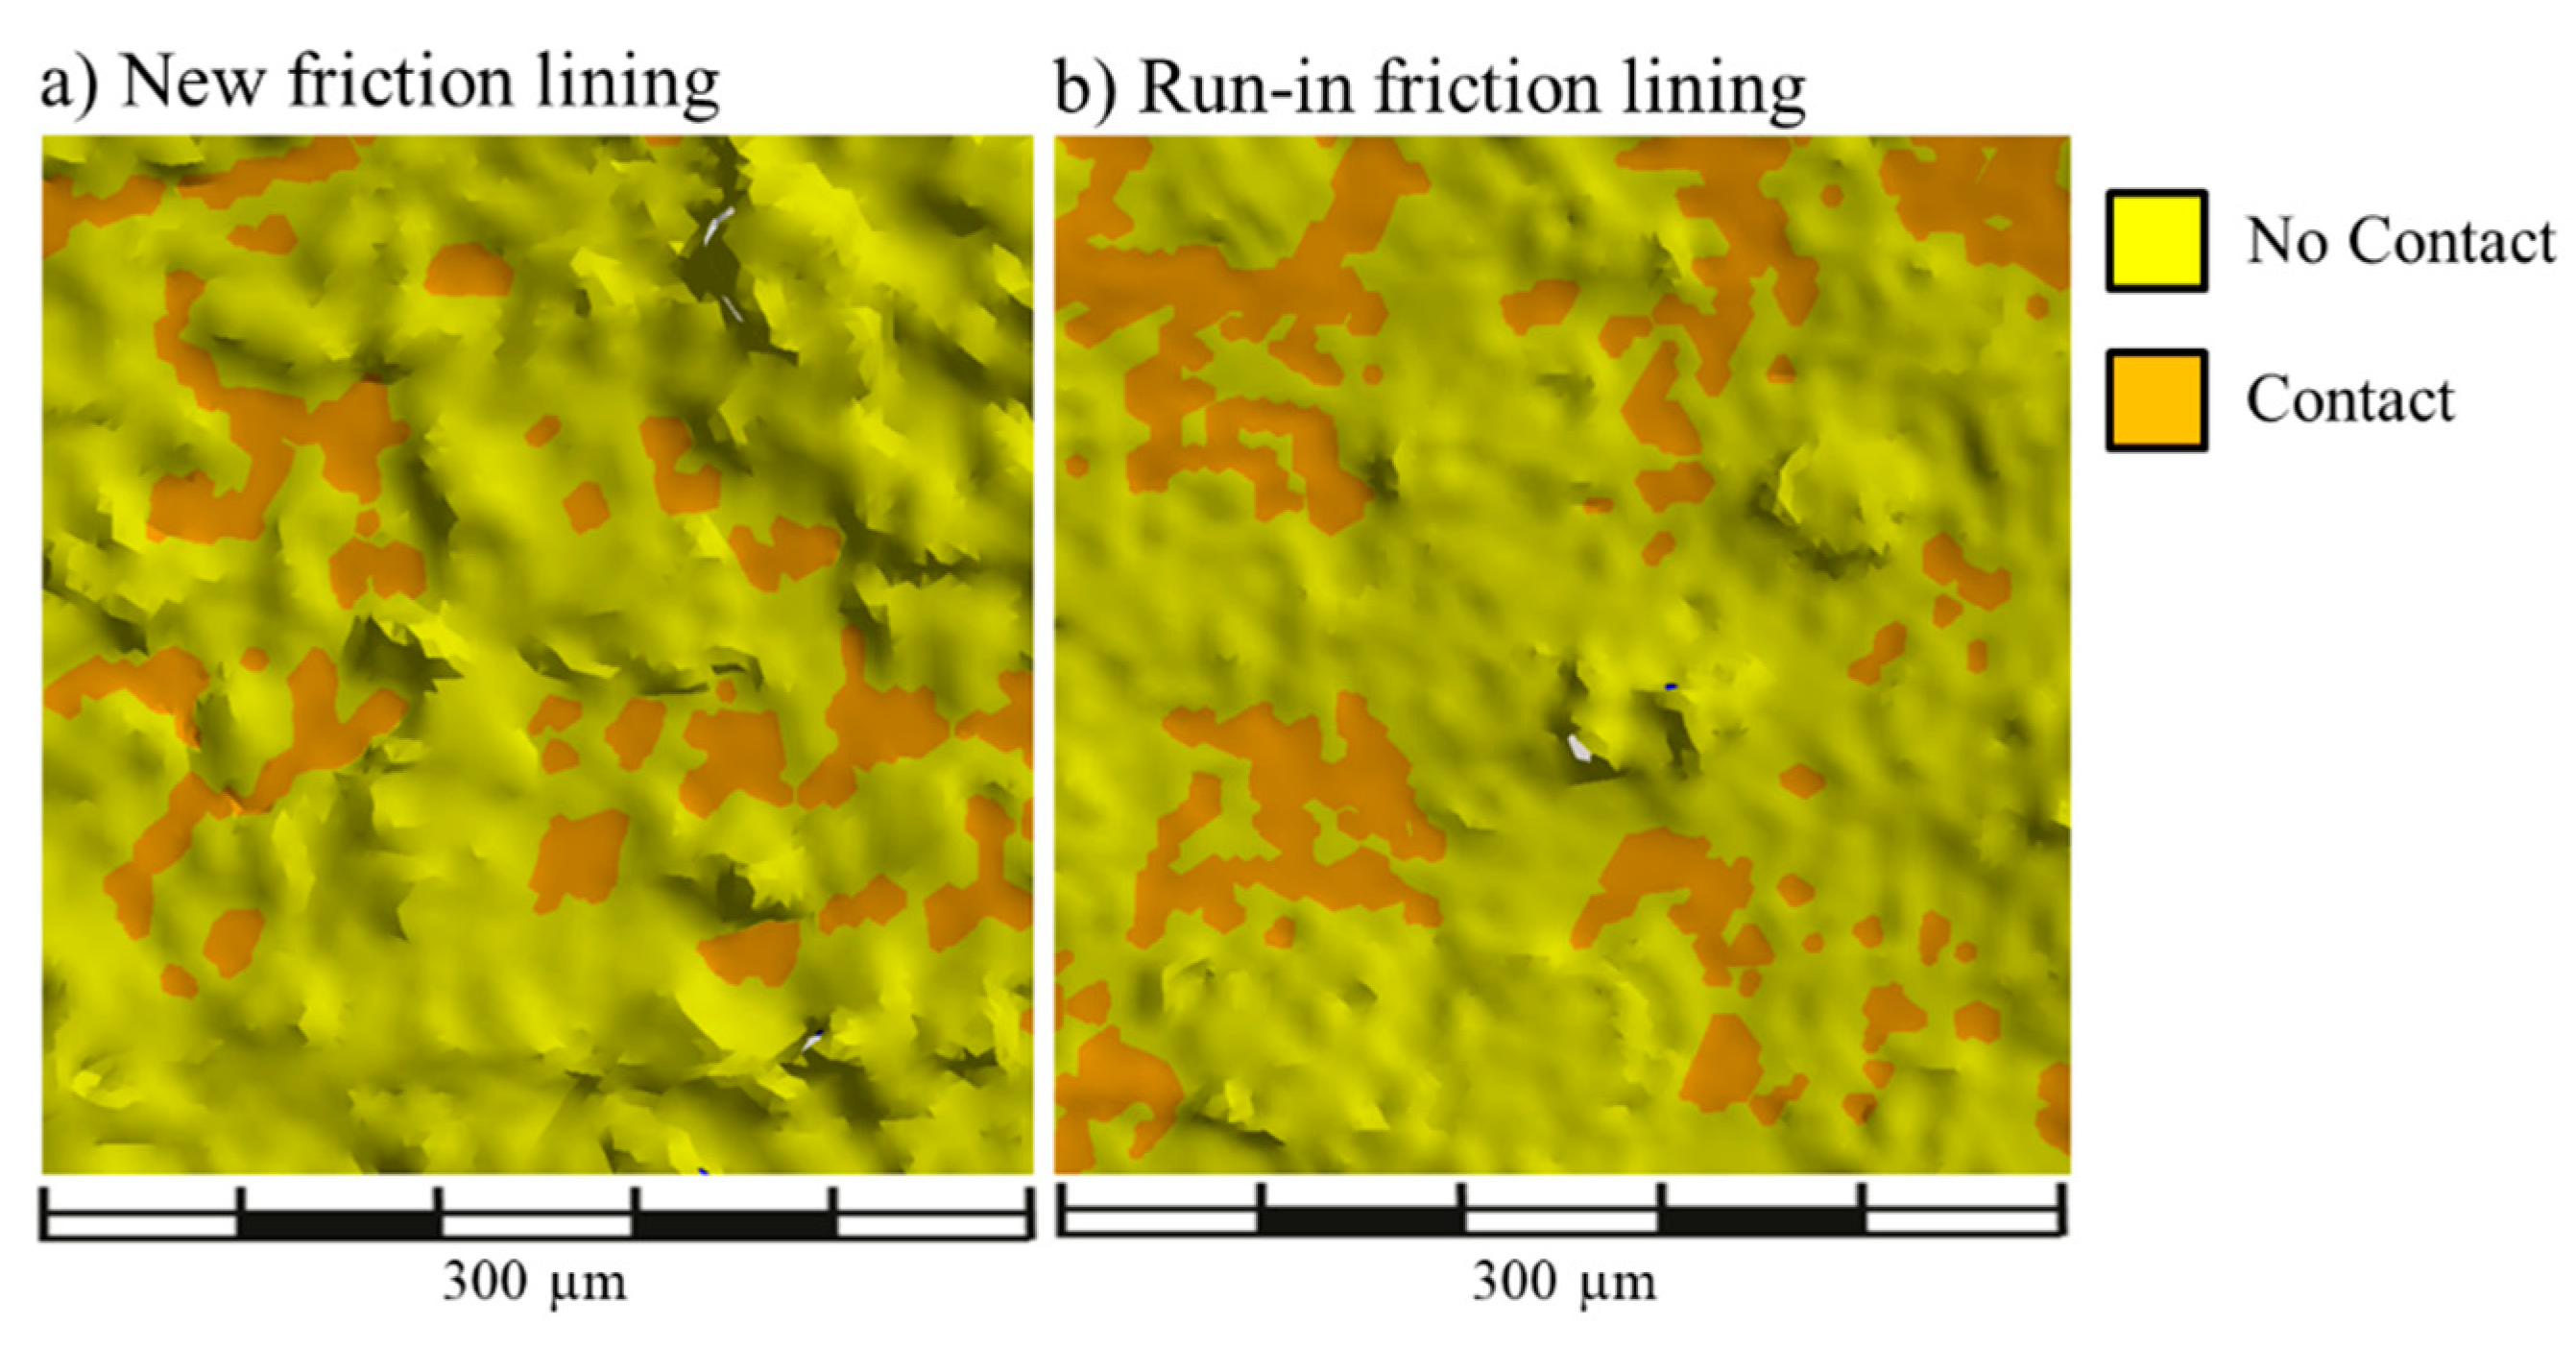
3.3. Real Areas of Contact of Different Friction Pairings and Operating Conditions
4. Discussion
5. Conclusions
Author Contributions
Funding
Conflicts of Interest
References
- Völkel, K.; Pflaum, H.; Stahl, K. Einflüsse der Stahllamelle auf das Einlaufverhalten von Lamellenkupplungen. Forsch. Ing. Eng. Res. 2019, 28, 2148. [Google Scholar] [CrossRef]
- Voelkel, K.; Pflaum, H.; Stahl, K. Running-in behavior of wet multi-plate clutches–investigation and characterization. In Proceedings of the Asia International Conference on Tribology, Kuching, Malaysia, 19–20 September 2018; Malaysian Tribology Society: Kuala Lumpur, Malaysia, 2018; pp. 19–20. [Google Scholar]
- Voelkel, K.; Pflaum, H.; Stahl, K. Running-in behavior of wet multi-plate clutches. In Proceedings of the GETLUB International Conference, Hamburg, Germany, 19–20 September 2018; Forschungsvereinigung Antriebstechnik: Frankfurt am Main, Germany, 2018; pp. 1–7. [Google Scholar]
- Xu, Y.; Chen, Y.; Zhang, A.; Jackson, R.L.; Prorok, B.C. A new method for the measurement of real area of contact by the adhesive transfer of thin Au film. Tribol. Lett. 2018, 66, 32. [Google Scholar] [CrossRef]
- Greenwood, J.A.; Williamson, J.B.P.; Bowden, F.P. Contact of nominally flat surfaces. Proc. R. Soc. Lond. A 1966, 295, 300–319. [Google Scholar] [CrossRef]
- Bush, A.W.; Gibson, R.D.; Thomas, T.R. The elastic contact of a rough surface. Wear 1975, 35, 87–111. [Google Scholar] [CrossRef]
- Müser, M.H.; Dapp, W.B.; Bugnicourt, R.; Sainsot, P.; Lesaffre, N.; Lubrecht, T.A.; Rohde, S. Meeting the contact-mechanics challenge. Tribol. Lett. 2017, 65, 87. [Google Scholar] [CrossRef]
- Aidoudi, M.B.A.; Bessrour, J. Numerical modeling of rough contact between two cylinders with axes parallel. Tribol. Ind. 2017, 39, 415–430. [Google Scholar] [CrossRef]
- Li, P.; Liu, Q.; Hui, Y.; Wang, Q.; Fu, W.; Li, Y. Analysis of contact performance of real machined surface based on finite element method. Tribol. Online 2016, 11, 61–68. [Google Scholar] [CrossRef]
- Massanés Padró, P. Finite Element Simulation of Elastic Contact Between Rubber Rough Surface and Steel Surface. Bachelor’s Thesis, Universitat Politècnica de Catalunya, Barcelona, Spain, 2015. [Google Scholar]
- Bugnicourt, R.; Sainsot, P.; Dureisseix, D.; Gauthier, C.; Lubrecht, A.A. FFT-based methods for solving a rough adhesive Contact: description and convergence study. Tribol. Lett. 2018, 66, 279. [Google Scholar] [CrossRef]
- Berger, E.J.; Sadeghi, F.; Krousgrill, C.M. Finite element modeling of engagement of rough and grooved wet clutches. J. Tribol. 1996, 118, 137–146. [Google Scholar] [CrossRef]
- Berger, E.J.; Sadeghi, F.; Krousgrill, C.M. Analytical and numerical modeling of engagement of rough, permeable, grooved wet clutches. J. Tribol. 1997, 119, 143. [Google Scholar] [CrossRef]
- Gao, H.; Barber, G.C. Microcontact model for paper-based wet friction materials. J. Tribol. 2002, 124, 414–419. [Google Scholar] [CrossRef]
- Gao, H.; Barber, G.C.; Shillor, M. Numerical simulation of engagement of a wet clutch with skewed surface roughness. J. Tribol. 2002, 124, 305–312. [Google Scholar] [CrossRef]
- Gao, H.; Barber, G.C.; Rama, S.C.; Smith, L.M. Finite element modeling of contact of a paper-based friction material. Tribol. Trans. 2002, 45, 31–38. [Google Scholar] [CrossRef]
- Lorentz, B.; Albers, A. A numerical model for mixed lubrication taking into account surface topography, tangential adhesion effects and plastic deformations. Tribol. Int. 2013, 59, 259–266. [Google Scholar] [CrossRef]
- Reichert, S.; Lorentz, B.; Heldmaier, S.; Albers, A. Wear simulation in non-lubricated and mixed lubricated contacts taking into account the microscale roughness. Tribol. Int. 2016, 100, 272–279. [Google Scholar] [CrossRef]
- Ompusunggu, A.P.; Sas, P.; van Brussel, H. Distinguishing the effects of adhesive wear and thermal degradation on the tribological characteristics of paper-based friction materials under dry environment: A theoretical study. Tribol. Int. 2015, 84, 9–21. [Google Scholar] [CrossRef]
- Zhao, E.H.; Ma, B.; Li, H.Y. Numerical and experimental studies on tribological behaviors Of Cu-based friction pairs from hydrodynamic to boundary lubrication. Tribol. Trans. 2018, 61, 347–356. [Google Scholar] [CrossRef]
- Kimura, Y.; Otani, C. Contact and wear of paper-based friction materials for oil-immersed clutches—Wear model for composite materials. Tribol. Int. 2005, 38, 943–950. [Google Scholar] [CrossRef]
- Otani, C.; Okada, M.; Kimura, Y. Contact characteristics of paper-based friction material (Part 1)—As-processed surface. J. Jpn. Soc. Tribol. 1999, 44, 898–905. [Google Scholar]
- Otani, C.; Kimura, Y. Analysis of real contact area of a paper-based wet friction material. J. Jpn. Soc. Tribol. 1994, 39, 1042–1046. [Google Scholar]
- Sfarni, S.; Bellenger, E.; Fortin, J.; Malley, M. Numerical and experimental study of automotive riveted clutch discs with contact pressure analysis for the prediction of facing wear. Finite Elem. Anal. Des. 2011, 47, 129–141. [Google Scholar] [CrossRef]
- Völkel, K.; Wohlleber, F.; Pflaum, H.; Stahl, K. Kühlverhalten nasslaufender Lamellenkupplungen in neuen Anwendungen. In Cooling Performance of Wet Multi-Plate Disk Clutches in Modern Applications; VDI: Ettlingen, Germany, 2017; pp. 215–226. [Google Scholar]


| Author | Investigated System | Nominal Pressure | Young’s Modulus | Relative Contact Area |
|---|---|---|---|---|
| Berger et al. [12,13] | wet clutch with organic friction lining | not published | 27 MPa|97 MPa | not published |
| Gao et al. [14,15] | wet clutch with organic friction lining | not published | 45 MPa | 4% to 12% |
| Albers et al. [17,18] | dry contact of rough steel and cast iron materials | 20 MPa | not published | 5% to 12% |
| Ompusunggu et al. [19] | dry multi-disc clutch with organic friction lining | 3 MPa | 45 MPa|100 MPa | 6.5% to 9.5% |
| Zhao et al. [20] | sintered metallic friction material | 4.9 MPa | not published | 15% |
| Kimura et al. [21,22,23] | Wet clutch with paper-based friction lining | 0.8 MPa | 100 MPa | 1% to 10% |
| Test Specimen | Properties |
|---|---|
| Rough steel plate, run-in | Series production part, cold strip surface |
| mean arithmetic height Sa = 0.5 µm | |
| core roughness Sk = 1.5 µm | |
| Smooth steel plate | Academic example |
| Ideal smooth surface, no microstructure | |
| Paper-based friction lining, new state | Mean arithmetic height Sa = 4.1 µm |
| Core roughness Sk = 10.8 µm | |
| Paper-based friction lining, run-in | Running-in according to [3] |
| Material | Young’s Modulus | Poisson’s Ratio |
|---|---|---|
| Steel | 210,000 MPa | 0.3 |
| Friction Material (Paper-Based) | 80 MPa | 0.2 |
| Porosity | → 0 MPa (0.1 Pa) | 0.33 |
© 2019 by the authors. Licensee MDPI, Basel, Switzerland. This article is an open access article distributed under the terms and conditions of the Creative Commons Attribution (CC BY) license (http://creativecommons.org/licenses/by/4.0/).
Share and Cite
Voelkel, K.; Rothemund, M.; Albarracin Garibello, S.; Kramer, V.; Pflaum, H.; Stahl, K. On the Simulation of the Micro-Contact of Rough Surfaces Using the Example of Wet Friction Clutch Materials. Lubricants 2019, 7, 41. https://doi.org/10.3390/lubricants7050041
Voelkel K, Rothemund M, Albarracin Garibello S, Kramer V, Pflaum H, Stahl K. On the Simulation of the Micro-Contact of Rough Surfaces Using the Example of Wet Friction Clutch Materials. Lubricants. 2019; 7(5):41. https://doi.org/10.3390/lubricants7050041
Chicago/Turabian StyleVoelkel, Katharina, Markus Rothemund, Sebastian Albarracin Garibello, Vincent Kramer, Hermann Pflaum, and Karsten Stahl. 2019. "On the Simulation of the Micro-Contact of Rough Surfaces Using the Example of Wet Friction Clutch Materials" Lubricants 7, no. 5: 41. https://doi.org/10.3390/lubricants7050041
APA StyleVoelkel, K., Rothemund, M., Albarracin Garibello, S., Kramer, V., Pflaum, H., & Stahl, K. (2019). On the Simulation of the Micro-Contact of Rough Surfaces Using the Example of Wet Friction Clutch Materials. Lubricants, 7(5), 41. https://doi.org/10.3390/lubricants7050041