Abstract
Friction behavior in a sliding contact is strongly influenced by the surface topography of the bodies in contact. This also applies to friction clutches. Even small differences in surface topography may cause significant differences in friction behavior. Thus, it is important to be able to characterize the micro-contact of the rough sliding surfaces, which are, in the case of a clutch, steel plate and friction material. One important measure for the characterization of the micro-contact is the real area of contact. Another important aspect is the contact pattern. The article introduces a method to implement a FEM (Finite Element Method) model from real surface measurements. Real surface topography of the friction pairing is considered. The simulation method is applied to different friction pairings and operating conditions. Computational results with rough and smooth steel plates, new and run-in friction linings, and different nominal surface pressure verify the model. In addition, the results on real area of contact between a steel and a friction plate are compared with published values.
1. Introduction
Friction behavior in a sliding contact is significantly determined by the conditions in the micro-contact of the bodies involved. Among other factors, the surface topography of the friction pairing plays an important role. This also applies to the friction contact of wet friction clutches. Wet friction clutches are important components of modern power shift transmissions, e.g., in automatic transmissions, dual clutch transmissions and limited slip differentials. Thus, the requirements for safety and comfort behavior of clutches are exacting. The functional behavior and shifting comfort of a clutch mainly depend on its friction behavior and therefore, among other factors, on the surface properties of the steel plates and friction plates. Even small differences in surface topography, e.g., a different grinding structure on the steel disc surface, can lead to significant differences in the friction behavior of the clutch. We carried out several experimental investigations on the influence of steel plate topography on the friction behavior of the clutch, especially in the running-in phase [1,2,3]. Extensive 3D-measurements of the surface topography of the steel plates before and after test made it possible to establish basic correlations between the steel plate topography and the friction behavior during running-in. Nonetheless, the investigations have shown that, even 3D characteristic values are only partially sufficient to characterize the influence of topography on the friction behavior of a wet clutch. There are cases in which steel plates with comparable surface characteristic values show significantly different friction behavior and vice versa. This indicates that the interaction of the steel plate with the friction material is of great importance.
Therefore, the idea of investigating not only the isolated steel plate and friction plate topography but also the micro-contact of both in interaction is reasonable. An important parameter for characterizing the micro-contact is the real area of contact. The real area of contact is closely linked to the local loads and thus to the functional and damage behavior of the clutch.
The real area of contact can be determined by experiment or simulation. Measurement methods for the real area of contact are subdivided firstly into direct and indirect methods and secondly, into in situ and ex situ methods [4]. Direct methods measure the contact area in an immediate way, whereas indirect methods utilize measurement of a quantity that depends on the contact conditions. In situ describes a measurement carried out in the contacting state. Ex situ means a measurement after separation of the surfaces. Several examples for the measurement of real areas of contact in the context of clutches are published, which always refer to optical methods (direct, in situ). These are based on the reflection or interference of light at the contact points, which limits the amount of contact pairings that can be analyzed in so far as one of the two partners must be made of a transparent material. Since this is not the case with clutches, as in the case of most real tribological systems, it is often necessary to switch to a corresponding replacement body (e.g., a glass plate). The replacement body usually has different material and surface properties. Consequently, a transfer of the results to the real application is not fully possible.
The simulation approach is not subject to these limitations, but there are other restrictions. Simulation approaches are distinguished in analytical, fractal and numerical methods. Analytical and fractal models are often greatly simplified in terms of geometry and contact behavior: The model according to Greenwood and Williamson [5], GW-model, approaches individual roughness peaks (so-called asperities) by spherical caps, assuming all roughness peaks have the same radius of curvature. The contact of the asperities is described by a Hertzian contact. Bush et al. [6] extend the model by variable radii and shapes of caps. Models including an approach to determine the deformation behavior enable the calculation of the real area of contact of the rough surfaces. Nevertheless the scale-dependent radius of curvature of an asperity indicates one critical problem among others when it comes to asperity-based models [7]. Deformative interactions between the spherical caps are neglected. Flawed contact geometries and false contact stiffnesses are a consequence. In addition to analytical and fractal models, numerical calculations of the contact area of rough surfaces are known, e.g., using CAD modeling and subsequent FE calculations [8,9,10]. In 2017, the Contact-Mechanics Challenge [7] encouraged several research groups to work on a contact mechanics problem which was considered to be representative for the contact between nominally flat surfaces. The FFT-BVM method [11] has been found to be very efficient, e.g., a surface discretized to 1000 by 1000 can be calculated on a standard laptop with standard RAM in under one minute doing 200 iterations.
In the research field of wet multi-plate clutches, several investigations to determine the real area of contact between steel plate and friction material have been published. At this point, we already want to anticipate that none of the published simulation methods considers the real topography based on surface measurements of the friction pairing. Nevertheless, results given in the state of the art are important in order to verify and evaluate our own simulation model, input data and computational results. In the following, a short overview is given and the results relevant to our work are provided in Table 1.

Table 1.
Summary of published data modeling real area of contact for clutches.
Berger et al. investigate the engagement of a wet-running multi-disc clutch with paper friction lining during the shifting process by numerical and analytical calculation [12,13]. The real area of contact is calculated using the GW-model assuming a Gaussian (i.e., normal) distribution of the height of the roughness peaks, but numerical values for real area of contact have not been published.
Gao et al. determine the real area of contact for an organic friction lining and a steel plate as a function of lubricant film thickness and mileage using an extended GW-model with a Weibull height distribution [14,15]. For lubricating film thicknesses approaching zero, Gao et al. calculate relative contact areas of about 4 to 12%.
In further investigations [15,16], the deformation behavior of different roughness peak geometries is considered by FE calculation. Lorentz et al. develop a numerical model for mixed lubrication [17]. Surface topography of the steel plate is considered by statistical mapping, an evaluation of the real area of contact is not carried out. Further investigations [18] also simulate the wear behavior for a dry contact of rough steel and cast iron materials. At a nominal load of 20 MPa, relative contact areas of about 5 to 12% at maximum local surface pressures of about 700–2200 MPa are calculated.
Ompusunggu et al. investigate the influence of wear and decomposition on the friction behavior of a dry multi-disc clutch with organic friction lining by analytical calculation based on a modified GW-model [19]. At nominal loads of up to approximately 3 MPa, maximum relative contact areas of approximately 6.5 to 9.5% are achieved depending on the state of damage.
Zhao et al. simulate the friction behavior of a sintered metallic friction lining during the transition from hydrodynamic to boundary friction using the Reynolds equation on the basis of a real surface geometry [20]. The contact condition is stated as undercutting of a critical lubricant film thickness. For low sliding speeds, i.e., for boundary friction, a relative contact area of up to approximately 15% is calculated for a nominal pressure of 4.9 MPa.
Kimura et al. model the contact between an ideally rigid flat surface (steel disk) and a paper friction lining by spherical asperities of constant radii assuming a Hertzian contact [21]. The validation of the model is carried out in alignment with measurements on a contact microscope employing polarized light [22,23]. The contact area is calculated and measured for different stages of running-in. Relative contact areas develop from 1% (new state) to about 10% (run-in clutch).
Sfarni et al. calculate contact areas and contact pressures between friction lining and pressure plate of a single-disc vehicle clutch using the FE method and a CAD model of the clutch [24]. Surface topography is not considered, therefore the analyses remain limited to the macroscopic level.
2. Methods and Materials
We simulate the micro-contact between steel plate and friction plate with paper-based friction lining taking real surface topography into account. The simulation model is set up in a multi-stage process according to Figure 1. In the first step, the surface topography of the steel plate and of the friction plate are measured with a 3D micro coordinate measurement machine based on the principle of focus variation (vertical resolution: 50 nm; lateral resolution: 2.93 µm). Based on the surface topography data (coordinates x,y,z), a 3D surface model is built up in CAD (Catia V5), which is then extruded to a 3D volume model in the next step. This CAD model is used for the implementation of the FEM model in Ansys Workbench.
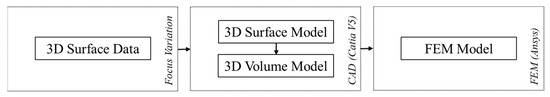
Figure 1.
Set up of simulation model.
Steel and friction plates are series production parts from automatic transmission application. The following test specimens described in Table 2 were used as input for the simulation.
Table 2.
Test specimens.
Figure 2 illustrates a FEM model for a 300 µm × 300 µm section of steel plate and friction plate. Variational calculations have shown that a height of 25 µm is sufficient to correctly simulate the behavior of the friction material. The lateral expansion of the model is chosen in consideration of reasonable computation times. At the same time, the area of 300 µm × 300 µm is large enough to recognize and evaluate contact patterns. The steel plate is built by hexahedron elements and the friction material by tetrahedron elements. An element size of 4 µm leads to a total number of nodes that is 44,501 and a total number of elements that is 121,244.
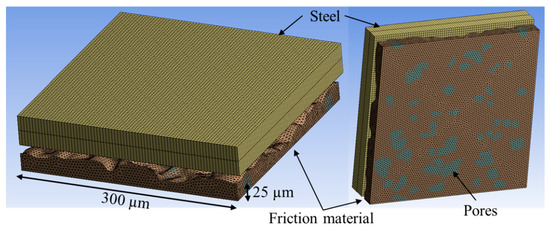
Figure 2.
FEM model.
Boundary conditions of the model are visualized in Figure 3. The eight lateral areas of the steel plate and the friction lining are constrained by a frictionless support, visualized in blue color in Figure 3. Choosing this boundary condition allows translational displacement in all directions except for the normal direction, thus hindering any inclination of the plate sections. Furthermore, the continuity of the material is taken into account, as the modeled geometries are only small sections of the entire steel and friction plates. The bottom surface of the lining disk is constrained by a fixed support, which does not allow any translational and/or rotational movement in any direction. The load is applied by a uniform pressure on the upper surface of the steel plate, visualized in red color in Figure 3. The contact behavior is assumed frictionless and symmetrical, which does not allow a penetration of the two bodies in contact. With focus on computational stability, the contact algorithm was chosen to be Augmented-Lagrange. The setting ‘program-controlled’ also gives stable computations.
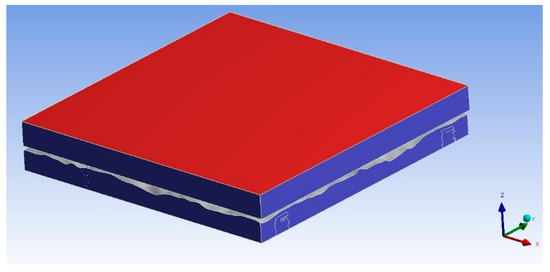
Figure 3.
Boundary conditions of the FEM model (red: Uniform pressure; blue: Frictionless support).
The porosity of the friction material is derived from cross sections of the friction lining (see Figure 4). The 3D model was built by a combination of porous layers and layers of solid material. The materials are considered as isotropic with elastic materials. Table 3 gives an overview of the material properties of the model. The Young’s Modulus of the paper friction lining has been determined beforehand by experiment. To measure the elasticity of the friction material, the whole clutch pack consisting of four steel plates and three friction plates has been mounted in a device according to [25]. Axial force was applied to the clutch pack under a defined oil flow ( = 0.8 mm3/mm2/s; = 80 °C) and the compressibility was measured via a displacement sensor.
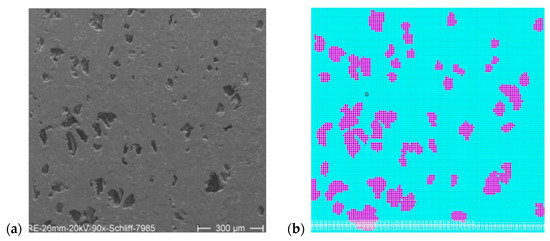
Figure 4.
Porosity of a paper-based friction lining: (a) cross section in SEM; (b) inhomogeneous FEM model.
Table 3.
Material properties.
As the main friction regime of wet multi-plate clutches is boundary friction, there is no influence of fluid parameters of the lubricant. Grooves and porosity of the friction plate prevent the formation of a hydrodynamical lubrication film and therefore hydrodynamic pressure in the friction contact of a wet multi-plate clutch is not generated.
3. Results
3.1. Derivation of a FEM Model from Surface Measurement
As a first result, we want to illustrate the multi-stage process from the surface measurement to the computational results of the FEM model. Figure 5 illustrates the different stages we go through in simulating the micro-contact between a steel plate and a friction lining (computed section here is 140 µm × 60 µm in size). Based on the surface measurements of steel plate and friction lining (the surface measurement of the friction lining is visualized in Figure 5), we derive a height distribution as an input for the CAD model. As a result of the FEM model we get the real area of contact (color coding for contact is orange) and the pressure distribution in the micro-contact. By comparing the height distribution of the friction lining surface and the computed contact areas as well as the pressure distribution, one can see that contact and pressure distribution correlate with the surface profile.
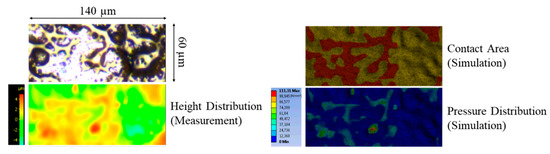
Figure 5.
Multi-stage process: from surface measurement to FEM simulation of the micro-contact.
3.2. Meshing: Variation of Element Size
To ensure the quality of the simulation, a variation of element size was conducted for a 300 µm × 300 µm section of steel plate and friction plate. Figure 6 shows the simulated contact patterns of four FEM models with different element sizes (A: 10 µm; B: 6 µm; C: 5 µm; D: 4 µm). The table in Figure 6 provides a quantitative evaluation of the values of the relative area of contact (ratio of contact area to total area) calculated with the different FEM models. The contact area decreases with decreasing element size. These results match the expectation, as the surface shape is displayed finer and more accurately with decreasing element size. Differences in calculated contact area are relatively small between element sizes of 5 µm and 4 µm. As smaller elements lead to very high computational times, an element size of 4 µm is used in further investigations.
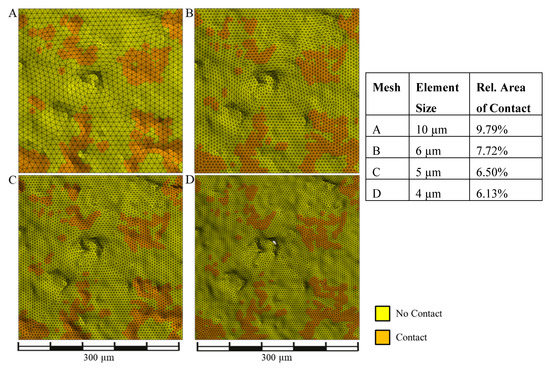
Figure 6.
Variation of element size (A–D)—contact patterns and quantitative evaluation of relative areas of contact.
3.3. Real Areas of Contact of Different Friction Pairings and Operating Conditions
This study investigates the real area of contact between a run-in paper-based friction lining and two types of steel plates: An ideally smooth steel plate and a real rough steel plate. Nominal surface pressure is 1 MPa, which is typical for paper-based friction linings. The ideally smooth steel plate results in a larger contact area (relative area of contact is 11.0%) than the rough steel plate (relative area of contact is 7.9%). The computational results are visualized in Figure 7.
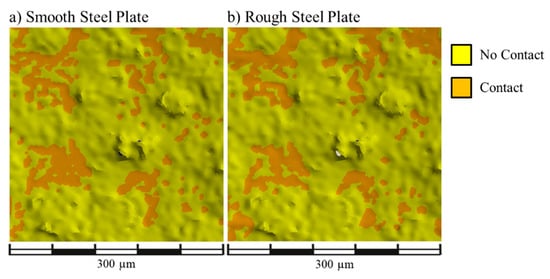
Figure 7.
Micro-contact of a paper-based friction lining with (a) a smooth steel plate and (b) a rough steel plate under nominal pressure of 1 MPa.
Figure 8 visualizes the micro-contact of a rough steel plate with a new, not run paper lining (a) and the micro-contact of the identical section of a rough steel plate with a run-in paper lining (b). As expected, the contact area with the run-in friction lining is larger (relative area of contact is 7.9%) than with the new friction lining (relative area of contact is 4.9%), since the surface structure of the friction lining is smoothened during running-in.
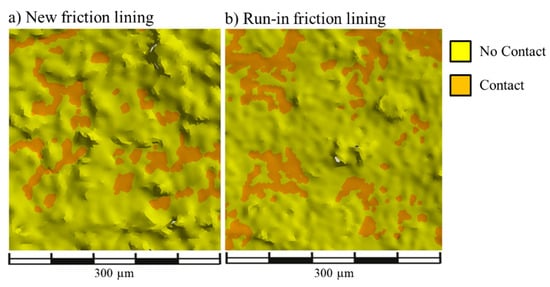
Figure 8.
Micro-contact of a rough steel plate with (a) a new friction lining and (b) a run-in friction lining under nominal pressure of 1 MPa.
With increasing surface pressure, the contact area between the steel plate and the friction lining increases. This is shown on the example of a rough steel plate and a run-in paper friction lining under nominal surface pressure of 1 MPa in comparison to 2 MPa. Under a nominal surface pressure of 1 MPa, the relative area of contact is 7.9%. Doubling the nominal surface pressure to 2 MPa results in an increased relative area of contact of 14.0% between the same components (see Figure 9).
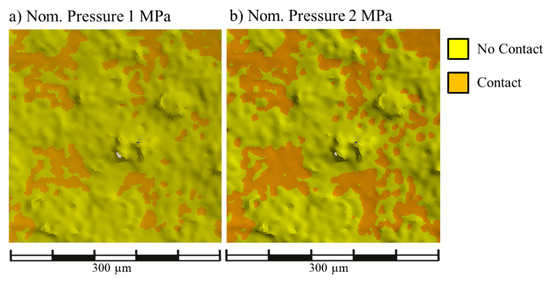
Figure 9.
Micro-contact of a rough steel plate with a run-in friction lining under nominal pressure of (a) 1 MPa and (b) 2 MPa.
4. Discussion
The simulation model successfully realizes the calculation of the micro-contact of rough surfaces, as has been demonstrated on various friction pairings. The calculated relative areas of contact meet the expectations and are in accordance with the state-of-the-art findings. The Young’s Modulus of 80 MPa we measure for the paper-based friction material fits the published values of organic friction materials that are between 27 MPa and 100 MPa (see Table 1). The same applies to the published relative areas of contact. The work of Kimura et al. [21,22,23] is most similar to our work regarding the investigated test specimens, nominal pressure and Young’s Modulus of the friction material. At the same time the computational results match very well.
As already mentioned in Section 3.1, convergence of the simulation seems not to be reached perfectly with an element size of 4 µm. At the same time, smaller elements lead to very high computational times. As differences in the calculated real area of contact are relatively small for element sizes of 4 µm and 5 µm, the simulations are carried out with an element size of 4 µm. Validation of the simulation results will show, whether this assumption is fully admissible or whether calculations with finer discretization lead to a relevant improvement in the quality of results and, as a consequence, high computational time has to be accepted.
5. Conclusions
The friction behavior of wet friction clutches is significantly determined by the conditions in the micro-contact of the steel and the friction plate. Extensive experimental investigations we carried out show a great influence of the steel plate topography on the friction behavior of the clutch [1,2,3]. Moreover, even 3D characteristic values were found to be only partially sufficient to characterize the influence of the topography on the friction behavior of a wet clutch [1]. From these investigations the idea was derived to investigating not only the isolated steel plate and friction plate topography but also the micro-contact of both in interaction. An important parameter to characterize the micro-contact is the real area of contact. The real area of contact is closely linked to the local loads and thus to the functional and damage behavior of the clutch.
We introduce a FEM simulation of the micro-contact between a steel plate and a friction plate with paper-based friction lining taking real surface topography into account. The simulation model is set up in a multi-stage process. Based on 3D surface topography data from optical measurement, a 3D surface model was built up in CAD and then implemented as a FEM model. The Young’s Modulus of the paper friction lining has been determined by experiment to be 80 MPa. Distribution and proportion of porosity of the paper friction lining have been derived from cross sections.
The micro-contact of different friction pairings and operating conditions have been simulated to verify the model. The results of the calculations are meaningful. The contact between an ideally smooth steel plate and a paper-based friction lining leads to a higher area of contact than the contact between a rough steel plate and the identical friction lining. Simulations of the contact between a rough steel plate and a friction lining in new state and after running-in show that the real area of contact increases during running-in. Furthermore the influence of the pressure has been investigated by calculating the real area of contact between a rough steel plate and a run-in paper-based friction lining. Doubling the surface pressure from 1 MPa to 2 MPa leads to a nearly doubled relative area of contact.
For all friction pairings and operating conditions, the calculated relative areas of contact meet the expectations and are in accordance with other publications also working on the micro-contact in friction clutches. A next step will be to validate the FEM model by comparing computational results and measurements of the real area of contact.
Compared to the already published papers our simulation model offers the great advantage of taking the real surface topography of both steel plate and friction material into account. Reliable relative areas of contact and contact patterns can be calculated. This makes it possible to investigate the effects of even small differences in the surface topography, like directed orientation of structural elements relative to sliding direction, or elasticities on the real area of contact and thus the functional behavior of wet clutches. As the simulation model provides information on the contact pattern, these results can be used for validation and comparison of computed and measured contact patterns.
Author Contributions
Conceptualization, K.V.; methodology, K.V.; software, K.V., S.A.G. (thesis) and M.R. (thesis); validation, K.V. and V.K. (thesis); formal analysis, K.V.; investigation, K.V and S.A.G. (thesis); resources, K.S.; data curation, K.V.; writing—original draft preparation, K.V..; writing—review and editing, H.P. and K.S.; visualization, K.V. and S.A.G. (thesis); supervision, H.P. and K.S.; project administration, K.V.
Funding
This work was supported by the German Research Foundation (DFG) and the Technical University of Munich (TUM) in the framework of the Open Access Publishing Program.
Conflicts of Interest
The authors declare no conflict of interest.
References
- Völkel, K.; Pflaum, H.; Stahl, K. Einflüsse der Stahllamelle auf das Einlaufverhalten von Lamellenkupplungen. Forsch. Ing. Eng. Res. 2019, 28, 2148. [Google Scholar] [CrossRef]
- Voelkel, K.; Pflaum, H.; Stahl, K. Running-in behavior of wet multi-plate clutches–investigation and characterization. In Proceedings of the Asia International Conference on Tribology, Kuching, Malaysia, 19–20 September 2018; Malaysian Tribology Society: Kuala Lumpur, Malaysia, 2018; pp. 19–20. [Google Scholar]
- Voelkel, K.; Pflaum, H.; Stahl, K. Running-in behavior of wet multi-plate clutches. In Proceedings of the GETLUB International Conference, Hamburg, Germany, 19–20 September 2018; Forschungsvereinigung Antriebstechnik: Frankfurt am Main, Germany, 2018; pp. 1–7. [Google Scholar]
- Xu, Y.; Chen, Y.; Zhang, A.; Jackson, R.L.; Prorok, B.C. A new method for the measurement of real area of contact by the adhesive transfer of thin Au film. Tribol. Lett. 2018, 66, 32. [Google Scholar] [CrossRef]
- Greenwood, J.A.; Williamson, J.B.P.; Bowden, F.P. Contact of nominally flat surfaces. Proc. R. Soc. Lond. A 1966, 295, 300–319. [Google Scholar] [CrossRef]
- Bush, A.W.; Gibson, R.D.; Thomas, T.R. The elastic contact of a rough surface. Wear 1975, 35, 87–111. [Google Scholar] [CrossRef]
- Müser, M.H.; Dapp, W.B.; Bugnicourt, R.; Sainsot, P.; Lesaffre, N.; Lubrecht, T.A.; Rohde, S. Meeting the contact-mechanics challenge. Tribol. Lett. 2017, 65, 87. [Google Scholar] [CrossRef]
- Aidoudi, M.B.A.; Bessrour, J. Numerical modeling of rough contact between two cylinders with axes parallel. Tribol. Ind. 2017, 39, 415–430. [Google Scholar] [CrossRef][Green Version]
- Li, P.; Liu, Q.; Hui, Y.; Wang, Q.; Fu, W.; Li, Y. Analysis of contact performance of real machined surface based on finite element method. Tribol. Online 2016, 11, 61–68. [Google Scholar] [CrossRef][Green Version]
- Massanés Padró, P. Finite Element Simulation of Elastic Contact Between Rubber Rough Surface and Steel Surface. Bachelor’s Thesis, Universitat Politècnica de Catalunya, Barcelona, Spain, 2015. [Google Scholar]
- Bugnicourt, R.; Sainsot, P.; Dureisseix, D.; Gauthier, C.; Lubrecht, A.A. FFT-based methods for solving a rough adhesive Contact: description and convergence study. Tribol. Lett. 2018, 66, 279. [Google Scholar] [CrossRef]
- Berger, E.J.; Sadeghi, F.; Krousgrill, C.M. Finite element modeling of engagement of rough and grooved wet clutches. J. Tribol. 1996, 118, 137–146. [Google Scholar] [CrossRef]
- Berger, E.J.; Sadeghi, F.; Krousgrill, C.M. Analytical and numerical modeling of engagement of rough, permeable, grooved wet clutches. J. Tribol. 1997, 119, 143. [Google Scholar] [CrossRef]
- Gao, H.; Barber, G.C. Microcontact model for paper-based wet friction materials. J. Tribol. 2002, 124, 414–419. [Google Scholar] [CrossRef]
- Gao, H.; Barber, G.C.; Shillor, M. Numerical simulation of engagement of a wet clutch with skewed surface roughness. J. Tribol. 2002, 124, 305–312. [Google Scholar] [CrossRef]
- Gao, H.; Barber, G.C.; Rama, S.C.; Smith, L.M. Finite element modeling of contact of a paper-based friction material. Tribol. Trans. 2002, 45, 31–38. [Google Scholar] [CrossRef]
- Lorentz, B.; Albers, A. A numerical model for mixed lubrication taking into account surface topography, tangential adhesion effects and plastic deformations. Tribol. Int. 2013, 59, 259–266. [Google Scholar] [CrossRef]
- Reichert, S.; Lorentz, B.; Heldmaier, S.; Albers, A. Wear simulation in non-lubricated and mixed lubricated contacts taking into account the microscale roughness. Tribol. Int. 2016, 100, 272–279. [Google Scholar] [CrossRef]
- Ompusunggu, A.P.; Sas, P.; van Brussel, H. Distinguishing the effects of adhesive wear and thermal degradation on the tribological characteristics of paper-based friction materials under dry environment: A theoretical study. Tribol. Int. 2015, 84, 9–21. [Google Scholar] [CrossRef]
- Zhao, E.H.; Ma, B.; Li, H.Y. Numerical and experimental studies on tribological behaviors Of Cu-based friction pairs from hydrodynamic to boundary lubrication. Tribol. Trans. 2018, 61, 347–356. [Google Scholar] [CrossRef]
- Kimura, Y.; Otani, C. Contact and wear of paper-based friction materials for oil-immersed clutches—Wear model for composite materials. Tribol. Int. 2005, 38, 943–950. [Google Scholar] [CrossRef]
- Otani, C.; Okada, M.; Kimura, Y. Contact characteristics of paper-based friction material (Part 1)—As-processed surface. J. Jpn. Soc. Tribol. 1999, 44, 898–905. [Google Scholar]
- Otani, C.; Kimura, Y. Analysis of real contact area of a paper-based wet friction material. J. Jpn. Soc. Tribol. 1994, 39, 1042–1046. [Google Scholar]
- Sfarni, S.; Bellenger, E.; Fortin, J.; Malley, M. Numerical and experimental study of automotive riveted clutch discs with contact pressure analysis for the prediction of facing wear. Finite Elem. Anal. Des. 2011, 47, 129–141. [Google Scholar] [CrossRef]
- Völkel, K.; Wohlleber, F.; Pflaum, H.; Stahl, K. Kühlverhalten nasslaufender Lamellenkupplungen in neuen Anwendungen. In Cooling Performance of Wet Multi-Plate Disk Clutches in Modern Applications; VDI: Ettlingen, Germany, 2017; pp. 215–226. [Google Scholar]


© 2019 by the authors. Licensee MDPI, Basel, Switzerland. This article is an open access article distributed under the terms and conditions of the Creative Commons Attribution (CC BY) license (http://creativecommons.org/licenses/by/4.0/).