1. Introduction
Choosing the appropriate type and amount of lubricant for a specific cold forging process is critical for achieving efficient processes. For example, the consideration of the influence of the oil lubrication in gear forging operations within the finite element analysis allows the design of precise work pieces [
1]. Friction, wear as well as work piece defects are similarly influenced by the employed lubricant [
2]. Tribometers are typically used to empirically determine these properties before implementing the lubrication system within an industrial forging operation [
3]. Although the selection of adequate tribometers for a specific forging operation is not trivial, only few publications can be found that focus on this problem.
In this paper, recent progress in the field of tribological measurement in cold forging will be presented. Still existing shortcomings regarding the investigation of liquid lubricants will be highlighted. Based on these shortcomings, experimental findings that show the interaction of lubricant type and contact condition that need to be considered when designing and using tribometers to reproduce specific forming operations will be presented.
2. State of the Art of Friction Measurement in Cold Bulk Metal Forming
Due to the economic importance of friction and wear in nearly every aspect of mechanical interaction, at least 243 tribometers have been designed according to the Society of Tribologists and Lubrication Engineers (as cited by [
4]). At least 20 tribometers have been specifically developed for cold forging operations. However, due to the different test setups, the employed means of friction measurement (direct and indirect) and the varying levels of abstraction, it has been shown that two different tribometers may yield very different friction values. Barcelonna et al. have, for example, shown that using the ring compression test (RCT) and the double cup extrusion test (DCET) for the same tribological system yields friction factors ranging from
to
[
5]. The friction factor
m here describes a proportional factor, linking the shear stress
τr and the yield stress in shear
k as follows:
τr =
m ×
k. Similar findings for sheet metal forming friction tests have been presented by Hol et al. [
6].
Groche et al. have recently presented a systematic evaluation of six established tribometers: the ring compression test with boss (RCT-B), the combined forward rod backward can extrusion test (CFRBCET), the backwards cup extrusion test (BCET), the backward can extrusion with simultaneous rotation test (BCERT), the upsetting sliding test (UST), and the sliding compression test (SCT). A typical tribological system for cold forging operations, consisting of a zinc-phosphate conversion layer and polymer on blasted specimens (SAE 5115) with a combined lubricant layer weight of
, was chosen [
7]. Four tribological loads were chosen according to Bay et al. [
8]: the contact normal stress
σn, the relative sliding velocity
vrel, the surface enlargement
ψ and the temperature
T.
A large variation of the friction coefficient is observed. It is assumed that these variations are due to the large variation of tribological loads. By adjusting the upsetting force and relative sliding speed of the SCT, it is possible to reproduce the loads of the other tests. The respective results are compared in
Figure 1.
The adjustment of the tribological loads of different tribometers with the sliding compression test leads to a high accordance regarding the resulting friction coefficients, showing that for the given tribological system, the reproduction of tribological loads within different tribometers yields the same friction coefficients. Using the attained medium friction coefficient within the numerical simulation of the reference extrusion process (for a more in-detail description of the extrusion operation, see [
9]) with the same tribological system, allows to reproduce the force-displacement-trend very well [
7].
While this recent study has shown that considering the tribological loads allows reproducing the frictional properties of the investigated processes well when using a solid lubricant, investigations of processes with liquid lubricants (oil) have shown phenomena that suggest the consideration of additional parameters when empirically measuring friction. Within the following section, two different processes (extrusion and rolling) are described that highlight this necessity.
Figure 2 depicts a two stage, oil lubricated, extrusion process as well as the final specimen and depictions of the surface topography at selected locations. The initial surface exhibits a very low roughness and even topography. Within the die (18 mm), the surface shows a significant roughening, with valleys that are formed by the enclosed lubricant [
10]. After passing the extrusion die, the surface still exhibits some of these lubricant pockets (30 mm).
In order to measure friction accurately within this kind of process, it is necessary to consider the trapping of oil within the forming zone, as has already been highlighted by Oyane and Osakada [
11].
Recent studies of the influence of the tribological system of thread and profile rolling processes have revealed that adding oil to the tribological system does not influence the occurrence of work piece defects [
12]. The rolling of two plane symmetrical grooves was performed with the help of flat die rolling as depicted in
Figure 3 (left), while the resulting workpiece is depicted in
Figure 3 (right).
Within the performed study, amongst others, the surface state (with zinc-phosphate + polymer/pickled), the lubrication state (with oil/without oil) and the stroke rate was altered. The results of this study reveal that the use of oil as lubricant does not affect the maximum achievable output rate of the rolling process, regardless of the employed stroke rate (stroke), the yield stress (yield str.) and the surface state (surface). Since the maximum achievable output rate is directly affected by friction between the work piece and dies, it would be suspected that a lubricated tribological system yields lower output rates than a non-oil lubricated tribological system [
12].
4. Experimental Comparison of the Contact Condition and Lubricant Type
In the following section, the used tribometer (sliding compression test) will be described as well as the experimental setup used to investigate the influence of the type of lubricant, surface preparation, and contact condition. The sliding compression test was chosen because it offers the independent adjustment of the tribological loads, an efficient reworking of the sliding plates, and, most importantly, it is possible to mimic both a closed contact evolution (like in open forging) as well as an open contact kinematic (like in rolling).
4.1. General description of the Sliding Compression Test
Within this current paper, the determination of the friction coefficient μ is conducted with the help of the Sliding Compression Test (SCT) [
13]. A dual acting hydraulic press is utilized to apply the necessary upsetting force
to the cylindrical specimens to achieve the specified contact normal stress and surface enlargement. After compression of the specimen, the compression plate is slid in relative motion against the specimen while the compression force is maintained, see
Figure 4. Dividing the sliding force
by the upsetting force
allows the determination of the friction coefficient
.
4.2. Experimental and Numerical Setup
The varied factors as well as factor levels are depicted in
Table 1.
By using both oil and a polymer lubricant, the influence of lubricant viscosity and lubricant bond to the surface of the specimens can be investigated. Since it is assumed that lubricant entrapment might play a role during the forming process, the SCT setup is varied as to achieve the possibility to investigate this factor.
The SCT will thus be used in two different setups. Setup 1 coincides with the setup described in
Section 4.1 with the specimen being positioned on its face surface. Setup 2 features a specimen that is positioned on its shell surface [
14]. In
Figure 5, a comparison of both upsetting processes is shown.
Contrary to setup 1, setup 2 exhibits a line contact between the sliding plate and the specimen at the beginning of the upsetting process. During the increase of the upsetting force, the contact area increases by material flowing from the lateral area of the specimen. Due to this type of material flow, it is expected that liquid lubricant is squeezed from the contact surface. Within setup 1, the specimen however forms a closed contact surface from the beginning of the upsetting process which should largely prohibit the squeezing out of lubricant.
The Sliding Compression Test is modelled numerically with the help of simufact.forming v13.3 (Simufact Engineering GmbH, Hamburg, Germany). Setup 1 is modelled with axisymmetric symmetry, while setup 2 uses a three-dimensional model with two symmetry planes. Both models feature element edge lengths of , an elastic-plastic material model of the work piece and rigid tools.
The resulting final shapes of the specimens are depicted in
Figure 6 (top). The final shape of setup 1 is obtained with a compression force of
, while for setup 2 a force of
is used. The resulting contact normal and surface enlargement distributions at the respective force levels are depicted in
Figure 6 (bottom). The contact normal stress distribution of both setups matches well for the selected force levels. However, this does not apply to the distribution of surface enlargement. Although the surface enlargement is qualitatively well matched, setup 2 exhibits approximately 2.5 times higher values due to the different material flow. While the face area is continuously enlarged during the upsetting of the specimen during setup 1, the contact surface in setup 2 is composed of both the initial contact surface and the shell surface which is not in contact at the start of the test. This leads to an overall smaller surface enlargement.
The different roughness of the initial specimen surfaces is achieved by blasting and grinding operations. Blasting is widely established in forging as a means to clean billet surfaces as well as set a defined surface roughness and topography [
15]. Grinding on the other hand is typically used to machine the forming tools. Within this study, it is used to apply a homogenous surface topography with significantly lower roughness than compared to blasting. The resulting surfaces as well as exemplary profiles are depicted in
Figure 7, while
Table 2 depicts the parameterization and preparation of the SCT. The surface measurements are performed with the confocal white light microscope µSurf (NanoFocus AG, Oberhausen, Germany). The maximum profile height for the blasted surface is 10 µm, while the maximum height for the ground surface is 1.5 µm.
5. Results
Figure 8 shows the comparison of the determined friction coefficients using blasted sample surfaces with oil lubrication. When using setup 2, both higher friction and wear during the last third of the sliding path can be observed. In the first 2/3 of the sliding path, the coefficient of friction reaches
and is 50% larger than the coefficient of friction for setup 1.
A different picture presents itself when using ground specimen surfaces, see
Figure 9. With setup 1, a rise of friction can be observed with increasing test runs. This increase of friction over the number of test runs finally results in significant wear on the last test run. Using setup 2, on the other hand, shows that wear is significantly large enough to cause a breaking down of the tribological system within the first test run, with the specimen being welded onto the sliding plate due to friction coefficients as high as
.
When using the polymer as lubricant, no wear can be detected for the entirety of all test series, see
Figure 10. Test series carried out with setup 2 tend to have higher coefficients of friction, whereas the influence of surface roughness is negligible.
To summarize, the performed friction tests are analyzed regarding the medium friction coefficient (arithmetic average of all test runs within a sliding path length of
) and are evaluated with the help of design of experiments. The resulting main effect and interaction plots are depicted in
Figure 11 and
Figure 12, respectively.
6. Discussion
Due to the higher achievable surface enlargement with setup 1, a larger lubricant thinning is initially to be expected, resulting in a higher coefficient of friction. However, as shown in
Figure 11a, the mean coefficient of friction increases when setup 2 is used. It can thus be assumed that due to the sufficiently thick lubricant layer, the influence of surface enlargement in the investigated tribological systems is negligible. Therefore, a different factor must be the cause of the increased friction coefficient for setup 2.
When using oil as lubricant, both the punch shape and the surface roughness influence the resulting friction coefficient significantly, see
Figure 12a,b. The influence of the surface preparation in regards to wear is shown in
Figure 13. While samples with a ground surface show clear adhesive wear marks on the sliding plate with a maximum height of
Vmax = 19 µm, blasted surfaces lead only to slight, ridge-like wear marks with a negligible maximum height of
Vmax ≌ 1 µm. The coefficient of friction also remains constant at
for the entire sliding path of the blasted specimen (see
Figure 8), while the friction coefficient reaches friction coefficients as high as
(see
Figure 9).
In general,
Figure 11b shows that the coefficient of friction is significantly lower when using the polymer lubricant than when using the oil lubricant. Furthermore, as shown in
Figure 10, no significant wear can be observed for any test carried out with polymer lubricant. The surface preparation and punch shape used also only have a minor influence on the resulting coefficient of friction.
Contrary to the assumptions that the tribological loads are significant in regards to the resulting friction, the present results show that depending on the tribological system and process conditions, other factors are more relevant when using liquid lubrication systems for the characterization of friction. In the present case, the differing surface enlargement between the two investigated setups is only marginally influencing the friction coefficient when using the polymer lubricant, while the use of a liquid lubricant is significantly dependent on the employed setup. It can be assumed that with given process kinematics and lubricant viscosity, the liquid lubricant is forced off the surface respectively out of the contact zone during the upsetting phase of the SCT. This absence of lubricant within the contact zone is expressed by a significant increase of the friction coefficients with increasing sliding paths, see for example
Figure 8 and
Figure 9. The increase of the friction coefficients at higher sliding paths is attributed to the fact that any lubricant still remaining within the contact zone after upsetting is steadily drained during sliding, resulting in an increase of friction. In cases of low initial surface roughness, a relatively small amount of lubricant will remain within the contact zone. This can result in direct contact in between the specimen and sliding plates, which will yield adhesive wear, as depicted in
Figure 13.
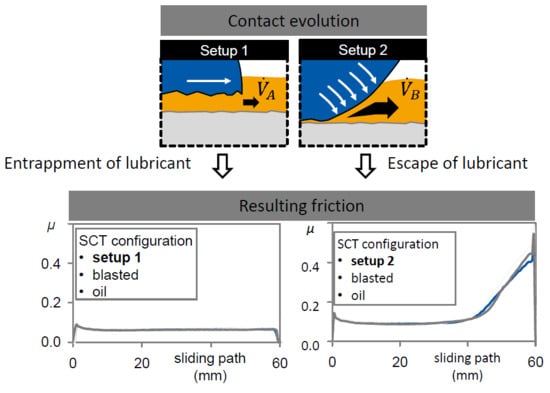
This process understanding of lubricant escape from the contact zone is shown in
Figure 14a schematically for the two types of sliding compression test. Since the lubricant in setup 1 is enclosed between the specimen and the sliding compression plate from the start of the test, only a small amount of lubricant can be squeezed out from the contact zone. Additionally, the roughened surfaces allow the storage of more lubricant, which in turn results in lower coefficients of friction, see
Figure 12a. Due to the rolling motion during the upsetting of the specimen in relation to the sliding plate when using setup 2, considerably more lubricant is squeezed from the contact zone (flow
). Smooth, ground surface topographies additionally allow less retention of the lubricant and, thus, contribute to higher coefficients of friction and rapid wear. The effect of lubricant squeezed from the contact zone is however negligible when using lubricants with higher viscosity and improved bond to the billet surface, as is the case for the polymer lubricant. Here, no significant increase of friction can be observed when using setup 2, as is the case when a ground surface is used. It can thus be deduced that the lubricant remains within the contact zone after upsetting.
This also explains the non-existent influence of the oil during profile rolling. Due to the process kinematics, the lubricant is displaced from the contact zone by squeezing, see
Figure 14b. This process is also supported by the very low surface roughness in the root radius and the profile flanks due to the repeated rolling over of the surfaces by the die.
The entrapment of lubricant in extrusion processes may also lead to the formation of roughened surfaces due to the enclosed oil in extrusion processes, as is depicted in
Figure 2. This understanding is depicted in
Figure 15, left. At the time insertion of the specimen into the die, the surface of the specimen and die is covered with lubricant (oil). With the beginning of the forming operation, the punch comes into contact with the specimen. Lubricant thus cannot escape in the direction of the punch, while the same is true for the region within the die, where the specimen comes into contact (see
Figure 15, right). Thus, lubricant accumulates within the die zone and leads to a roughening of the surface.
7. Summary
Friction measurement is an important means of improving the numerical simulations of cold forging operations. Typically, the tribological loads of the reference process are replicated with the friction tests in order to ensure that the friction coefficients are obtained under the same tribological conditions. However, findings from literature suggest that the entrapment of lubricant influences the final surface topography of the work piece as well as the frictional conditions. The Sliding Compression Test (SCT) with different punch geometries (setup 1 and setup 2), surface topographies (blasted and ground), and lubricants (with oil and without oil) was used to investigate this effect of entrapment towards friction and wear systematically. The presented findings show, that depending on the used type of lubricant, the additional parameter of lubricant retention has to be accounted for. A squeezing of the oil lubricant from the surface, which is achieved by choosing a die according to setup 2, leads generally to higher friction and wear. While solid lubricants do not exhibit a large effect regarding the friction coefficient, the tribological system with the liquid lubricant is very sensitive regarding the setup of the process and the surface topography.
Thus, to further improve the measurement of friction as well as friction modeling within numerical simulations, the retention of lubricant has to be considered for the empirical measurement of friction in cold forging. Not only does the lubricant influence the final surface topography, but also the resulting friction coefficient. Next to the characterization of friction, the modeling of friction is also affected. While many different friction models have been developed, to the authors’ knowledge, none of these models account for the entrapment of lubricant. However, this has to be accounted for in order to allow a precise prediction of the frictional properties for lower viscosity lubricants such as oil.


