Article

Study of Break-In Process and its Effects on Piston Skirt Lubrication in Internal Combustion Engines

Department of Mechanical Engineering, Massachusetts Institute of Technology, Cambridge, MA 02139, USA
*
Author to whom correspondence should be addressed.
Lubricants 2019, 7(11), 98; https://doi.org/10.3390/lubricants7110098
Submission received: 17 September 2019 / Revised: 25 October 2019 / Accepted: 29 October 2019 / Published: 2 November 2019
(This article belongs to the Special Issue Tribology of Powertrain Systems)

Abstract

:
The piston skirt is one of the main contributors to the total mechanical loss in internal combustion engines. Usually, the skirt friction experiences a rapid change during the break-in period largely due to the wear of the machine marks or roughness against soft coatings. It is thus important to consider the effect of the change of the roughness for a realistic prediction of the piston skirt friction and system optimization. In this work, an existing model of piston skirt lubrication was improved with the consideration of a breaking in process for the most commonly used triangle machine marks. A new set of flow factors in the averaged Reynolds equation were analytically derived for the trapezoid shape formed after wear of the original triangle shape. A new asperity contact model was developed for the trapezoid shape. The calculation results reflect the trend of friction mean effective pressure (FMEP) during break-in in an engine test and showed quantitative agreement under the same amount of wear.

Graphical Abstract

1. Introduction

The piston skirt can be a major contributor to the total engine friction loss in internal combustion engines. Piston skirt friction is a consequence of complex interactions at different scales. At the largest scale is the piston secondary motion and the deformation of the piston skirt and the cylinder liner due to the impact of the piston skirt. Then, the profile of the piston skirt and bore distortion determines the exact nominal clearance distribution for the lubrication of the skirt and the liner. At the lowest level is the roughness or waviness of designed patterns on the skirt whose peak-valley height is in the order of sub-microns to 10 microns, which will be referred to as the Level III feature hereafter. A realistic prediction of skirt friction needs an adequate understanding of and models for these interactions. Furthermore, depending on the coating material, the Level III feature can change drastically during the initial running period intentionally or unintentionally. Applying a soft coating on the skirt to allow fast break-in can be considered as advantageous as the exact bore distortion is changing with operating conditions and not known. It was found that maximizing the hydrodynamic lubrication is still beneficial to the reduction of the skirt friction even when the coefficient of the friction of the boundary lubrication is as low as 0.03 [1,2,3].
The interaction on the interface between the skirt and the liner, especially during early expansion stroke as shown in Figure 1, has attracted great attention from both academia and industry. First of all, there have been studies on the coating materials for the skirt. Wang, et al. [4,5] evaluated the tribological behaviors of composite polymer coatings and ceramic composite coatings for aluminum pistons, and ranked different materials in terms of wear and scuffing resistance. In recent years, graphite coatings [6,7,8] and diamond-like carbon coatings [9,10] have become increasingly popular. In addition, new surface treatment technologies have been developed. Ogihara [11] applied micro dimple treatment and MoS2 shot treatment to the piston skirt, and was able to reduce the sliding resistance of the tested pistons by 2%–2.6% and 4%–5%, respectively.
The effect of Level III feature is also investigated. Sugimura [12] pointed out that the feature is able to keep the lubricant in order to resist stick and wear, and at the initial running the conventional features would experience abrasion, or break-in. Sugimura modified the skirt surface properties by adding microscopic hard particles, and achieved better balance between low friction and anti-abrasion performance. Cho, Lee, and Lee [13] tested the specimens of skirt surfaces with three different roughness values, and found that higher roughness leads to larger friction losses due to asperity interactions with the liner. This agreed with the results from Westerfield, et al. [14], where a floating liner engine setup was used for testing.
Various models have been built to study the friction associated with the piston [15,16,17,18]. Most of the models treat the system as an elastohydrodynamic lubrication problem, and apply the Greenwood–Williamson model [19] for asperity contact. Kobayashi [20] established estimation indices for wear and scuffing of the skirt using the pressure results from a piston secondary motion analysis software, and compared model prediction with the engine test results. However, there are few existing models that incorporate the influence of the breaking-in process on the friction behavior and lubrication performance. The objective of this work is to develop a process to consider the effect of the change of Level III features during engine running to improve the fidelity of optimization of piston skirt designs.

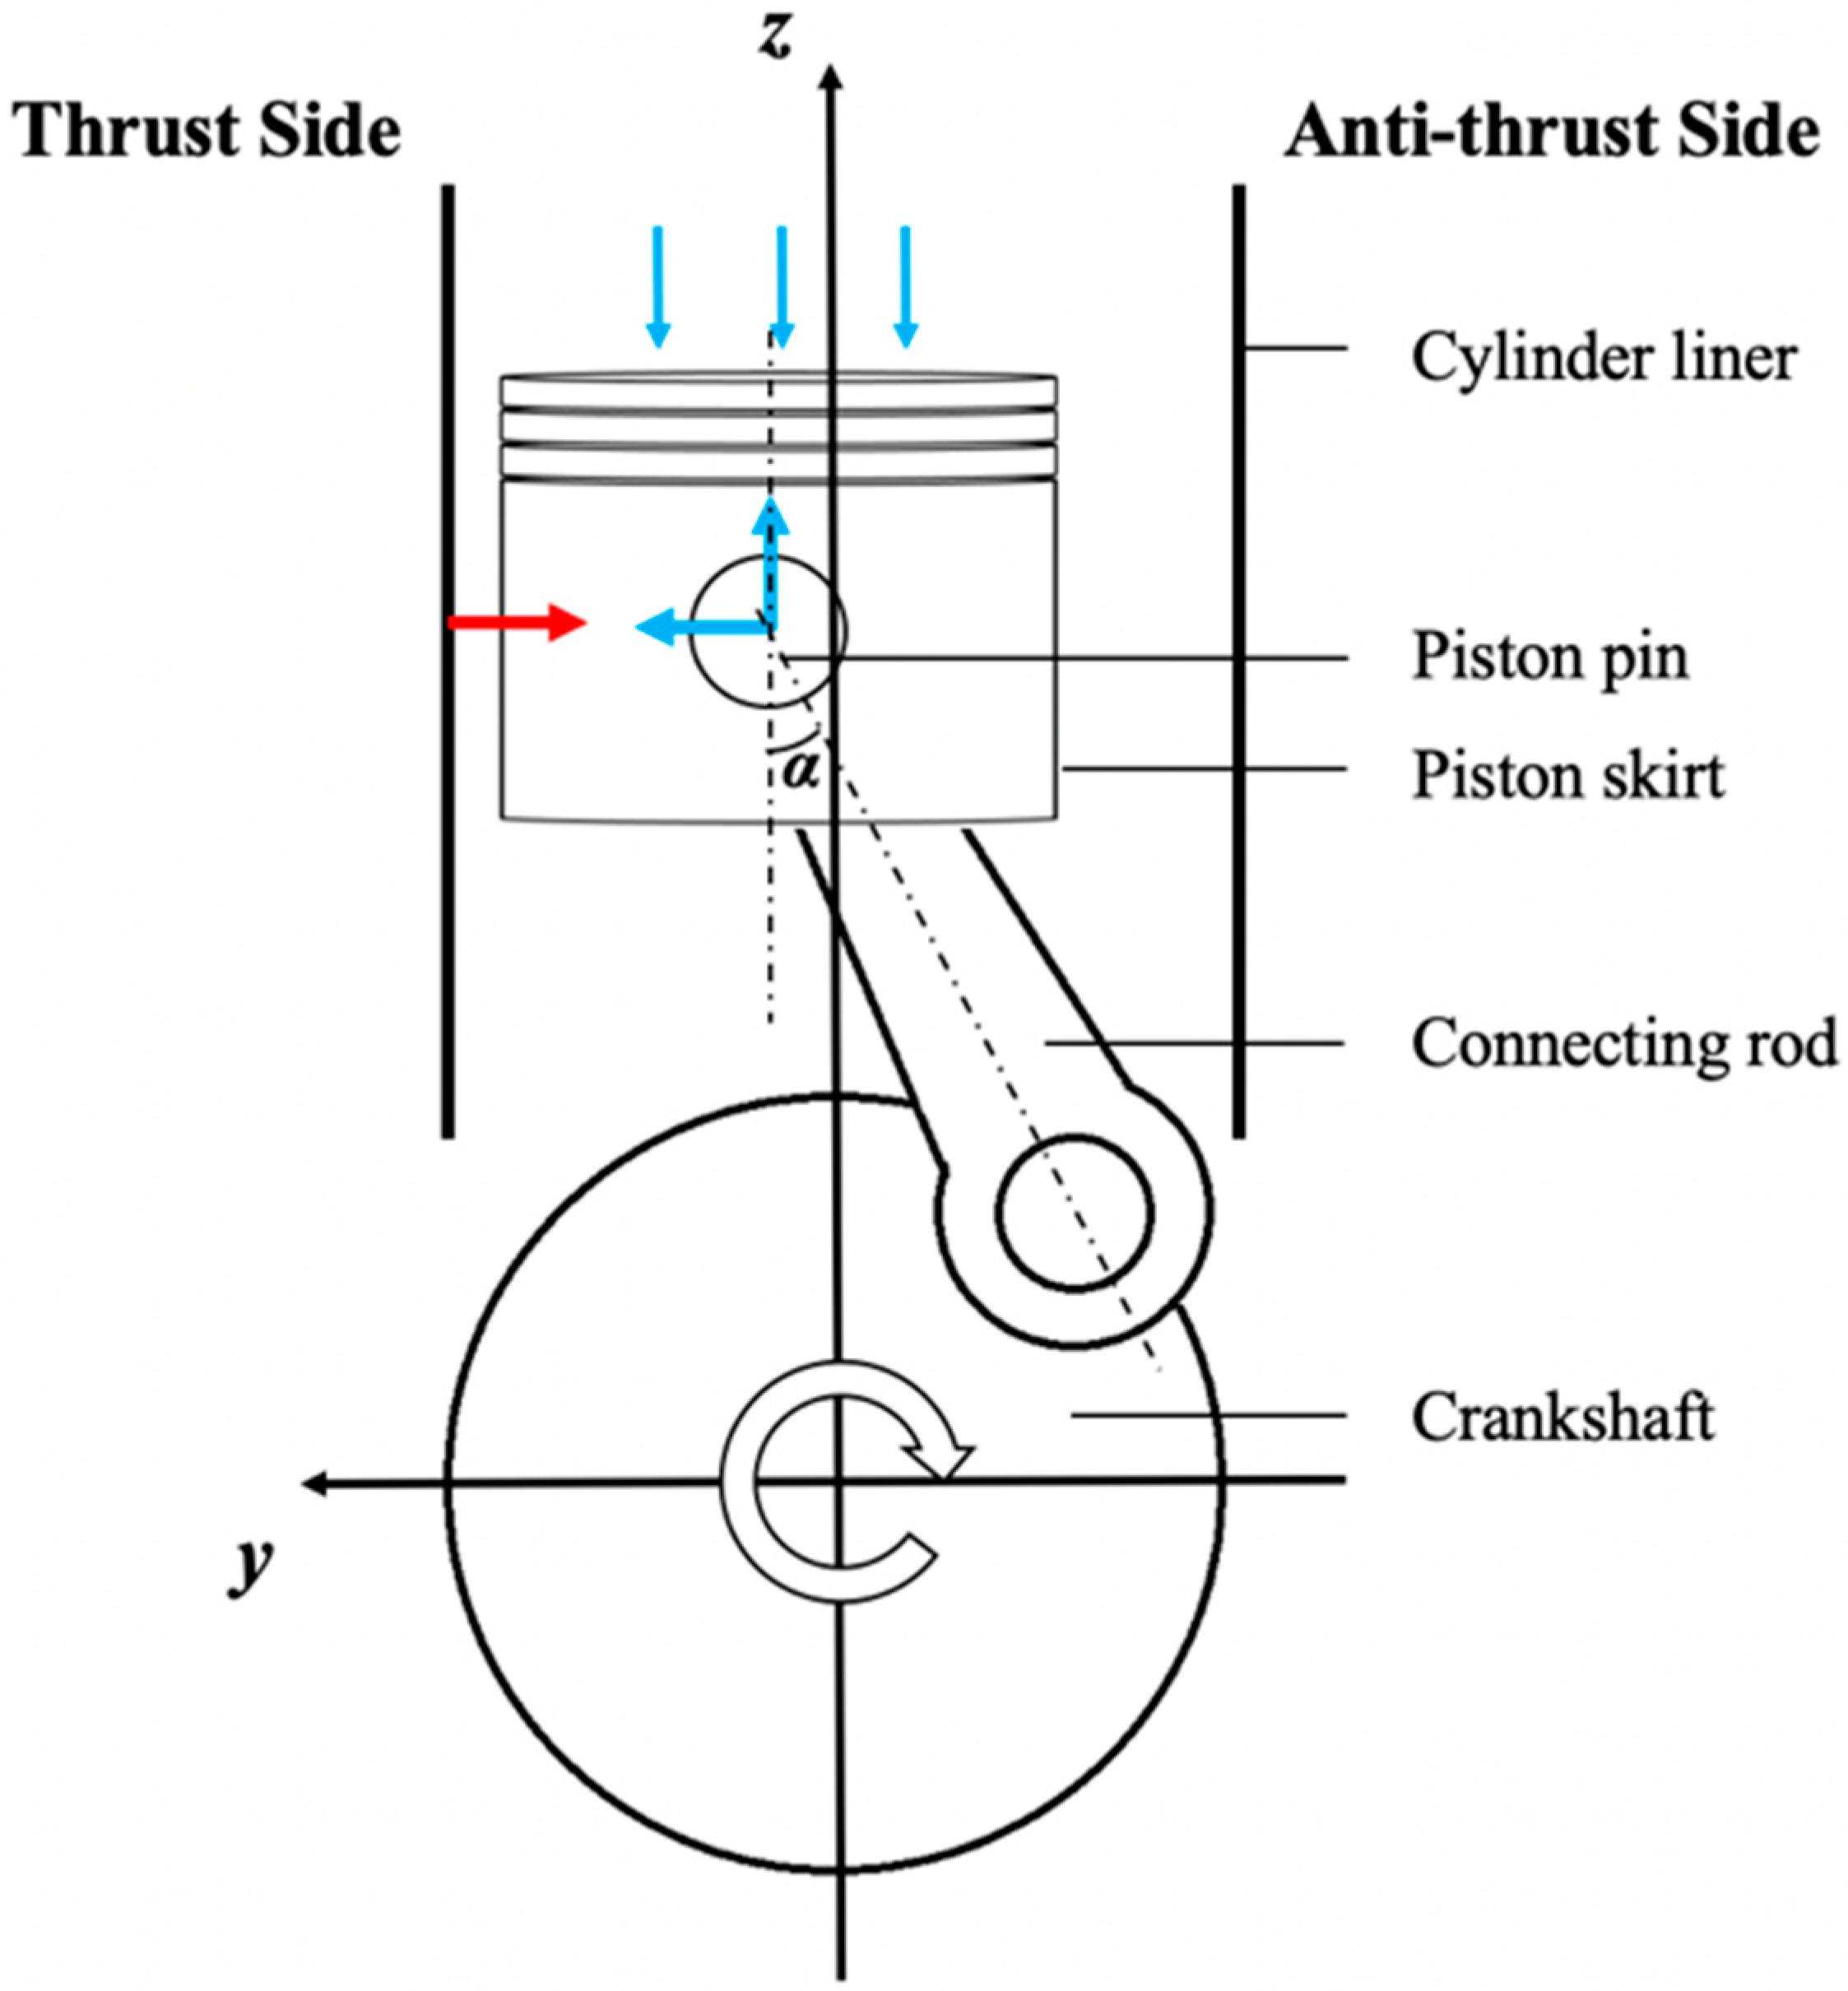
1.1. Floating Liner Engine Testing

The floating liner engine (FLE) is a specialized test engine used in the traditional fired configuration to measure the friction associated with the power cylinder system. It allows accurate measurement of total friction force from all the components that come in contact with the cylinder liner, including the piston and the piston rings.
Table 1 shows some of the engine specifications. In the cases studied in this work, the peak cylinder pressure is 20 bar, corresponding to 4 bar indicated mean effective pressure (IMEP). The testing procedure, referred to as a “sweep”, consists of warming up the engine, and collecting data at 1000, 1500, and 2000 rpm at 4 bar IMEP. More detailed setup and test methods of the experiment can be found in [14].
The pistons tested in the FLE experiment have GRAFAL® coating by Mahle [21] on the piston skirt, which is designated by RS12. The coefficient of friction of the coating is 0.03. The Level III feature of the skirt has a triangular shape, and its nominal peak- valley heights after coating is micrometers. The lubricant used in the test is SAE 5W-30.
Figure 2 shows the friction mean effective pressure (FMEP) during different sweeps for the RS12 piston under 4 bar IMEP and at various engine speeds. Each run in the horizontal axis lasted for 0.5 h. There is a clear drop of around 2000 Pa in FMEP during the first eight to nine runs, after which it starts to stabilize. For all the three running conditions, there exist large fluctuations in the first three hours. Unfortunately, there was no parts analysis after those initial runs and it may be interesting to investigate for a future work. Here it is considered that FMEP reduces during 10 h break-in. It needs to be mentioned that the liner and the ring pack in the engine were already broken-in. Therefore, the change in FMEP during this break-in period is considered to be caused by the skirt.
Figure 3 shows the centerline of the piston skirt profiles on the thrust side before and after testing. The profiles are measured with a surface contour and surface roughness unit developed by Mahr Metrology. The original profile can be simplified and represented by a wave length and a peak-to-valley wave height. After the test, the peaks of the waves are truncated by around 3 micrometers due to breaking in, and a new surface is created on the plateau part. This is important when evaluating the long-term performance of the piston skirt. In this study, the worn waviness is simplified to have a trapezoidal shape.

1.2. Piston Skirt Lubrication Model

The piston secondary motion and skirt lubrication model (P2M) is initiated by McClure [22] and Bai [23] and further developed by Totaro [24] and Meng [1]. The model is a comprehensive analytical tool that integrates the dynamics of piston’s primary and secondary motions, structural deformation of the skirt and the liner, lubrication theory, and oil transport between the skirt and its surrounding areas. The hydrodynamic part of the model applies the theories developed by Patir and Cheng [25] and Elrod [26], and uses the following dimensionless governing equation:
X [ φ x H 3 ( F Φ ) X ] + Z [ φ z H 3 ( F Φ ) Z ] = U Z { [ 1 + ( 1 F ) Φ ] H + φ s } + T { [ 1 + ( 1 F ) Φ ] H }
where φ x , φ z , and φ s are flow factors incorporating the effects of the waviness on the skirt. H is the gap between the skirt and the liner and U is the sliding velocity of the piston. In the full film region, where lubricating oil fills the entire gap, F takes the value of 1 and Φ represent the gauge pressure; in the partial film region, F is 0 and 1 + Φ equates to the ratio between the oil film thickness and the gap. The ambient pressure in the crankcase is used as the boundary condition.
To numerically solve Equation (1), the Poiseuille terms is discretized by the central difference scheme:
{ X [ φ x H 3 ( F Φ ) X ] } i , j = ( φ x H 3 ) i , j + ( φ x H 3 ) i + 1 , j 2 Δ X 2 [ ( F Φ ) i + 1 , j ( F Φ ) i , j ] + ( φ x H 3 ) i , j + ( φ x H 3 ) i 1 , j 2 Δ X 2 [ ( F Φ ) i 1 , j ( F Φ ) i , j ]
{ Z [ φ z H 3 ( F Φ ) X ] } i , j = ( φ z H 3 ) i , j + ( φ z H 3 ) i , j + 1 2 Δ Z 2 [ ( F Φ ) i , j + 1 ( F Φ ) i , j ] + ( φ z H 3 ) i , j + ( φ z H 3 ) i , j 1 2 Δ Z 2 [ ( F Φ ) i , j 1 ( F Φ ) i , j ]
The first-order upwind scheme is applied to the Couette term:
U ( Q Z ) i , j = { U Q i , j Q i , j 1 Δ Z , U > 0 U Q i , j + 1 Q i , j Δ Z , U < 0
where Q = [ 1 + ( 1 F ) Φ ] H + φ s .
The squeezing term uses the first-order backward scheme:
( R T ) i , j ( t ) = R i , j ( t ) R i , j ( t 1 ) Δ T
where R = [ 1 + ( 1 F ) Φ ] H .
The P2M model was recently improved [2] with a physics-based sub-model for the separation of oil film on the interface. The oil transport process predicted by the model has been found to be consistent with experimental observation.
In the following, the further development of the P2M model will be discussed, especially the consideration of the effects of worn waviness. Then, the model will be applied to the simulation of the tested engine configurations, and compared with the results from the experiment.

2. Model Development

Wear of the waviness has two major influences on the model. Firstly, the hydrodynamic pressure generated on the interface will be different from when there is no break-in. Secondly, the calculation of the contact pressure when the skirt and the liner are close enough to each other also needs adjustments.

2.1. Update on the Average Flow Model

The flow factors for arbitrary roughness are usually calculated numerically using the method developed by Patir and Cheng [25,27]. However, for some specific profiles, including those involved in this work, analytical expression can be obtained. The flow factors in Equation (1) for mono-dimensional Level III feature are given by:
φ x = 1 h m 3 h 3
φ z = h 3 h m 3
φ s = 1 σ h 3 h h m h 3
One the other hand, the averaged hydrodynamic shear stress takes the form:
τ = μ 2 ( φ f + φ f s ) U h m 2 φ f p p
where
φ f = h m h 1
φ f s = 3 h m [ h 1 h 2 2 h 3 ]
φ f p = h 2 h m h 3
In these equations, h k is defined as the average value of h k in a certain area:
h k = 1 l x l z 0 l z 0 l x h k d x d z
and h m = h .
Because the wave height of the Level III feature here is much larger than the roughness of the cylinder liner, the liner can be simplified as a smooth surface. For the original triangular waviness, as shown in Figure 4, we have:
h m = h 1 + h 2 2
σ = h 2 h 1 2
Because of symmetry and periodicity, the average values of the surface are the same as those in the boxed area, where the height is:
h ( x ) = h m 2 σ l x , l 2 x l 2
It is straightforward to calculate the averaged powers of h ( x ) ,
h 1 = l 2 l 2 h 1 d x = 1 2 σ log h m + σ h m σ
h 2 = 1 h m 2 σ 2
h 3 = h m ( h m 2 σ 2 ) 2
h 3 = h m ( h m 2 + σ 2 ) 2
and these expressions can be used to calculate the flow factors.
If the waves are truncated by a height of z 0 , as shown in Figure 5, the height in the boxed area is:
h ( x ) = { h 2 σ 2 σ l x , x l 2 ( 1 z 0 σ ) h 2 2 σ + z 0 , x > l 2 ( 1 z 0 σ )
The average values thus become:
h m = h 2 σ z 0 2 4 σ
h 1 = 1 2 σ ( z 0 h 2 2 σ + z 0 + log h 2 h 2 2 σ + z 0 )
h 2 = 2 σ h 2 ( z 0 2 σ ) 2 2 σ h 2 ( h 2 2 σ + z 0 ) 2
h 3 = 4 σ h 2 2 ( z 0 2 σ ) 3 3 h 2 ( z 0 2 σ ) 2 4 σ h 2 2 ( h 2 2 σ + z 0 ) 3
h 3 = h 2 4 + 4 z 0 ( h 2 2 σ + z 0 ) 3 ( h 2 2 σ + z 0 ) 4 8 σ
and the new flow factors are:
φ x = 4 σ h 2 2 ( h 2 2 σ + z 0 ) 3 ( h 2 σ z 0 2 4 σ ) 3 [ 4 σ h 2 2 ( z 0 2 σ ) 3 3 h 2 ( z 0 2 σ ) 2 ]
φ z = h 2 4 + 4 z 0 ( h 2 2 σ + z 0 ) 3 ( h 2 2 σ + z 0 ) 4 8 σ ( h 2 σ z 0 2 4 σ ) 3
φ s = ( 2 σ z 0 ) 3 ( 4 σ 2 z 0 2 3 h 2 z 0 2 h 2 σ ) 4 σ 2 [ 4 σ h 2 2 3 ( 2 σ z 0 ) 2 h 2 + ( 2 σ z 0 ) 3 ]
φ f = 1 2 ( h 2 σ 1 z 0 2 4 σ 2 ) ( z 0 h 2 2 σ + z 0 + log h 2 h 2 2 σ + z 0 )
φ f s = 3 ( h 2 σ z 0 2 4 σ ) { 1 2 σ ( z 0 h 2 2 σ + z 0 + log h 2 h 2 2 σ + z 0 ) [ 2 σ h 2 ( z 0 2 σ ) 2 ] 2 σ ( h 2 2 σ + z 0 ) [ 4 σ h 2 2 ( z 0 2 σ ) 3 3 h 2 ( z 0 2 σ ) 2 ] }
φ f p = 2 h 2 ( h 2 2 σ + z 0 ) [ 2 σ h 2 ( z 0 2 σ ) 2 ] ( h 2 σ z 0 2 4 σ ) [ 4 σ h 2 2 ( z 0 2 σ ) 3 3 h 2 ( z 0 2 σ ) 2 ]

2.2. Contact Pressure

The P2M model used to apply the correlation for a blunt wedge (piston skirt) against a plane (liner) developed by Johnson [28] to calculate the contact pressure. As the waves are worn, a new correlation is necessary for more accurate simulation.
When the lowest value of h ( x ) in Equation (21) is negative, the new distribution of the gap with contact pressure is given by:
h * ( x , z ) = h ( x ) + 2 π E + + p c ( x , z ) d x d z ( x x ) 2 + ( z z ) 2
Under the assumption of semi-infinite body and constant baseline gap h 2 , h * is periodic in the x direction and constant in the z direction:
h * ( x + λ , z + ξ ) = h * ( x , z ) = h * ( x )
where λ is the wave length of the machine marks and ξ is an arbitrary value.
On the other hand, there is a complementarity relation between the gap and the contact pressure:
h * · p c = 0 h * 0 p c 0 or   h * + p c h * 2 + p c 2 = 0
Therefore, given h 2 and z 0 , and effective Young’s modulus E , h * and p c can be calculated by Equations (34) and (35).

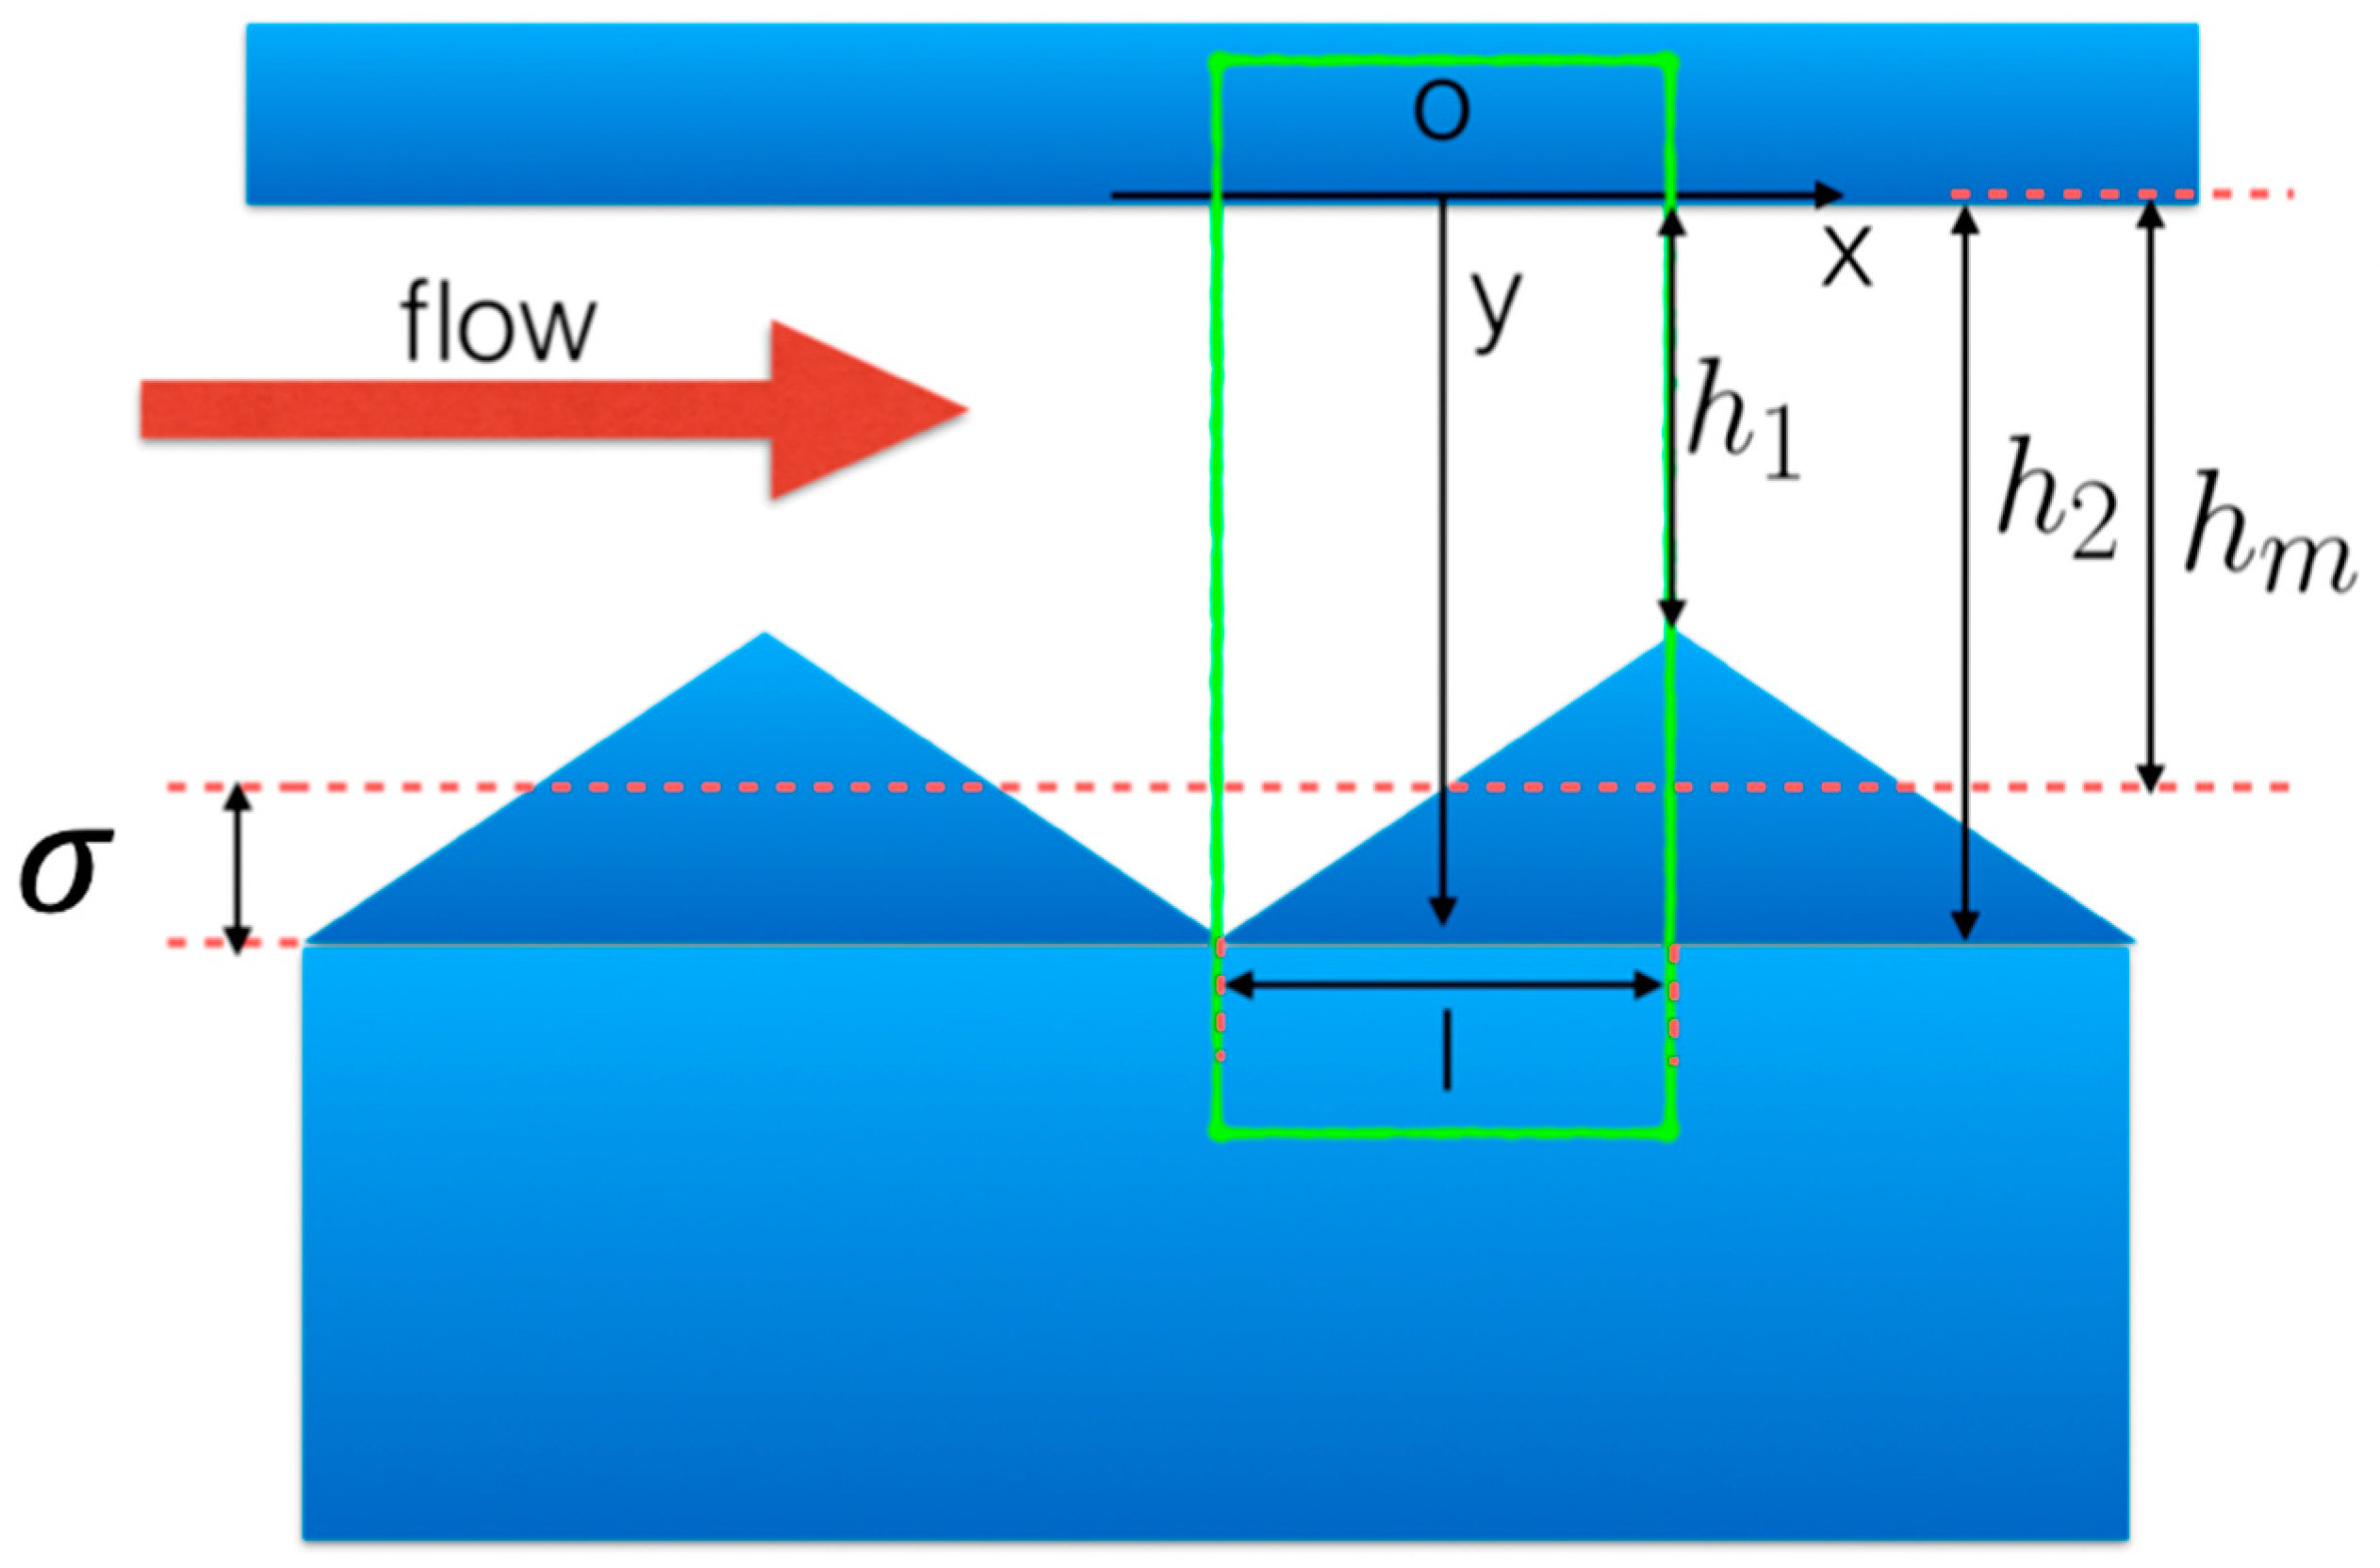
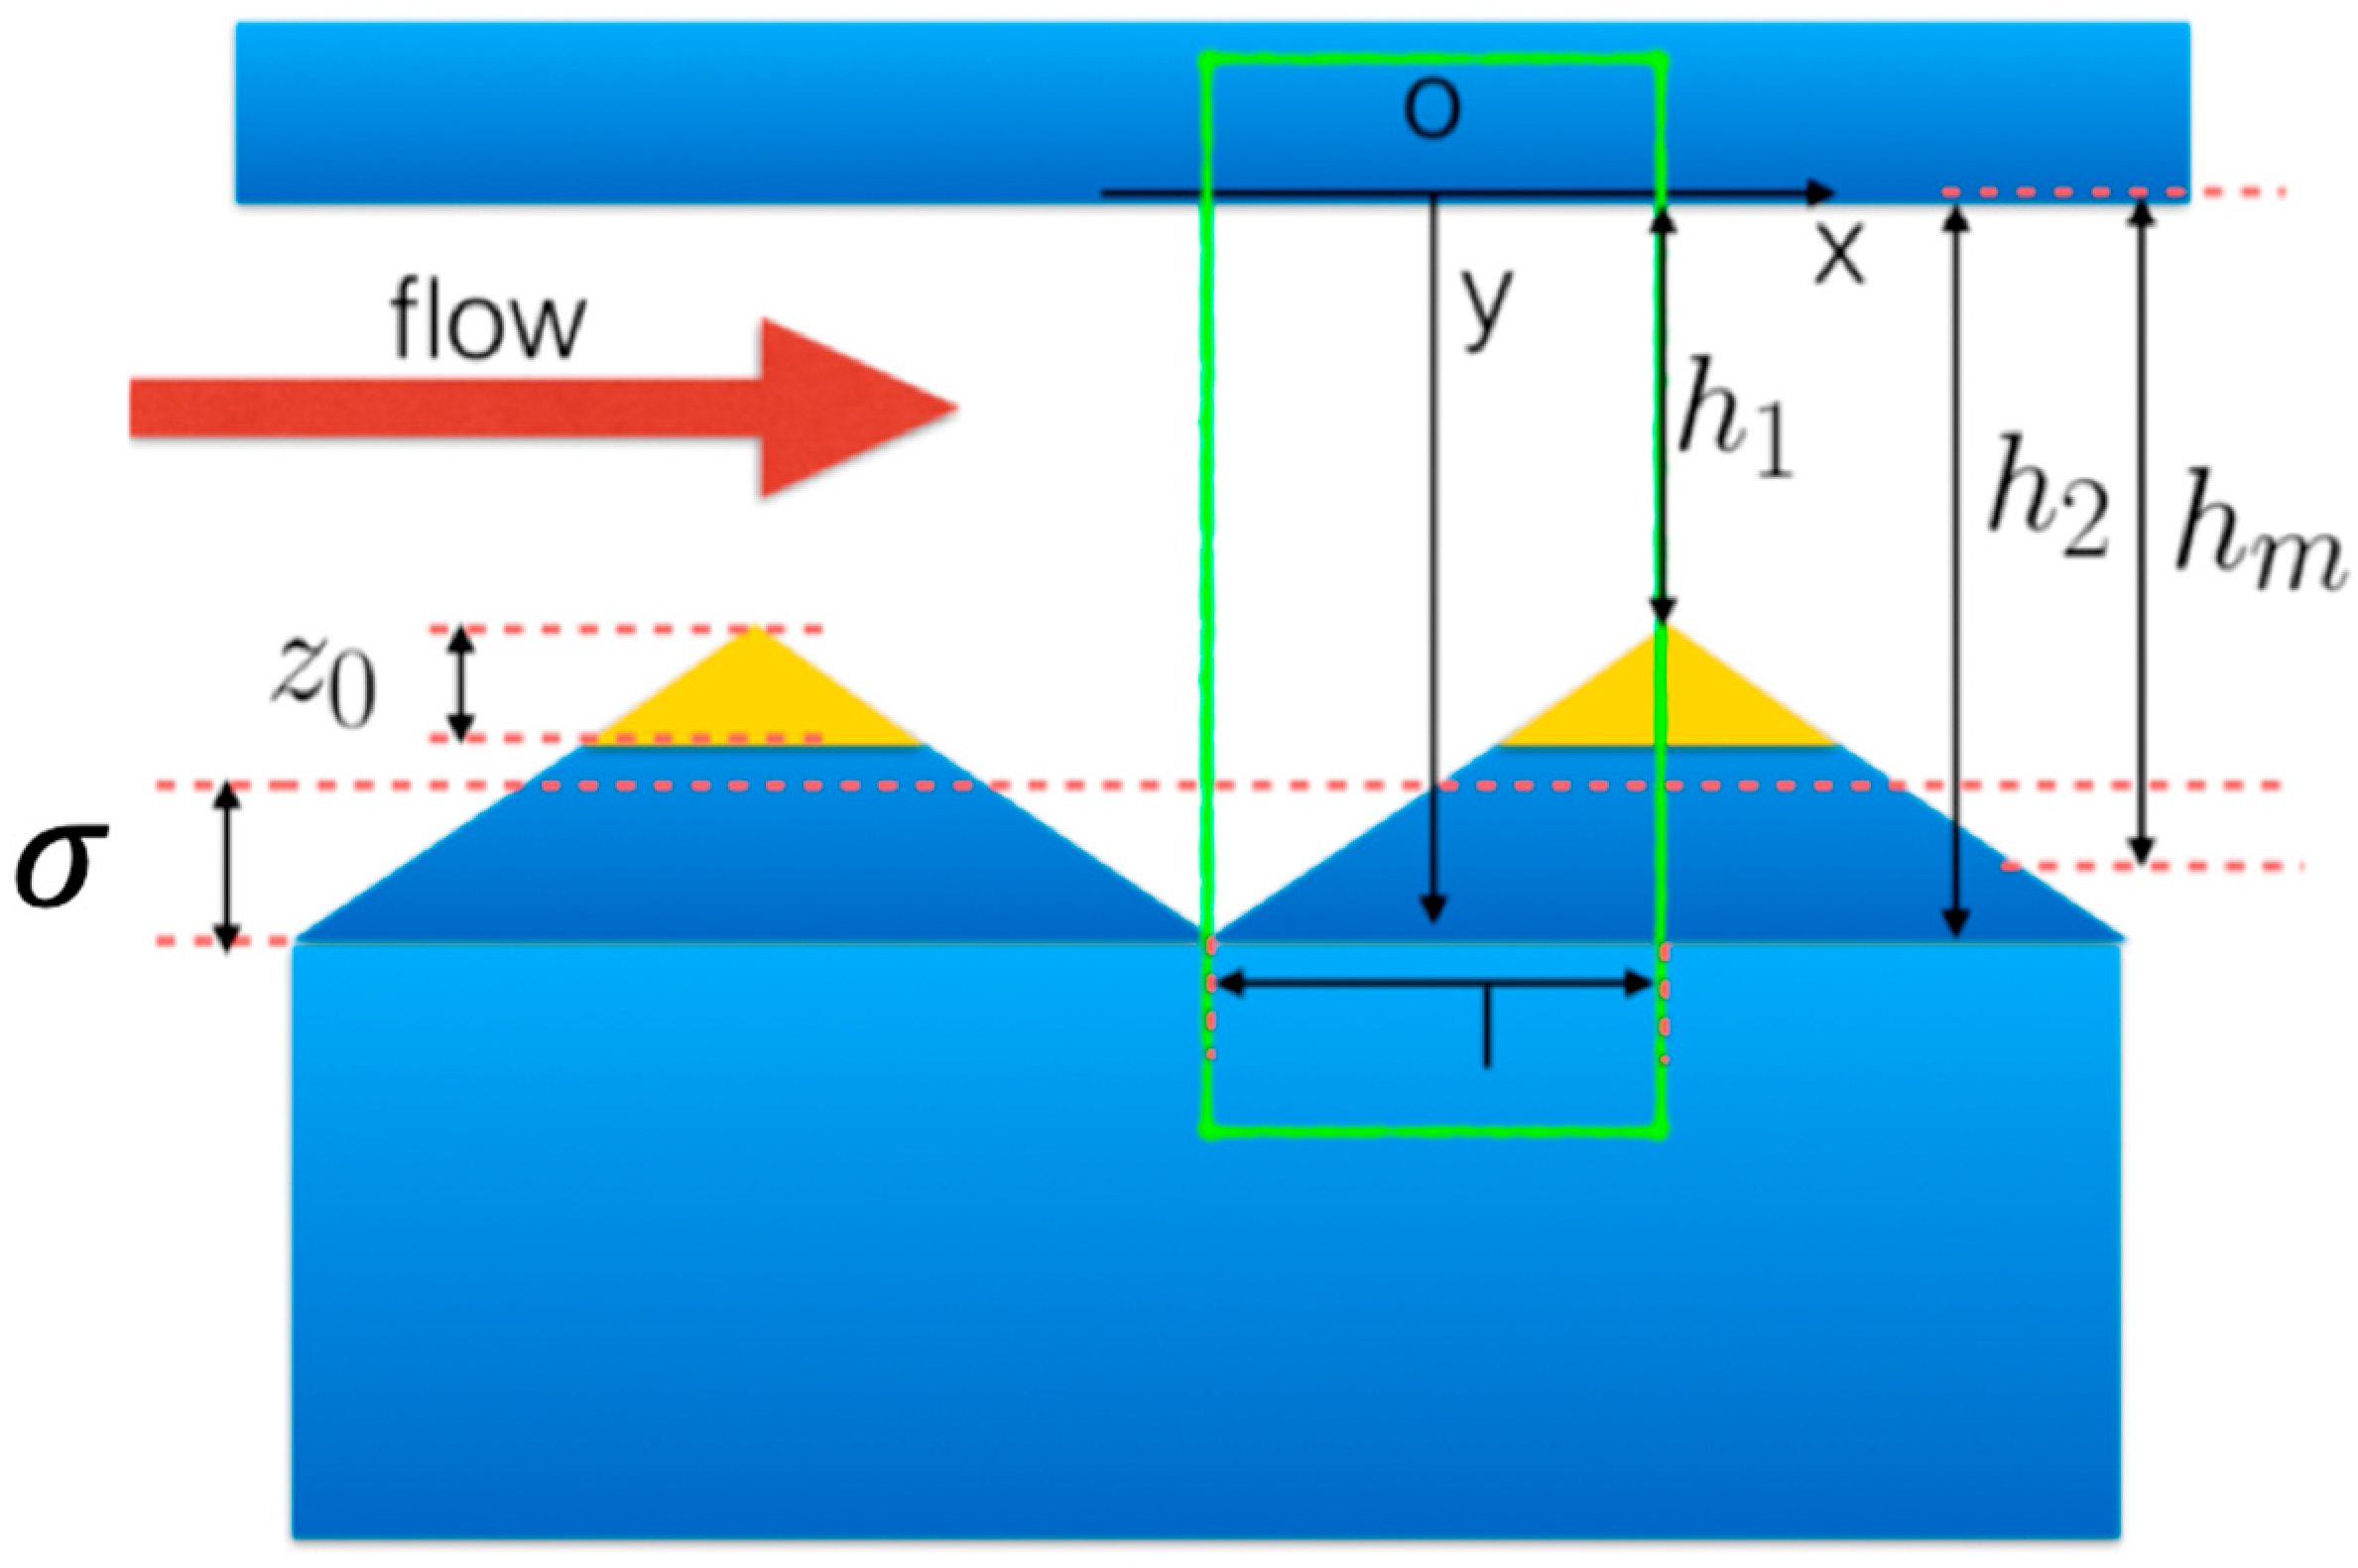
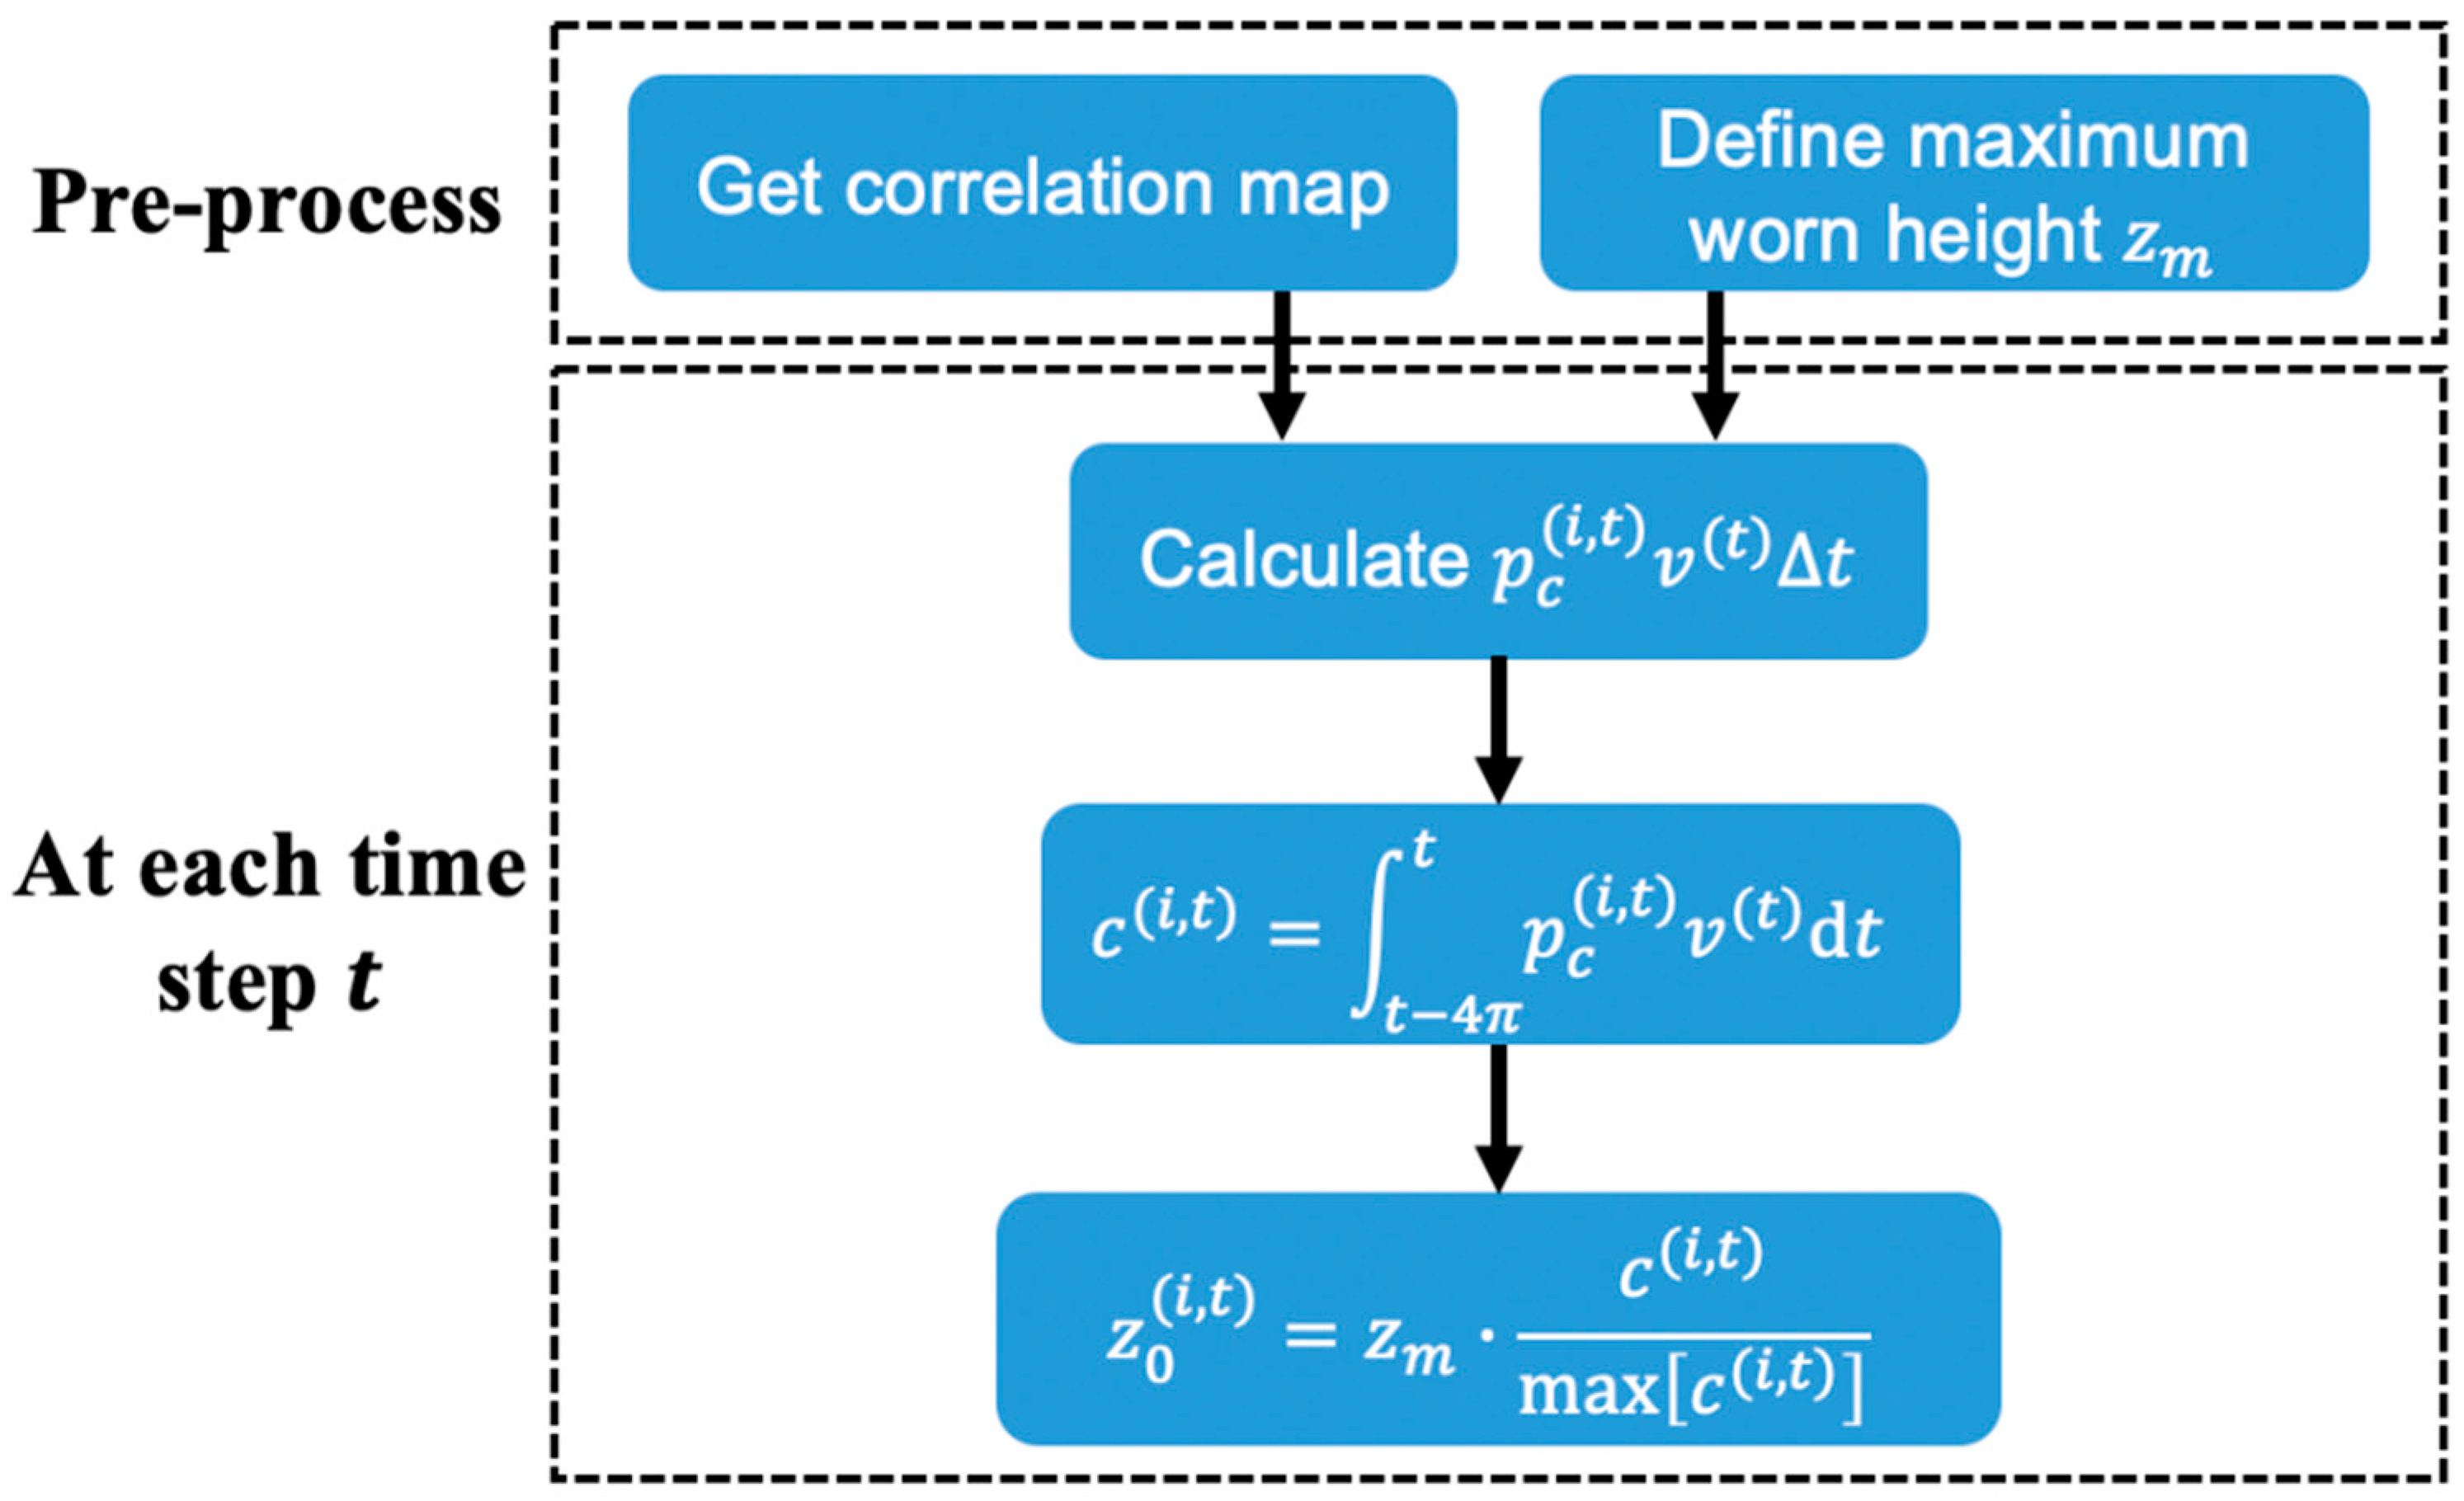
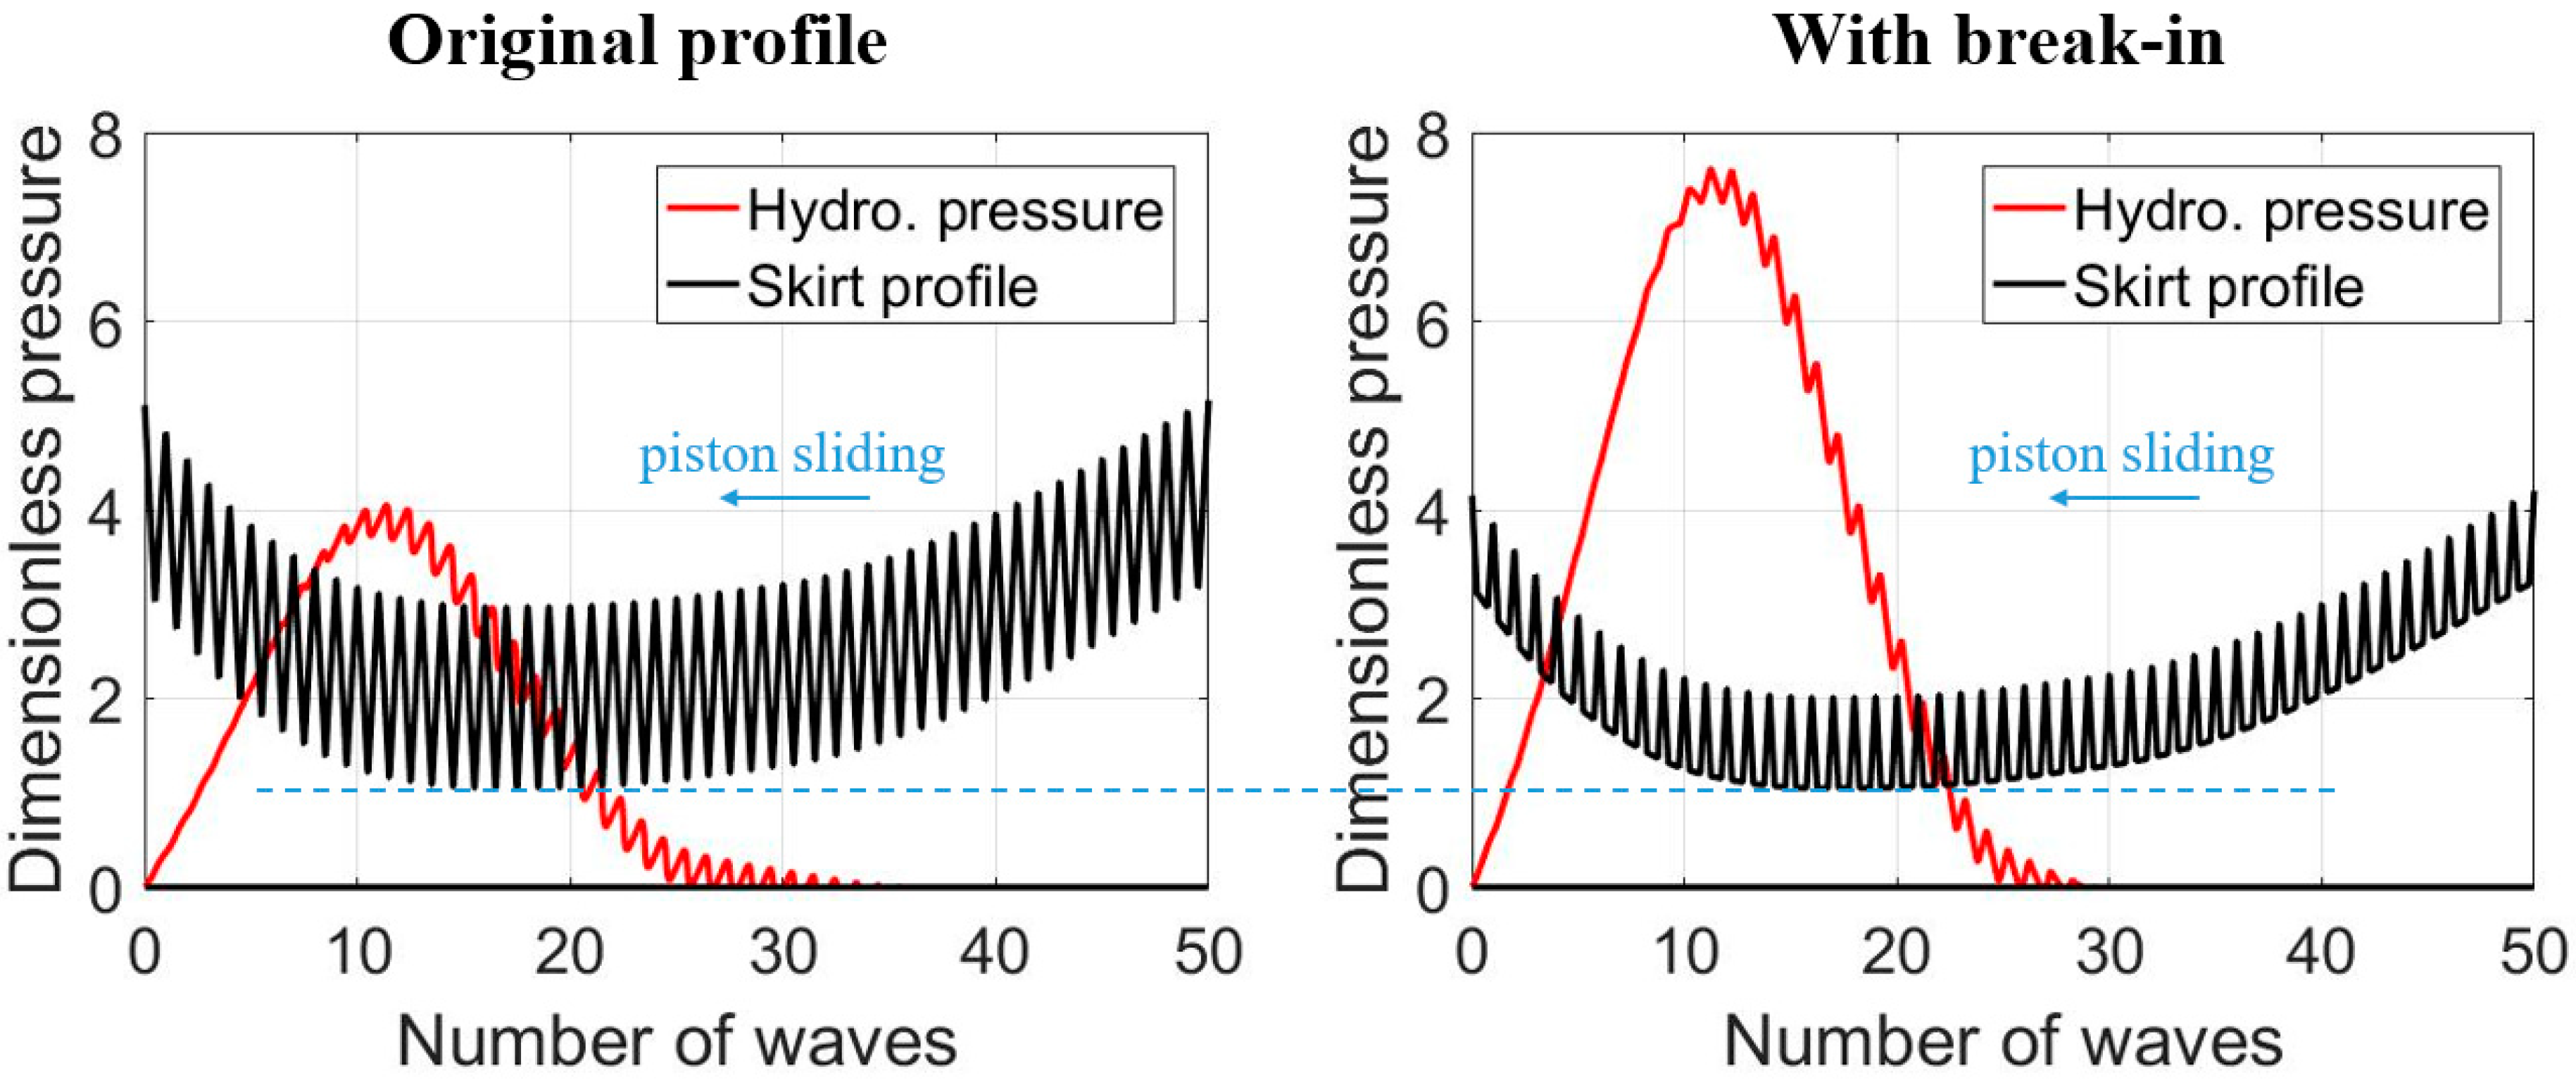
2.3. Worn Height of Waviness

The updated model uses the workflow described in Figure 6 to determine how much the surface waviness is worn.
As the model applies a finite difference scheme, the wave length λ is chosen as the length of the cells in the axial direction. In the pre-processing stage of the model, contact pressure of a large number of combinations of h 2 and z 0 are calculated to generate a map:
p c = f ( h 2 , z 0 )
At each time step of the calculation, the contact pressure at each cell i is interpolated from the map:
p c ( i , t ) = f ( h 2 ( i , t ) , z 0 ( i , t 1 ) )
As the worn height has a linear relationship with the multiplication of the contact force and the sliding velocity of the piston, the accumulation of the multiplication during the latest engine cycle is then updated:
c ( i , t ) = t 4 π t p c ( i , t ) v ( t ) d t
and the worn height at each cell is given by:
z 0 ( i , t ) = z m · c ( i , t ) max [ c ( i , t ) ]
where z m is a pre-determined maximum value for the worn height.

3. Results

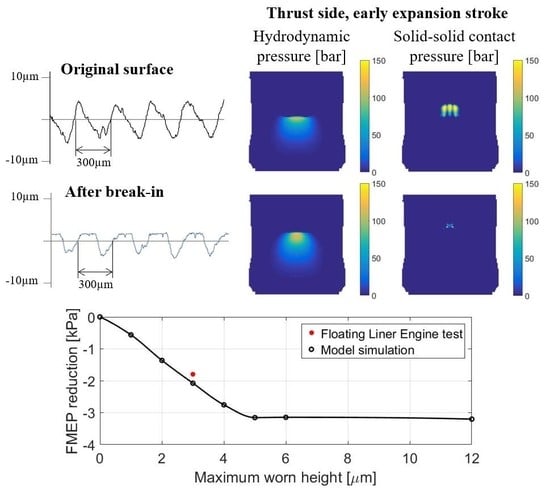
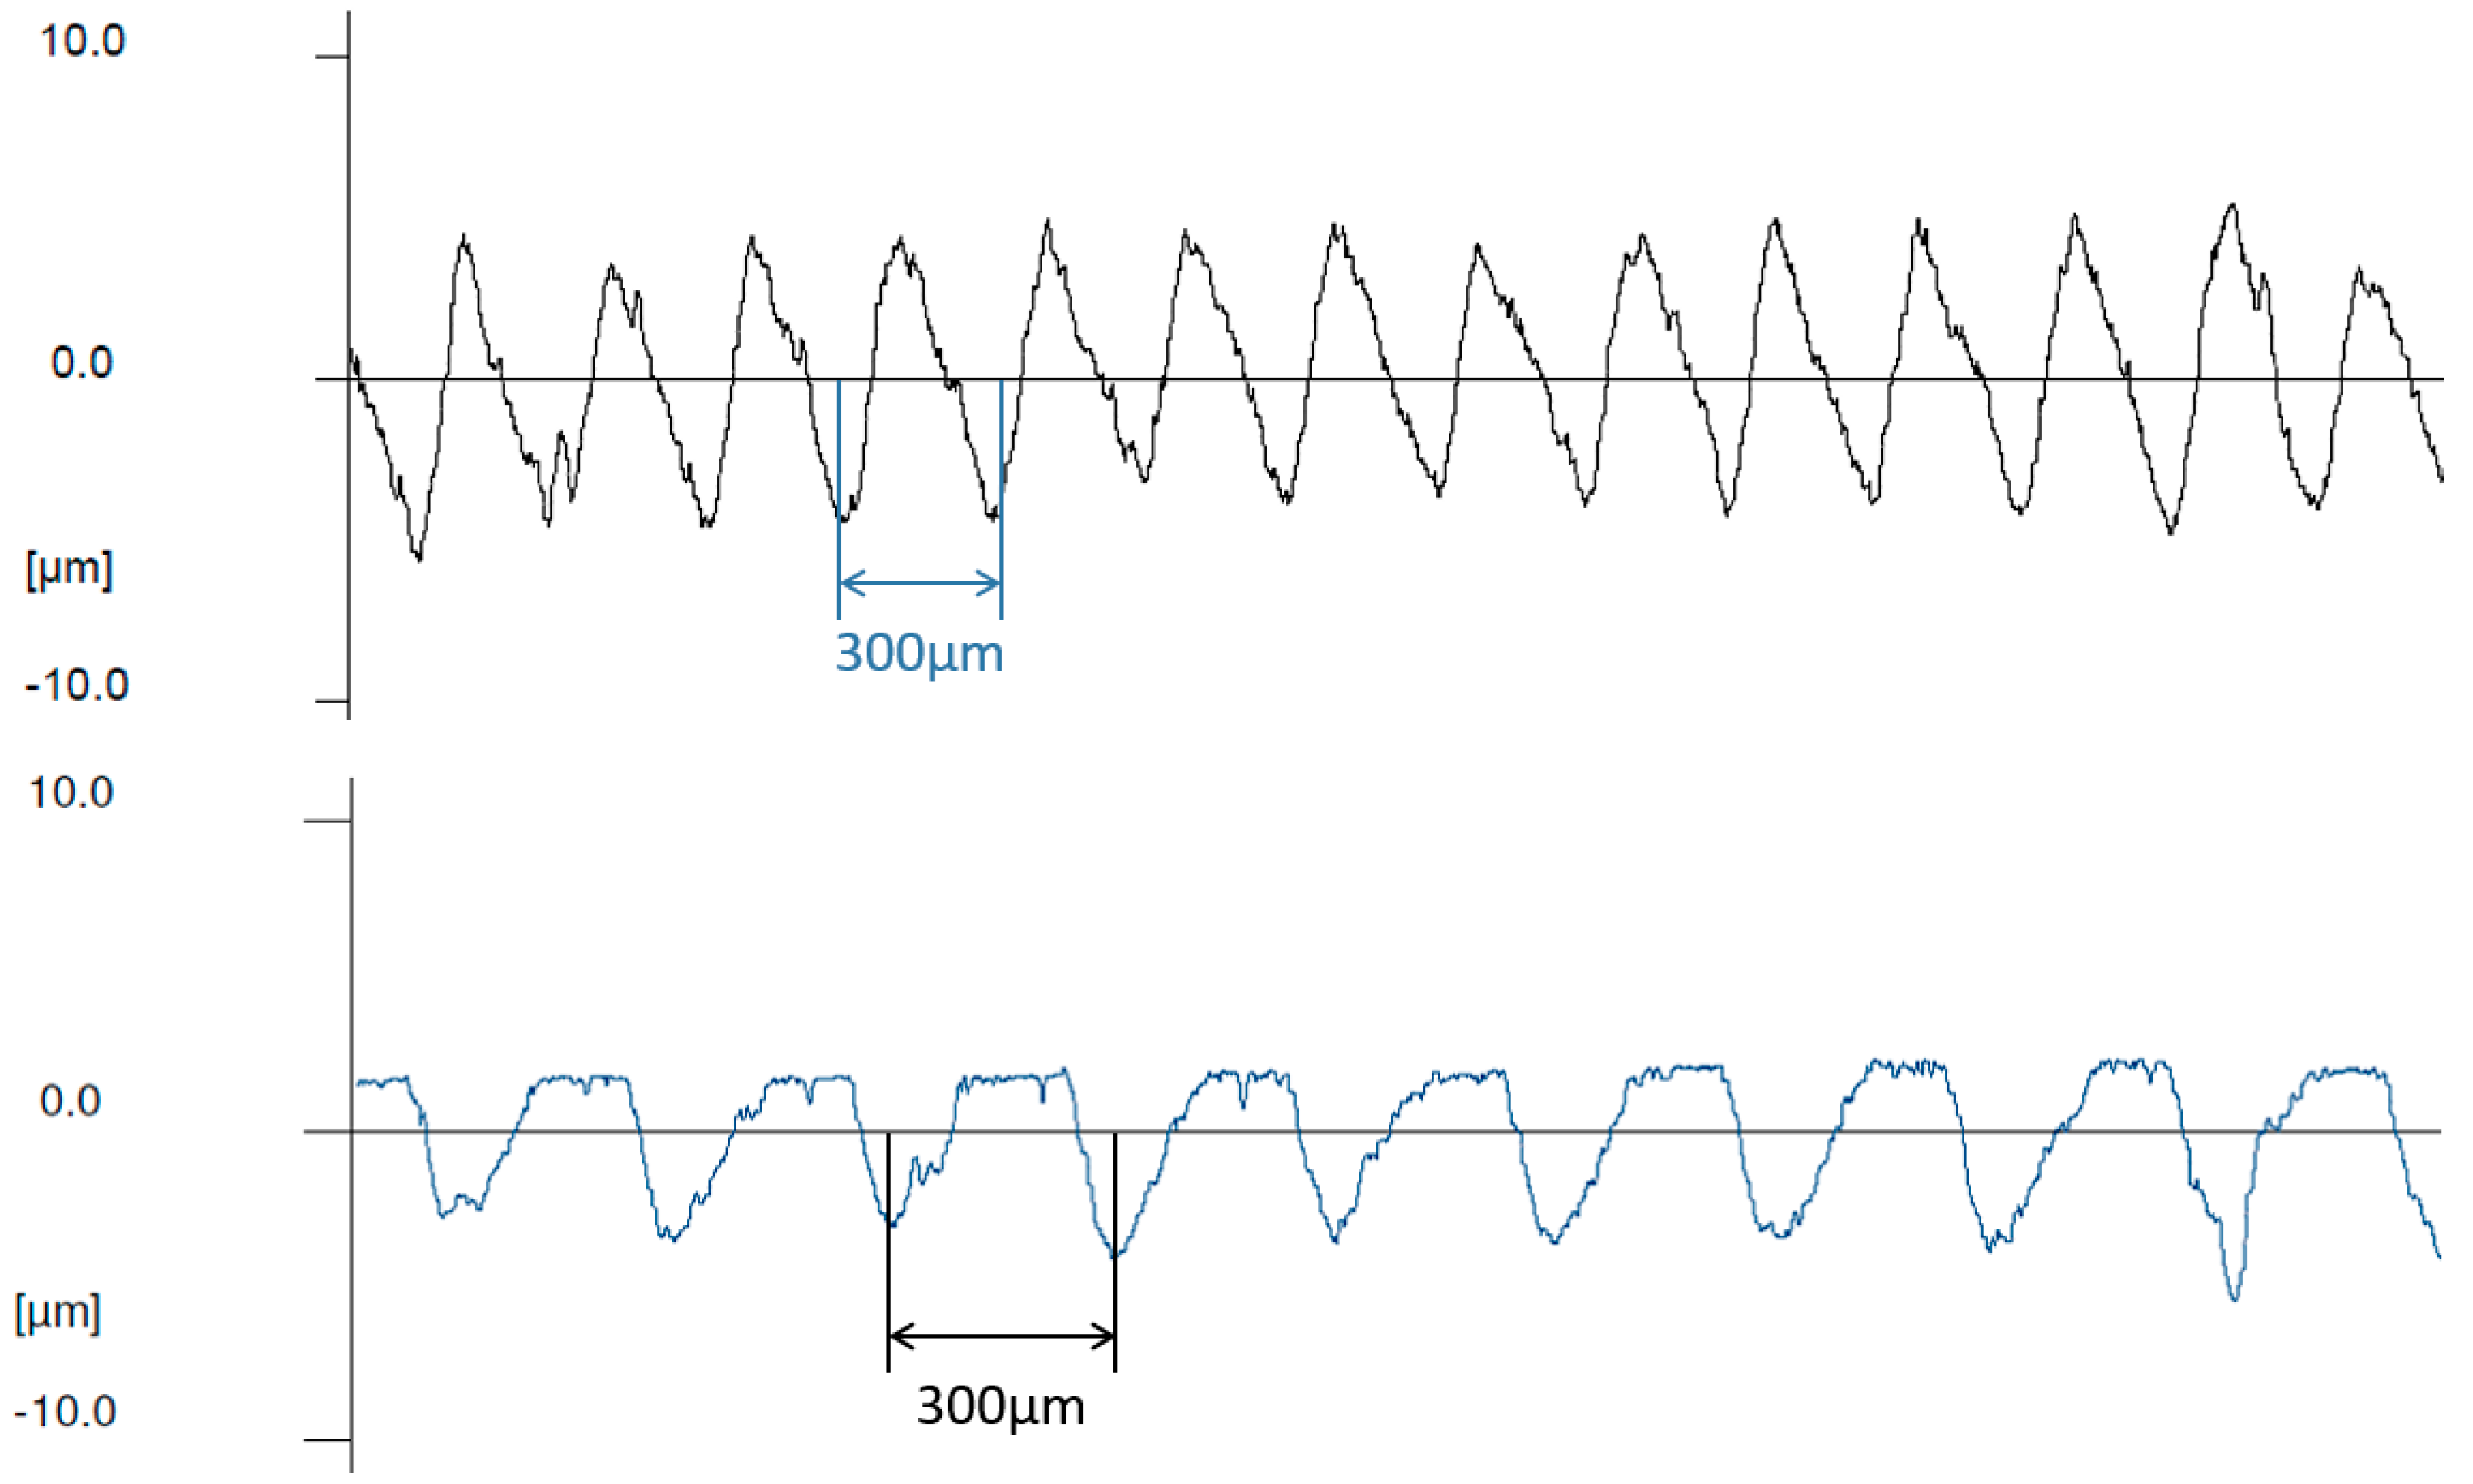
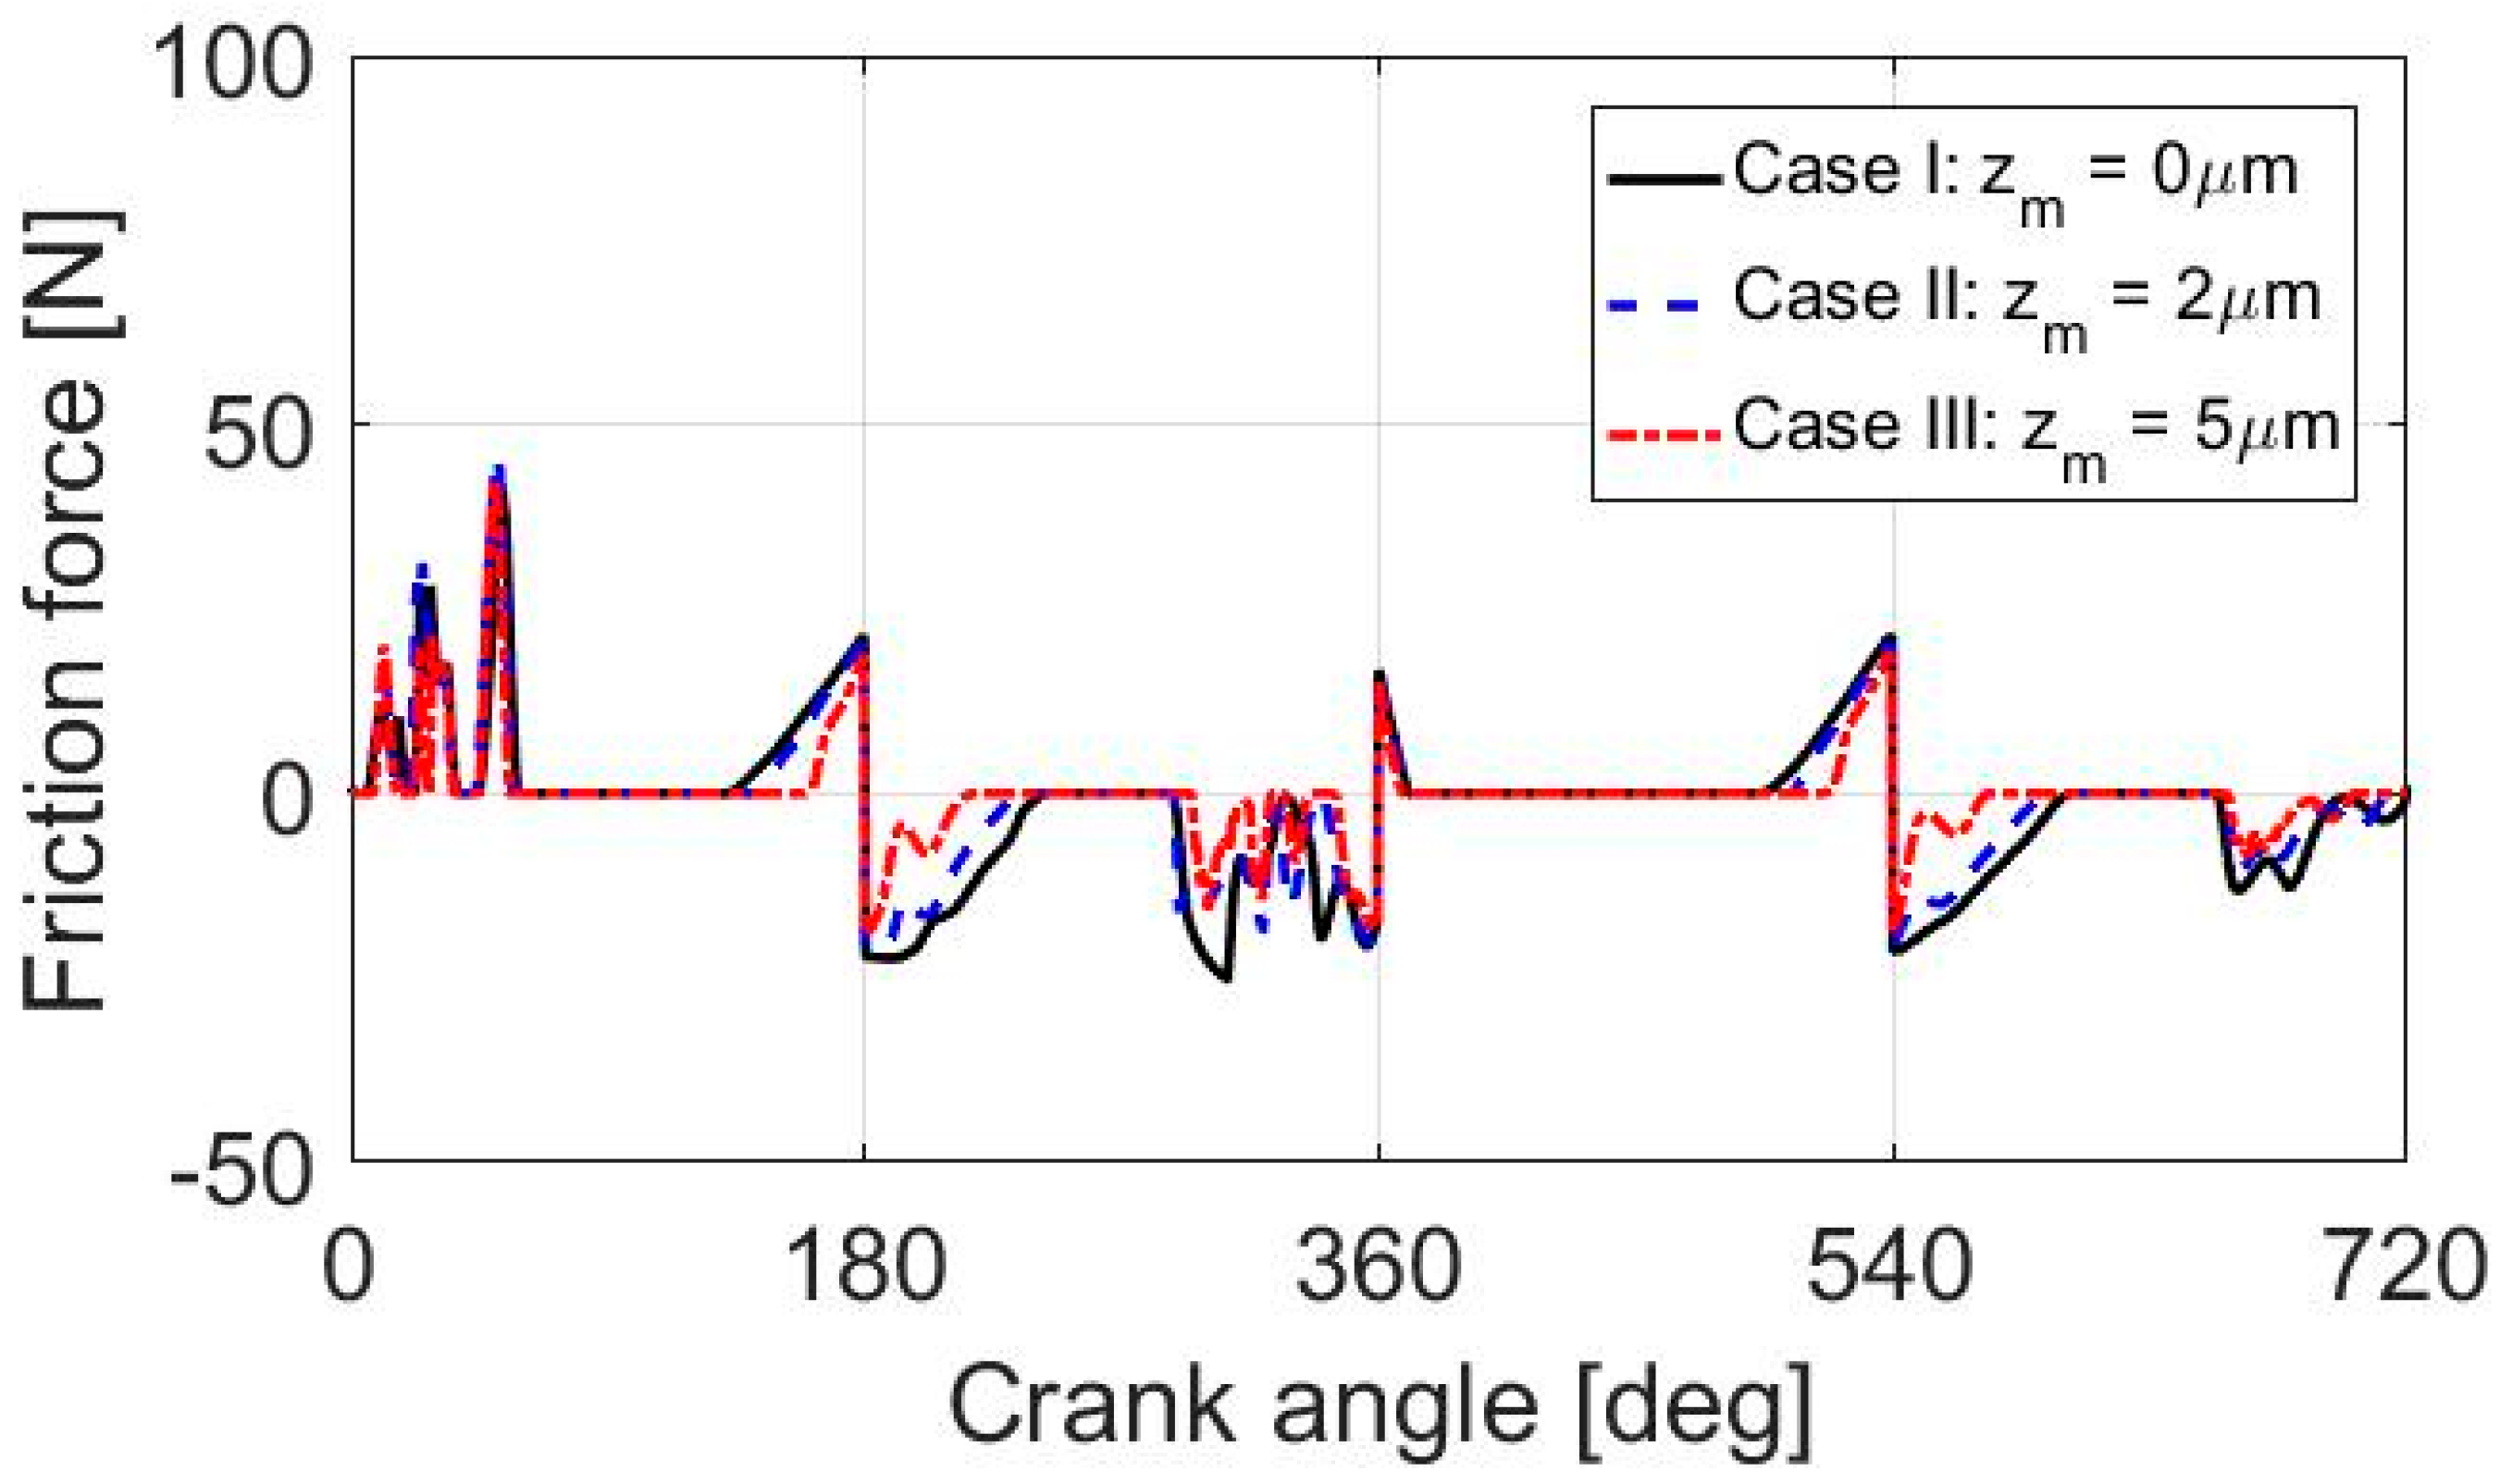
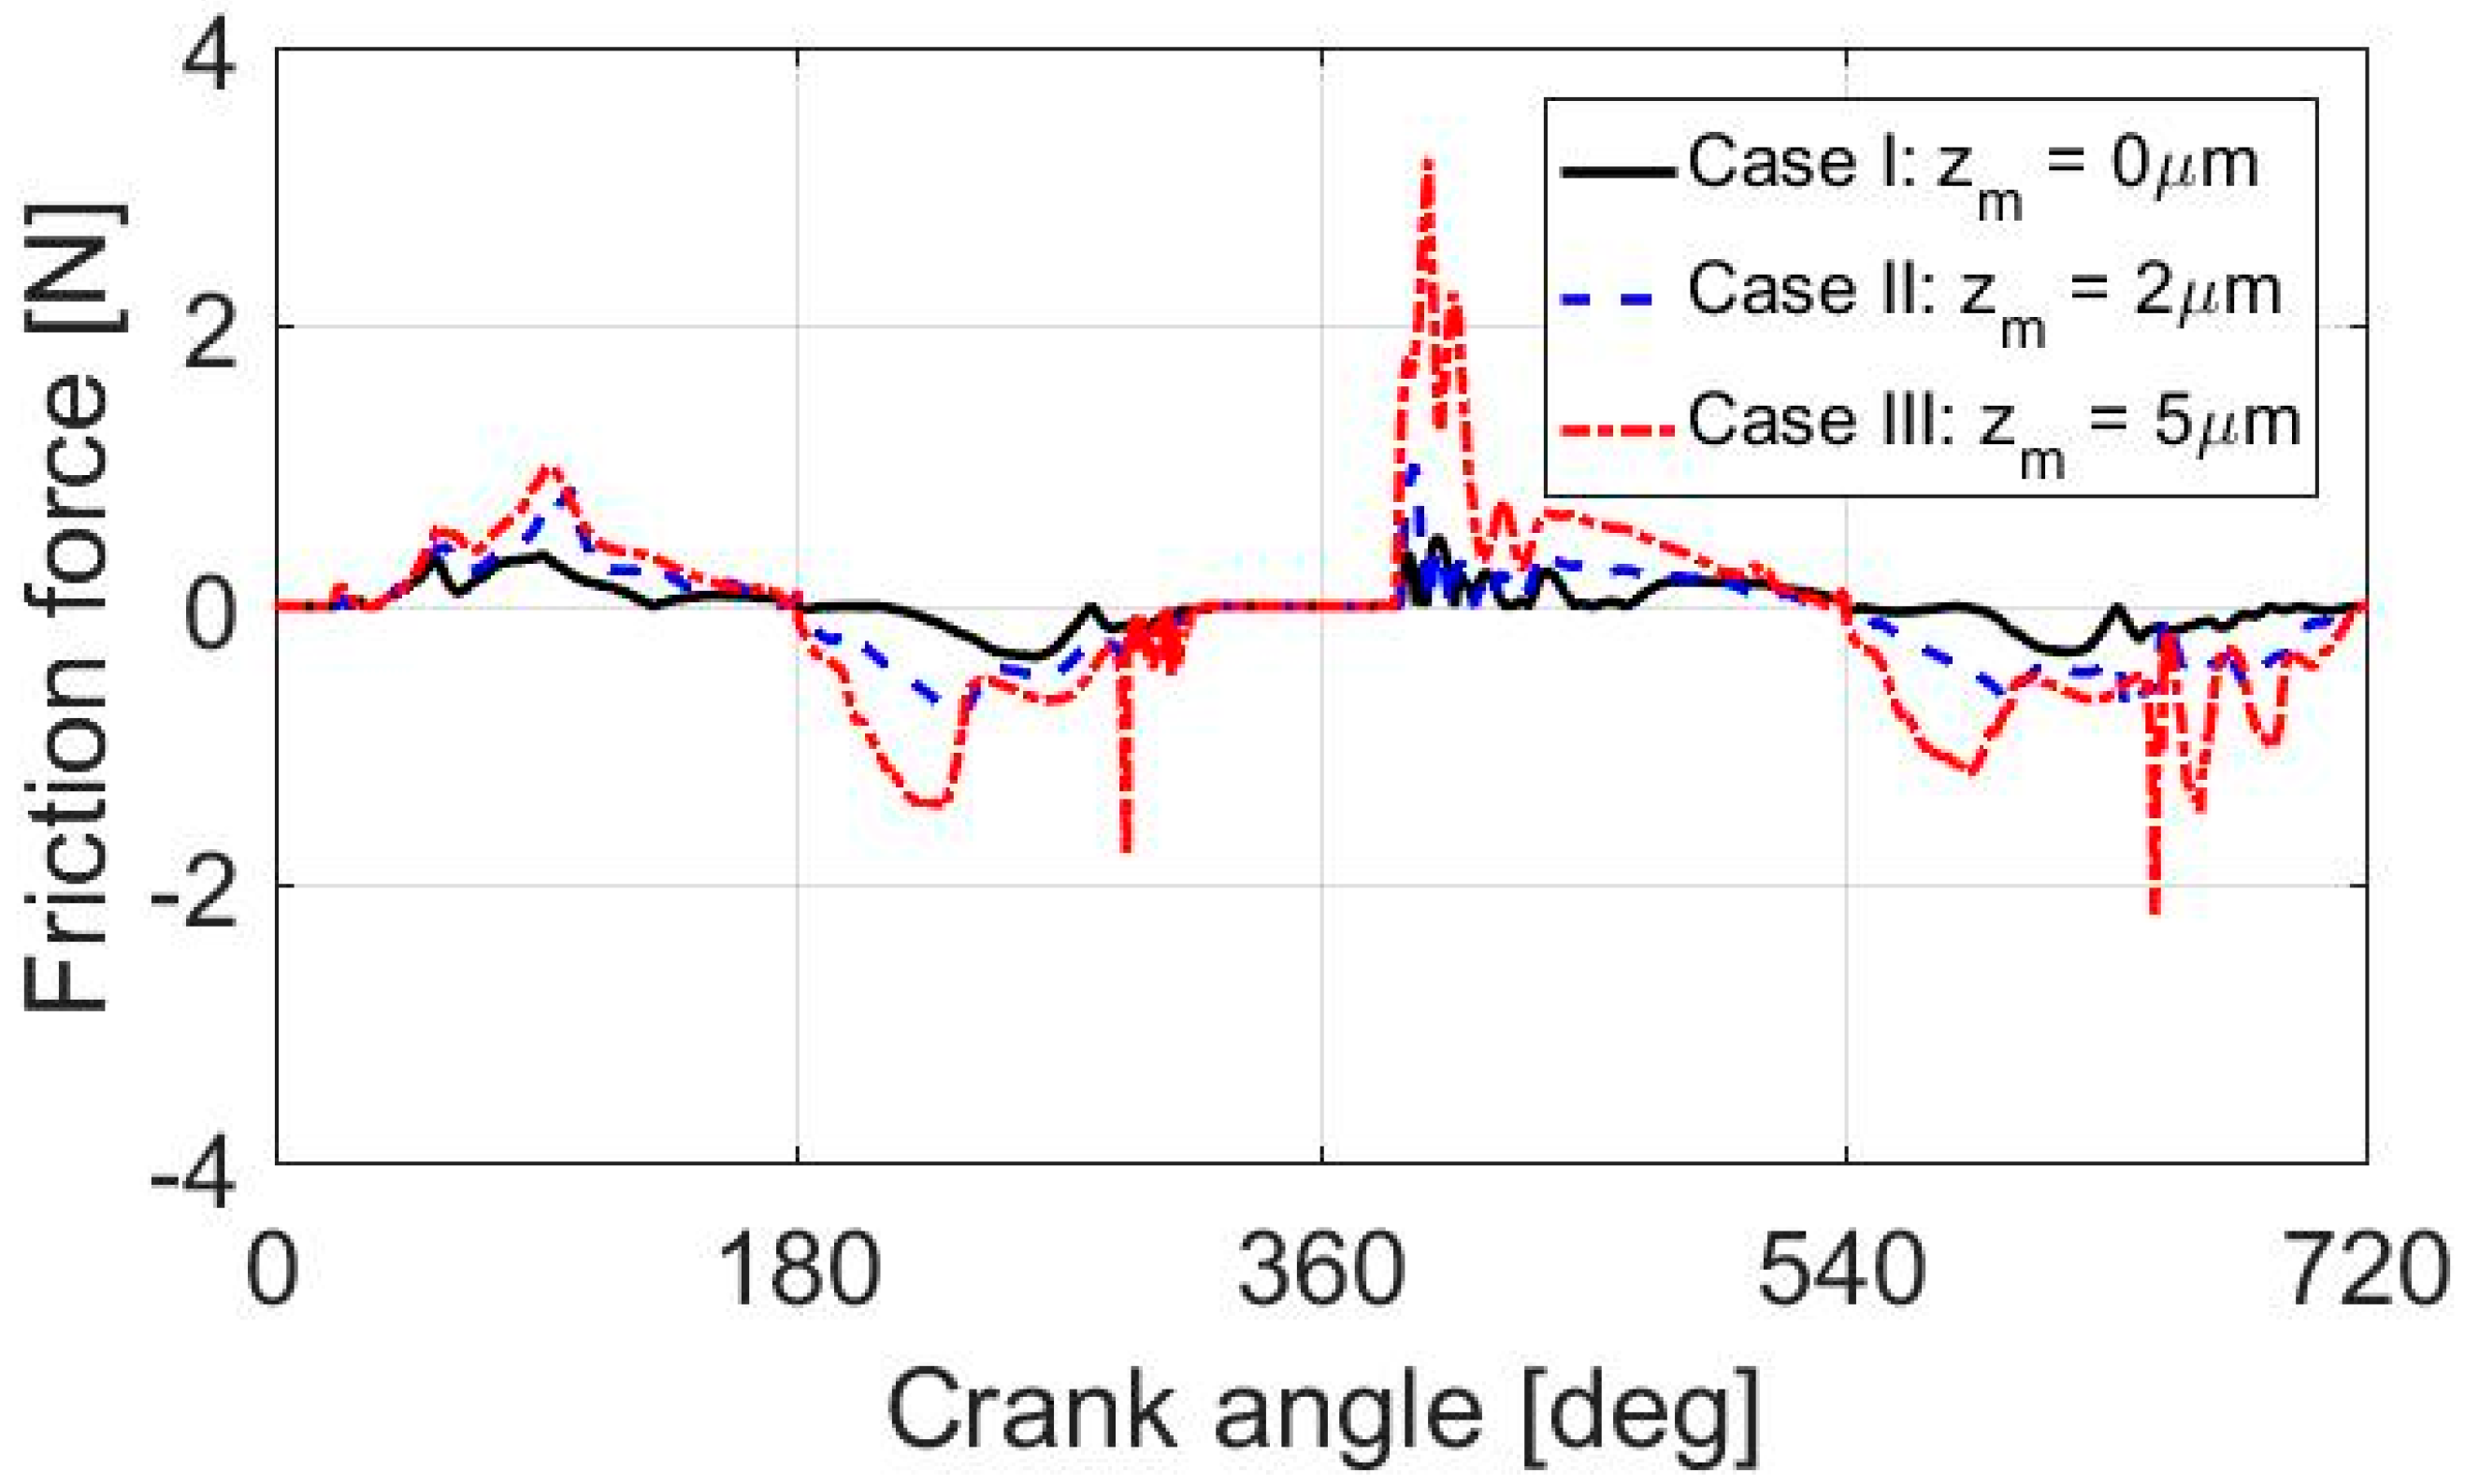
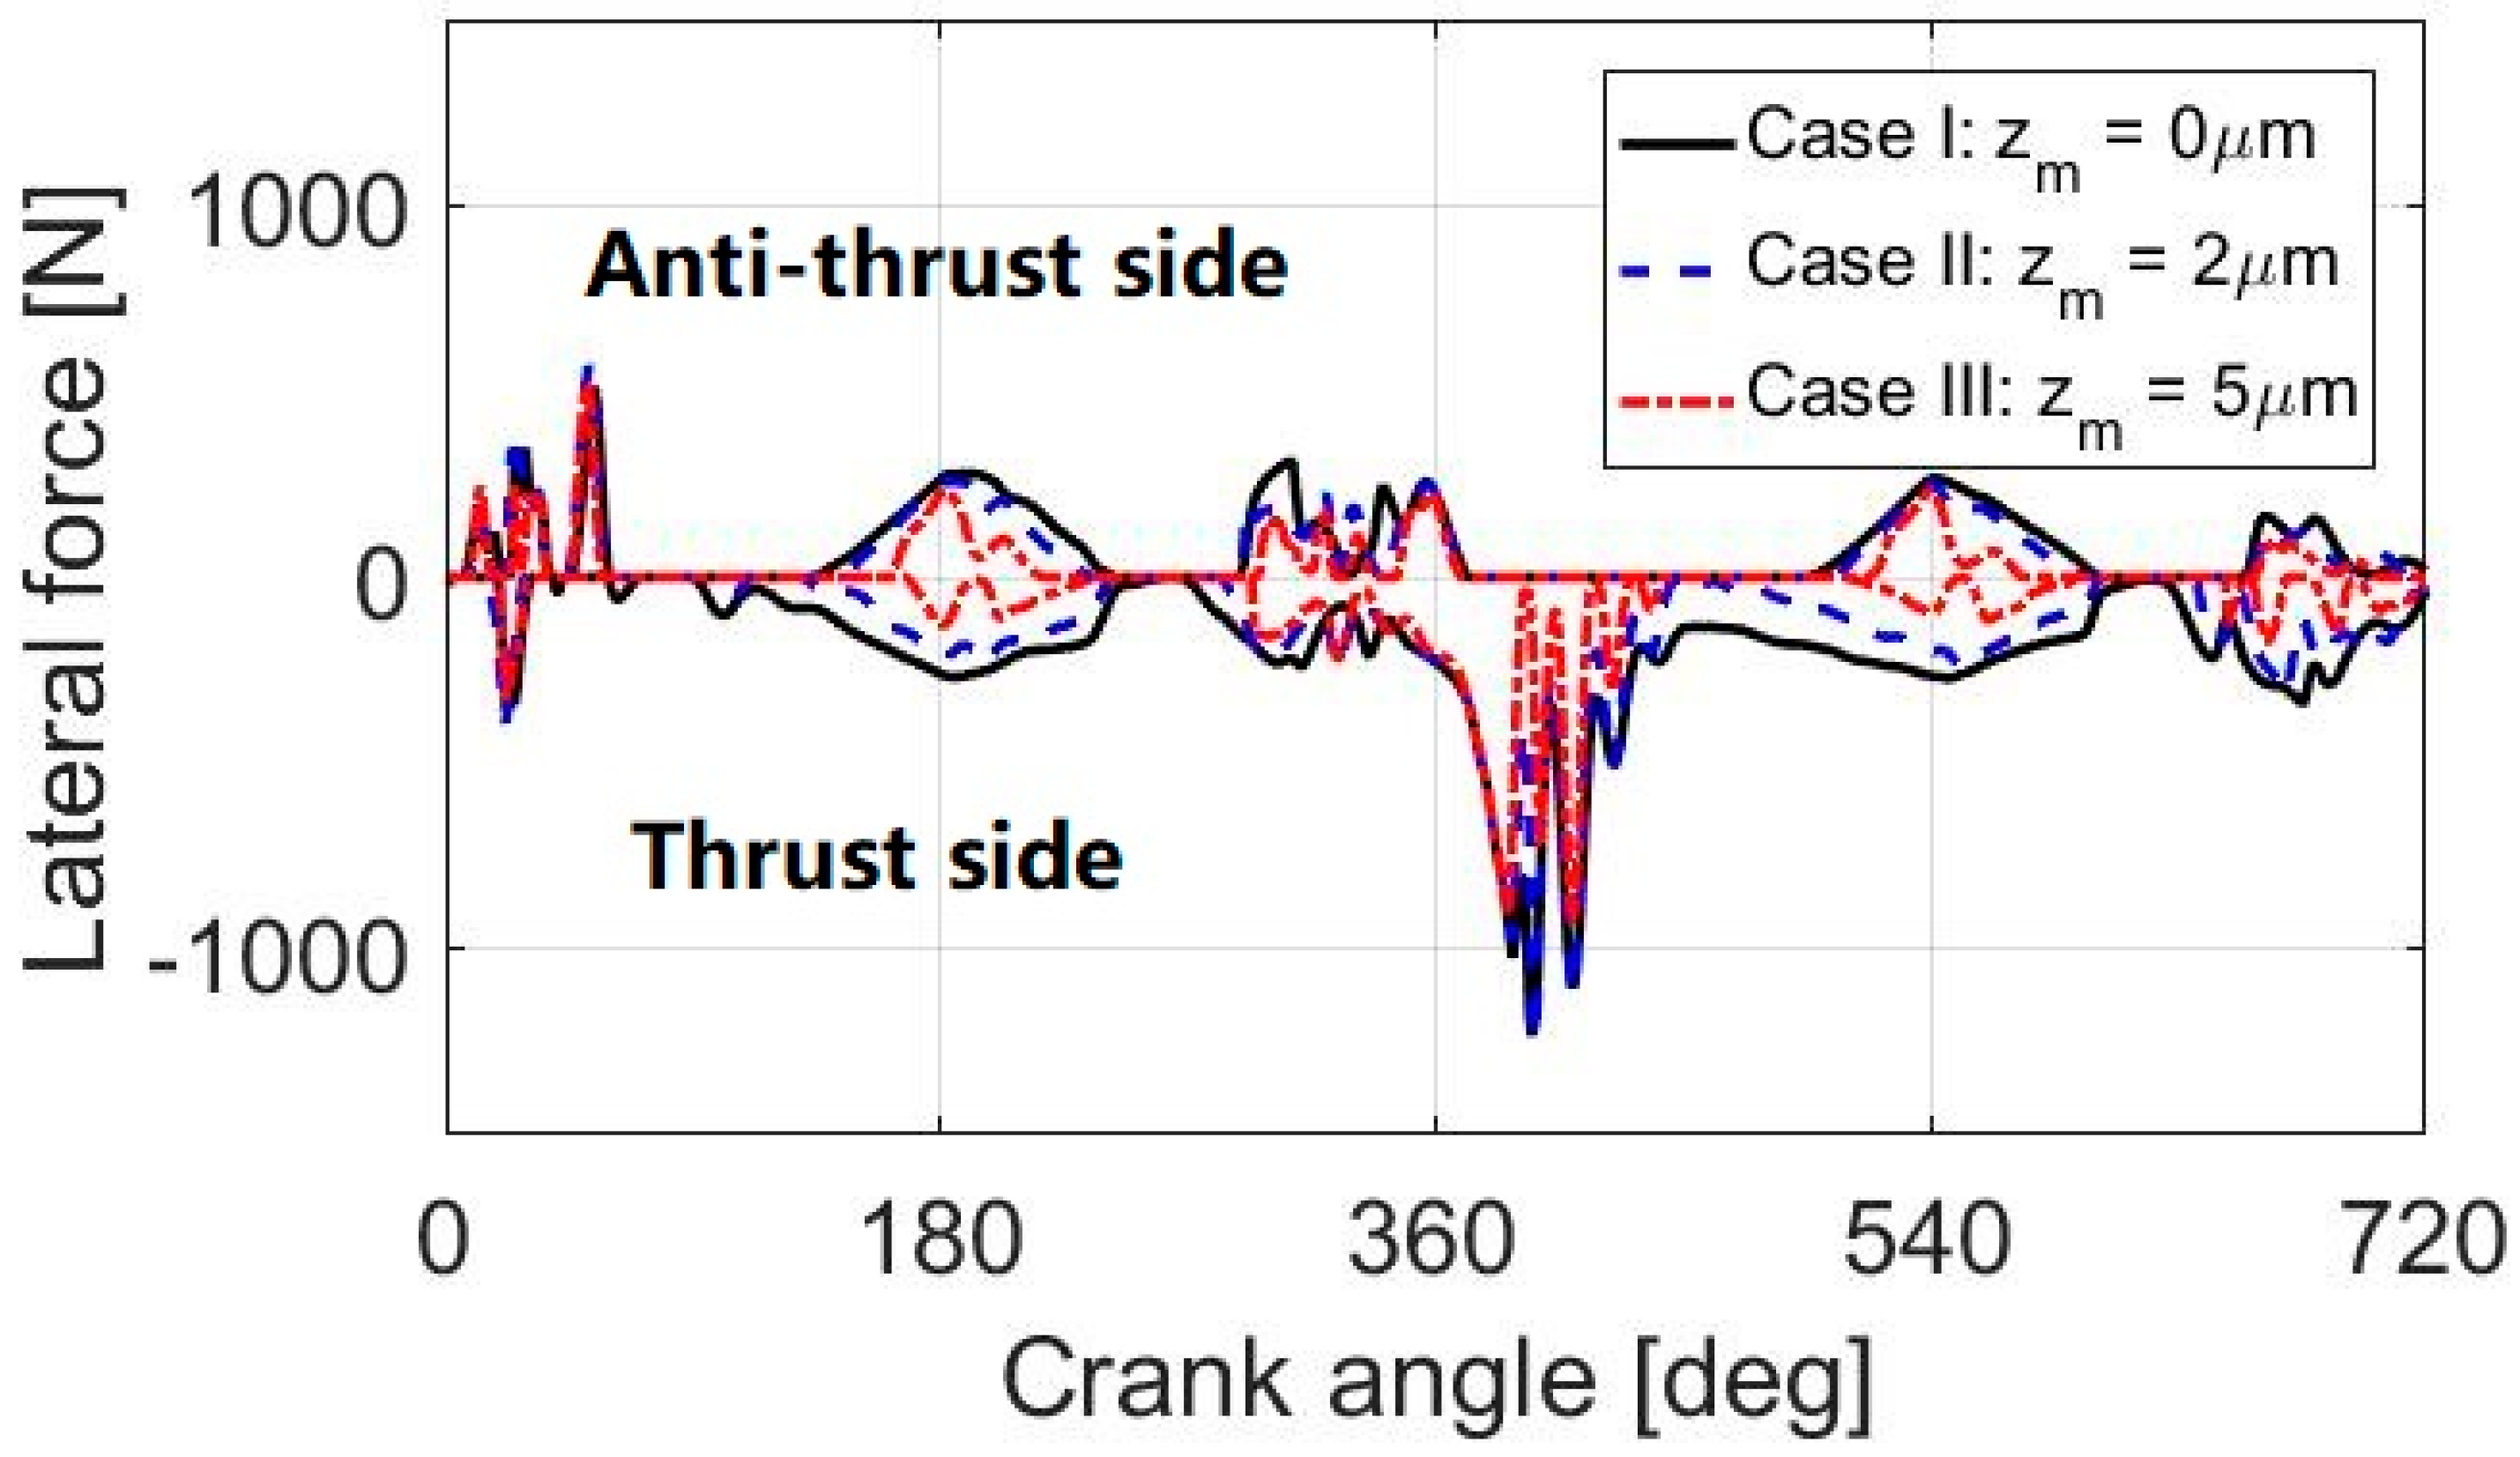
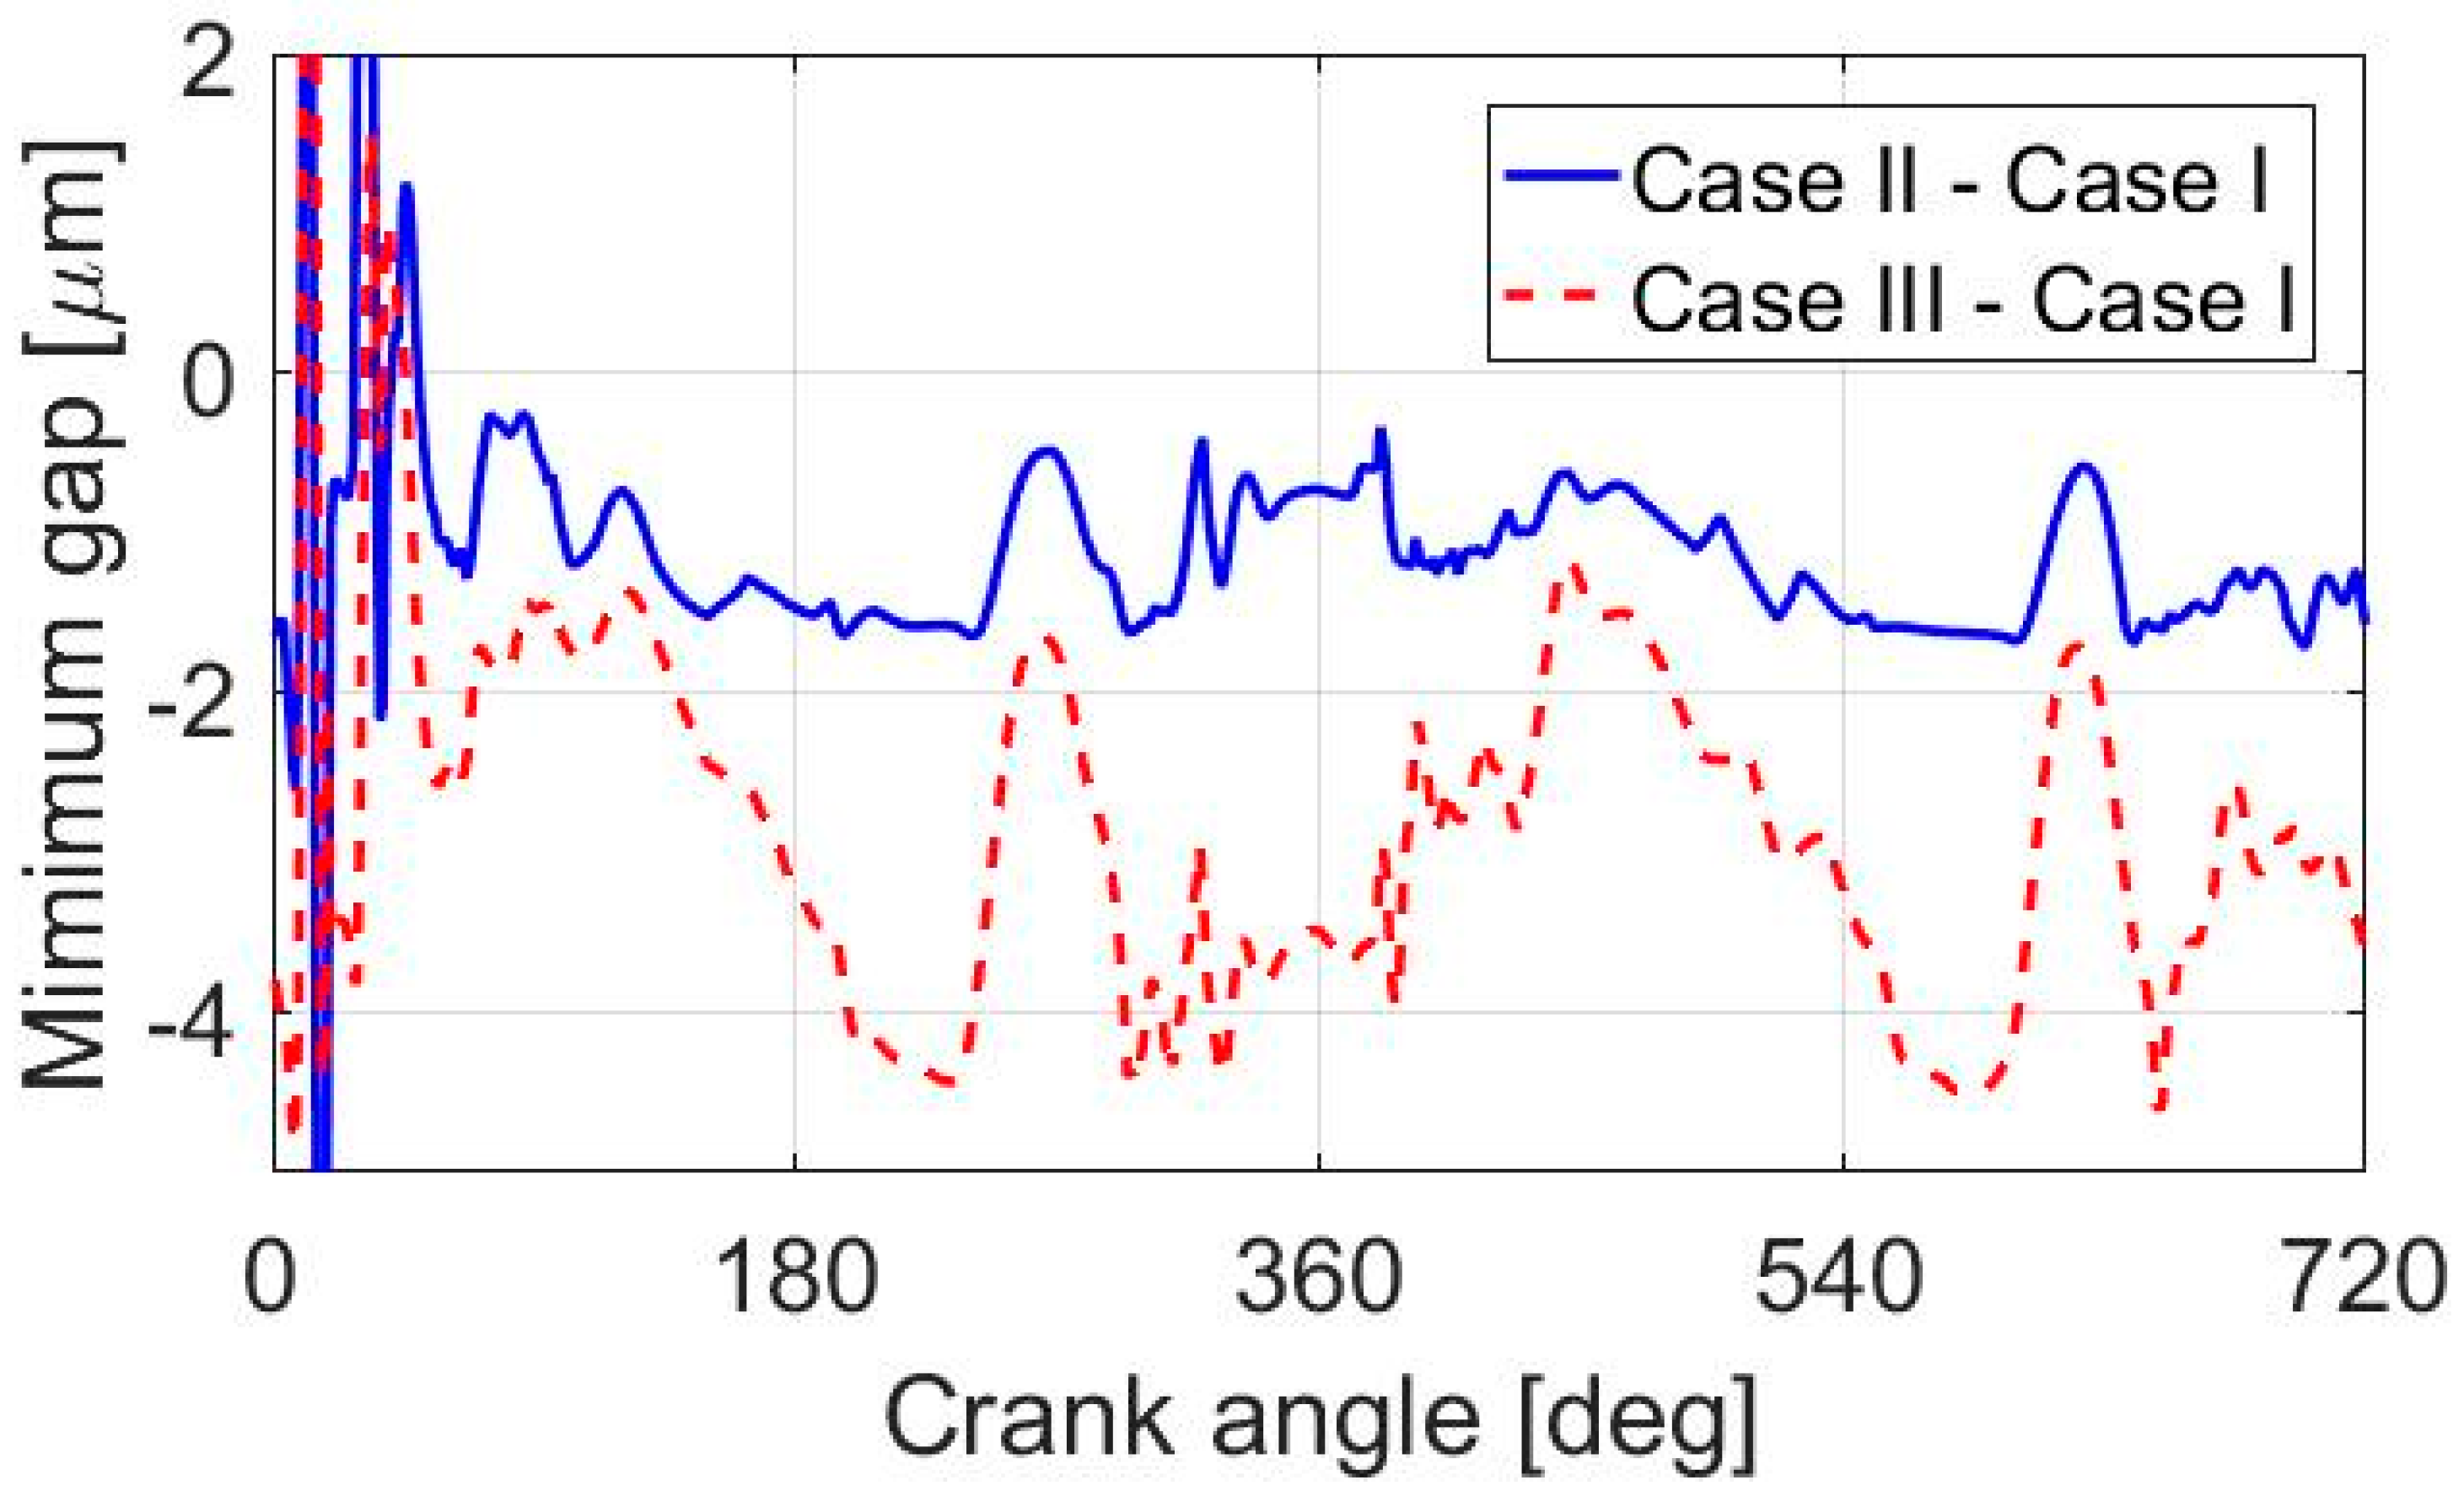
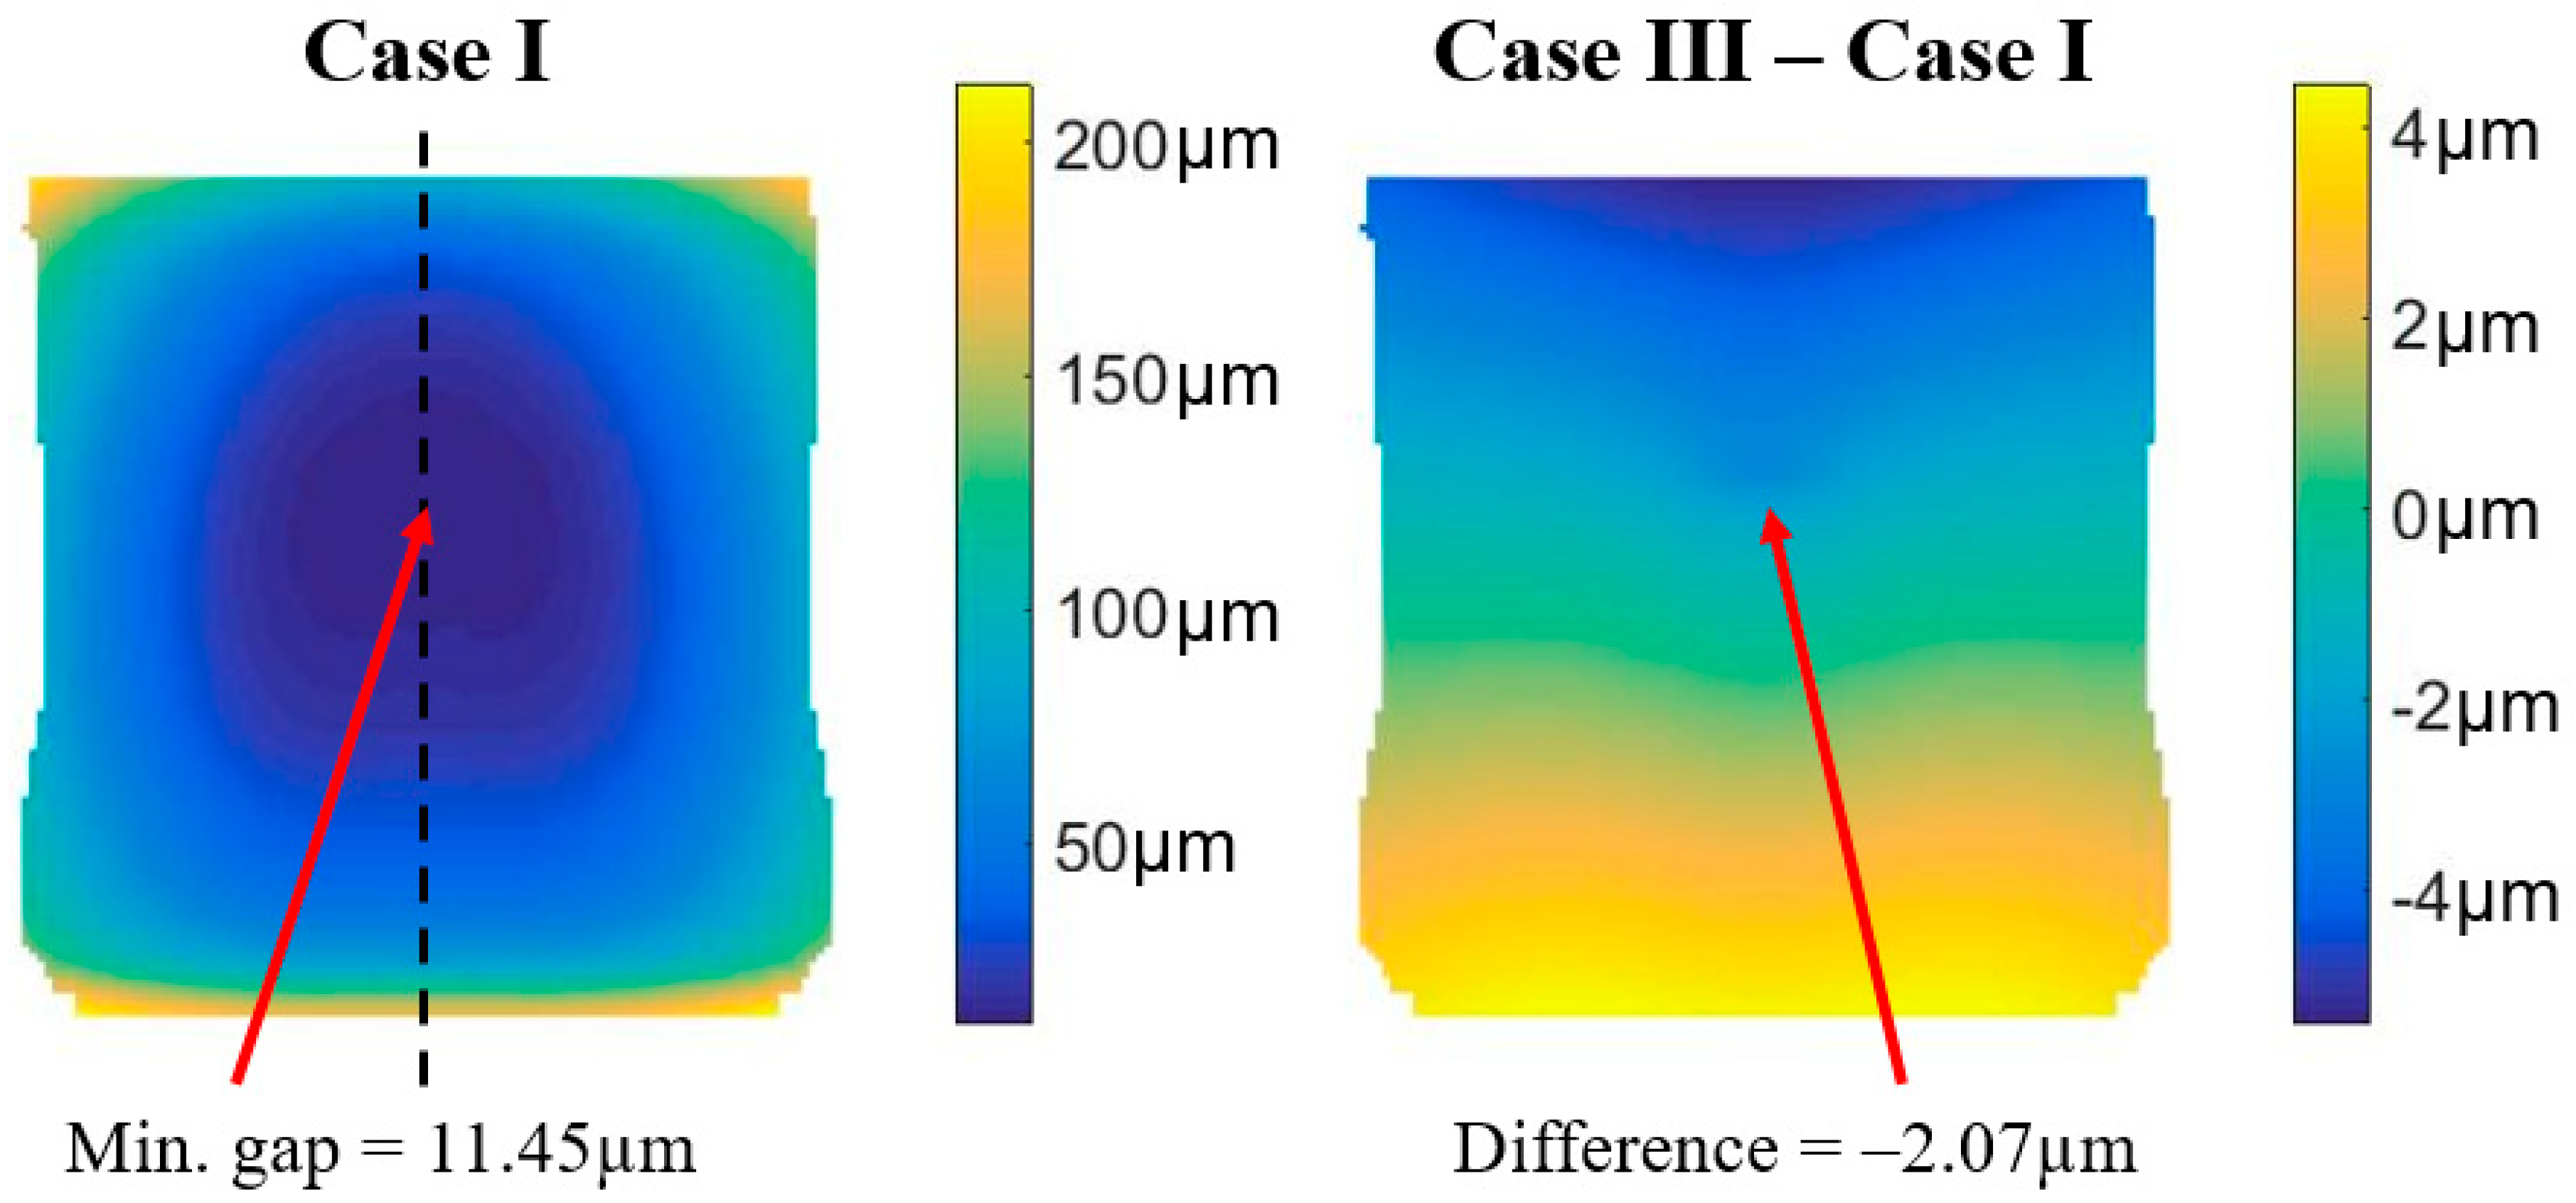
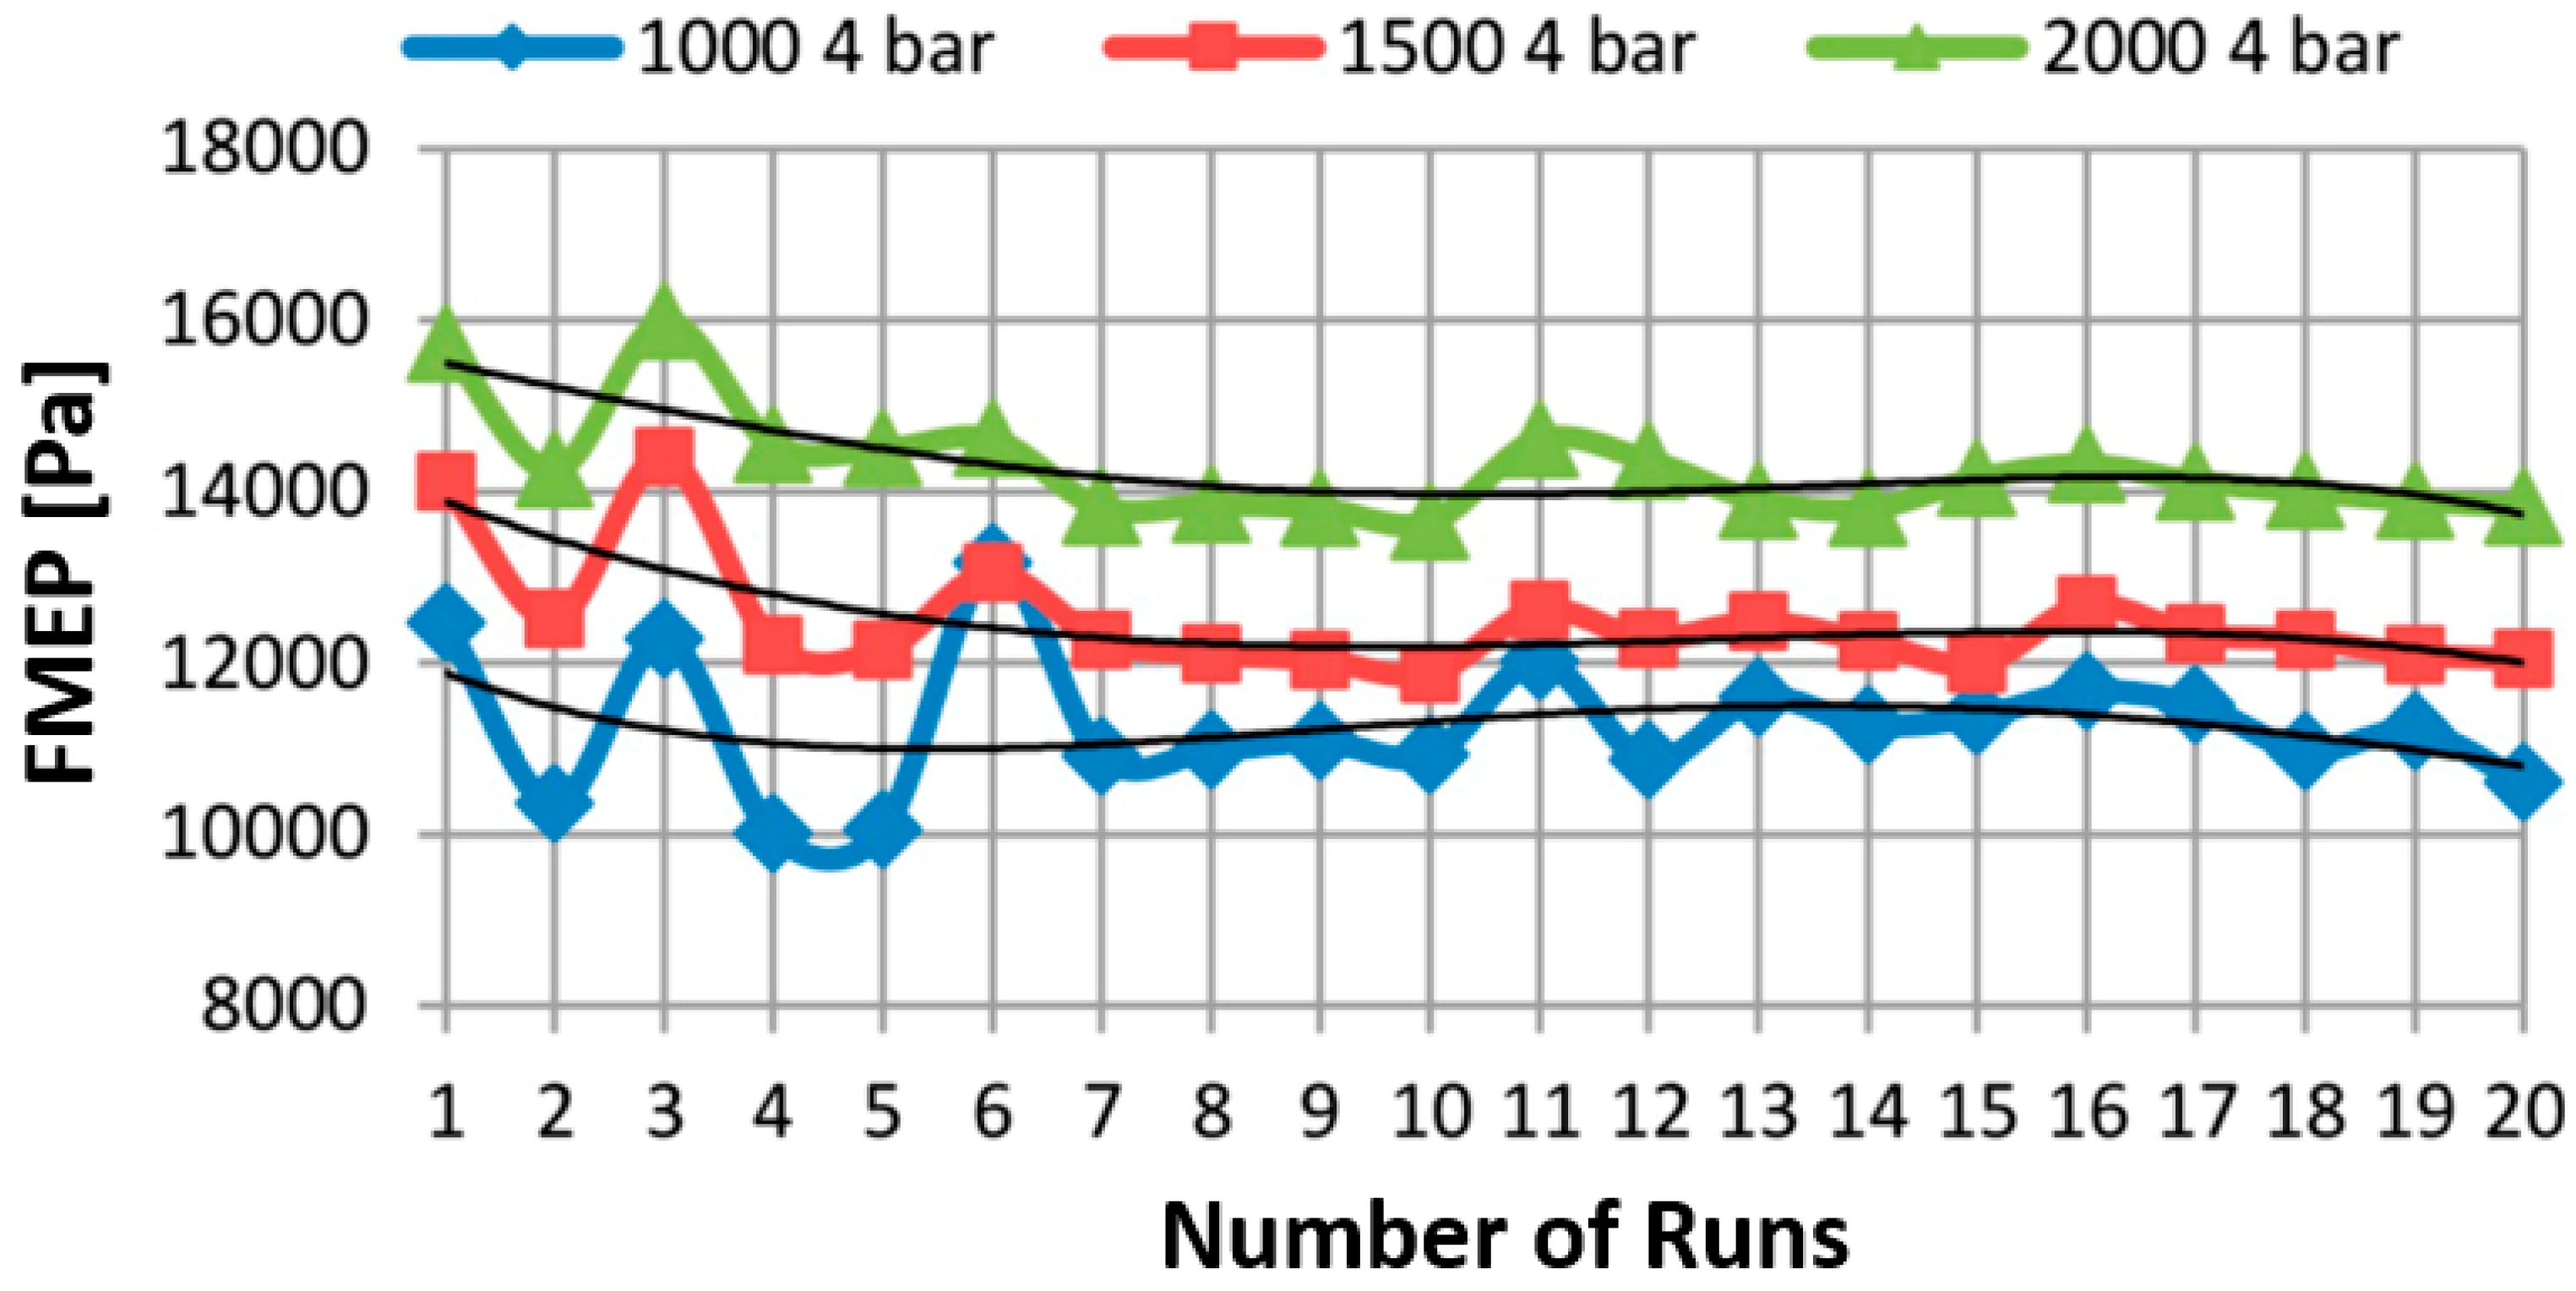
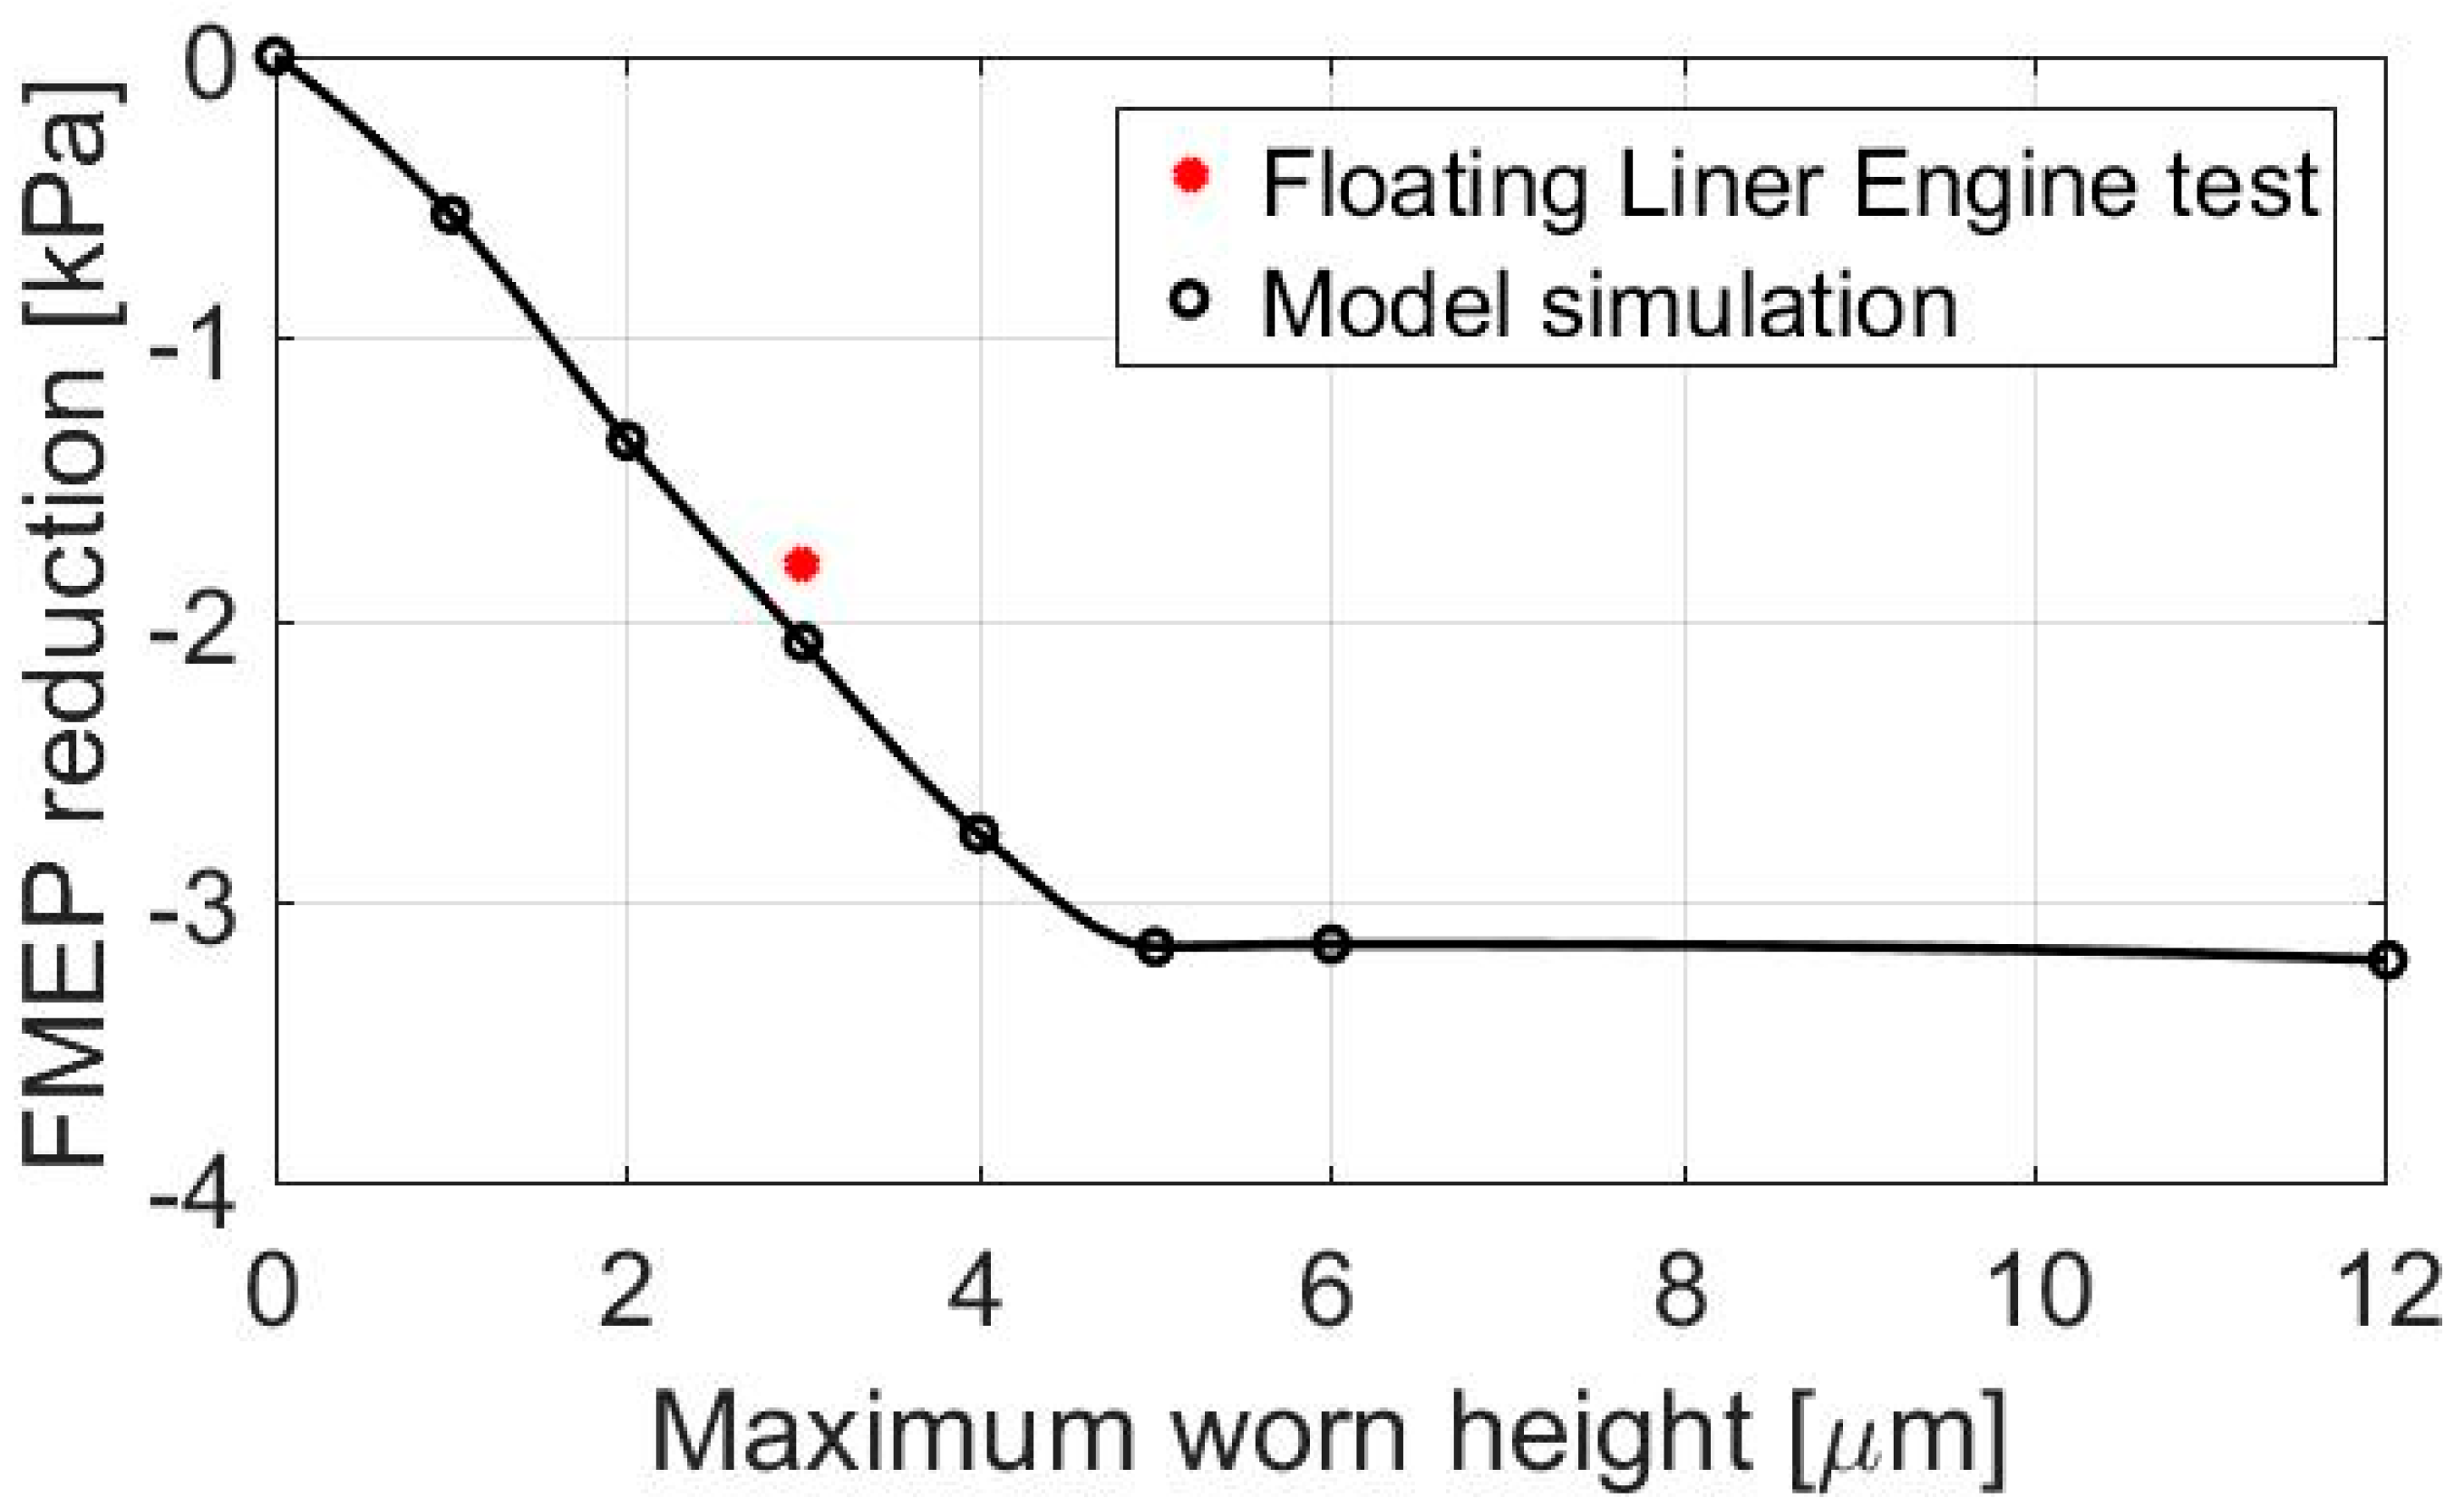
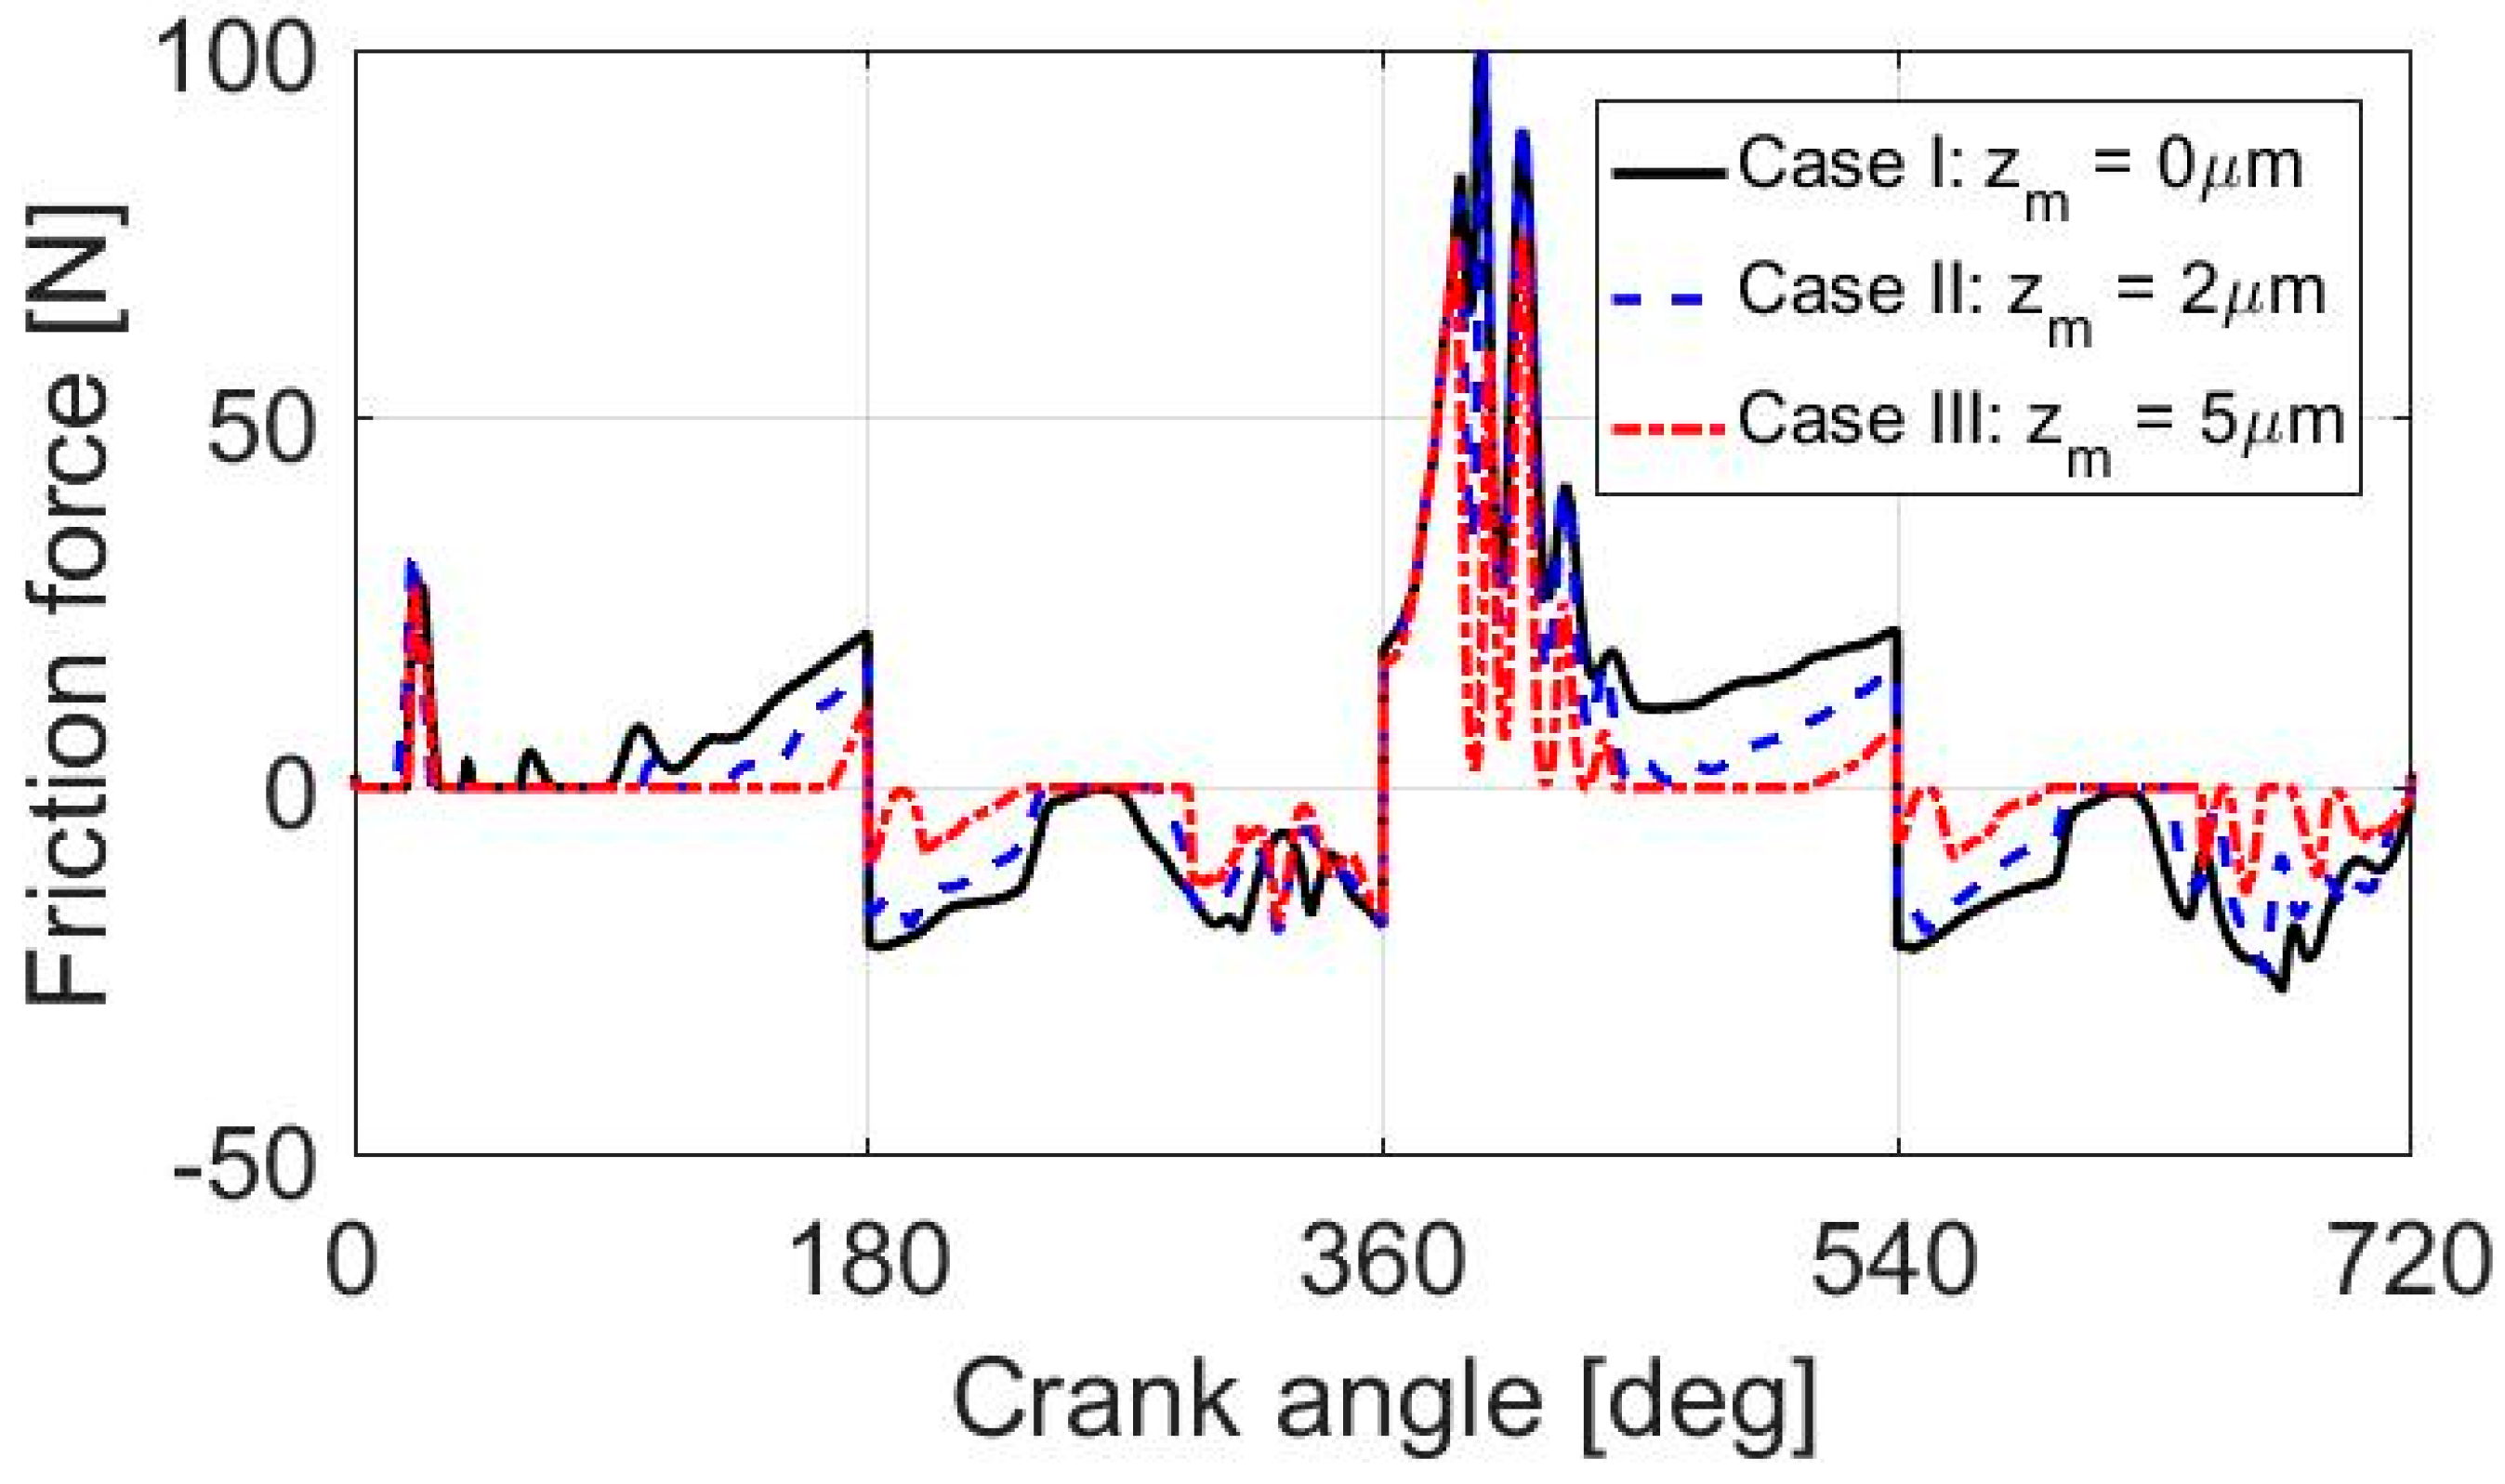
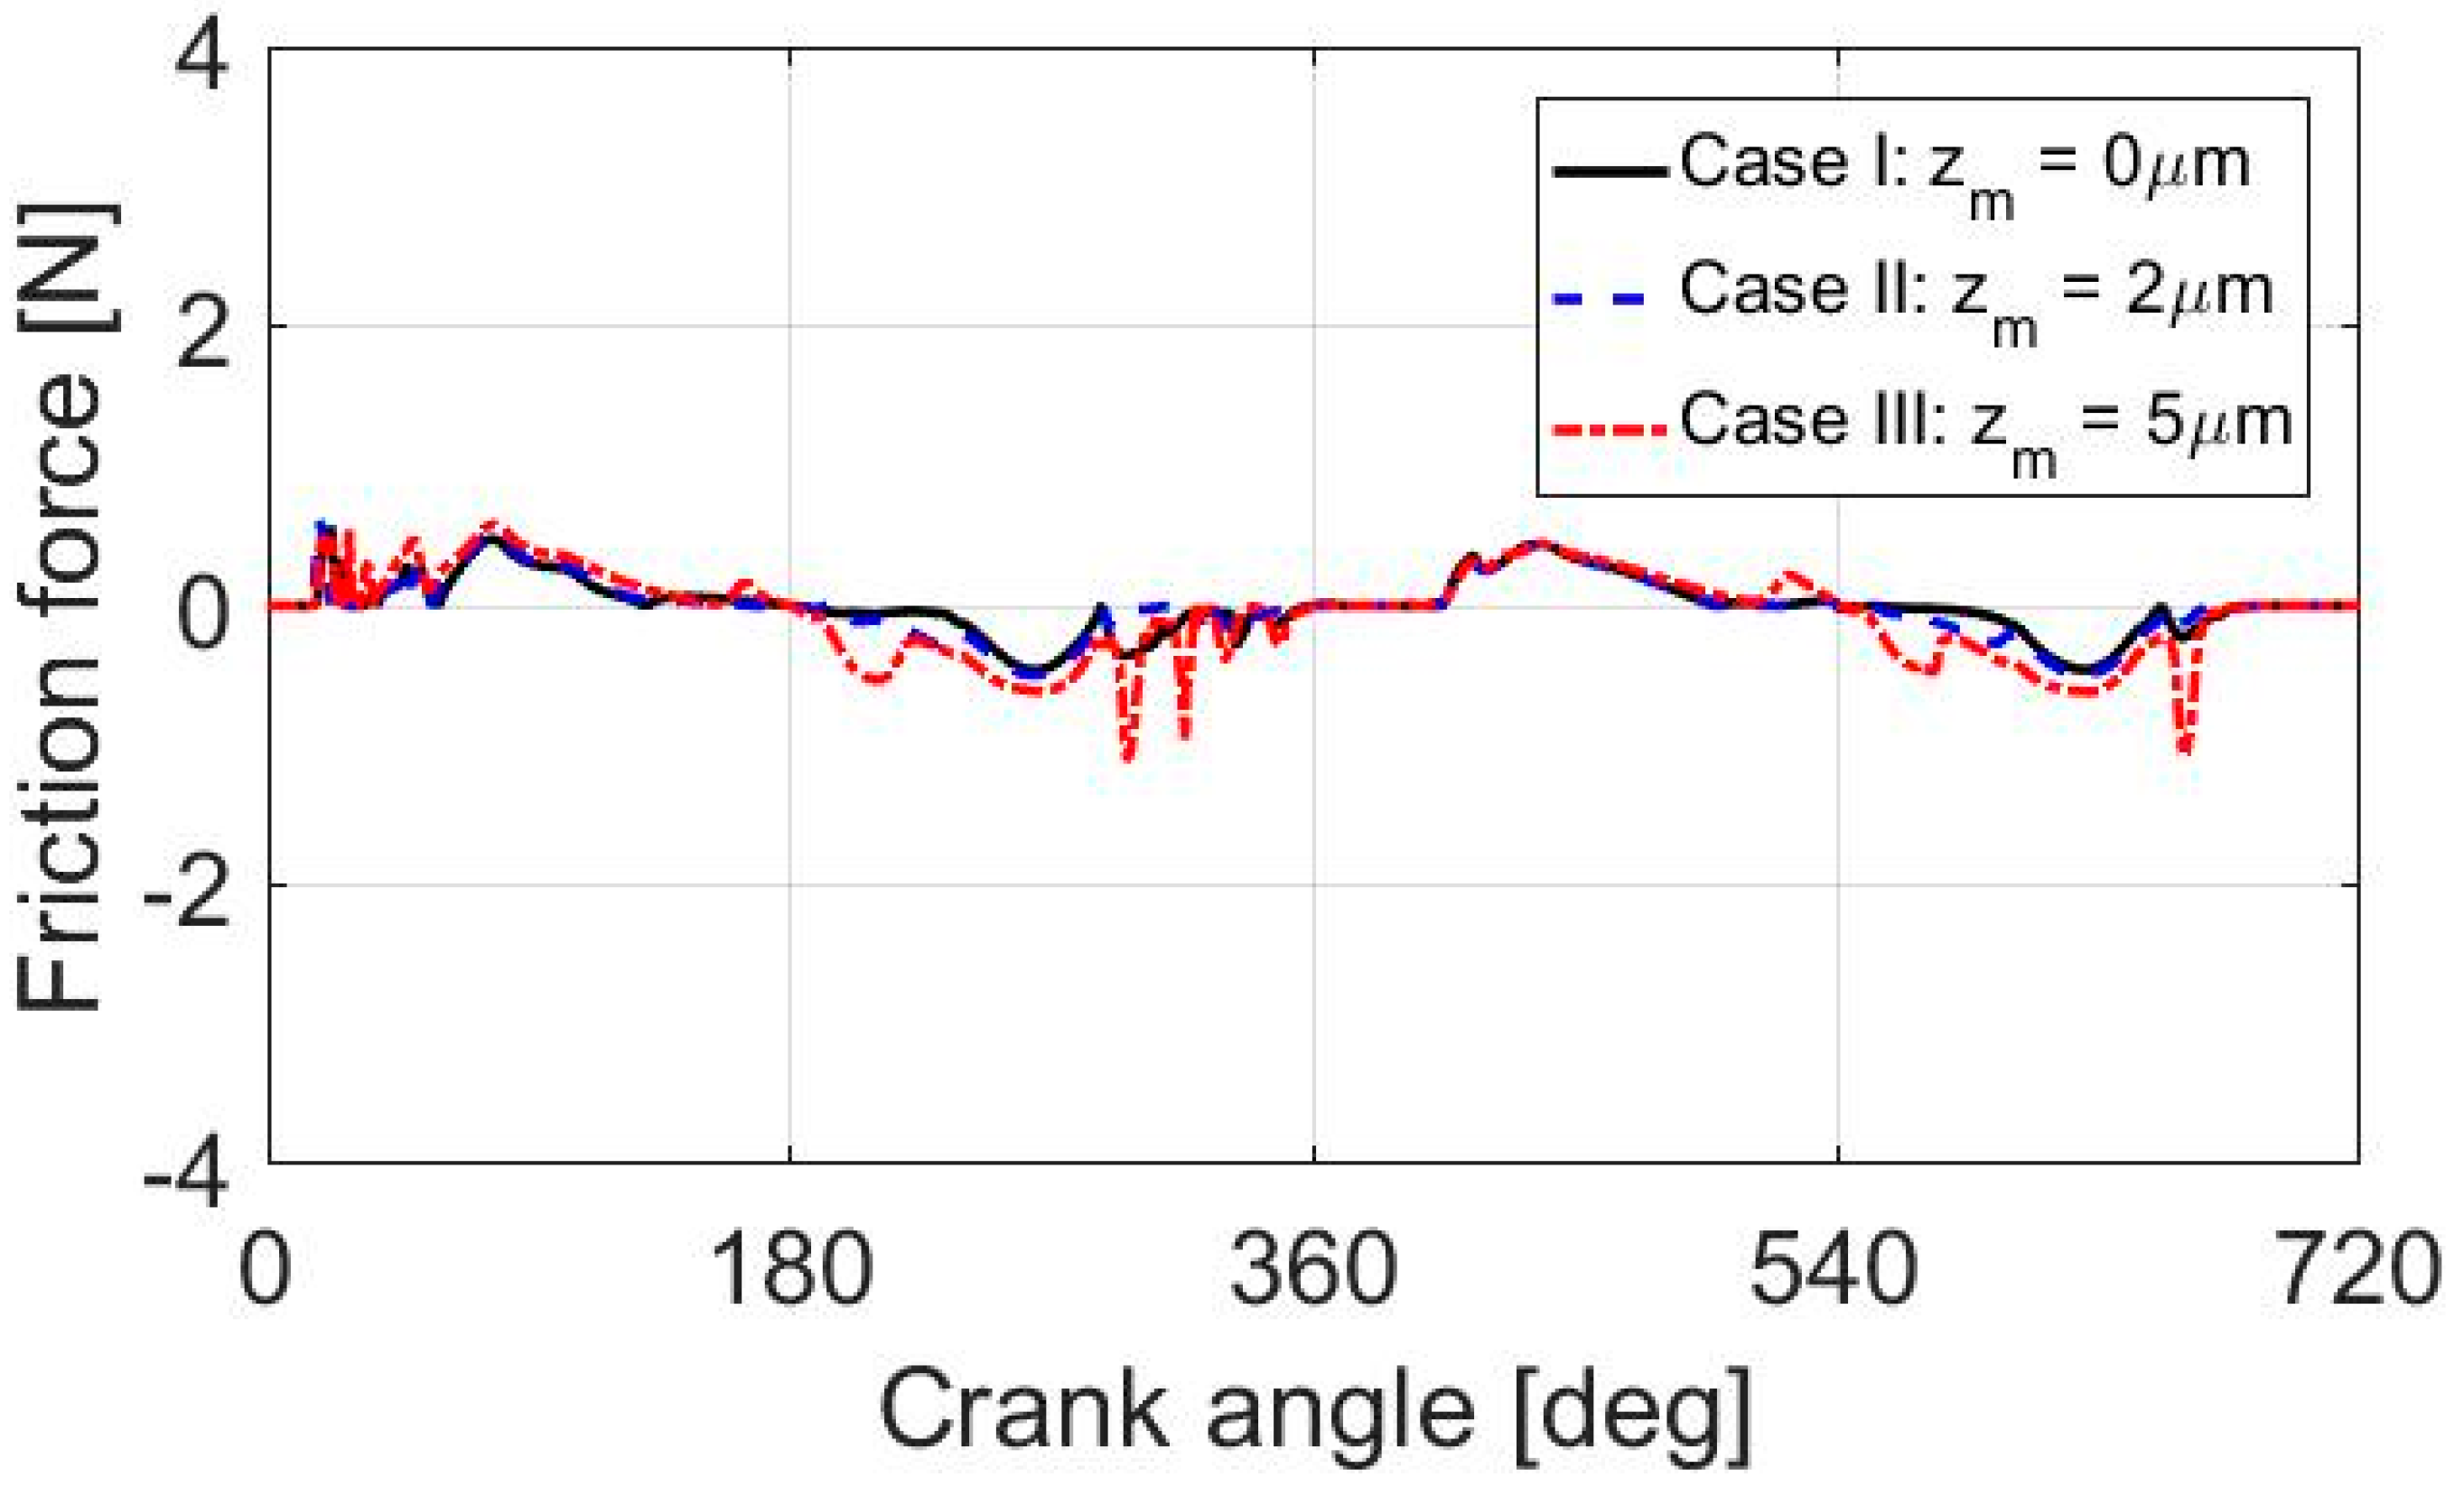
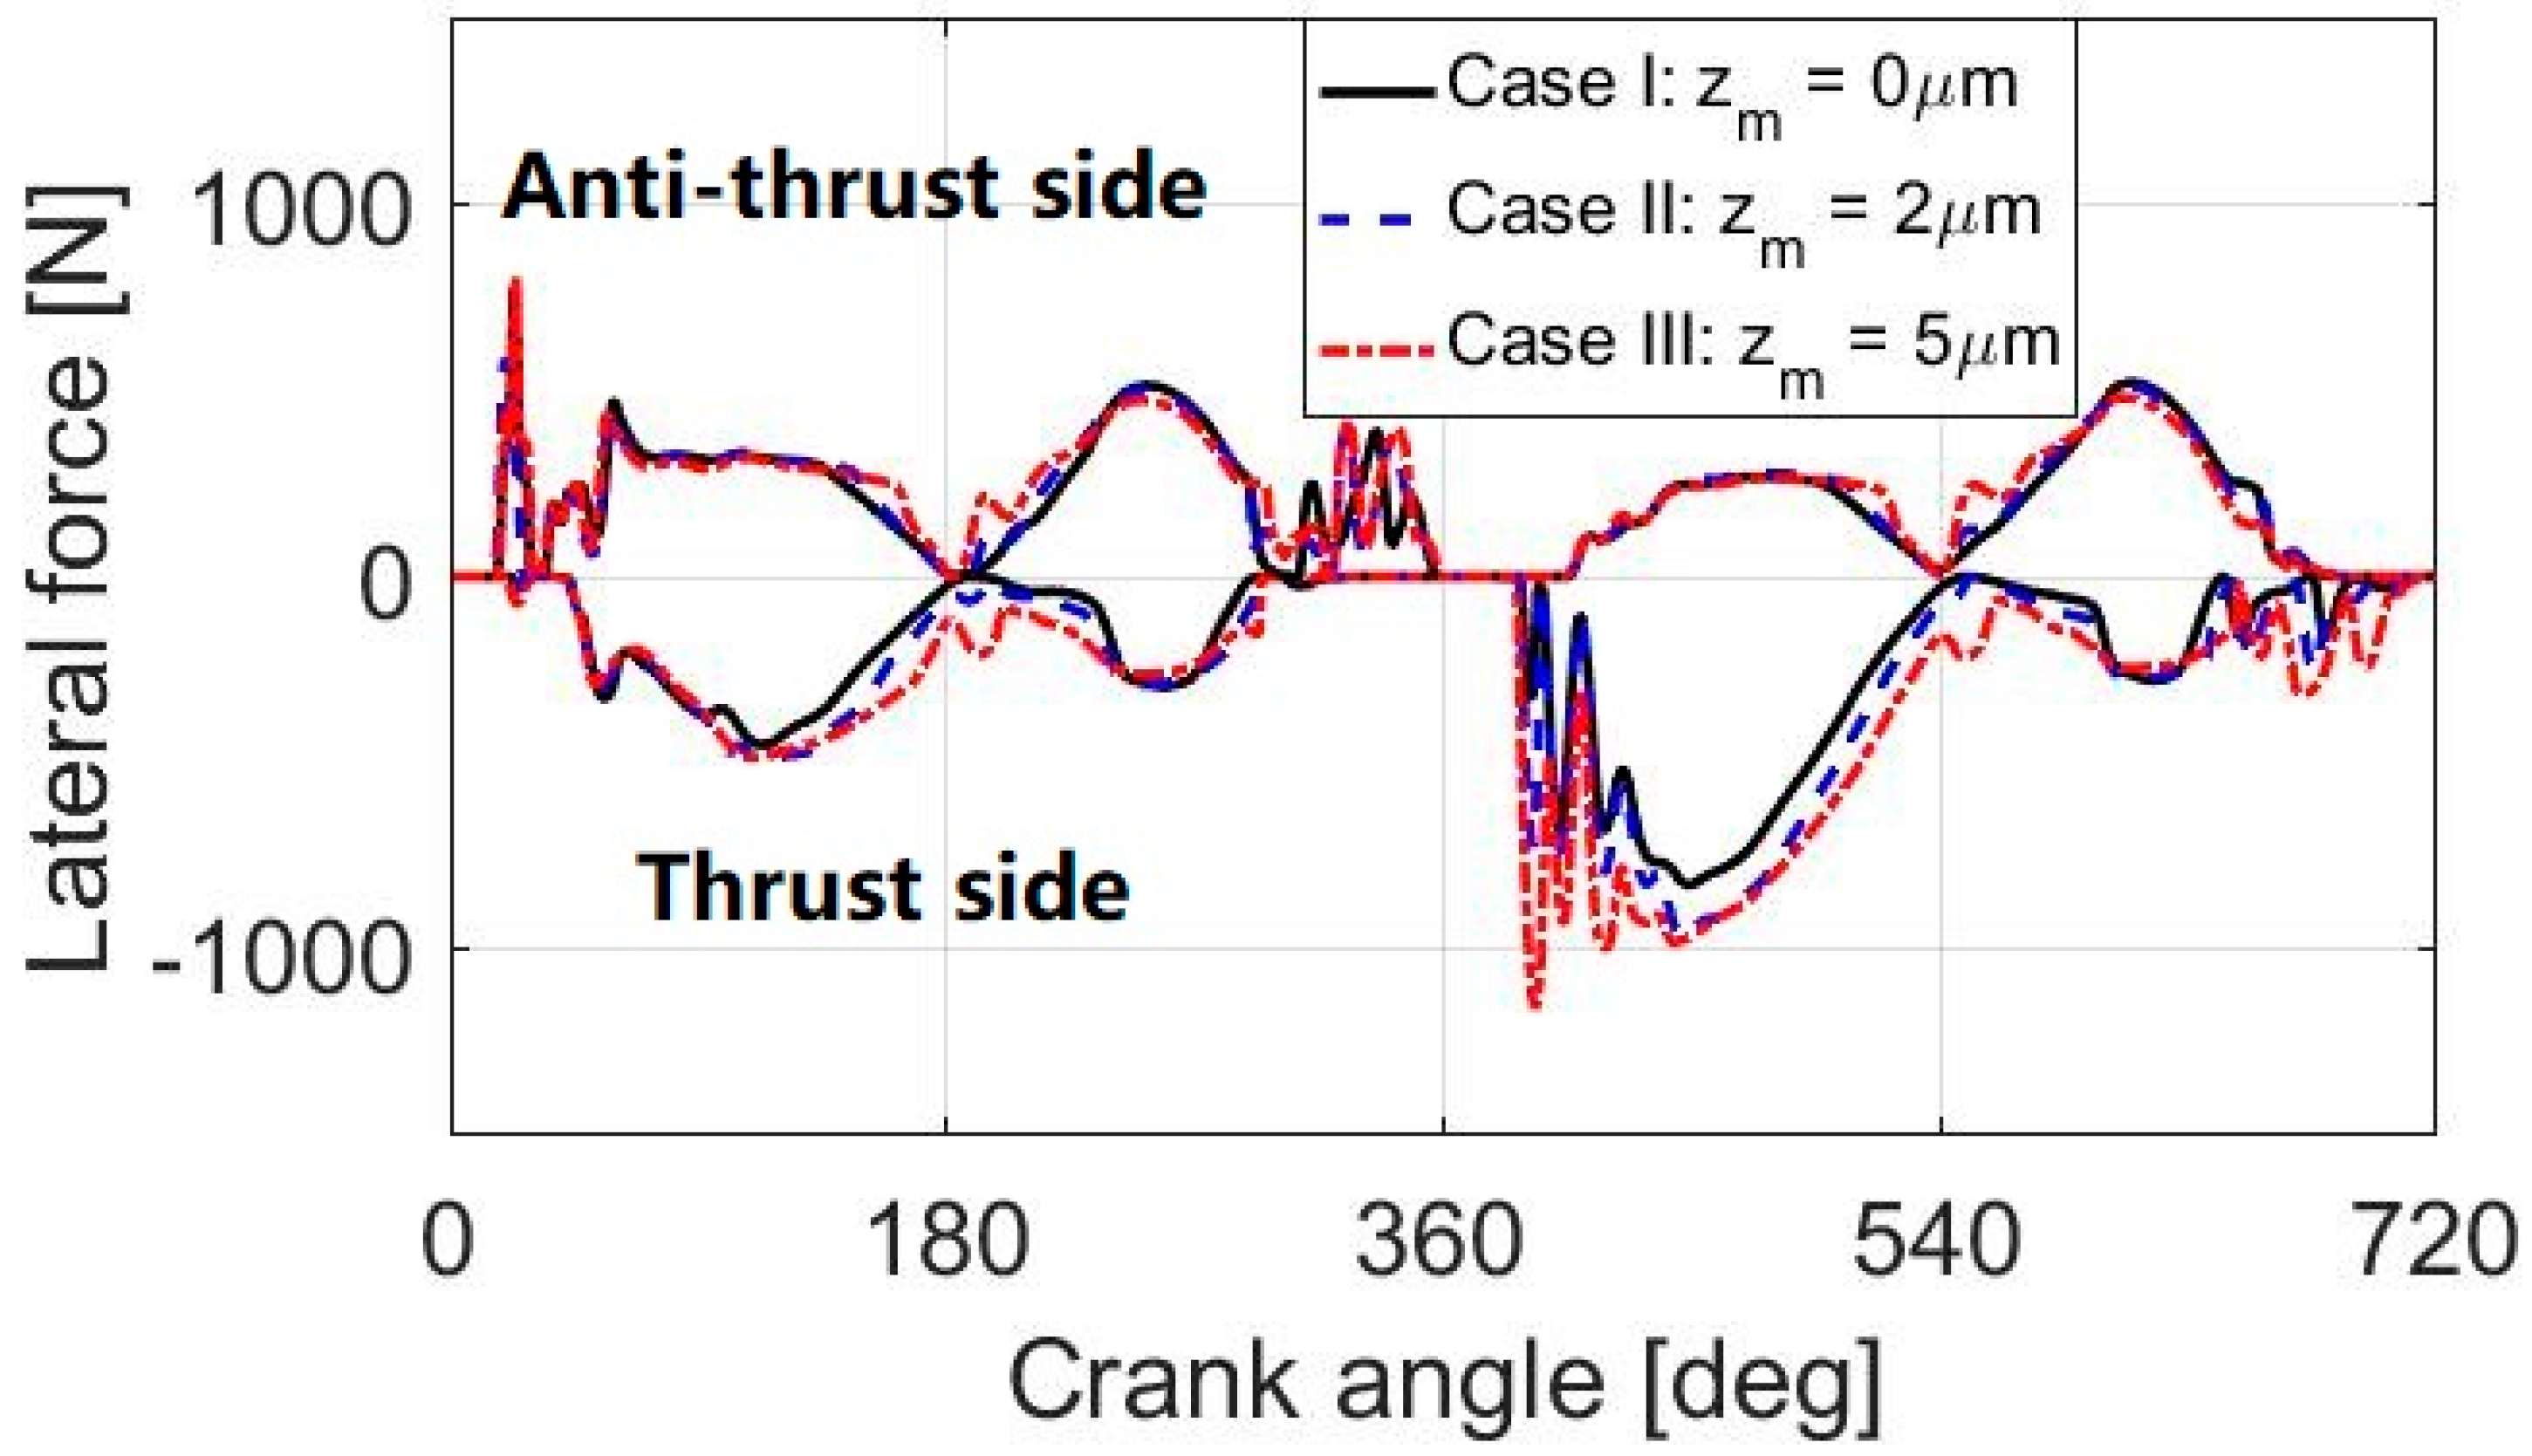
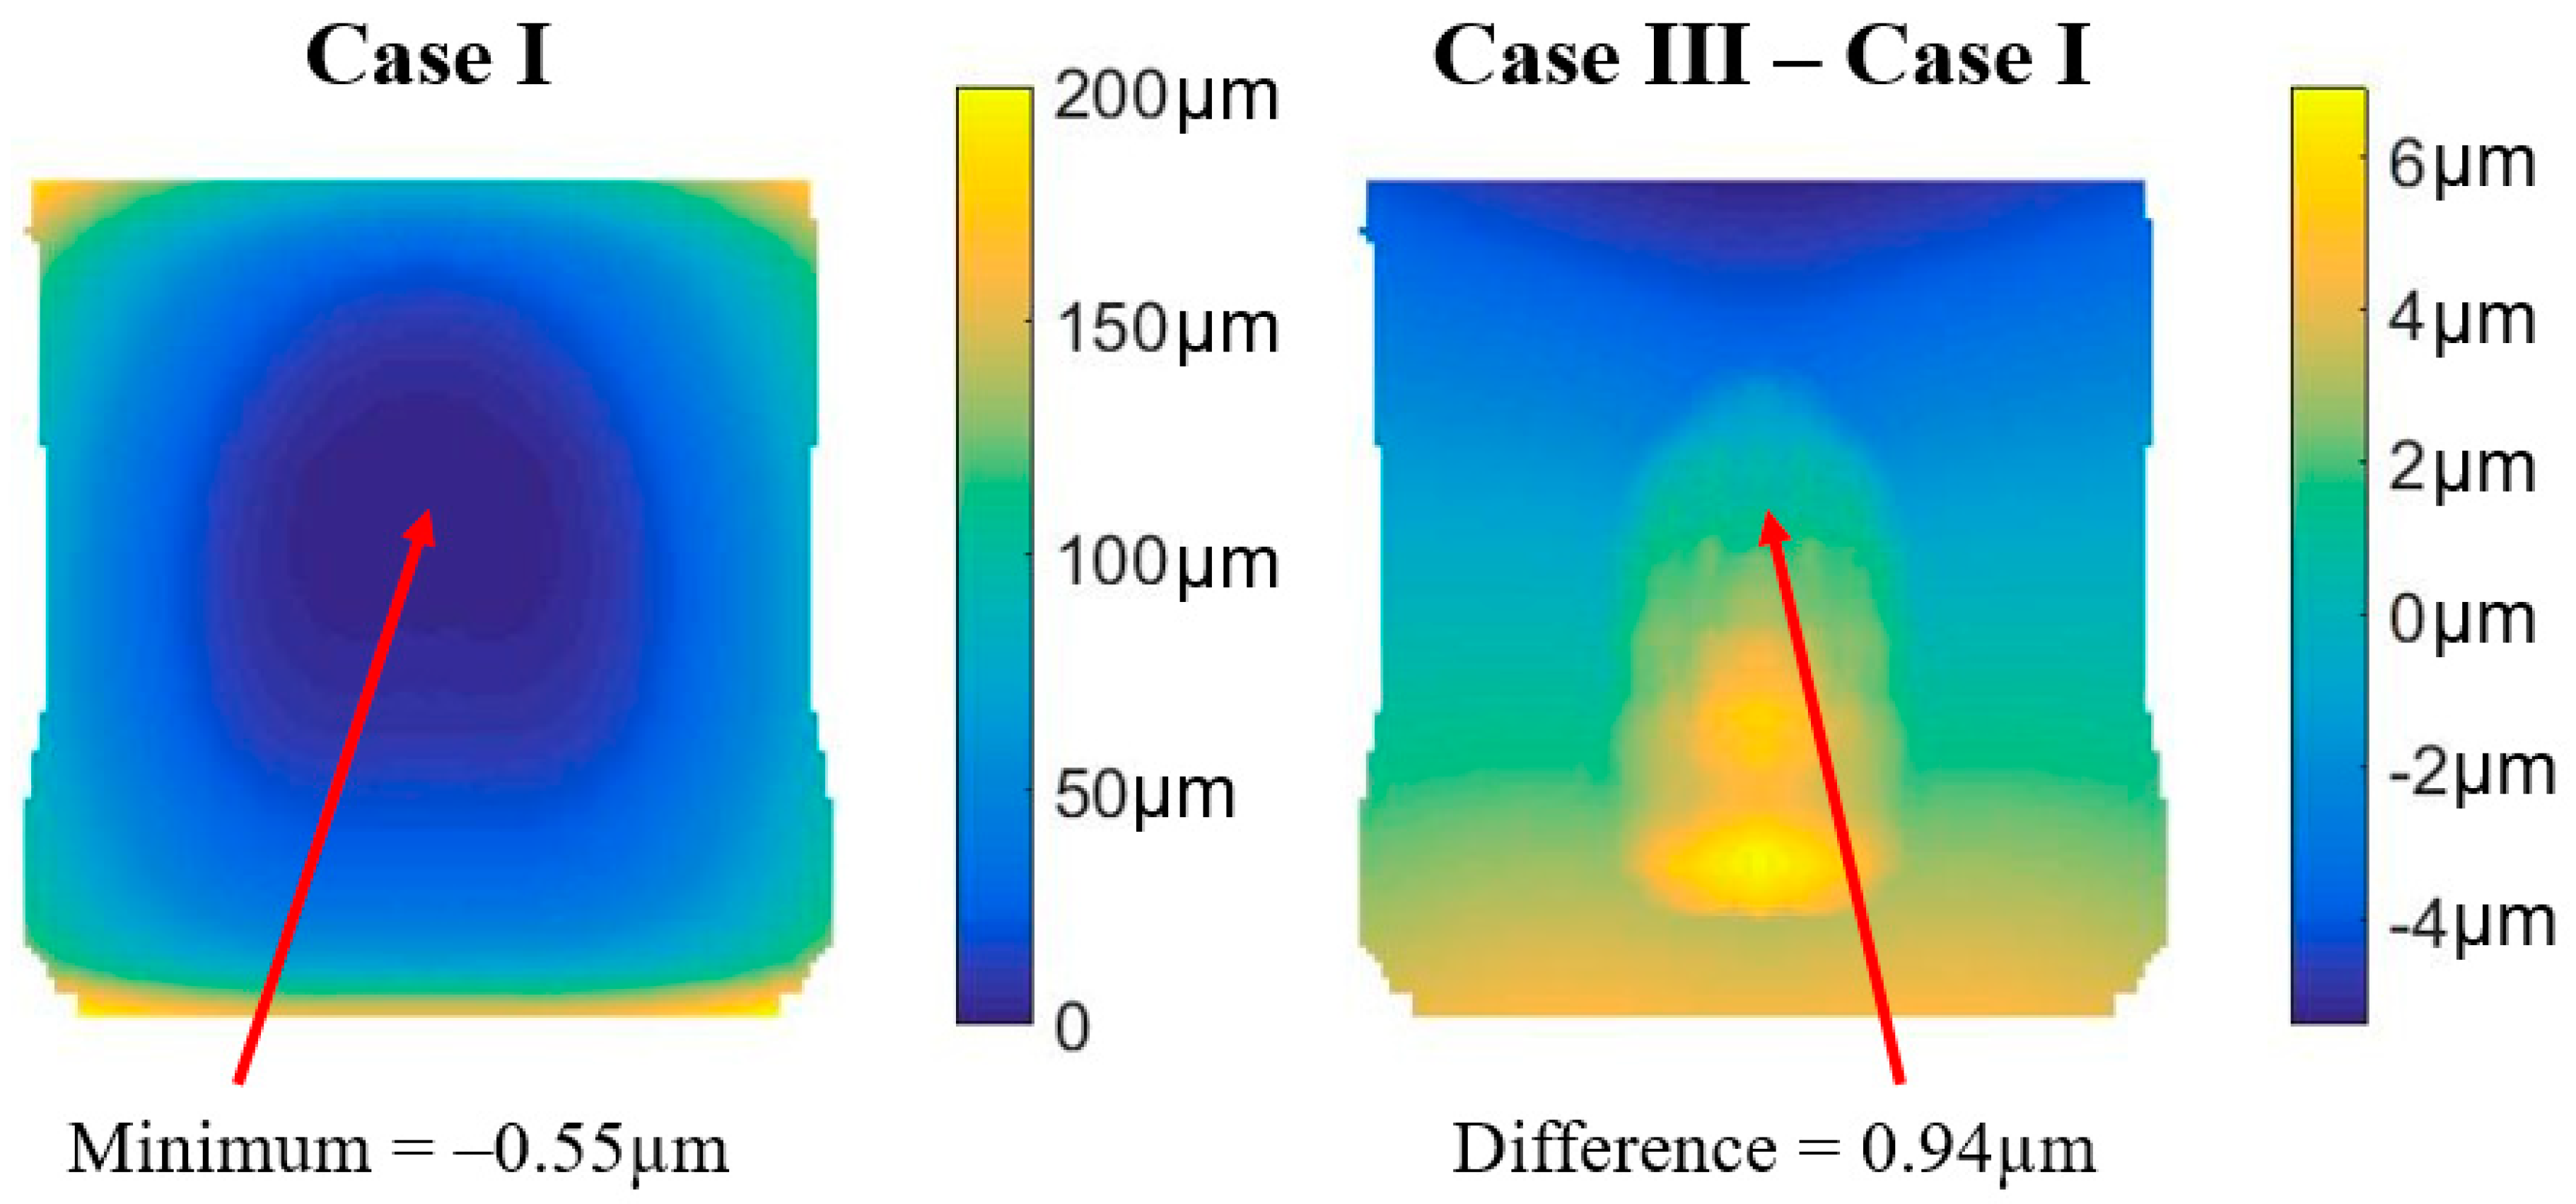
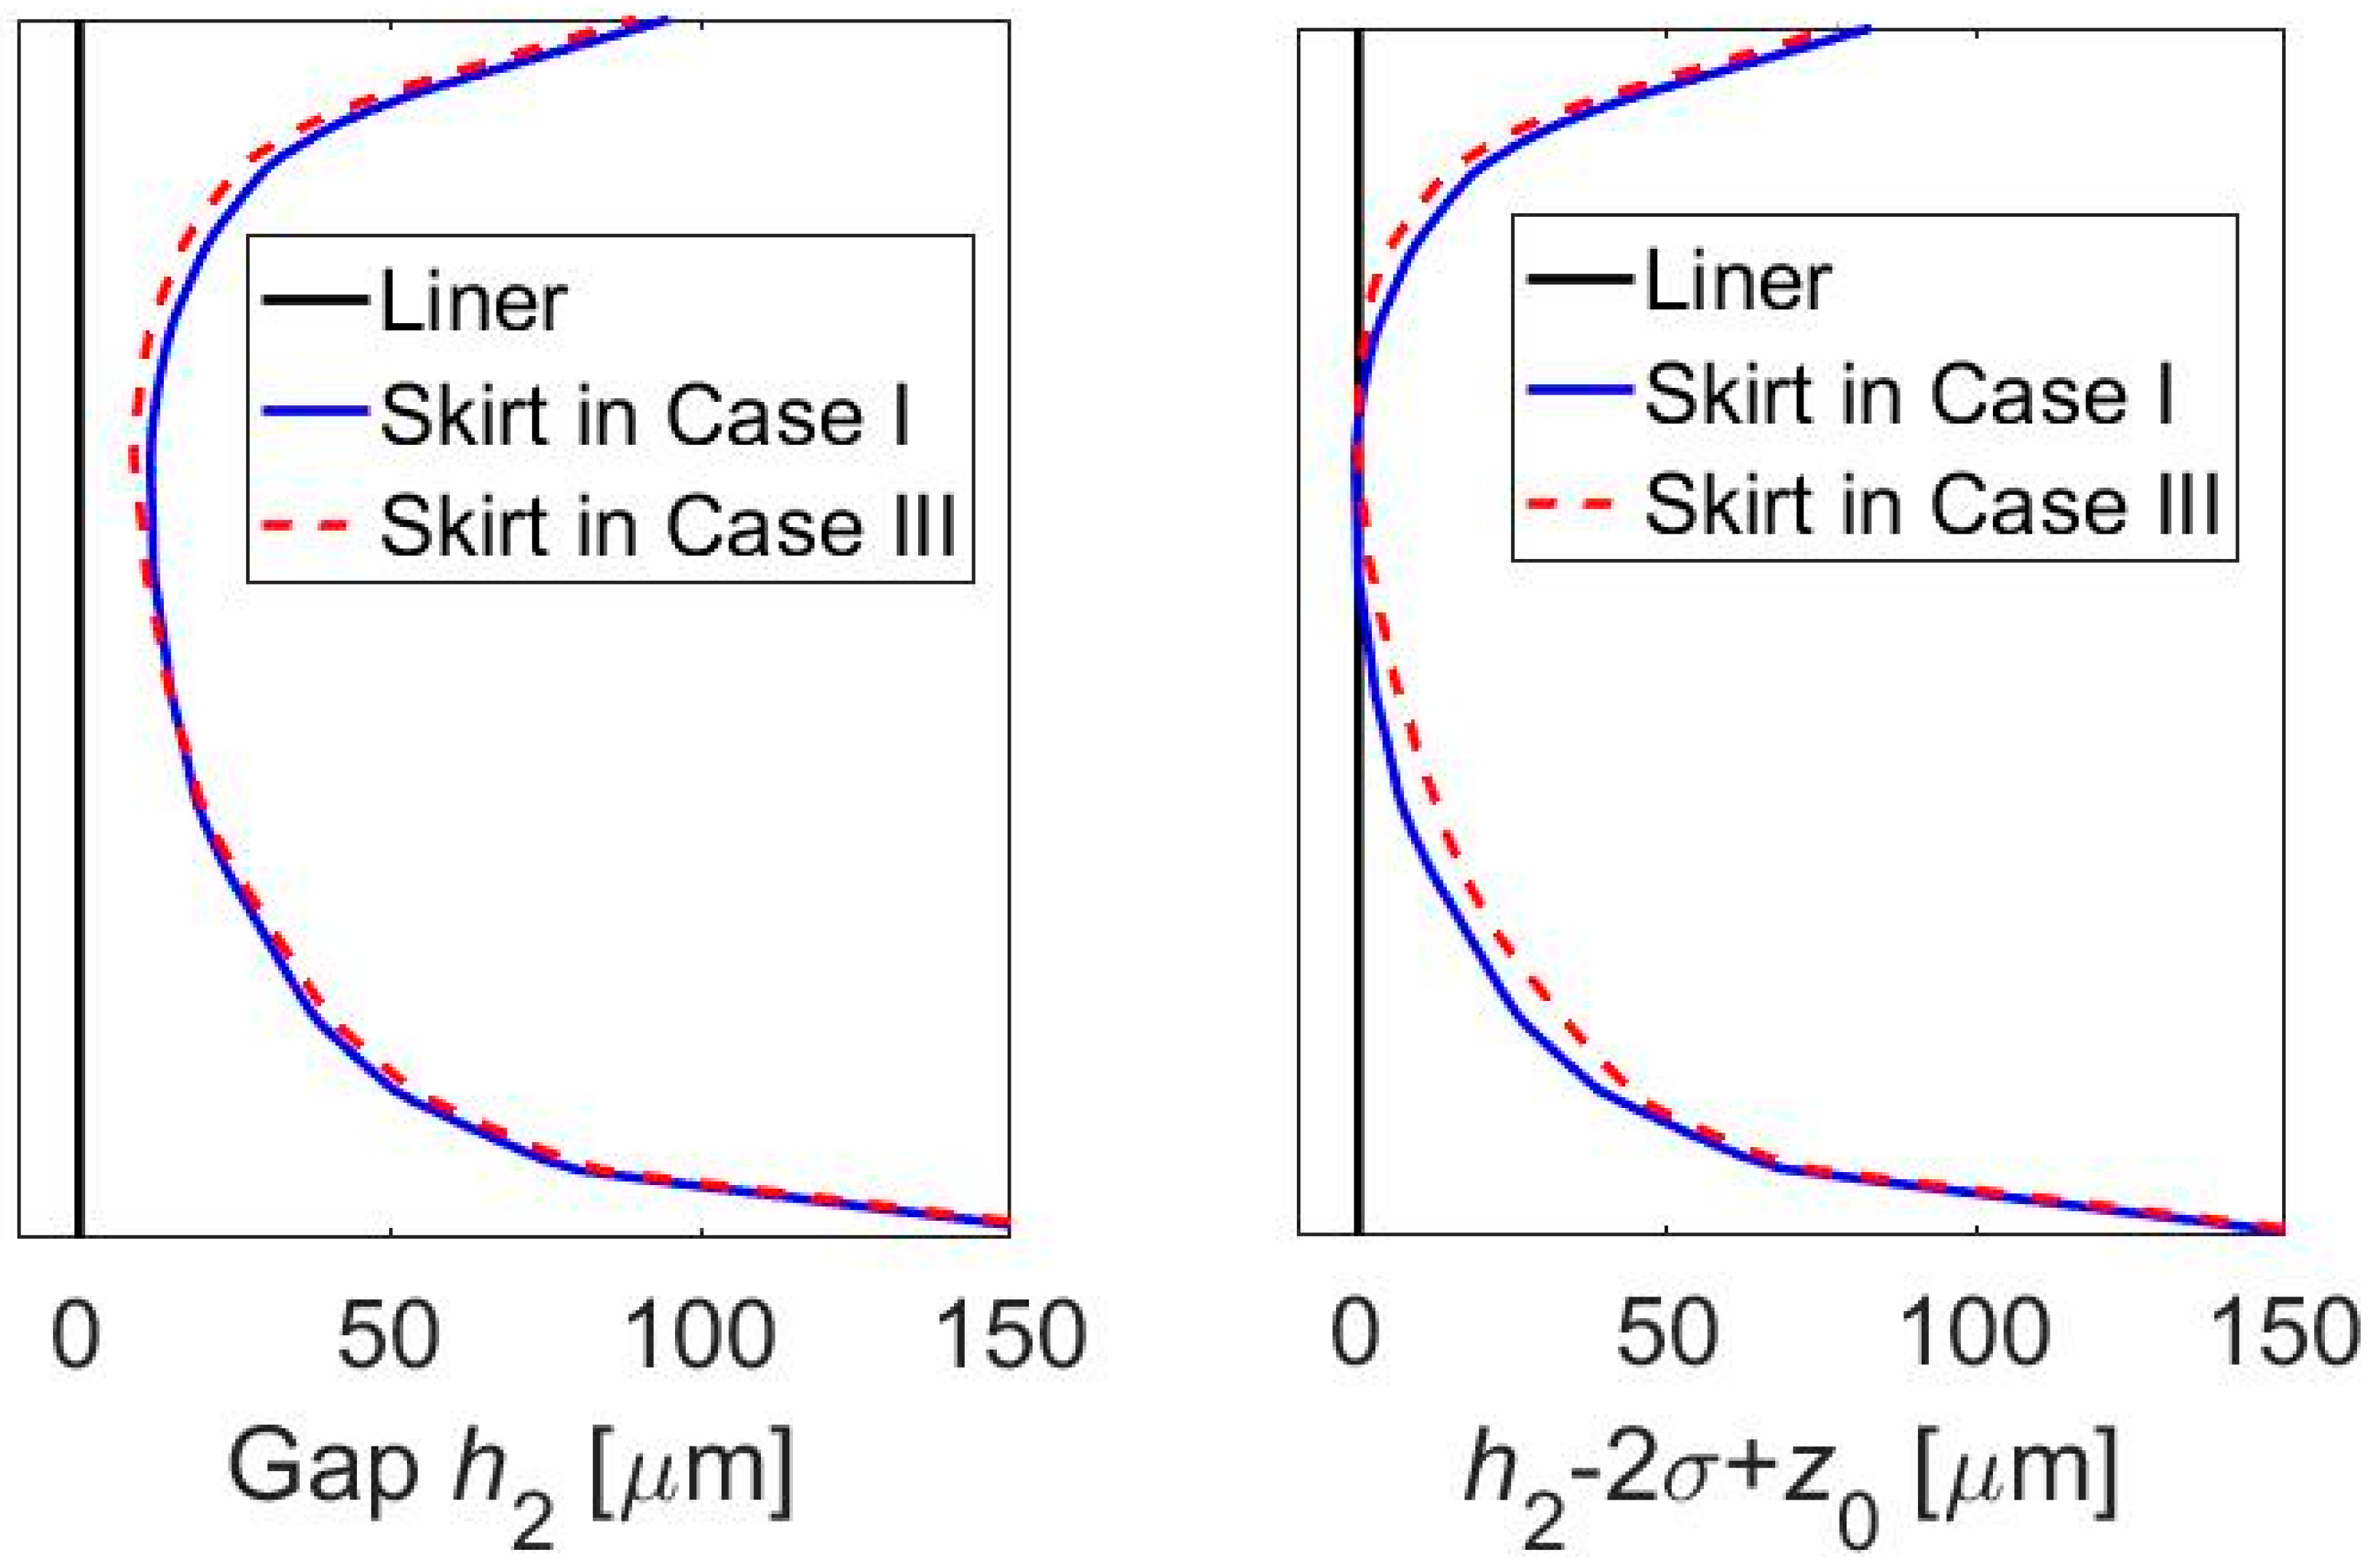
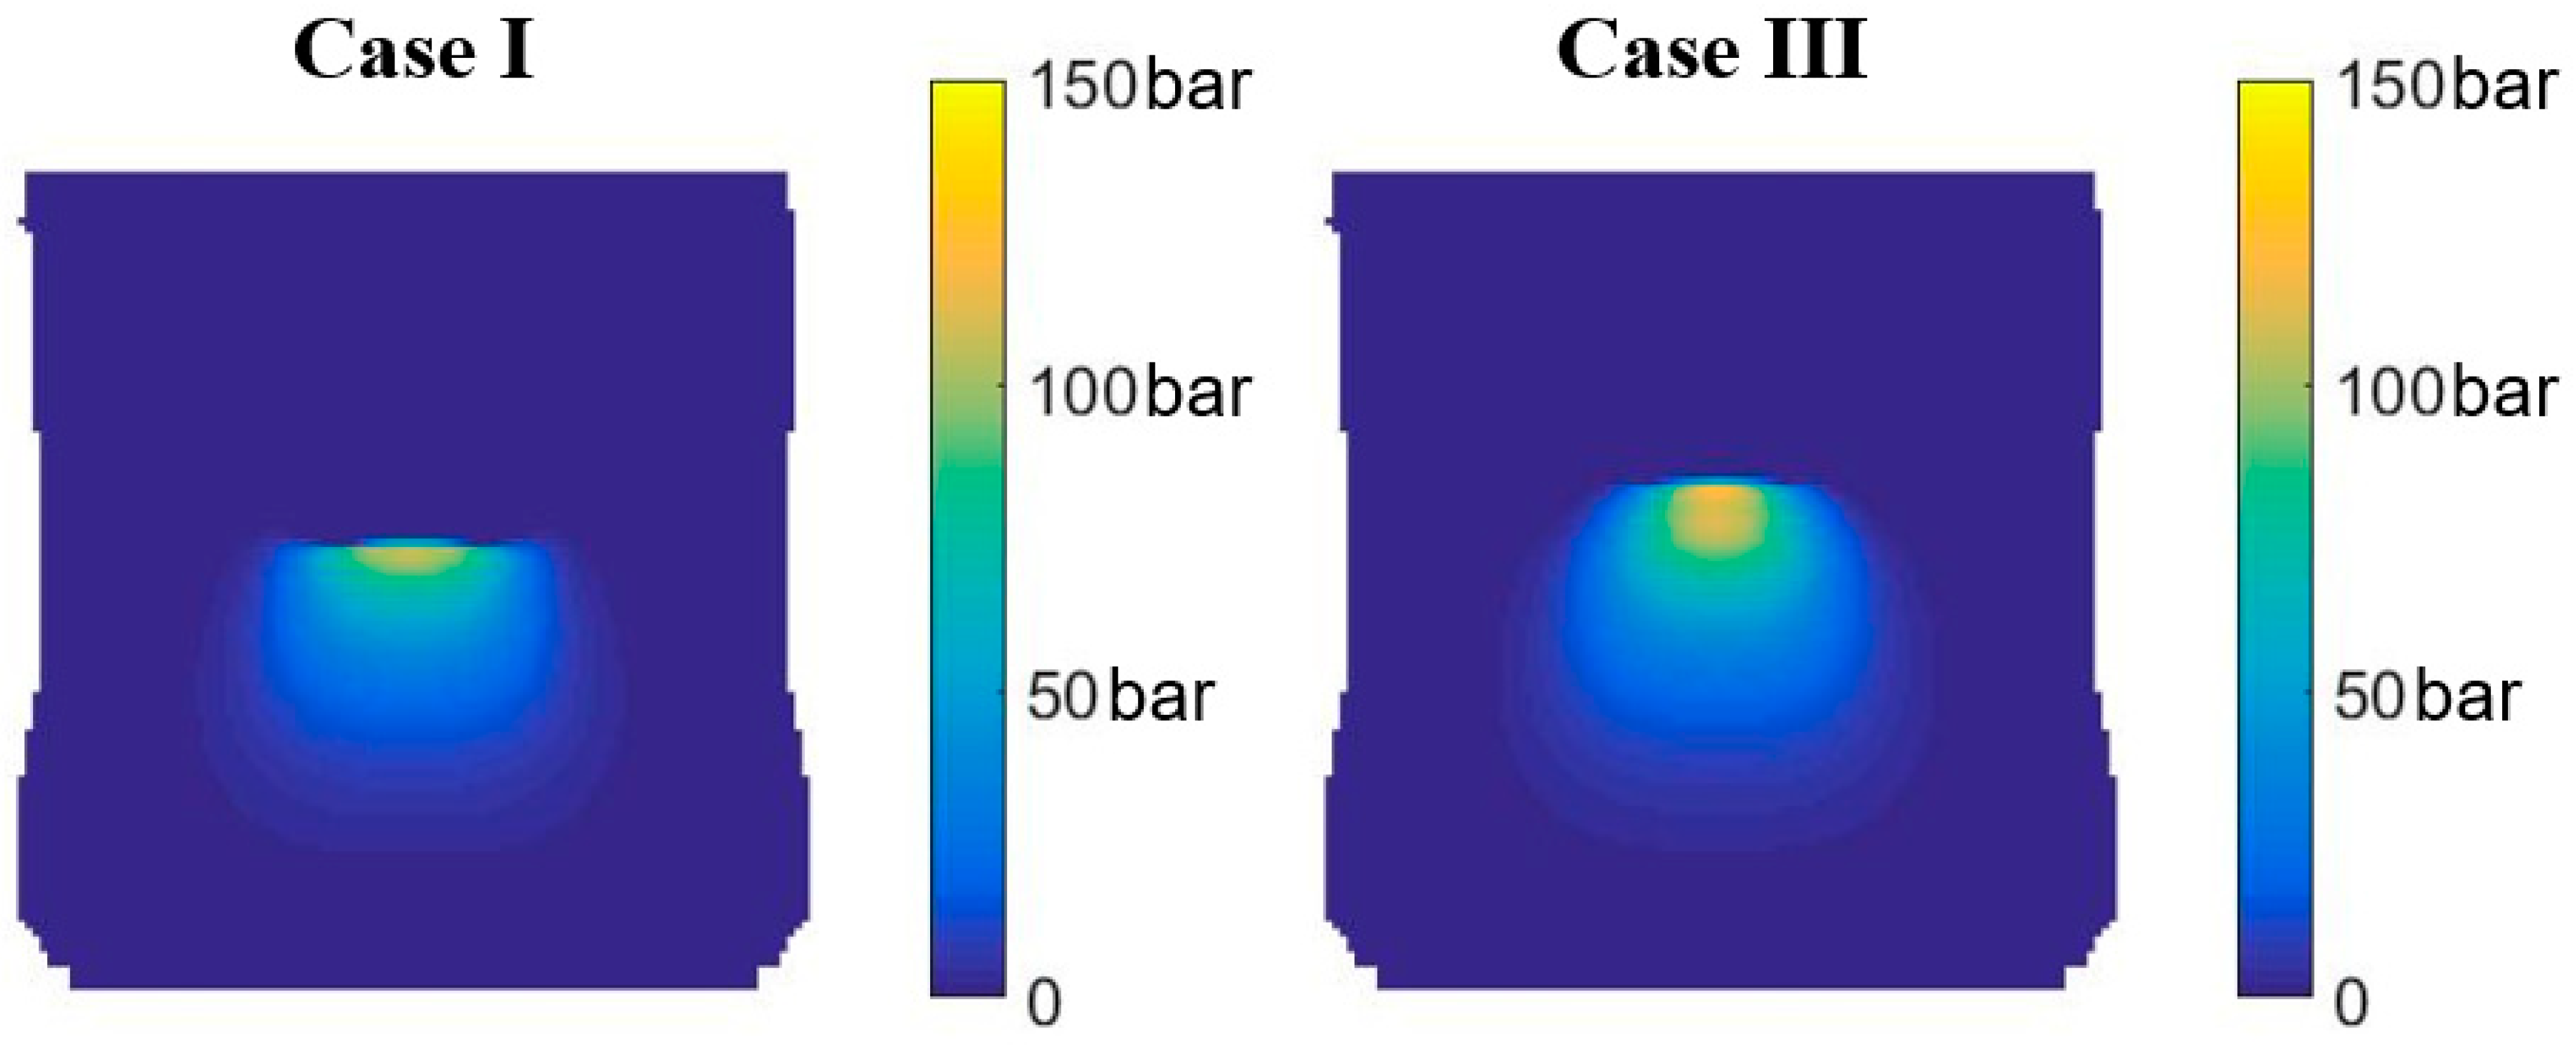
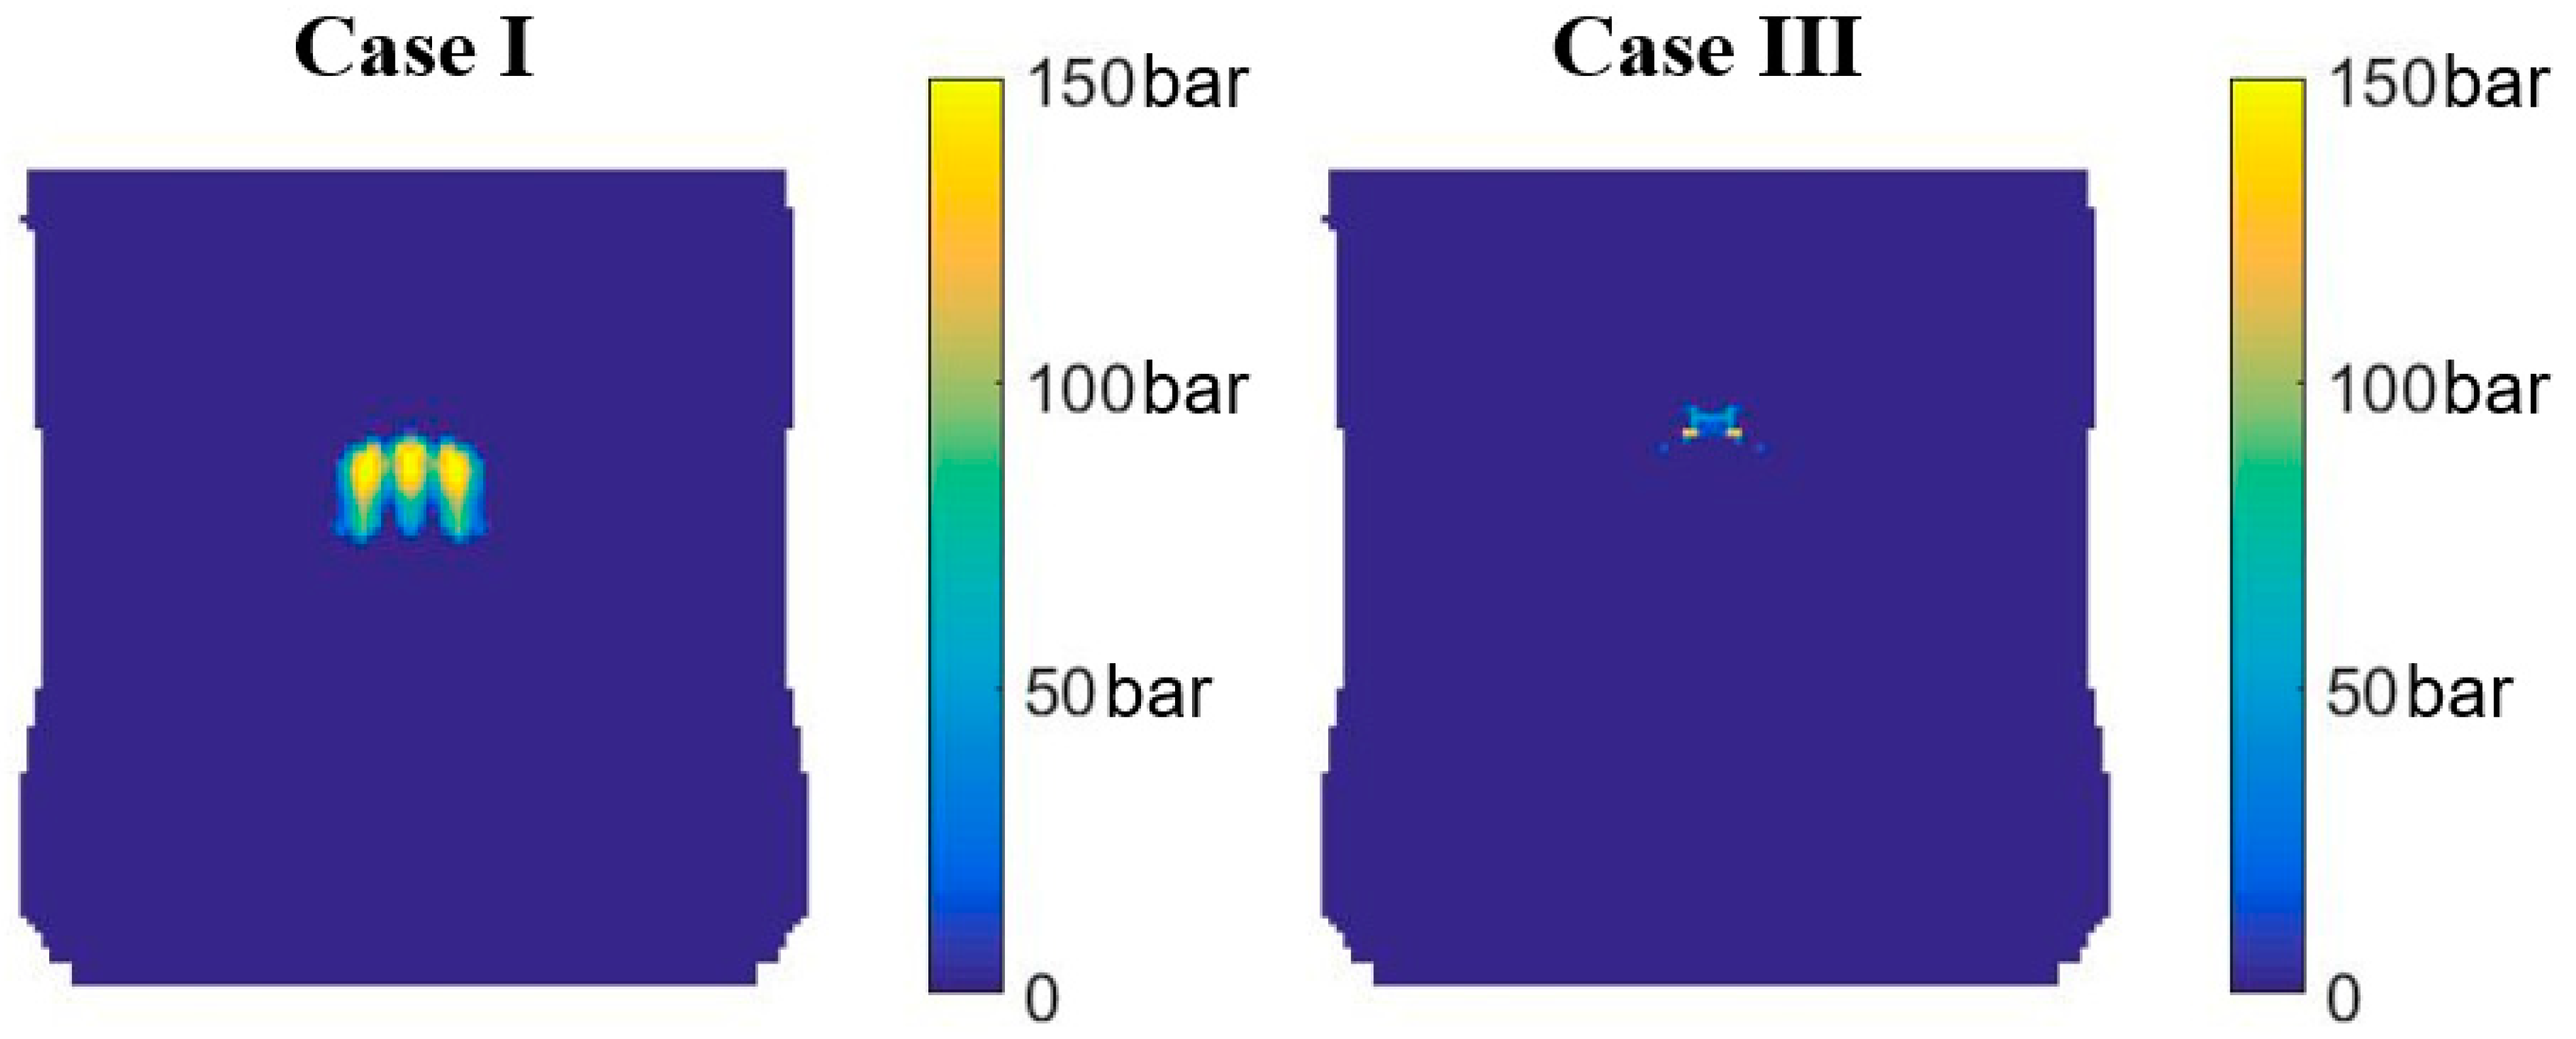
3.1. Effects of Break-In

Figure 7 shows the reduction in FMEP of the RS12 piston from model calculations with different values of maximum worn height z m . The engine speed is 2000 rpm, and the wavelength of the Level III feature is 300 micrometers. In each calculation, the model keeps running until the result is cyclically converged. The FMEP decreases with more wear, and stabilizes when z m reaches about half of the wave height. From the measurement after FLE testing, the worn height of the skirt is 3 micrometers. From the model, when z m is set at the same value, the amount of decrease in FMEP is around 2000 Pa, which is quite close to the experimental result. After 3 micrometers, the experiment suggests that the breaking-in is slowing down, whereas the models shows that FMEP can further decrease if somehow there can be more break-in until the worn height on the Level III feature reaches 5 microns.
Figure 8 and Figure 9 show the friction forces that come from the contact pressure on the thrust and anti-thrust sides of the skirt during a complete engine cycle, starting from the intake stroke. Compared with the friction from the hydrodynamic lubrication regime, which are shown in Figure 10 and Figure 11, boundary friction is much larger even when its coefficient of friction used in the model is as low as 0.03. The result here is one example demonstrating the effectiveness of maintaining hydrodynamic lubrication in achieving low friction.
The occurrence of both sides having friction at the same time indicates an overlap between the piston skirt and the cylinder liner. This is adverse for the lubrication performance because it is difficult for oil to enter the interface from below the piston. However, compared with Case I, where there is no break-in, Cases II and III are still able to have less friction forces during almost the entire engine cycle.
There are two reasons for such friction reduction. The first reason is that the skirt after breaking in has a smaller effective diameter. Therefore, when the lateral force on the piston from the pin is moderate, the amount of overlap between the skirt and the liner is lower, and the lateral force on each side is correspondingly smaller. For example, the model shows that at 180-degree crank angle, the total lateral forces on the thrust side are 284.8 N for Case I and 247.3 N for Case III. On the anti-thrust side, the forces are 278.3 and 234.2 N.
During most of the expansion stroke, the piston is only interacting with the thrust side of the liner, so there is no overlap and the first reason does not apply. But in this situation, worn profile is able to generate higher hydrodynamic pressure with the same minimum height ( h in Equation (21)). Figure 12 shows the result of a simplified 1D model, where the black curves represent the skirt profiles, and the horizontal axes represent the liner. The dimensionless hydrodynamic pressures with the same normalizing factor are plotted in red.
Therefore, the skirt with a worn surface can generate more hydrodynamic pressure before making solid-to-solid contact with the liner. The lateral forces between the skirt and the liner that come from hydrodynamic pressure and contact pressure are shown, respectively, in Figure 13 and Figure 14.
Figure 15 shows the differences in the minimum value of the valley clearance, or oil film thickness, between the skirt and the liner on the thrust side. Here the valley clearance is defined as h 2 in Figure 5. Case III and Case II have lower minimum gap during most of the engine cycle compared to Case I.
As an illustration, Figure 16 shows the distribution of valley clearance on the thrust side of the skirt at 430-degree crank angle in Case I, and the differences between Case III and Case I. Although the skirt in Case III is closer to the liner in terms of minimum valley clearance, it has less contact with the liner. This is illustrated by Figure 17 which shows the distributions of the closest distance (peak clearance) from the skirt to the liner. The peak clearance is represented by h 2 2 σ + z 0 in Figure 5, and contact will occur if it becomes negative. The gaps along the centerline of the skirt, which is the dashed line on the left part, are shown in Figure 18. There is no contact for Case III at this crank angle.
Figure 19 and Figure 20 show the distributions of hydrodynamic pressure and contact pressure at the same crank angle.

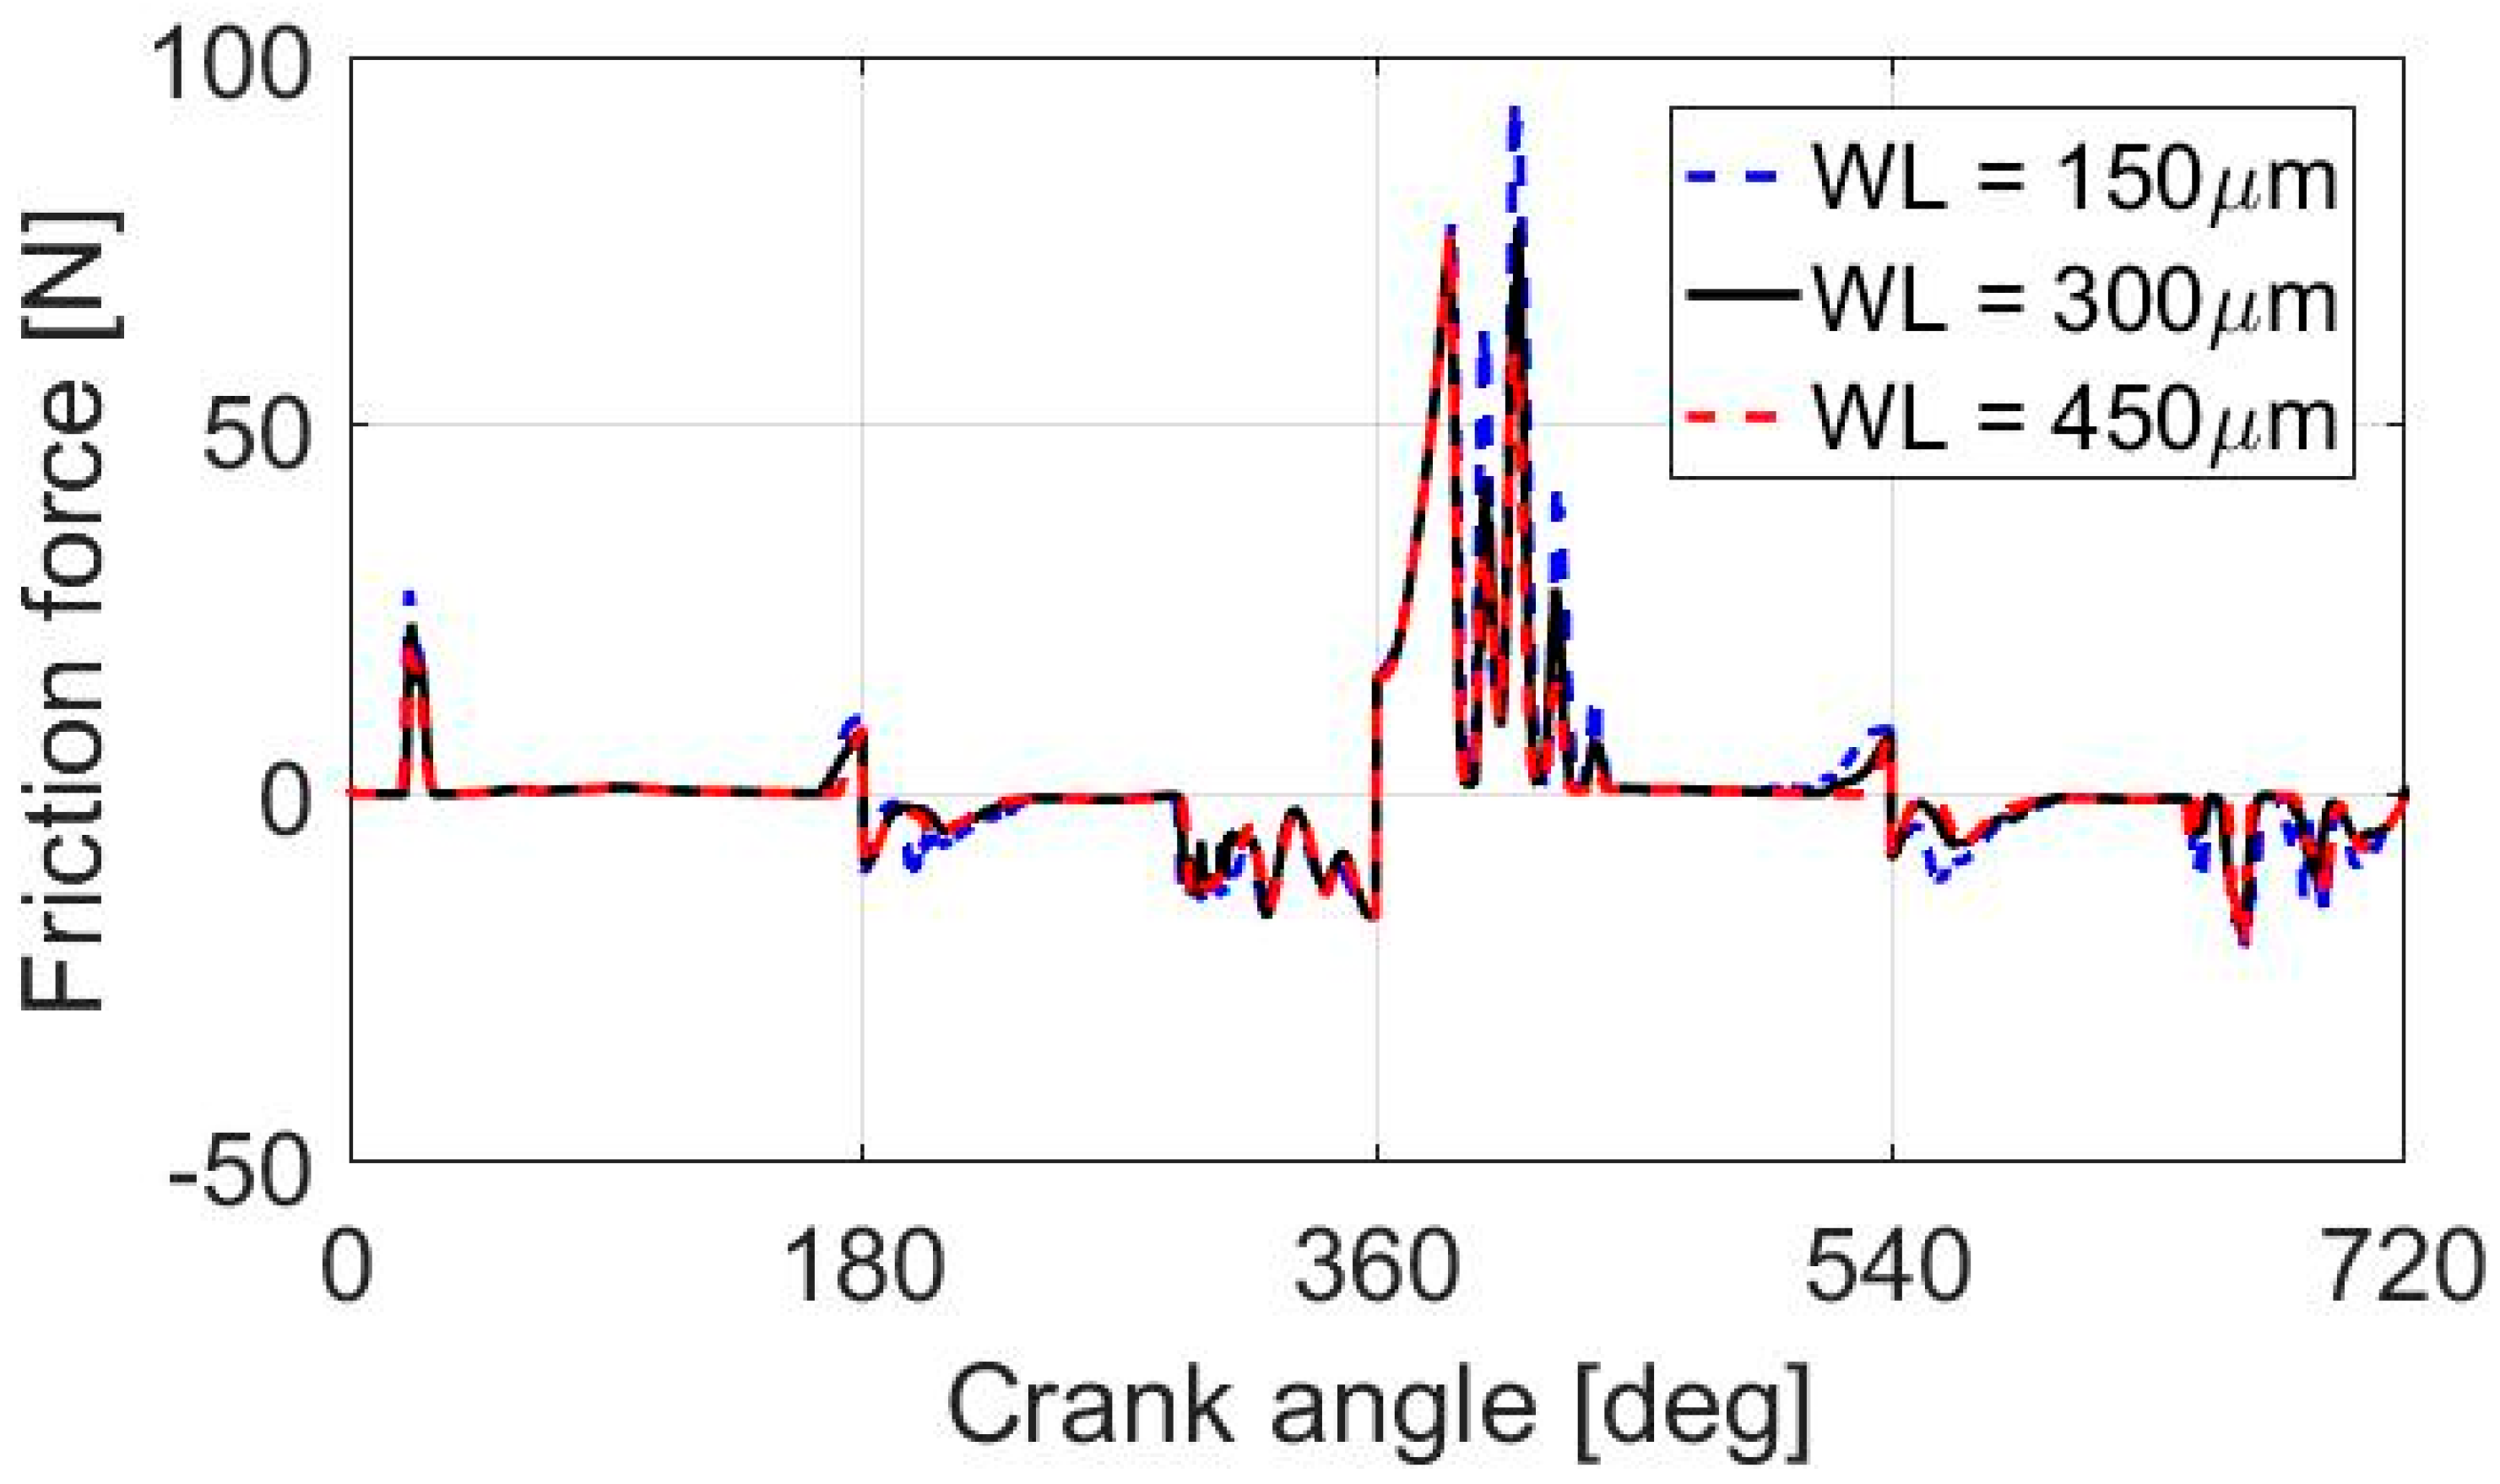
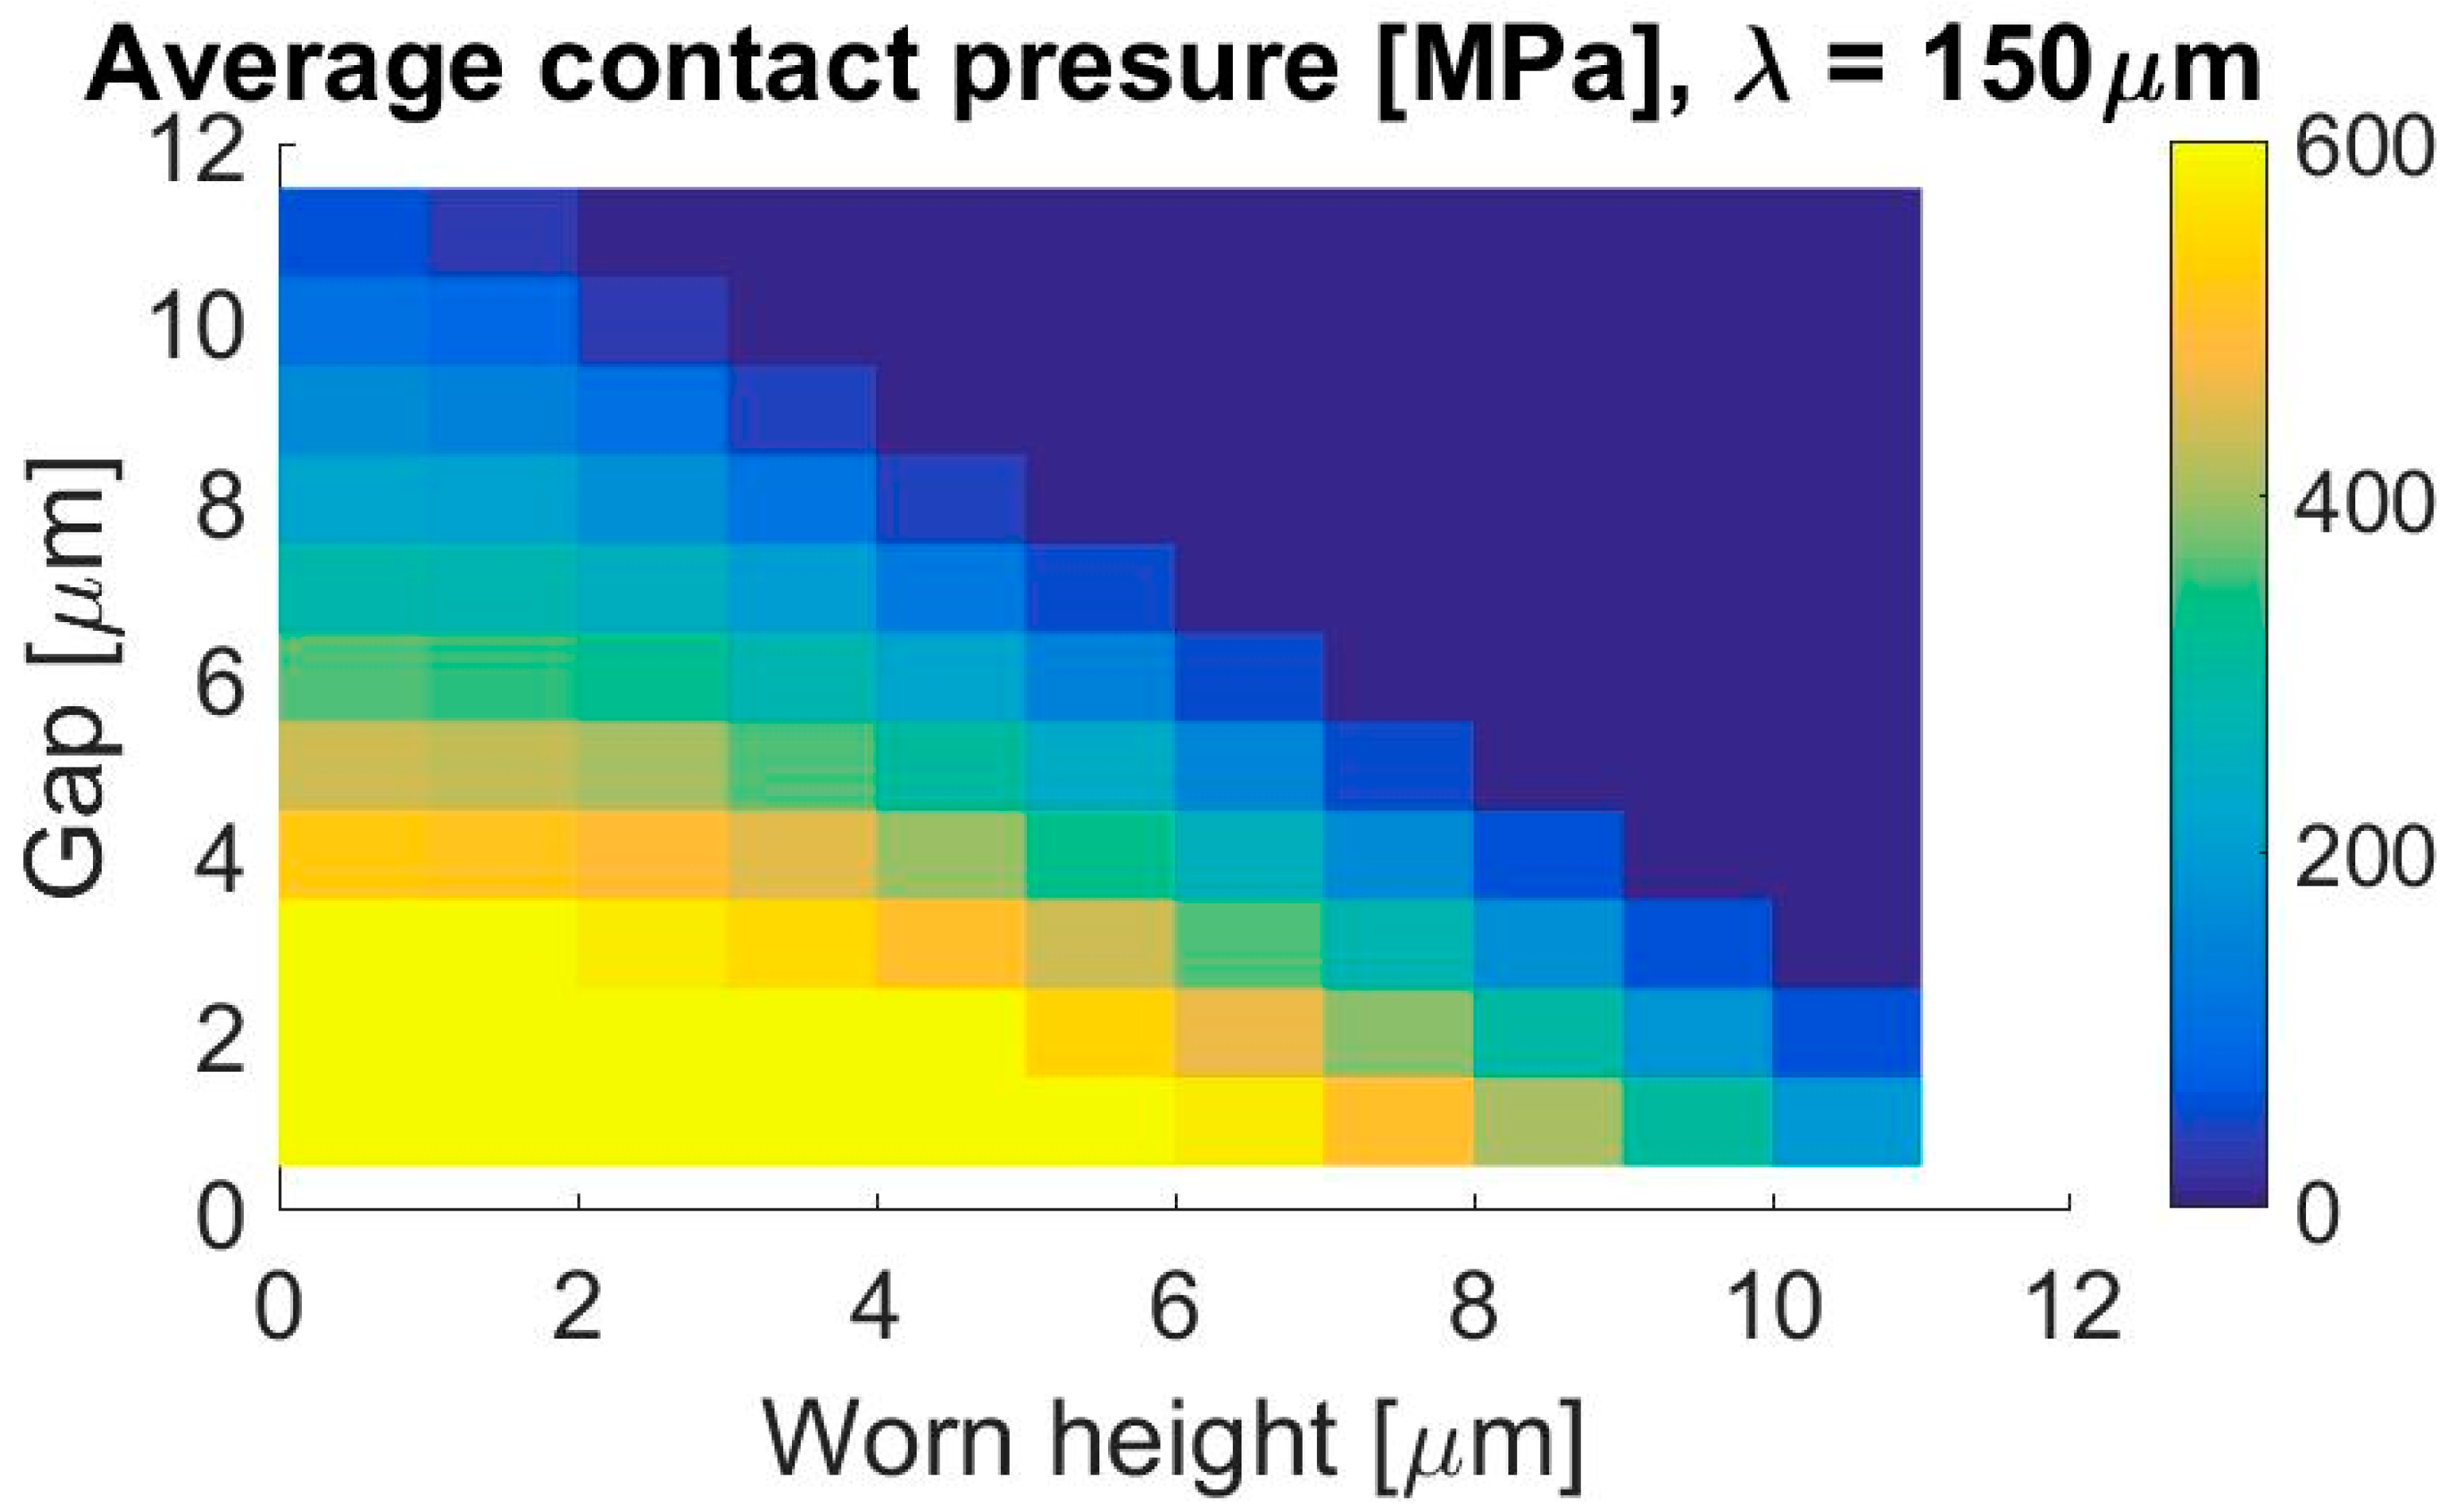
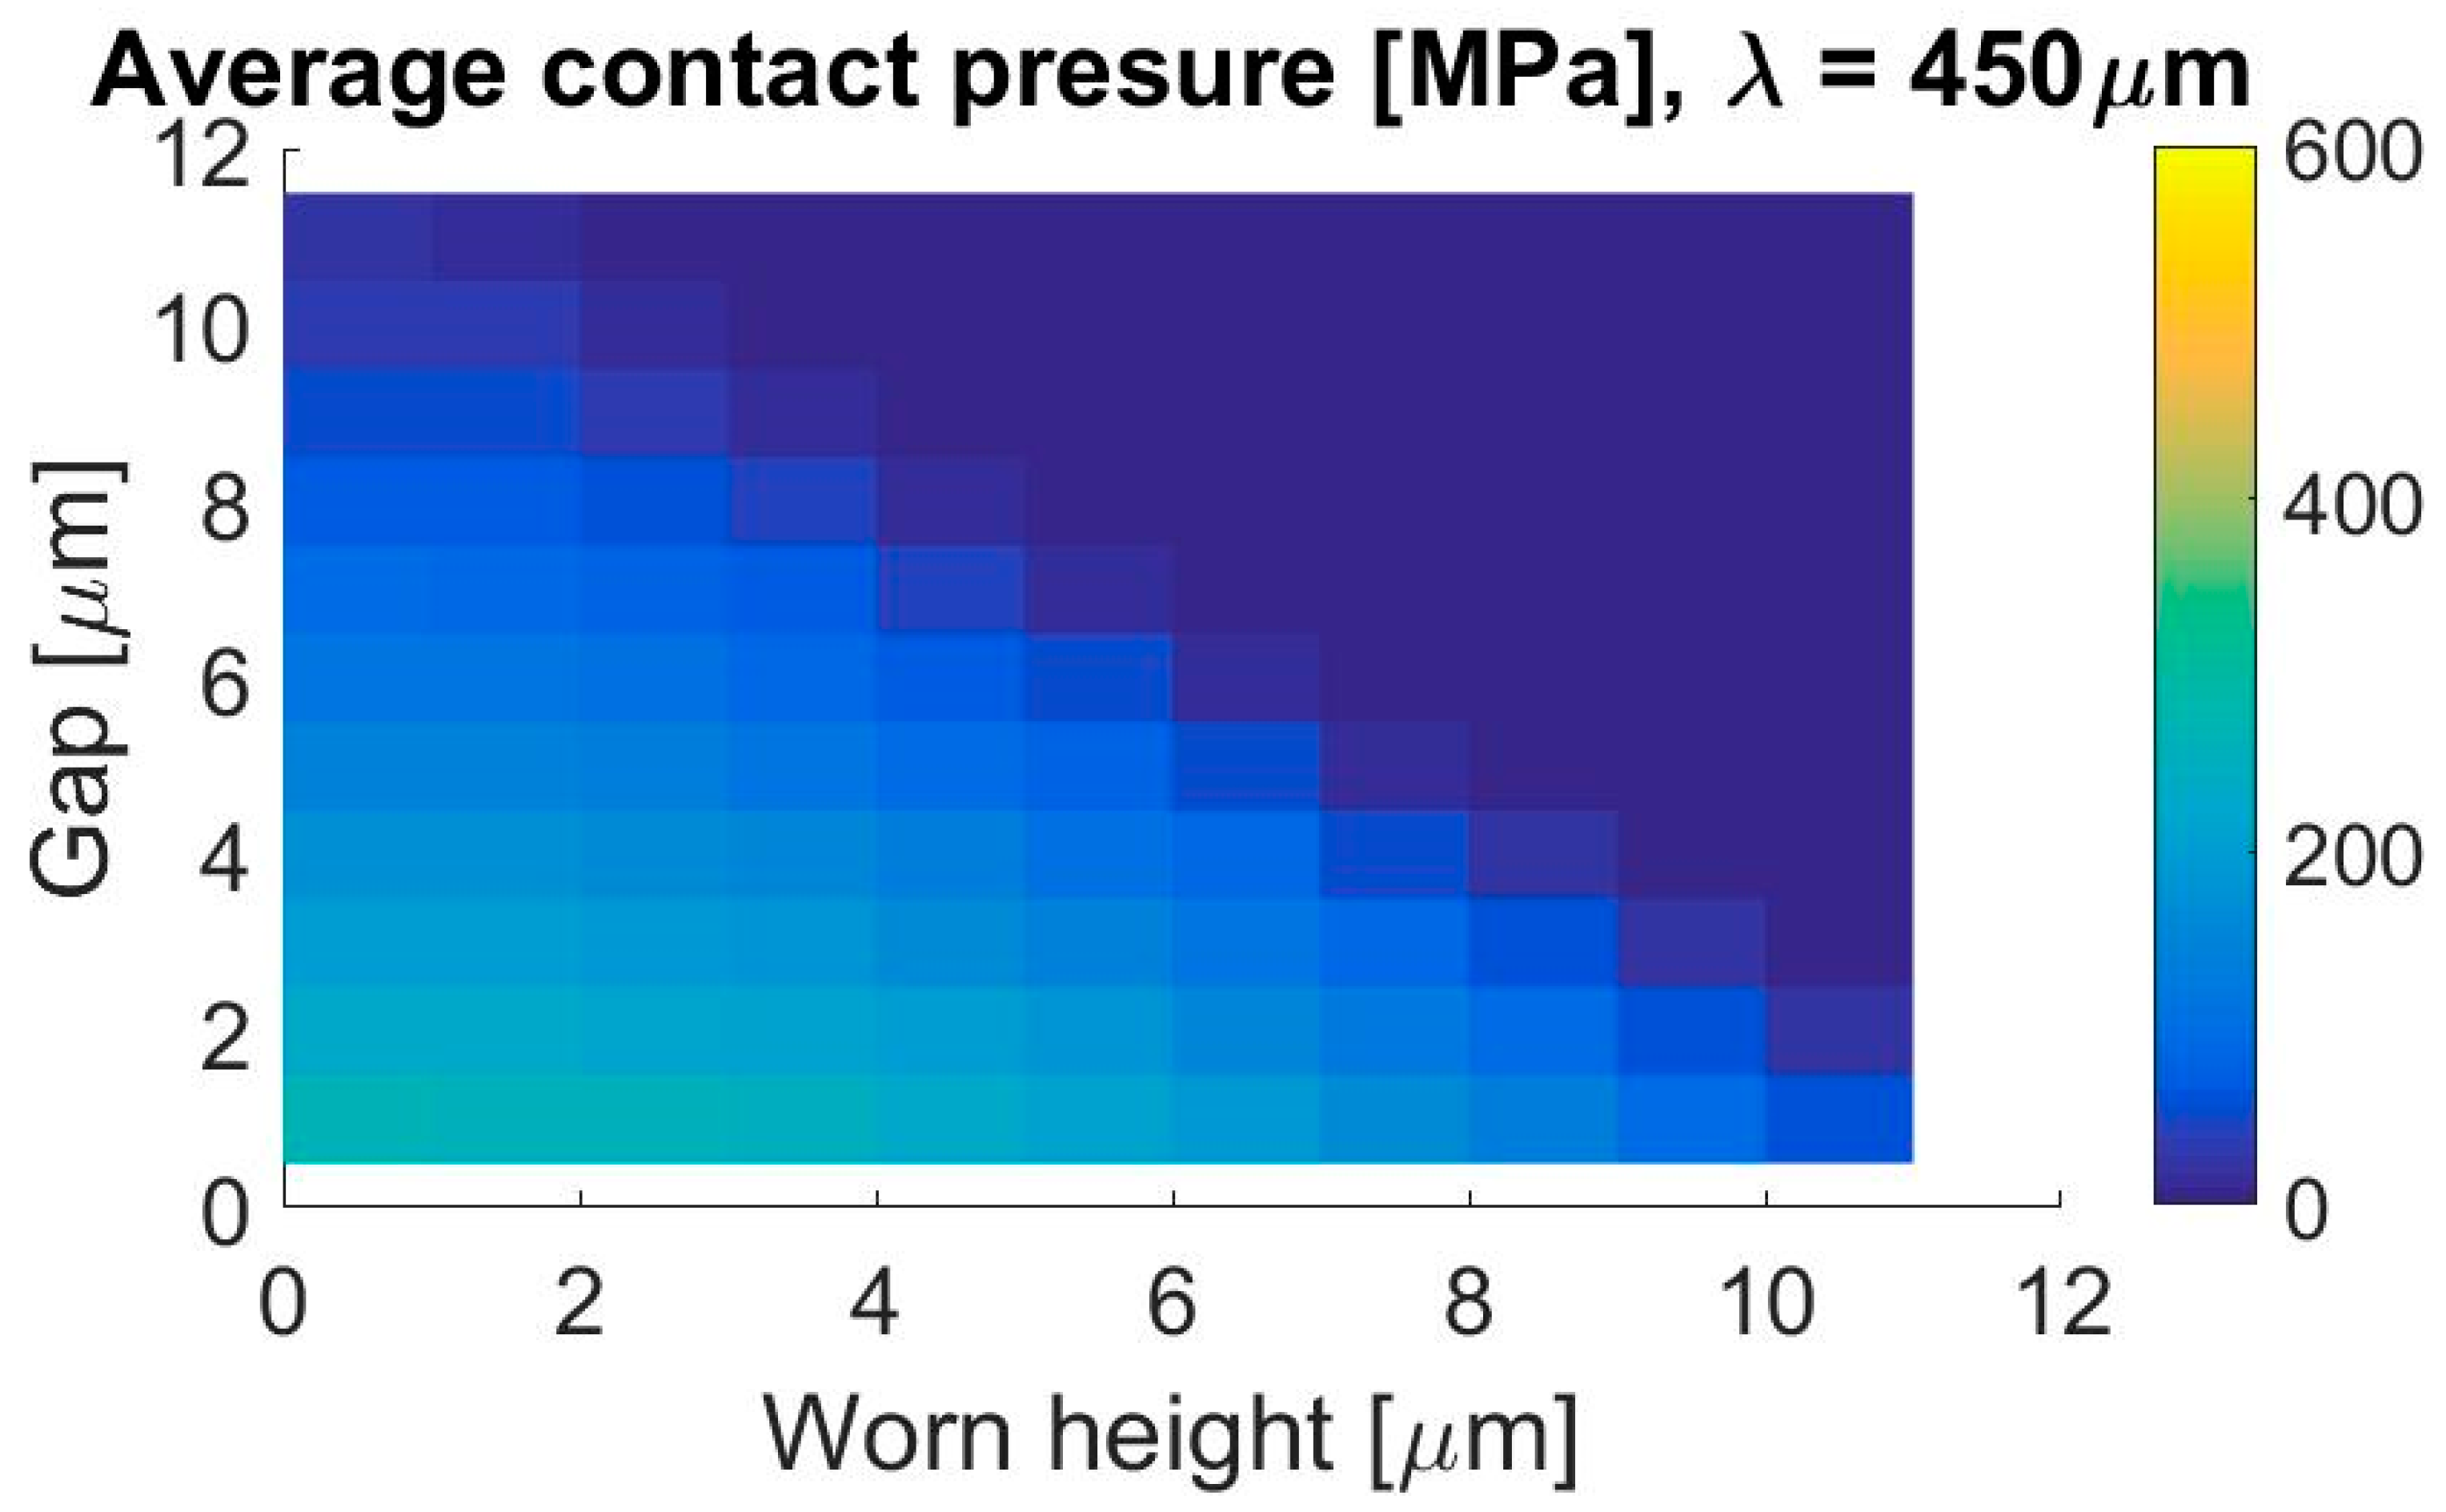
3.2. Effects of Wavelength

Figure 21 shows the friction forces on the thrust side for three different wavelengths with maximum worn height of 6 micrometers. The case with higher wavelength has lower friction force. This is mainly due to the magnitude of contact pressure. As shown in Figure 22 and Figure 23, with the same worn height of the waves and the same valley clearance, contact pressure generated with higher wavelength is much lower.

4. Conclusions

Benefitting from its large surface area, the piston skirt is very effective in generating hydrodynamic pressure. The skirt friction can be maintained to a negligible level if solid–solid contact does not occur. While in theory a smoother skirt can be more effective than a rough surface in minimizing direct solid–solid contact, it may not be tribologically robust to foreign particles and may be prone to seizure [29]. Therefore, it can be argued that having an adequate initial roughness and applying a soft coating can be a good solution, especially since the exact bore distortion and piston distortion during engine running are not completely known. The challenge, of course, is to find the proper roughness or the Level III features to ensure sufficient hydrodynamic pressure generation to support the side force with maximum average clearance to minimize the shear stress from the lubricating oil. In this sense, the knowledge of the Level III features after break-in becomes crucial. The present work developed the necessary tools and showed a path to consider break-in effect for optimizing the skirt design. Although the present work is focused on one type of roughness, the same methodology can be applied to other roughness patterns.

Author Contributions

Formal analysis, Z.M.; investigation, L.Z.; writing—original draft, Z.M.; writing—review and editing, T.T.

Funding

This work was sponsored by Daimler and the Consortium on Lubrication in Internal Combustion Engines in the Sloan Automotive Laboratory, Massachusetts Institute of Technology, with additional support by Argonne National Laboratory and the US Department of Energy. The consortium members were Mahle, MTU, PSA, Renault, Shell, Toyota, Volkswagen, Volvo Truck, and Weichai Power.

Conflicts of Interest

The authors declare no conflict of interest.

Nomenclature

α angle between the central axis of the piston and the connecting rod
λ wavelength of the tooling marks on the piston skirt
σ half of the peak-to-valley distance of the waves on the skirt without break-in
τ hydrodynamic shear stress
φ x , φ z flow factors for the Poiseuille term in the average Reynolds equation
φ s flow factor for the Couette term in the average Reynolds equation
φ f , φ f s , φ f p flow factors for the shear stress
Φ gauge pressure in full film region and opposite value of the void ratio in partial film region
h local distance between the liner and the skirt
h 1 distance between the liner and the peak of the wave on the skirt without break-in
h 2 distance between the liner and the valley of the wave on the skirt
h m average value of h over the wavelength of the skirt profile
h k average value of h k over the wavelength of the skirt profile
p c contact pressure
z 0 worn height of the wave on the skirt
z m maximum worn height allowed
E effective Young’s modulus between the skirt coating and the liner
F indicator of full film and partial film regions
U dimensionless sliding velocity of the piston

References

  1. Meng, Z. Numerical Investigation of the Piston Skirt Lubrication in Heavy Duty Diesel Engines. Ph.D. Thesis, Massachusetts Institute of Technology, Cambridge, MA, USA, 2017. [Google Scholar]
  2. Meng, Z.; Ahling, S.; Tian, T. Modeling of Oil Transport between Piston Skirt and Cylinder Liner in Internal Combustion Engines (No. 2019-01-0590); SAE Technical Paper; SAE: Warrendale, PA, USA; Troy, MI, USA, 2019. [Google Scholar]
  3. Meng, Z.; Ahling, S.; Tian, T. Study of the Effects of Oil Supply and Piston Skirt Profile on Lubrication Performance in Power Cylinder Systems (No. 2019-01-2364); SAE Technical Paper: Warrendale, PA, USA; Troy, MI, USA, 2019. [Google Scholar]
  4. Wang, Y.; Tung, S.C. Scuffing and wear behavior of aluminum piston skirt coatings against aluminum cylinder bore. Wear 1999, 225, 1100–1108. [Google Scholar] [CrossRef]
  5. Wang, Y.; Brogan, K.; Tung, S.C. Wear and scuffing characteristics of composite polymer and nickel/ceramic composite coated piston skirts against aluminum and cast iron cylinder bores. Wear 2001, 250, 706–717. [Google Scholar] [CrossRef]
  6. Zhang, G.; Li, W.Y.; Cherigui, M.; Zhang, C.; Liao, H.; Bordes, J.M.; Coddet, C. Structures and tribological performances of PEEK (poly-ether-ether-ketone)-based coatings designed for tribological application. Prog. Org. Coat. 2007, 60, 39–44. [Google Scholar] [CrossRef]
  7. Deuß, T.; Ehnis, H.; Rose, R.; Künzel, R. Friction power measurements of a fired diesel engine–influence of piston skirt coatings. MTZ Worldw. Emag. 2011, 72, 18–23. [Google Scholar] [CrossRef]
  8. Moosavian, A.; Najafi, G.; Ghobadian, B.; Mirsalim, M.; Jafari, S.M.; Sharghi, P. Piston scuffing fault and its identification in an IC engine by vibration analysis. Appl. Acoust. 2016, 102, 40–48. [Google Scholar] [CrossRef]
  9. Demas, N.G.; Erck, R.A.; Ajayi, O.O.; Fenske, G.R. Tribological studies of coated pistons sliding against cylinder liners under laboratory test conditions. Lubr. Sci. 2012, 24, 216–227. [Google Scholar] [CrossRef]
  10. Moosavian, A.; Najafi, G.; Ghobadian, B.; Mirsalim, M. The effect of piston scratching fault on the vibration behavior of an IC engine. Appl. Acoust. 2007, 126, 91–100. [Google Scholar] [CrossRef]
  11. Ogihara, H. Research into surface improvement for low friction pistons. In SAE Transactions; SAE Technical Paper; SAE: Warrendale, PA, USA; Troy, MI, USA, 2005; pp. 1182–1190. [Google Scholar]
  12. Sugimura, K. Development of Piston Surface Treatment for Internal Combustion Engine. SAE Int. J. Mater. Manuf. 2009, 1, 824–831. [Google Scholar] [CrossRef]
  13. Cho, D.H.; Lee, S.A.; Lee, Y.Z. The effects of surface roughness and coatings on the tribological behavior of the surfaces of a piston skirt. Tribol. Trans. 2009, 53, 137–144. [Google Scholar] [CrossRef]
  14. Westerfield, Z.; Totaro, P.; Kim, D.; Tian, T. An Experimental Study of Piston Skirt Roughness and Profiles on piston Friction Using the Floating Liner Engine (No. 2016-01-1043); SAE Technical Paper; SAE: Warrendale, PA, USA; Troy, MI, USA, 2016. [Google Scholar]
  15. Dursunkaya, Z.; Keribar, R.; Ganapathy, V. A model of piston secondary motion and elastohydrodynamic skirt lubrication. J. Tribol. 1994, 116, 777–785. [Google Scholar] [CrossRef]
  16. Liu, K.; Xie, Y.B.; Gui, C.L. A comprehensive study of the friction and dynamic motion of the piston assembly. Proc. Inst. Mech. Eng. Part J J. Eng. Tribol. 1998, 212, 221–226. [Google Scholar] [CrossRef]
  17. Malik, M.A.; Rashid, B.; Qasim, S.A.; Khushnood, S. Modeling and simulation of elastohydrodynamic lubrication of piston skirts considering elastic deformation in the initial engine start-up. In ASME/STLE 2004 International Joint Tribology Conference; American Society of Mechanical Engineers: New York, NY, USA, 2004; pp. 859–867. [Google Scholar]
  18. Duyar, M.; Bell, D.; Perchanok, M. A Comprehensive Piston Skirt Lubrication Model Using a Mass Conserving EHL Algorithm (No. 2005-01-1640); SAE Technical Paper; SAE: Warrendale, PA, USA; Troy, MI, USA, 2005. [Google Scholar]
  19. Greenwood, J.A.; Williamson, J.P. Contact of nominally flat surfaces. In Proceedings of the Royal Society of London. Series A. Mathematical and Physical Sciences; Royal Society: London, UK, 1966; Volume 295, pp. 300–319. [Google Scholar]
  20. Kobayashi, T. Prediction of Piston Skirt Scuffing Via 3D Piston Motion Simulation (No. 2016-01-1044); SAE Technical Paper; SAE: Warrendale, PA, USA; Troy, MI, USA, 2016. [Google Scholar]
  21. MAHLE GmbH. Pistons and Engine Testing, Stuttgart: AZ Druck and Datentechnik; MAHLE GmbH: Stuttgart, Germany, 2012. [Google Scholar]
  22. McClure, F. Numerical Modeling of Piston Secondary Motion and Skirt Lubrication in Internal Combustion Engines. Ph.D. Thesis, Massachusetts Institute of Technology, Cambridge, MA, USA, 2007. [Google Scholar]
  23. Bai, D. Modeling Piston Skirt Lubrication in Internal Combustion Engines. Ph.D. Thesis, Massachusetts Institute of Technology, Cambridge, MA, USA, 2012. [Google Scholar]
  24. Totaro, P. Modeling Piston Secondary Motion and Skirt Lubrication with Applications. Ph.D. Thesis, Massachusetts Institute of Technology, Cambridge, MA, USA, 2014. [Google Scholar]
  25. Patir, N.; Cheng, H.S. An average flow model for determining effects of three-dimensional roughness on partial hydrodynamic lubrication. J. Lubr. Technol. 1978, 100, 12–17. [Google Scholar] [CrossRef]
  26. Elrod, H.G. A cavitation algorithm. J. Lubr. Technol. 1981, 103, 350–354. [Google Scholar] [CrossRef]
  27. Patir, N.; Cheng, H.S. Application of average flow model to lubrication between rough sliding surfaces. J. Lubr. Technol. 1979, 101, 220–229. [Google Scholar] [CrossRef]
  28. Johnson, K.L. Contact Mechanics; Cambridge University Press: Cambridge, UK, 1987. [Google Scholar]
  29. Sato, O.; Takiguchi, M.; Takayuki, A.; Seki, Y.; Fujimura, K.; Tateishi, Y. Improvement of Piston Lubrication in a Diesel Engine by Means of Cylinder Surface Roughness (No. 2004-01-0604); SAE Technical Paper; SAE: Warrendale, PA, USA; Troy, MI, USA, 2004. [Google Scholar]
Figure 1. Sketch of the power cylinder system in internal combustion engines with forces on the piston during early expansion stroke.
Lubricants 07 00098 g001
Figure 2. RS12 piston break-in friction mean effective pressure (FMEP) for 4-bar indicated mean effective pressure (IMEP).
Lubricants 07 00098 g002
Figure 3. Profile of the centerline of RS12 piston skirt on the thrust side before and after break-in.
Lubricants 07 00098 g003
Figure 4. Original triangular waviness on the piston skirt.
Lubricants 07 00098 g004
Figure 5. Worn waviness on the piston skirt.
Lubricants 07 00098 g005
Figure 6. Determining the worn height z 0 .
Lubricants 07 00098 g006
Figure 7. FMEP reduction of RS12 profile with different maximum worn height allowed.
Lubricants 07 00098 g007
Figure 8. Friction forces on the thrust side from contact pressure when the maximum worn heights are 0, 2 and 5 micrometers.
Lubricants 07 00098 g008
Figure 9. Friction forces on the anti-thrust side from contact pressure when the maximum worn heights are 0, 2 and 5 micrometers.
Lubricants 07 00098 g009
Figure 10. Friction forces on the thrust side from hydrodynamic pressure when the maximum worn heights are 0, 2 and 5 micrometers.
Lubricants 07 00098 g010
Figure 11. Friction forces on the anti-thrust side from hydrodynamic pressure when the maximum worn heights are 0, 2 and 5 micrometers.
Lubricants 07 00098 g011
Figure 12. 1D hydrodynamic pressure generation of the piston skirt before and after break-in.
Lubricants 07 00098 g012
Figure 13. Lateral forces supported by hydrodynamic pressure when the maximum worn heights are 0, 2, and 5 micrometers.
Lubricants 07 00098 g013
Figure 14. Lateral forces supported by contact pressure when the maximum worn heights are 0, 2, and 5 micrometers.
Lubricants 07 00098 g014
Figure 15. Difference in minimum valley clearance on the thrust side among cases.
Lubricants 07 00098 g015
Figure 16. Distributions of valley clearance on the thrust side of the skirt at 430-degree crank angle.
Lubricants 07 00098 g016
Figure 17. Distributions of peak clearance on the thrust side of the skirt at 430-degree crank angle.
Lubricants 07 00098 g017
Figure 18. Gaps along the centerline of the skirt on the thrust side at 430-degree crank angle.
Lubricants 07 00098 g018
Figure 19. Distributions of hydrodynamic pressure on the thrust side of the skirt at 430-degree crank angle.
Lubricants 07 00098 g019
Figure 20. Distributions of contact pressure on the thrust side of the skirt at 430-degree crank angle.
Lubricants 07 00098 g020
Figure 21. Friction forces on the thrust side with different wavelengths of waviness when the maximum worn height is 6 micrometers.
Lubricants 07 00098 g021
Figure 22. Average contact pressure as a function of valley clearance and worn height when wavelength is 150 micrometers.
Lubricants 07 00098 g022
Figure 23. Average contact pressure as a function of valley clearance and worn height when wavelength is 450 micrometers.
Lubricants 07 00098 g023
Table 1. Floating liner engine (FLE) specifications.
ParameterValueUnit
Displaced volume0.496L
Stroke92.8Mm
Bore82.51Mm
Compression ratio10:1-
Maximum BMEP0.7MPa
Maximum engine speed3000rpm

