Article

Interactions of Ethanol with Friction Modifiers in Model Engine Lubricants

1
School of Engineering, Universidade Federal do Rio Grande, Campus Carreiros, Av, Itália, km 8, Rio Grande 96203-900, RS, Brazil
2
Tribology Group, Imperial College, South Kensington, London SW7 2AZ, UK
*
Author to whom correspondence should be addressed.
Lubricants 2019, 7(11), 101; https://doi.org/10.3390/lubricants7110101
Submission received: 21 October 2019 / Revised: 8 November 2019 / Accepted: 12 November 2019 / Published: 15 November 2019

Abstract

:
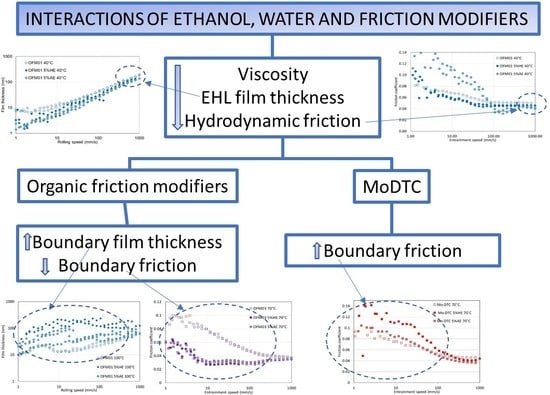
When employed as an engine fuel, ethanol can accumulate in the lubricant during use. Previous work has shown that ethanol contamination affects friction and elastohydrodynamic lubrication (EHL) film formation, and also the growth and stability of anti-wear tribofilms. The present work uses spacer-layer ultrathin interferometry and MTM tests to investigate how ethanol (both hydrated and anhydrous) interacts with friction modifiers in model lubricants. Small proportions (5 wt %) of ethanol were added to solutions of friction modifiers (one MoDTC and three organic friction modifiers) in a Group I base oil. For the three organic friction modifiers, the presence of ethanol promoted the formation of thick viscous boundary films so that very low friction coefficients were measured at low entrainment speeds. For the MoDTC additive, the presence of ethanol prevented the formation of a low friction film at low speeds at 70 °C, but this effect disappeared at 100 °C, probably due to ethanol evaporation.

Graphical Abstract

1. Introduction

The threats of climate change and depletion of fossil fuels have urged the adoption of policies that can reduce greenhouse gas emissions and dependency on gasoline and diesel. One approach used by some countries—in particular Brazil [1], USA [2], Belgium [3], Sweden [4], and Canada [5]—are national programs to stimulate the production and use of renewable liquid fuels [6]. In spark ignition engines, the most widely used such renewable fuel is ethanol. Despite concerns regarding the large amount of arable land required for crops and ethanol production’s impact on grain supply, CO2 emissions for ethanol fuel are lower than gasoline even when the total ethanol production cycle is considered [7]. In addition, the presence of particulates in the exhaust system is reduced when the fuel contains ethanol [7,8].
However, analysis of lubricants after engine tests shows that unburnt ethanol fuel can contaminate the lubricant [9,10,11,12], thus resulting in tribological challenges to the engines. It is common knowledge among users that engine parts running on fuels containing large proportions of ethanol tend to suffer more severe wear when compared with gasoline-fueled engines. For this reason, recent work measured the thickness of boundary films formed by the antiwear additive zinc dialkyldithiophosphate (ZDDP) in lubricants contaminated with ethanol. When compared with neat lubricants, the contaminated lubricants presented much lower rates of ZDDP tribofilm formation, resulting in very thin tribofilms. In other tests where a thick and stable tribofilm was allowed to form from the neat lubricant and ethanol was later added, rubbing in the presence of ethanol led to significant removal of the pre-formed tribofilm [13]. Advanced chemical analysis of the tribofilms formed in the presence of ethanol has suggested oxidation of sulfur species into sulfites and reduction in the length of the phosphate chains [14]. Water contamination has also been shown to reduce the thickness and change the structure of ZDDP tribofilms, apparently by reducing the length of the polyphosphate chains [15].
On the other hand, the effects of ethanol contamination on friction are not always detrimental. De Silva and coworkers have shown that in combination with water, ethanol can produce a considerable friction reduction [12,16]. Our previous work has also shown friction reduction for lubricants contaminated with anhydrous ethanol and hydrated ethanol under certain conditions because ethanol fuel can be either anhydrous (when supplied dissolved in gasoline) or hydrated when used on its own. Film thickness was measured using ultrathin interferometry and Stribeck curves were obtained using a mini-traction-machine (MTM) test rig. Ethanol reduced film thickness and friction in the full-film and mixed elastohydrodynamic lubrication (EHD) regimes because the lubricant viscosity was lowered. In the boundary regime, film thickness increased and friction was reduced for ethanol/water in base oil, but the opposite (thinner boundary film and higher boundary friction) was observed in a formulated oil without friction modifiers. For the base oil, apparent oxidation reduced boundary friction, whereas for the formulated oil ethanol and water hindered the formation of detergent and ZDDP tribofilms [17]. However, none of these studies addressed how ethanol interacts with friction modifiers present in the lubricant.
Friction modifiers (FMs) are added to engine lubricants to reduce friction in the boundary lubrication regime. The two main groups of FMs are organic friction modifiers (OFMs) and organomolybdenum-based additives [18]. OFMs are long chain surfactants with a polar group that adsorbs onto metal surfaces preventing metal-to-metal contact and a lipophilic group (long alkyl chain) that enables additive solution in the lubricant, as well as providing a “cushioning effect” in the adsorbed layer that further prevents metallic contact [19]. The adsorbed film can consist of either monolayers or thick viscous layers. For example, copper carboxylate, which is widely used as organic friction modifier, tends to form thick boundary films. Also, it has been shown that for other OFMs such as carboxylic acids, the presence of water induces the formation of thick boundary films, apparently by the formation of an iron carboxylate film [18]. Therefore, a strong interaction between OFMs, ethanol, and water might be expected, particularly considering the strong interaction between alcohols and additives reported in the literature [20].
Mo-based friction modifiers were originally developed as anti-wear additives, but can also provide very low boundary friction under certain contact conditions and thus have been widely used as friction modifiers in engine oils since the 1980s [18]. Oil-soluble organo-molybdenum additives differ from colloidal molybdenum disulphide (MoS2) used in oils and greases since the 1940s [21] because they dissolve in the lubricant and only form low-friction MoS2 when rubbing between the surfaces occurs. Molybdenum dialkyldithiocarbamate (MoDTC) is the most widely used oil-soluble organo-molybdenum friction modifier additive. The additive functions by forming nanosheets of MoS2 in the tribofilm. Although these are very small and only cover a small proportion of the surface they form preferentially on the tips of the asperities and therefore are very efficient in reducing friction [22]. Initial friction for lubricants containing MoDTC is high but it then drops to much lower values when the formation of MoS2 is activated. Higher temperatures and rougher surfaces tend to favor the decomposition of MoDTC and the formation of low-friction MoS2. However, whereas fully-formulated oils containing MoDTC showed friction reduction in sliding reciprocating tests, when these oils were contaminated with ethanol no friction drop was observed [18]. These results suggest that ethanol can have a negative impact on MoS2 formation. However, since the oils were fully formulated, it was difficult to assess the interaction of ethanol solely with MoDTC.
The present work aims to investigate how ethanol affects friction and film formation of both organic and soluble organo Mo-based friction modifier solutions in mineral base oil.

2. Materials and Methods

2.1. Materials

In order to investigate the interaction between friction modifiers and ethanol, the friction modifiers were added to an otherwise additive-free Group I base oil, thereby precluding possible interactions with other engine oil additives. Small amounts of ethanol (5 wt %), typical of those reached in practice, were employed. Both anhydrous and hydrated ethanol were studied, since for engines running on neat ethanol this is generally hydrated with up to 5.5 wt % water, the azeotrope, to reduce production costs, whereas when ethanol is used in a gasoline/ethanol blend it must be anhydrous because water is not soluble in gasoline. In fact, it is plausible that in a real engine the ethanol contaminating the lubricant is more likely to be hydrated even if the fuel is anhydrous ethanol due to the water generated from the combustion and the large affinity between water and ethanol. However, even if that is the case, the investigation of both anhydrous and hydrated ethanol is highly desirable because it enables one to observe effects that are exclusively due to the presence of water.
One MoDTC and three organic friction modifiers (OFM01, OFM02, and OFM03) were tested. The elements other than H, C, O, and N present in the additives are listed in Table 1 and except for Mo and S in the MoDTC are at very low concentration. The amounts of friction modifier added followed recommendation from the suppliers: 0.9 wt % for MoDTC, 1.2 wt % for OFM01, 0.5 wt % for OFM02 and OFM03. The oil samples containing the additives were heated to 50 °C and magnetically stirred for 3 hours until total solution occurred. All the fluid samples investigated are summarized in Table 2, where the symbols that will be used to represent the different test conditions in the graphs presented in the Results section are listed. The test temperatures were 40, 70 and 100 °C. The test temperatures of 40 and 100 °C are commonly used for tests of engine oils. The temperature of 40 °C tries to simulate lubricant temperatures when the engine runs at lower speeds and short distances, such as some urban drive conditions, whereas higher temperatures (100 °C) relate to higher speed driving conditions. The intermediate temperature of 70 °C was chosen because it is close to the evaporation point of ethanol, allowing the simulation of a higher temperature condition without substantial ethanol evaporation from the lubricant.
An SVM3000 Stabinger viscometer (Anton-Paar, Graz, Austria) was used to measure the rheological properties (Table 3) of the fluids at the test temperatures, 40, 70, and 100 °C, but viscosity and density of the fluids containing ethanol could not be measured at 100 °C due to rapid evaporation of ethanol, which formed numerous bubbles in the measurement tubes. Anhydrous ethanol (AE) reduced the viscosity more than hydrated ethanol (HE), as noted in previous studies [13,17].

2.2. Friction Tests

Friction tests were carried out using a mini traction machine (MTM) in which a ball is loaded and rotated against the flat surface of a rotating disc. Ball and disc are driven by two independent DC motors so that any combination of rolling and sliding can be obtained. In this study, friction was measured over a range of entrainment speeds (mean rolling speed) at a fixed slide roll ratio (SRR) to obtain Stribeck curves. SRR, which was held constant at a value of 50%, is defined as (Uball − Udisk)/U, where |Uball − Udisk| is the sliding speed and U is the entrainment or mean rolling speed, given by U = (Uball + Udisk)/2. When SRR = 0% (i.e. Uball = Udisk), pure rolling contact occurs and when SRR = 200% (i.e. either Uball or Udisk = 0), pure sliding contact occurs, while values between 0 and 200% represent mixed sliding/rolling contact. The tests started at a mean rolling speed of 1000 mm/s, which was continuously reduced (in 31 logarithmically-spaced stages) down to 1 mm/s. The disc was fully-immersed in lubricant and the temperature of the lubricant and contact was controlled to a set value within ±0.5 °C. Set temperatures of 40, 70, and 100 °C were studied. The balls were AISI 52100 bearing steel with diameter 19 mm, Young′s modulus 210 GPa and nominal root mean square roughness (Rq) between 10 and 13 nm while the discs were AISI 52100 steel with nominal Rq between 25 and 30 nm. The load applied was 20 N, corresponding to a maximum Hertz pressure of 0.82 GPa. Fresh balls and disks were used in each test, and were ultrasonically cleaned in Analar toluene followed by Analar acetone prior to a test. The rig was cleaned using toluene followed by Analar isopropanol before each test. At least two repeats were carried out for each test condition.
Molybdenum dialkyldithiocarbamate (MoDTC) additives are able to reduce friction coefficient in thin film, boundary lubrication conditions. It is accepted that the tribochemical reactions that lead to the formation of a low friction MoS2 tribolayer on the surfaces are most likely to occur in low entrainment speed and thus thin film conditions where there is direct sliding asperity–asperity interaction [18]. Therefore, before obtaining Stribeck curves, the samples were subject to rubbing at a normal load of 20 N and entrainment speed of 20 mm/s for 10 min at a slide-to-roll ratio (SRR) of 50%. In contrast, organic friction modifiers are expected to operate via adsorption of surfactants, therefore no prior rubbing was carried out for the MTM tests with the oils containing organic friction modifiers. Since the adsorption of surfactants is diffusion controlled, similar tests were carried out leaving the samples immersed in oil after stabilization of the test temperatures for both 10 min and 2 h before the Stribeck curves were obtained, but no significant difference was observed.

2.3. EHL Film Thickness Measurements

Ultrathin interferometry was used to measure EHL and mixed lubrication film thickness. In this, white light shines onto the contact between a flat semi-reflective glass disc and a reflective steel ball. The incident light and the light that travels through the lubricant recombine and optically interfere. The lubricant film thickness is then calculated from the wavelength of maximum constructive interference and from the refractive index of the lubricants measured at all the test temperatures (Table 4).
These tests were only carried out on the blends with organic friction modifiers since, with MoDTC, the very thin film rubbing conditions necessary for tribofilm formation would damage the semi-reflective coating on the glass disk.
In the ultrathin interferometry tests, the disc was rotated and drove the ball (diameter 19 mm, AISI 52100 steel) in nominally pure rolling. The applied load was 20 N, giving a maximum contact pressure of 0.52 GPa. A new steel ball was used for each test. Disc, ball, and test chamber were thoroughly rinsed using analar toluene followed by analar isopropanol prior to each test. First, a test was carried out at 40 °C, followed by a test at 70 °C and then a final test at 100 °C within the same test sequence, i.e., the balls and disk were not cleaned between the tests, nor was the lubricant sample changed. Mean rolling speed increased from 1 to 1000 mm/s in 31 stages with at least three film thickness values measured and averaged at each speed stage.

3. Results

3.1. Organic Friction Modifiers

3.1.1. Friction Tests

Initially, Stribeck curves are presented for the blends with the different organic friction modifiers without ethanol contamination, to evaluate how they work at the different test temperatures. For comparison, curves for the base oil are also presented. For OFM01, Figure 1a shows some boundary friction reduction at 40 °C when comparing the base oil and the blend with the friction modifier, with friction coefficients around 0.08 in the low speed regime. At 70 and 100 °C, friction coefficients dropped to around 0.06 or lower, but this varied between repeats at the same test temperature. For OFM02 (Figure 1b), boundary friction reduction was not very effective at 40 °C and friction coefficients below 0.1 could not be achieved at the lowest speeds. At 70 °C, friction coefficients between 0.06 and 0.08 were obtained in the boundary regime, which reduced further to below 0.06 at 100 °C. Figure 1c shows that the friction reducing properties of OFM03 were poor at 40 and 70 °C, but at 100 °C very low friction was achieved throughout the whole range of speeds. For all the OFMs at high speed, friction coefficient returned to the values that were obtained for the base oil, suggesting removal of the boundary film, although at 100 °C friction was slightly higher for the blends with additive in the high speed region, probably because full film lubrication conditions were not completely reached.
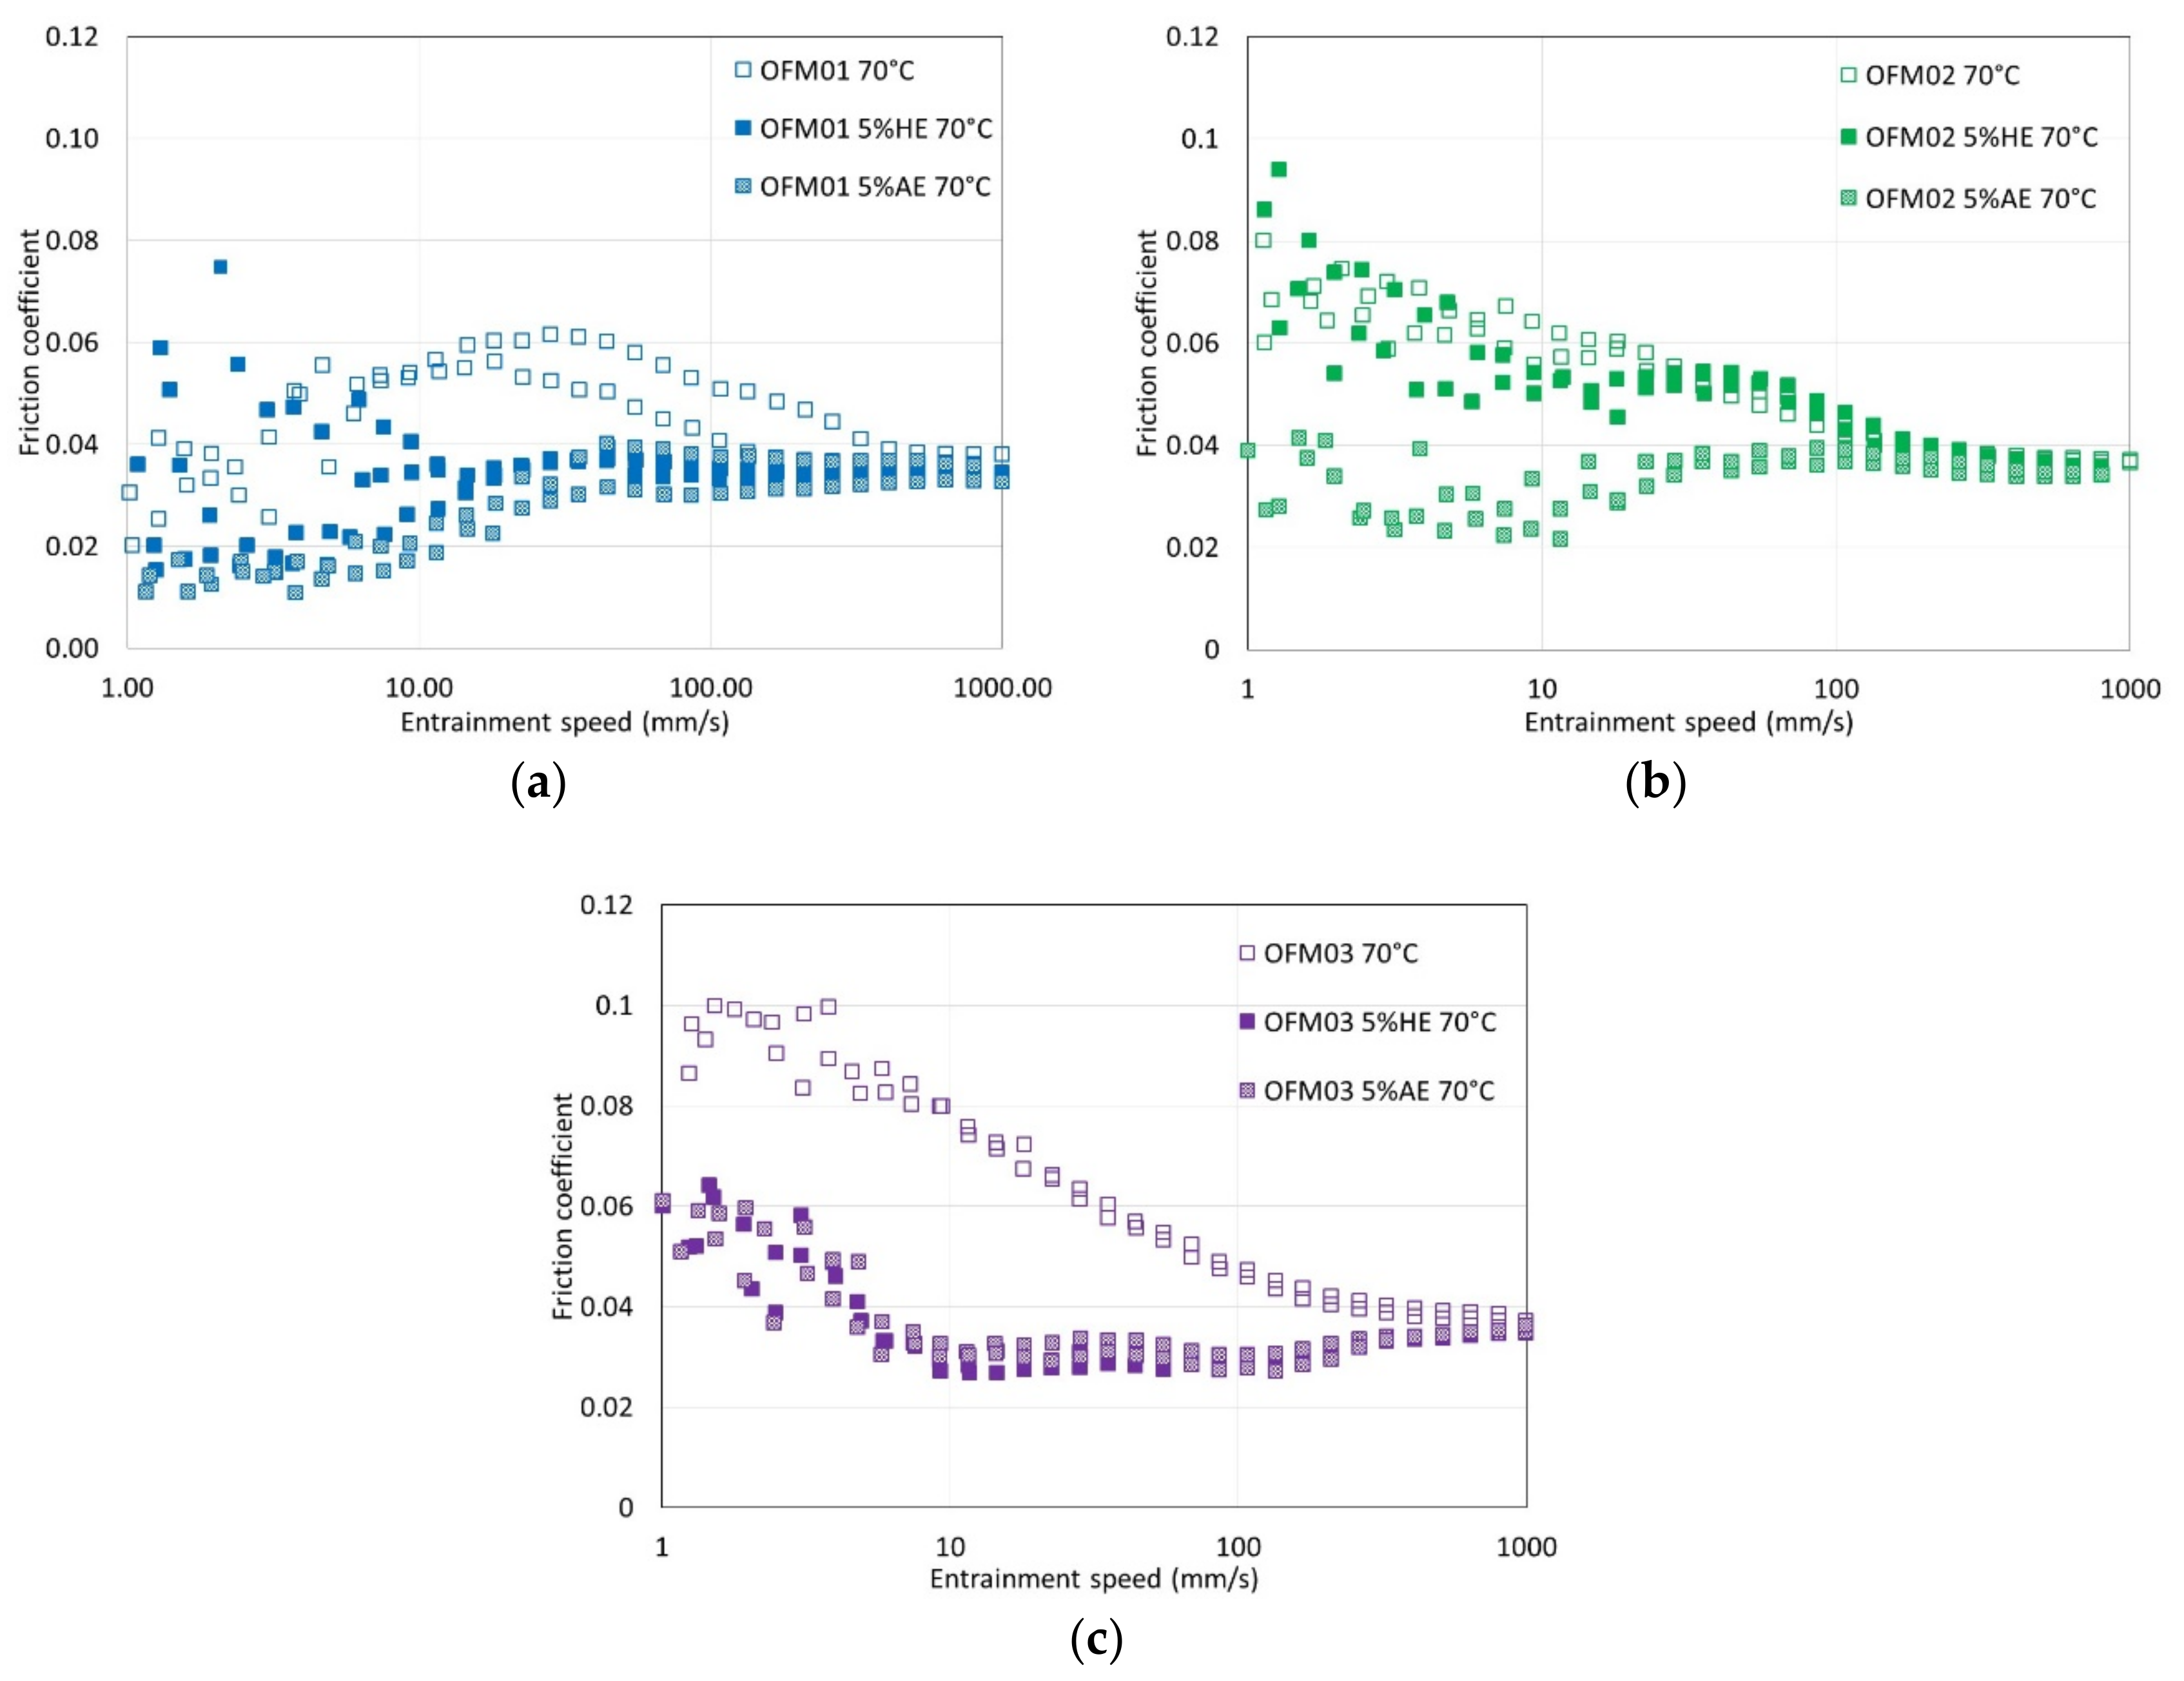
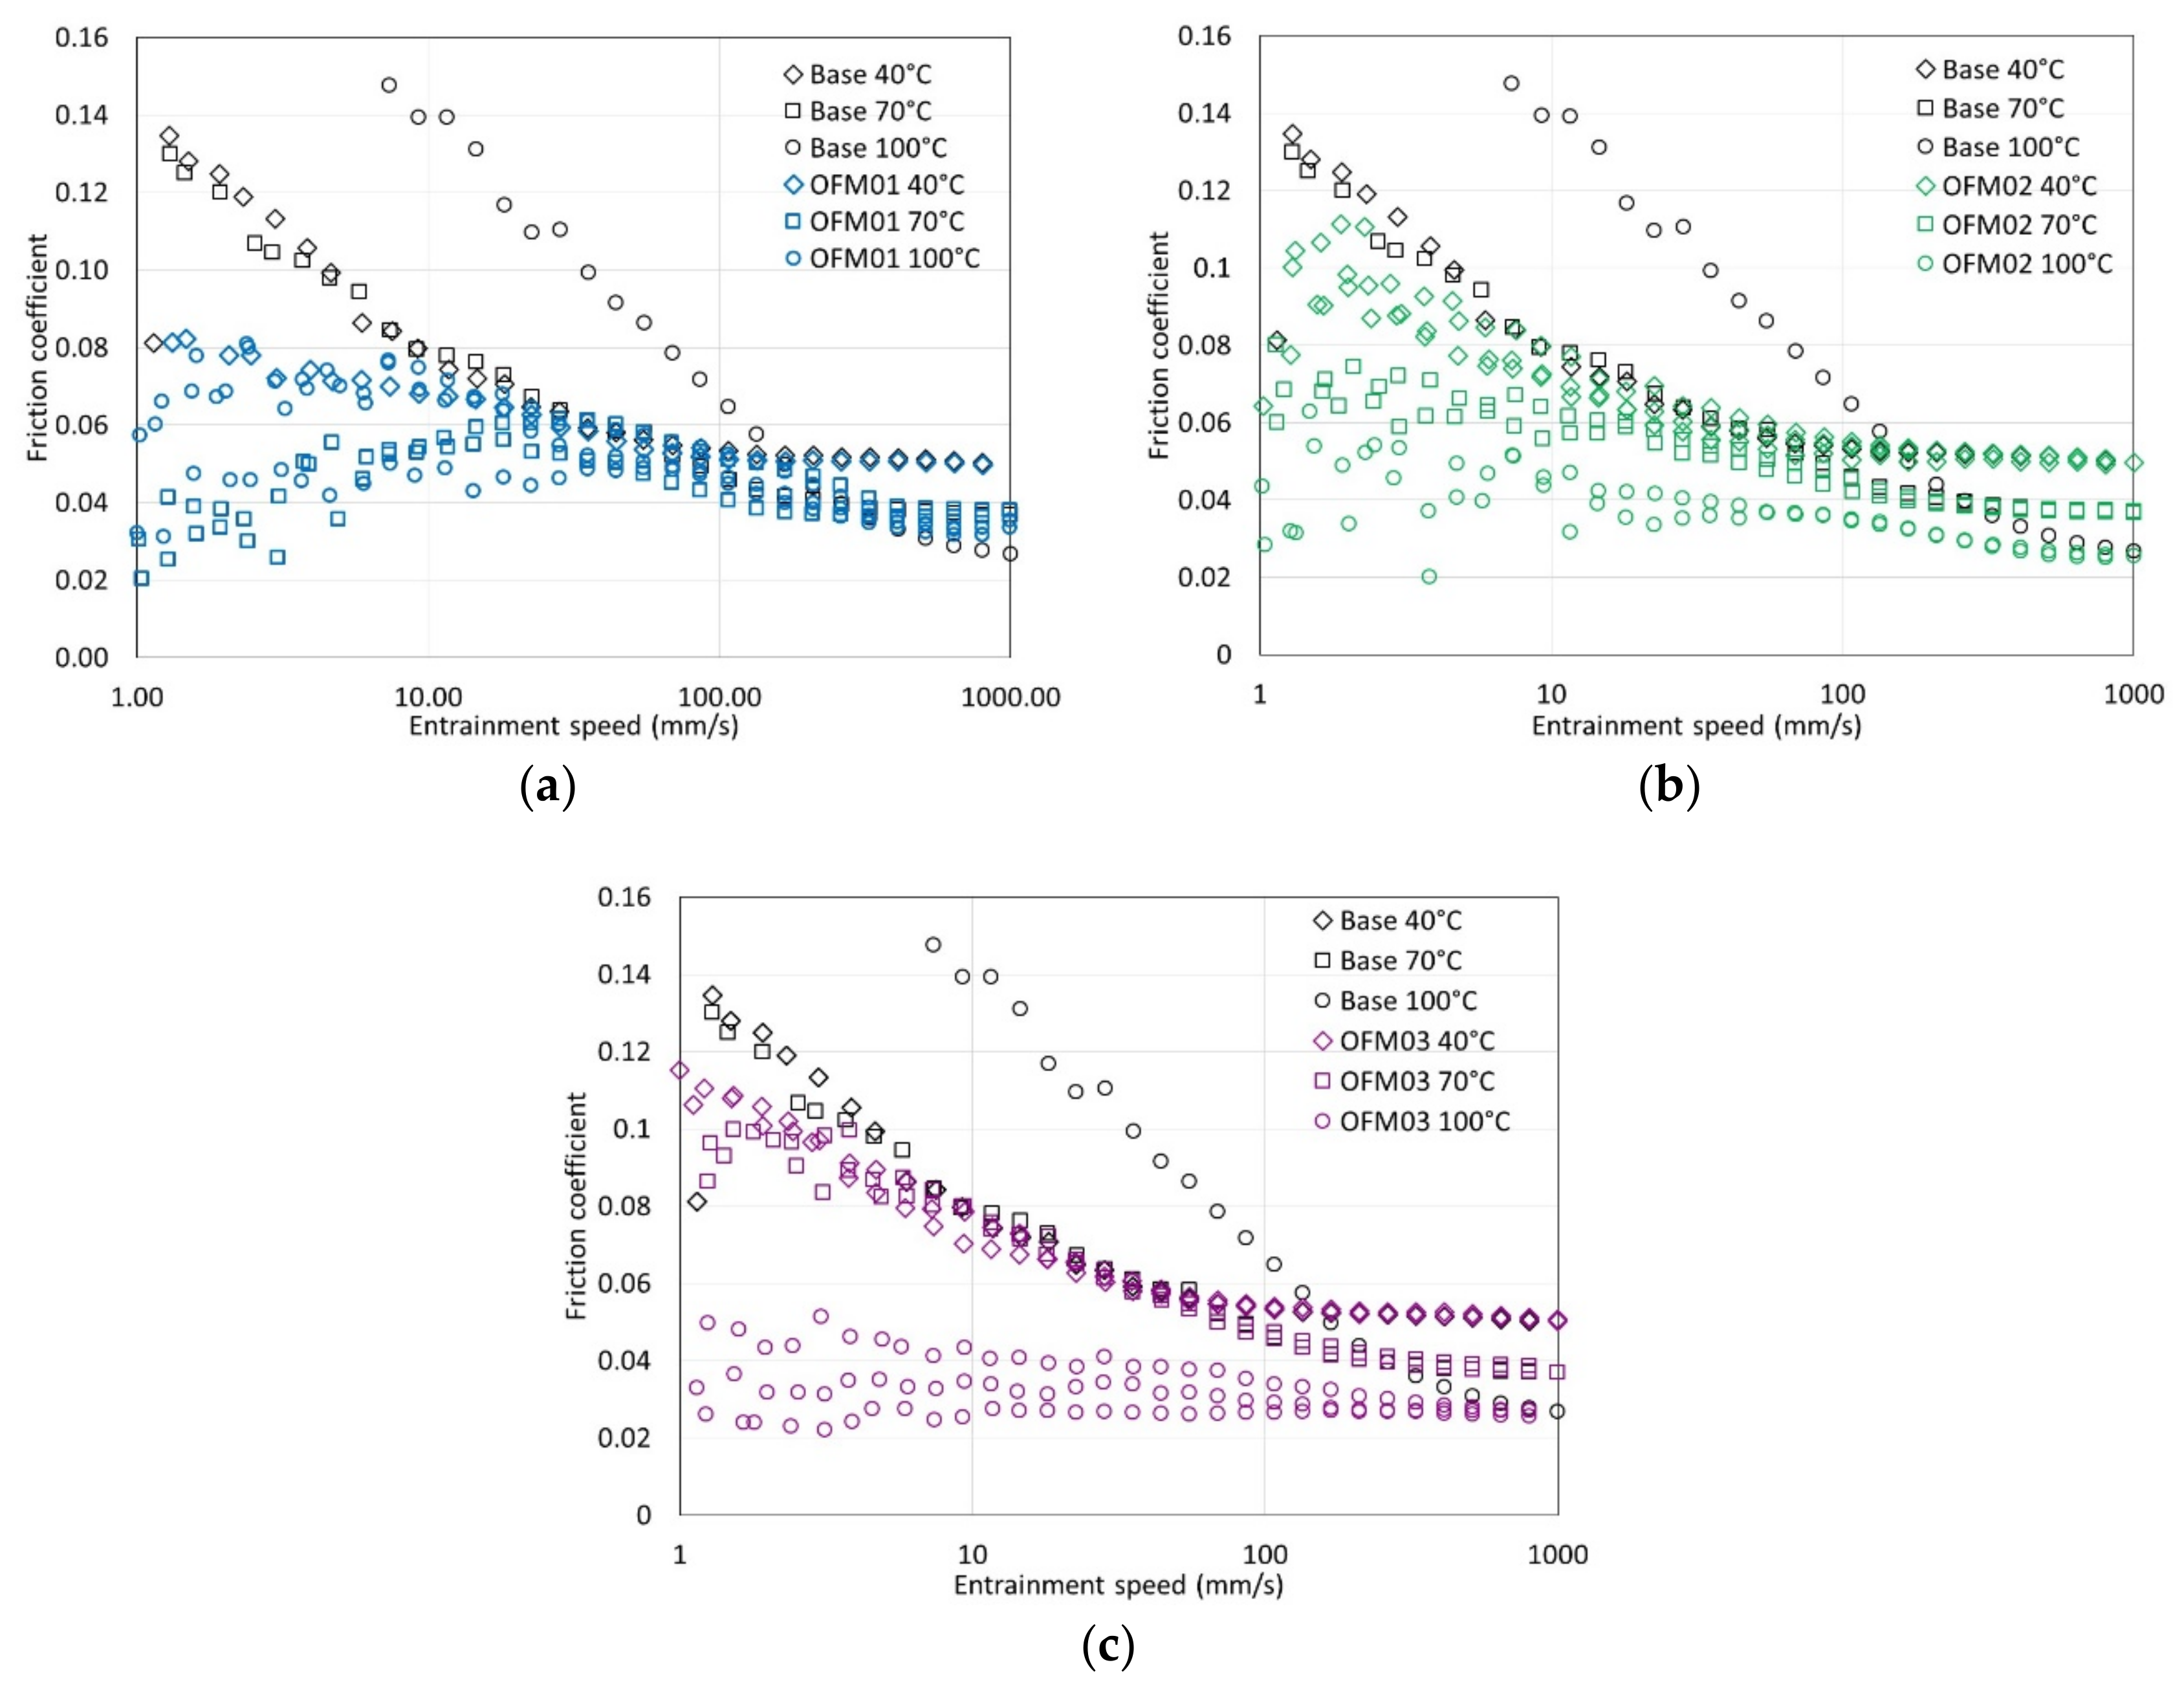
The effects of the addition of ethanol to the blends containing OFMs are shown in Figure 2, Figure 3 and Figure 4, where the empty symbols represent the uncontaminated fluids, the full symbol represent fluids with hydrated ethanol and the patterned symbols represent fluids with anhydrous ethanol. For OFM01 (Figure 2a) the presence of HE decreased friction coefficient slightly over a large range of speeds, but this effect was lost at very low entraining speed. In fact, at the lowest speeds, friction coefficient was higher for the mixture containing HE than that without ethanol. The addition of AE decreased friction at high speeds, but again friction increased drastically as speed reduced. For OFM02 (Figure 2b) the addition of HE reduced friction in the regions of high and intermediate speed, but this effect disappeared when the speed reduced. For AE, the results were less repeatable, but there was a tendency for some friction reduction at low speeds. Figure 2c shows that although OFM03 was not a very efficient friction modifier additive at 40 °C, the addition of ethanol to the mixtures helped to obtain low friction coefficients over the whole range of speeds tested, in particular for AE, which resulted in very low friction coefficients (between 0.02 and 0.05).
The effects of ethanol at 70 °C are presented in Figure 3. For OFM01 (Figure 3a), the addition of both HE and AE reduced friction significantly in the intermediate speed region, suggesting an increase in the range of speeds for which a boundary film exists on the surfaces. At the lowest speeds, no clear tendency could be seen on the addition of HE, since for some tests ethanol reduced friction slightly and for others friction increased slightly. Those tests were repeated many times, but this scattering of results at low speeds when HE was present occurred consistently. On addition of AE, the friction at low speeds was always smaller than that for the OFM solution without ethanol and increased slightly with sliding speed in the boundary region. For OFM02 (Figure 3b) HE did not have a significant effect on the Stribeck curves, but some slight tendency to reduce friction in the region of intermediate speeds was detected, which disappeared at low speed. On the other hand, the addition of AE reduced friction throughout the whole range of speeds investigated. For OFM03 (Figure 3c) both AE and HE were very efficient in reducing friction.
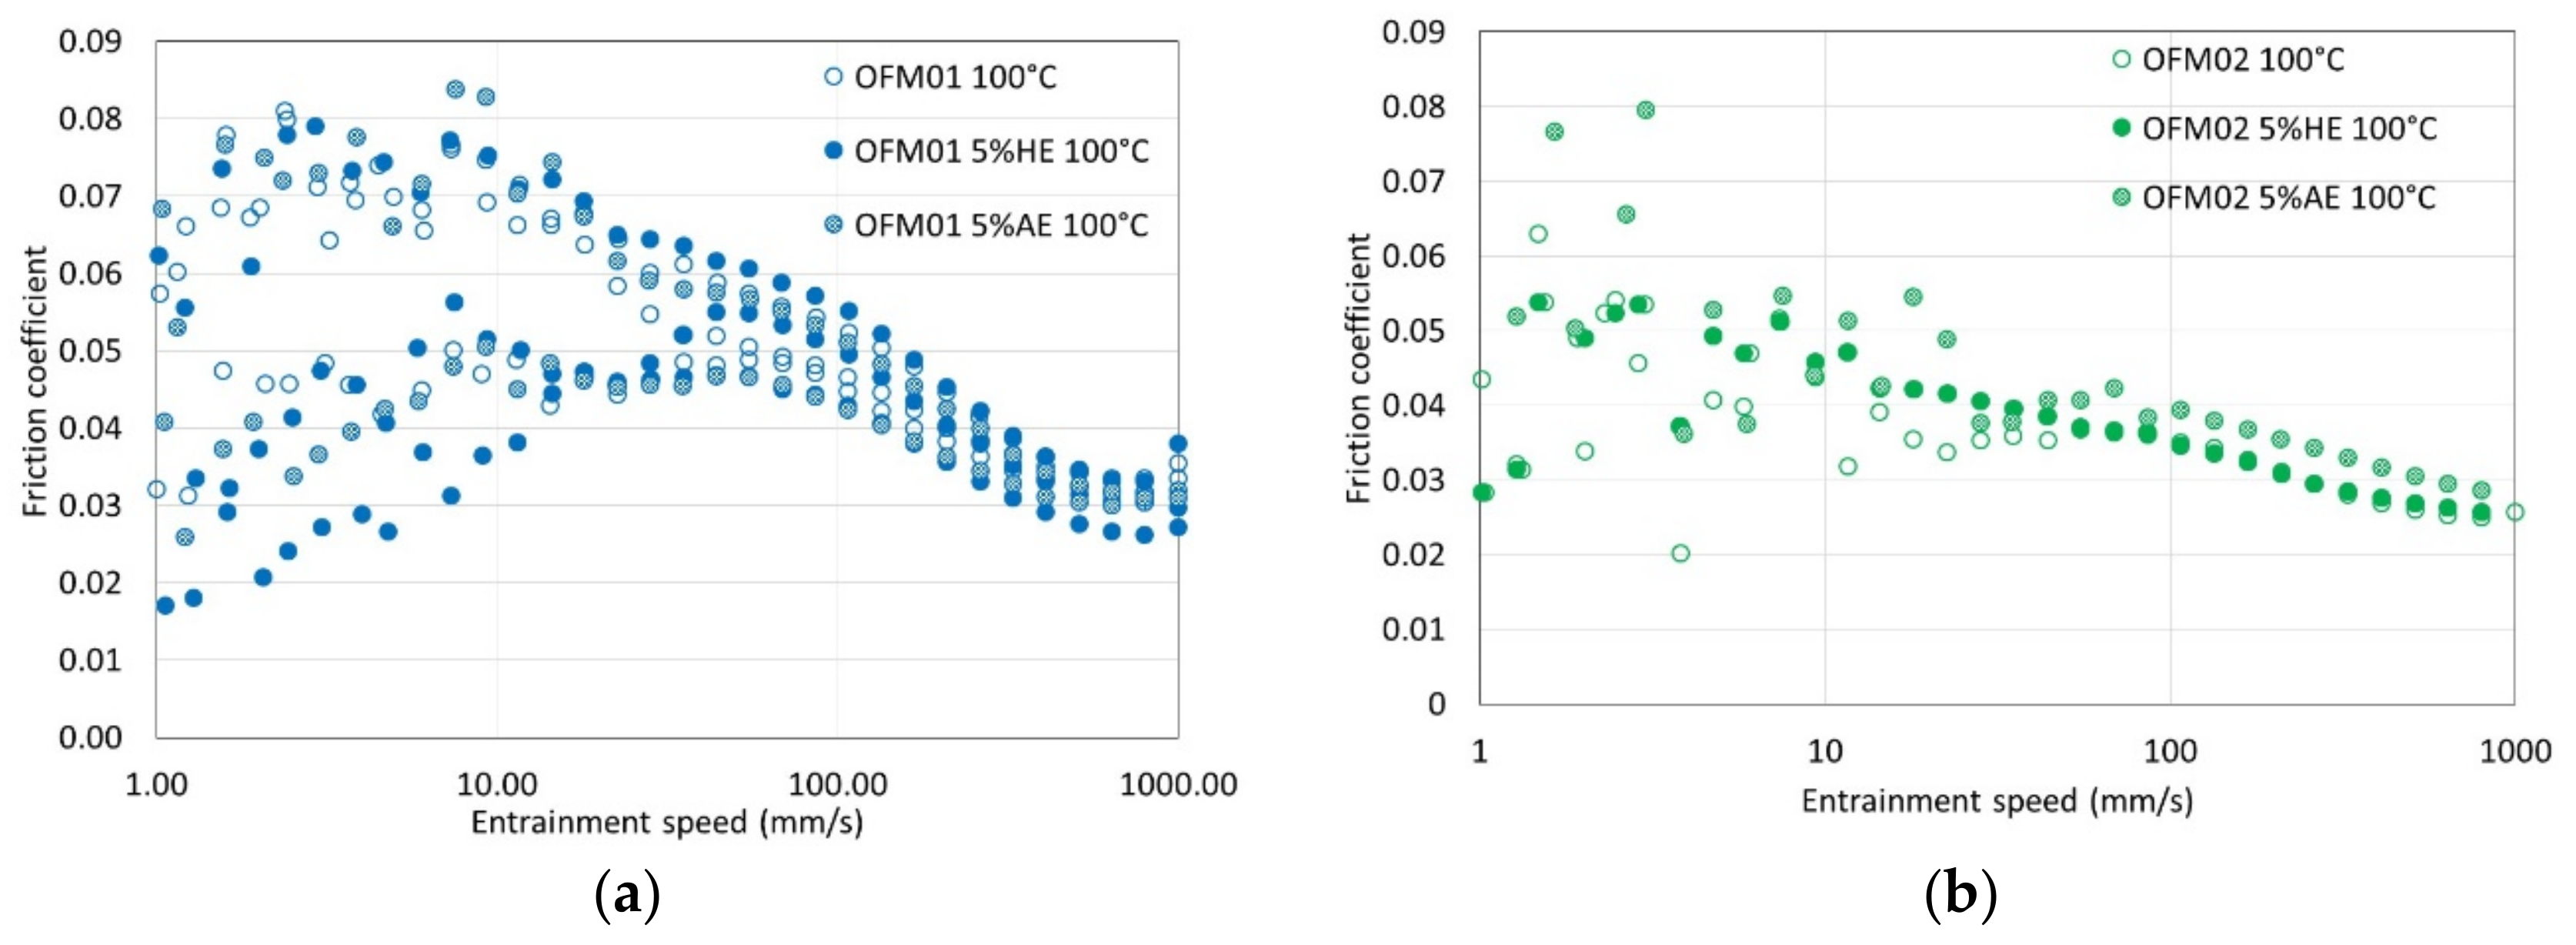
The results for the oils with organic friction modifiers contaminated with ethanol at 100 °C are shown in Figure 4. For all three OFMs, no clear tendency due to the addition of either AE or HE could be seen in the Stribeck curves.

3.1.2. EHL Film Thickness Measurements

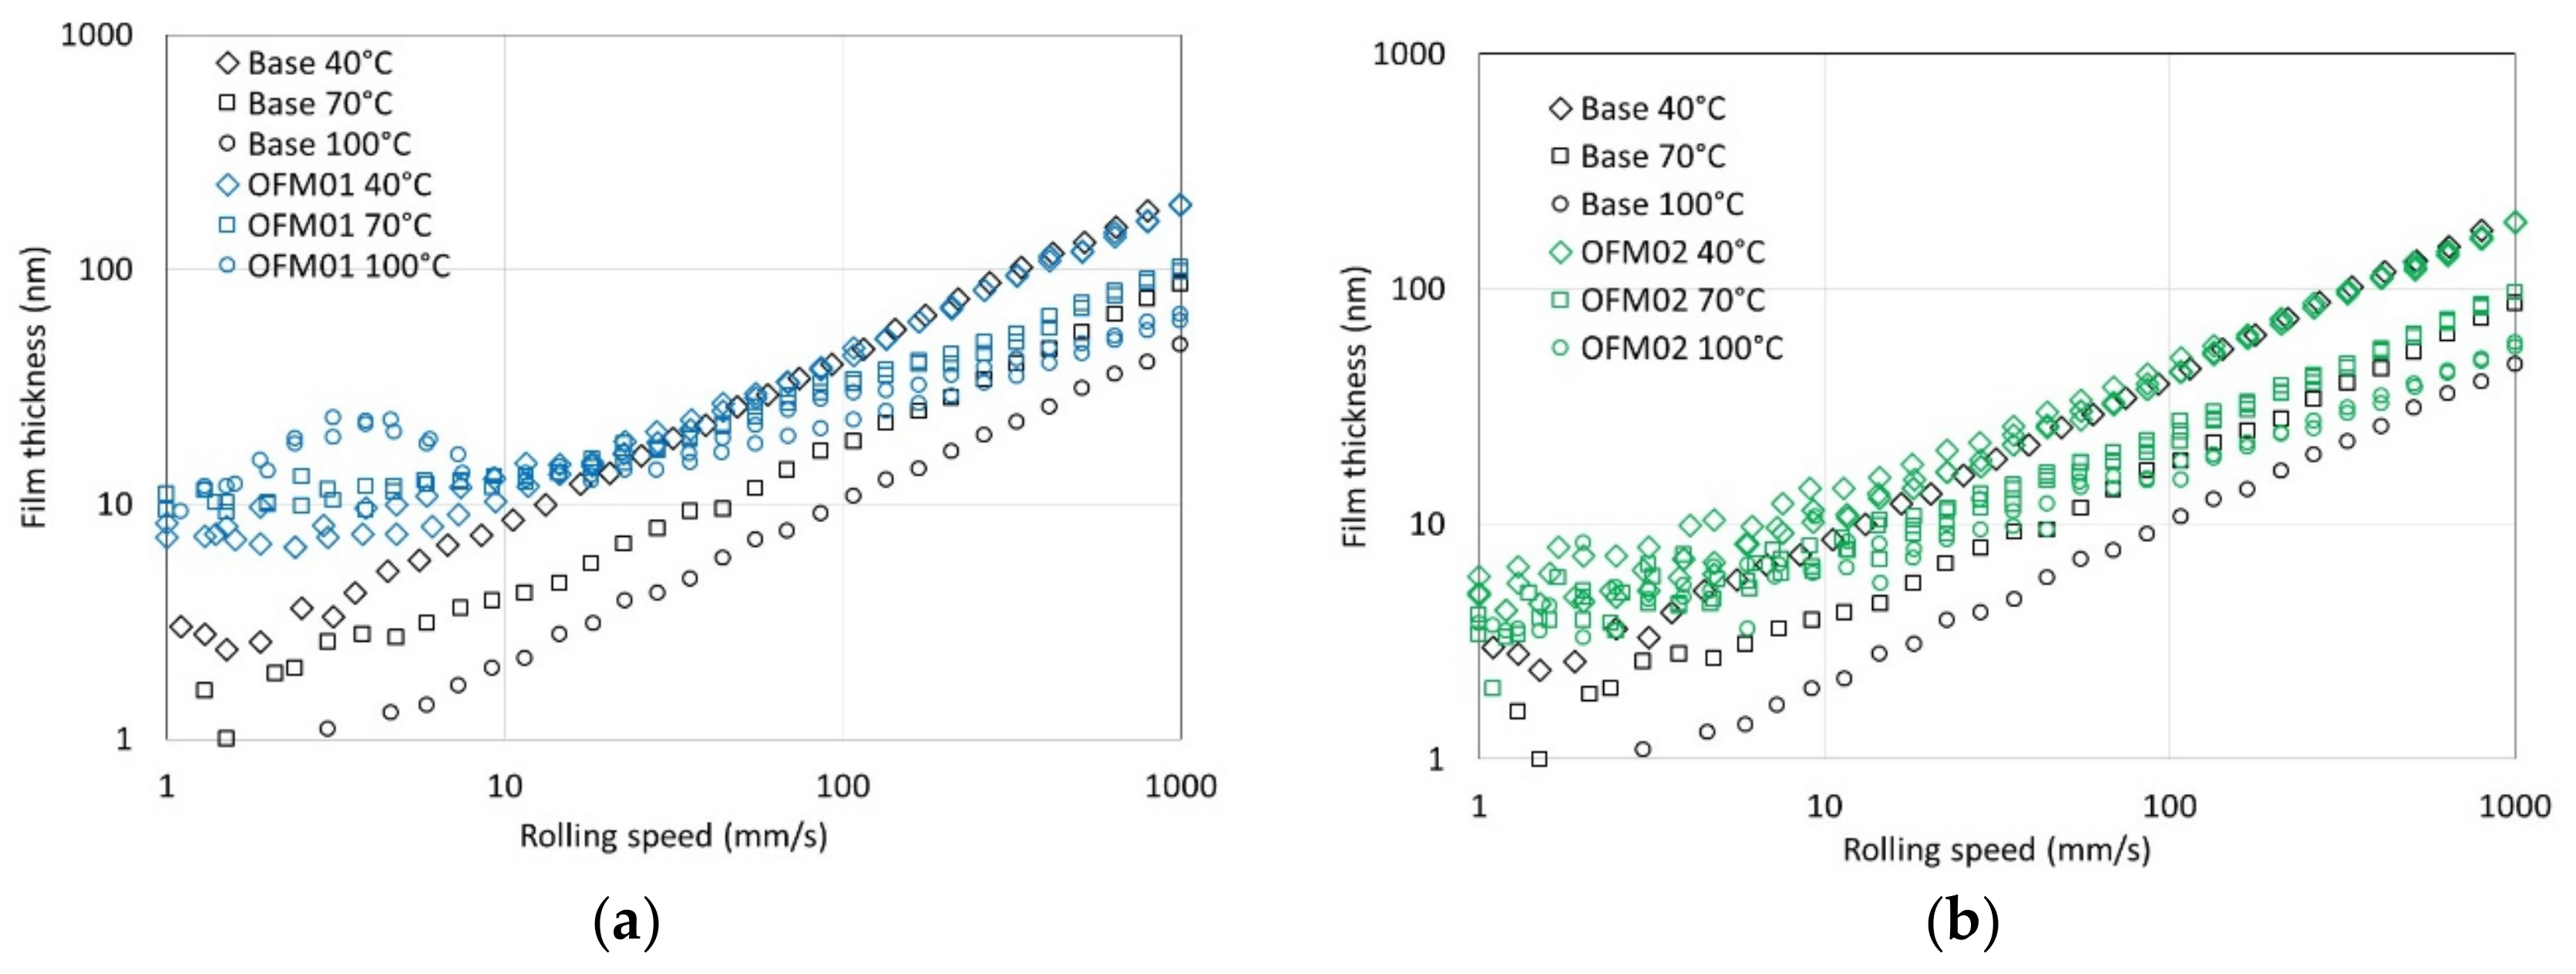
EHL film thickness values are plotted against entrainment speed showing all the repeat measurements. First, curves obtained for the different neat lubricants (without ethanol contamination) are compared with those for the base oil to assess film formation in the presence of the different organic friction modifiers (Figure 5). For OFM01 (Figure 5a) a relatively thick boundary films was evident at all temperatures tested. At 40 °C, the boundary film was slightly thinner than at 70 °C at the lowest speeds. At 100 °C, the film thickness in the boundary region started at similar values for those measured at 70 °C at the lowest speeds. However, the boundary film thickness increased to around 20 nm as speed increased before decreasing again. For OFM02 (Figure 5b) the boundary films were thinner (around 3–5 nm) than those measured for OFM01 (10 nm or more). However, the thickness of the boundary film increased slightly with speed, reaching around 8 to 10 nm. In the boundary region (low speeds) the temperature did not affect film thickness. For OFM03 (Figure 5c) the thickness of the boundary film was also independent of the test temperature. At high speeds, where full film lubrication occurs, at 40 °C all three OFMs showed the same behavior as the base oil. This suggests that any adsorbed film was completely removed at high speeds for this temperature. On the other hand, at 70 and 100 °C, the differences in film thickness between the oil with additive and the base oil remained large, around 6–9 and 10–13 nm, respectively, suggesting that at higher temperatures the adsorbed film was more strongly attached, remaining on the surface.
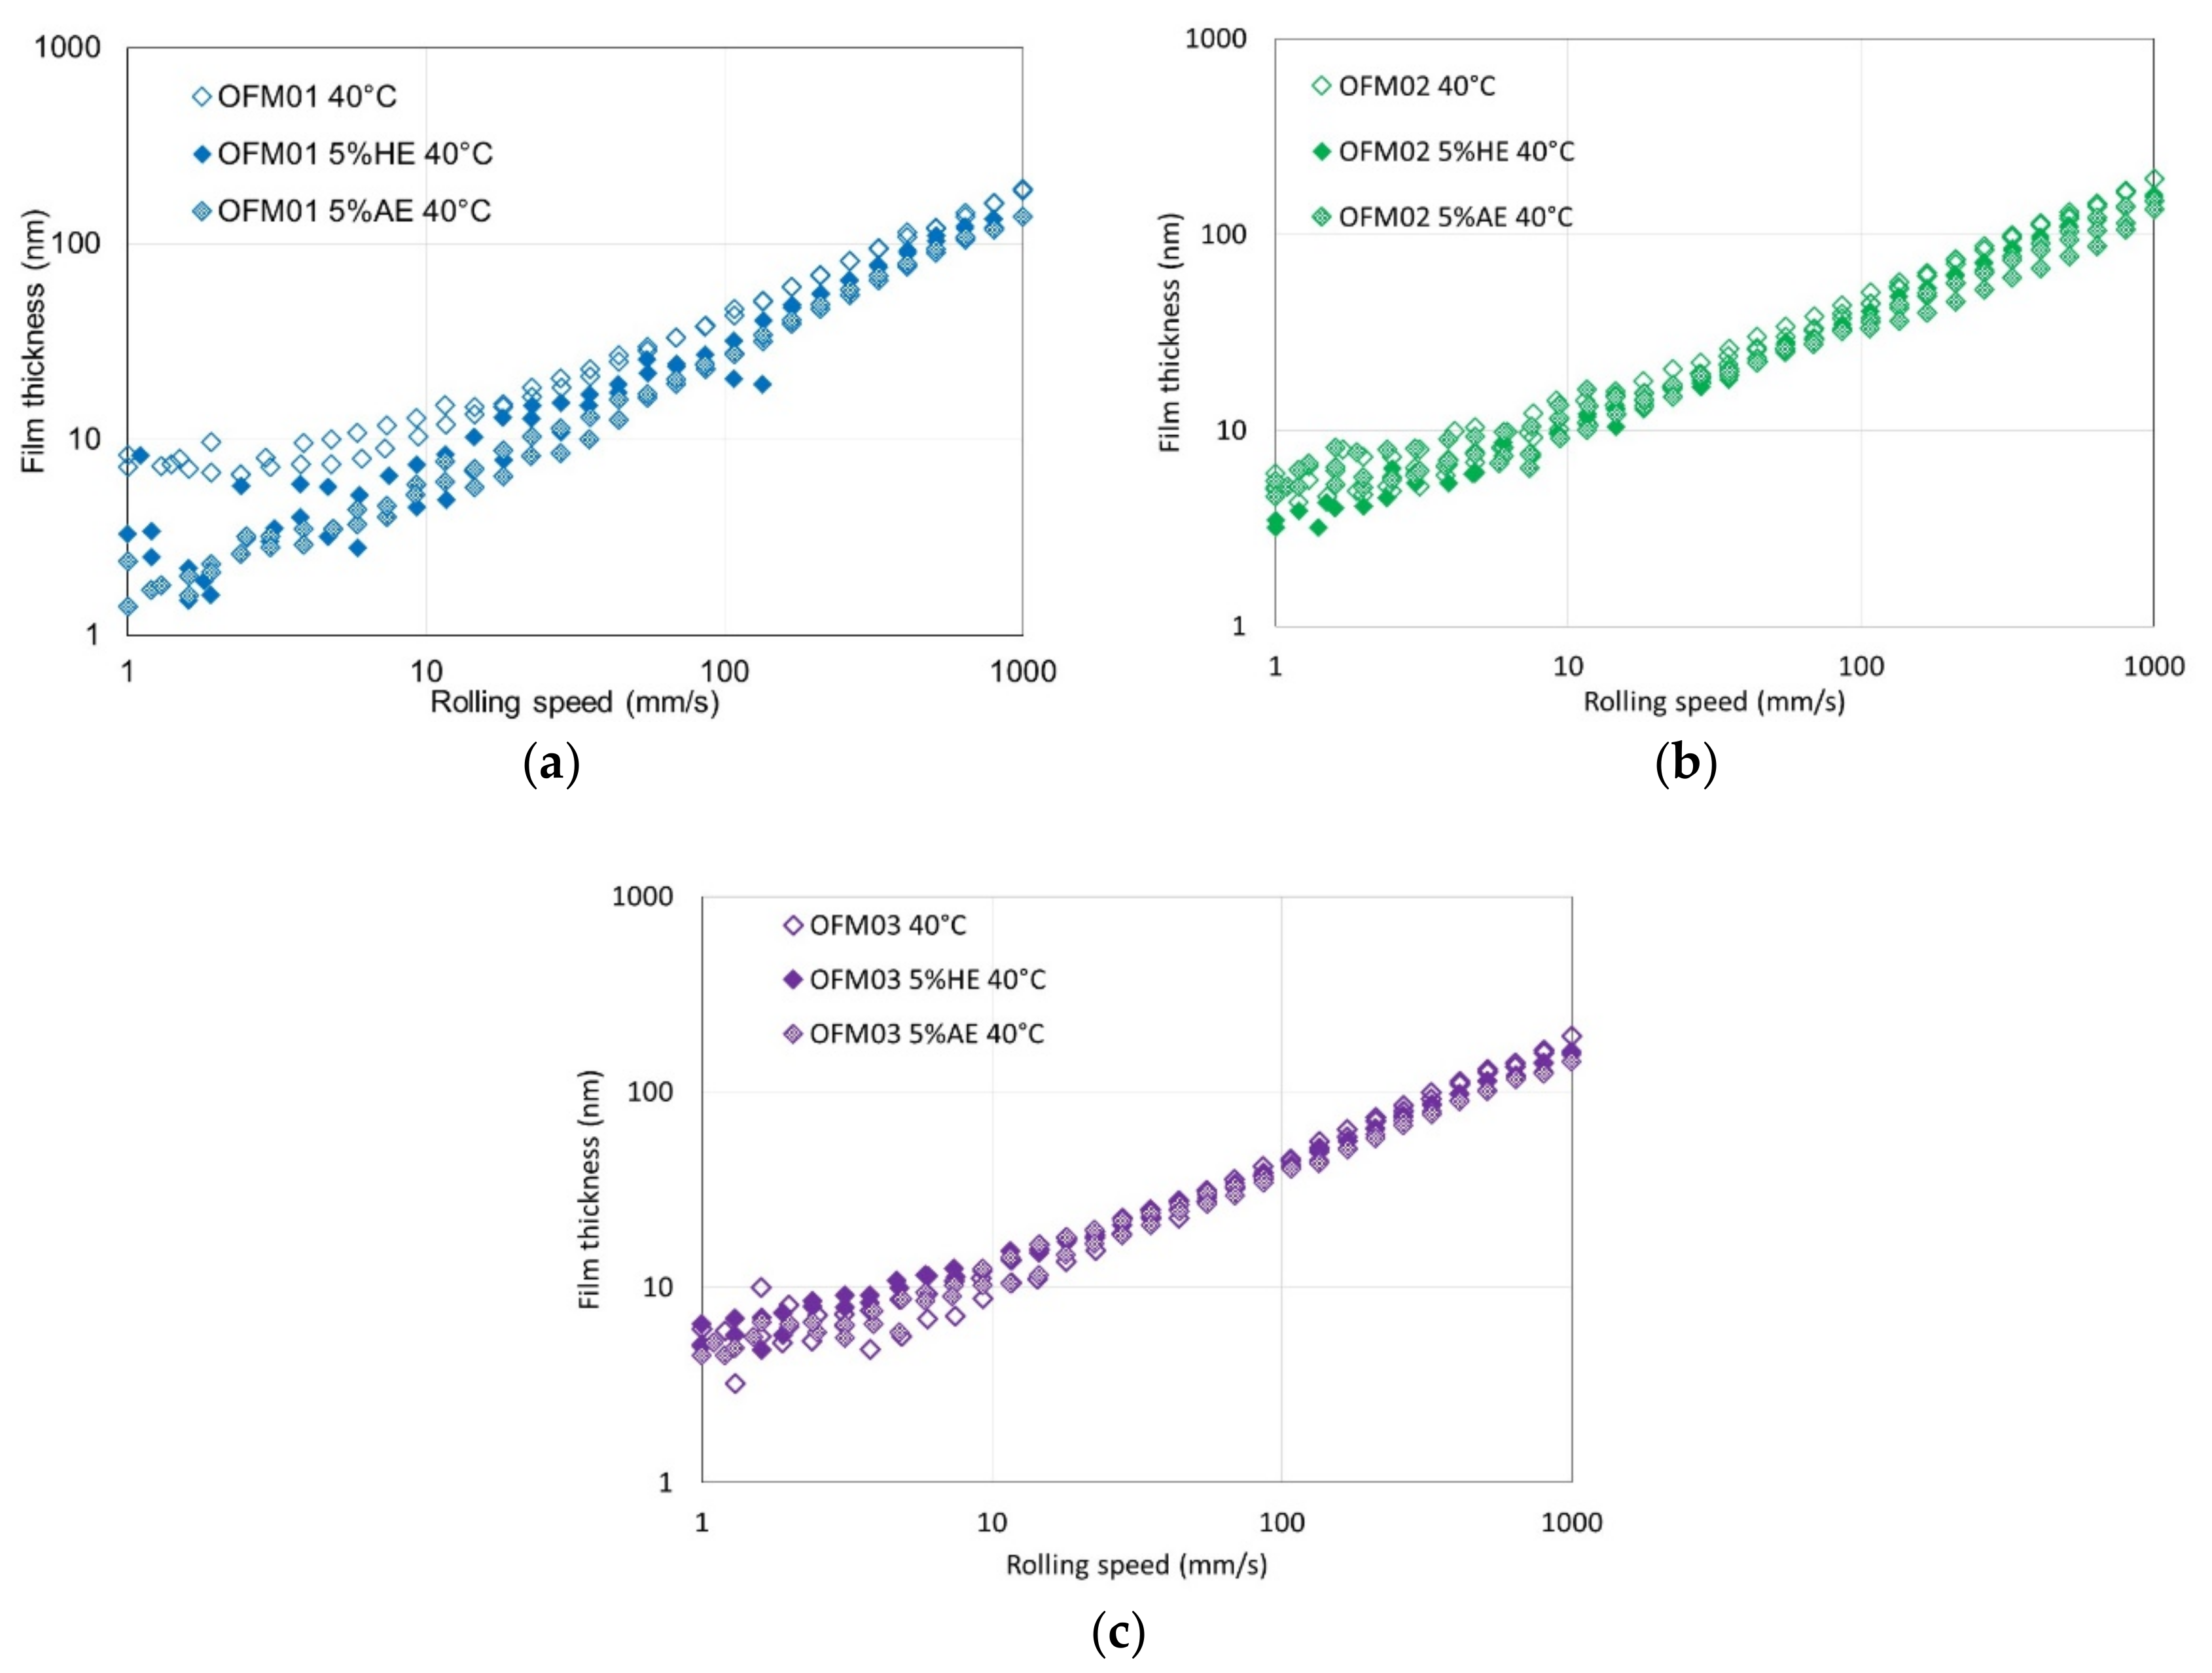
The effects of ethanol at 40 °C are presented in Figure 6. For all the OFMs, at high speeds the film thickness reduced when ethanol was added, probably due to the reduction in viscosity in the lubricant (see Table 3). The reduction in film thickness in the full film region was larger for when AE was added than with HE, consistent with the order of reduction in viscosity. In the boundary region, for OFM01 (Figure 6a) the addition of ethanol (both AE and HE) reduced boundary film formation, and in the low speed region the curves resembled those of the base oil. Another observable feature is that when ethanol was added the variation of film thickness with speed became less regular. However, for OFM02 and OFM03 (Figure 6b,c) the addition of either HE or AE did not influence boundary film thickness significantly, which remained around 4–6 nm.
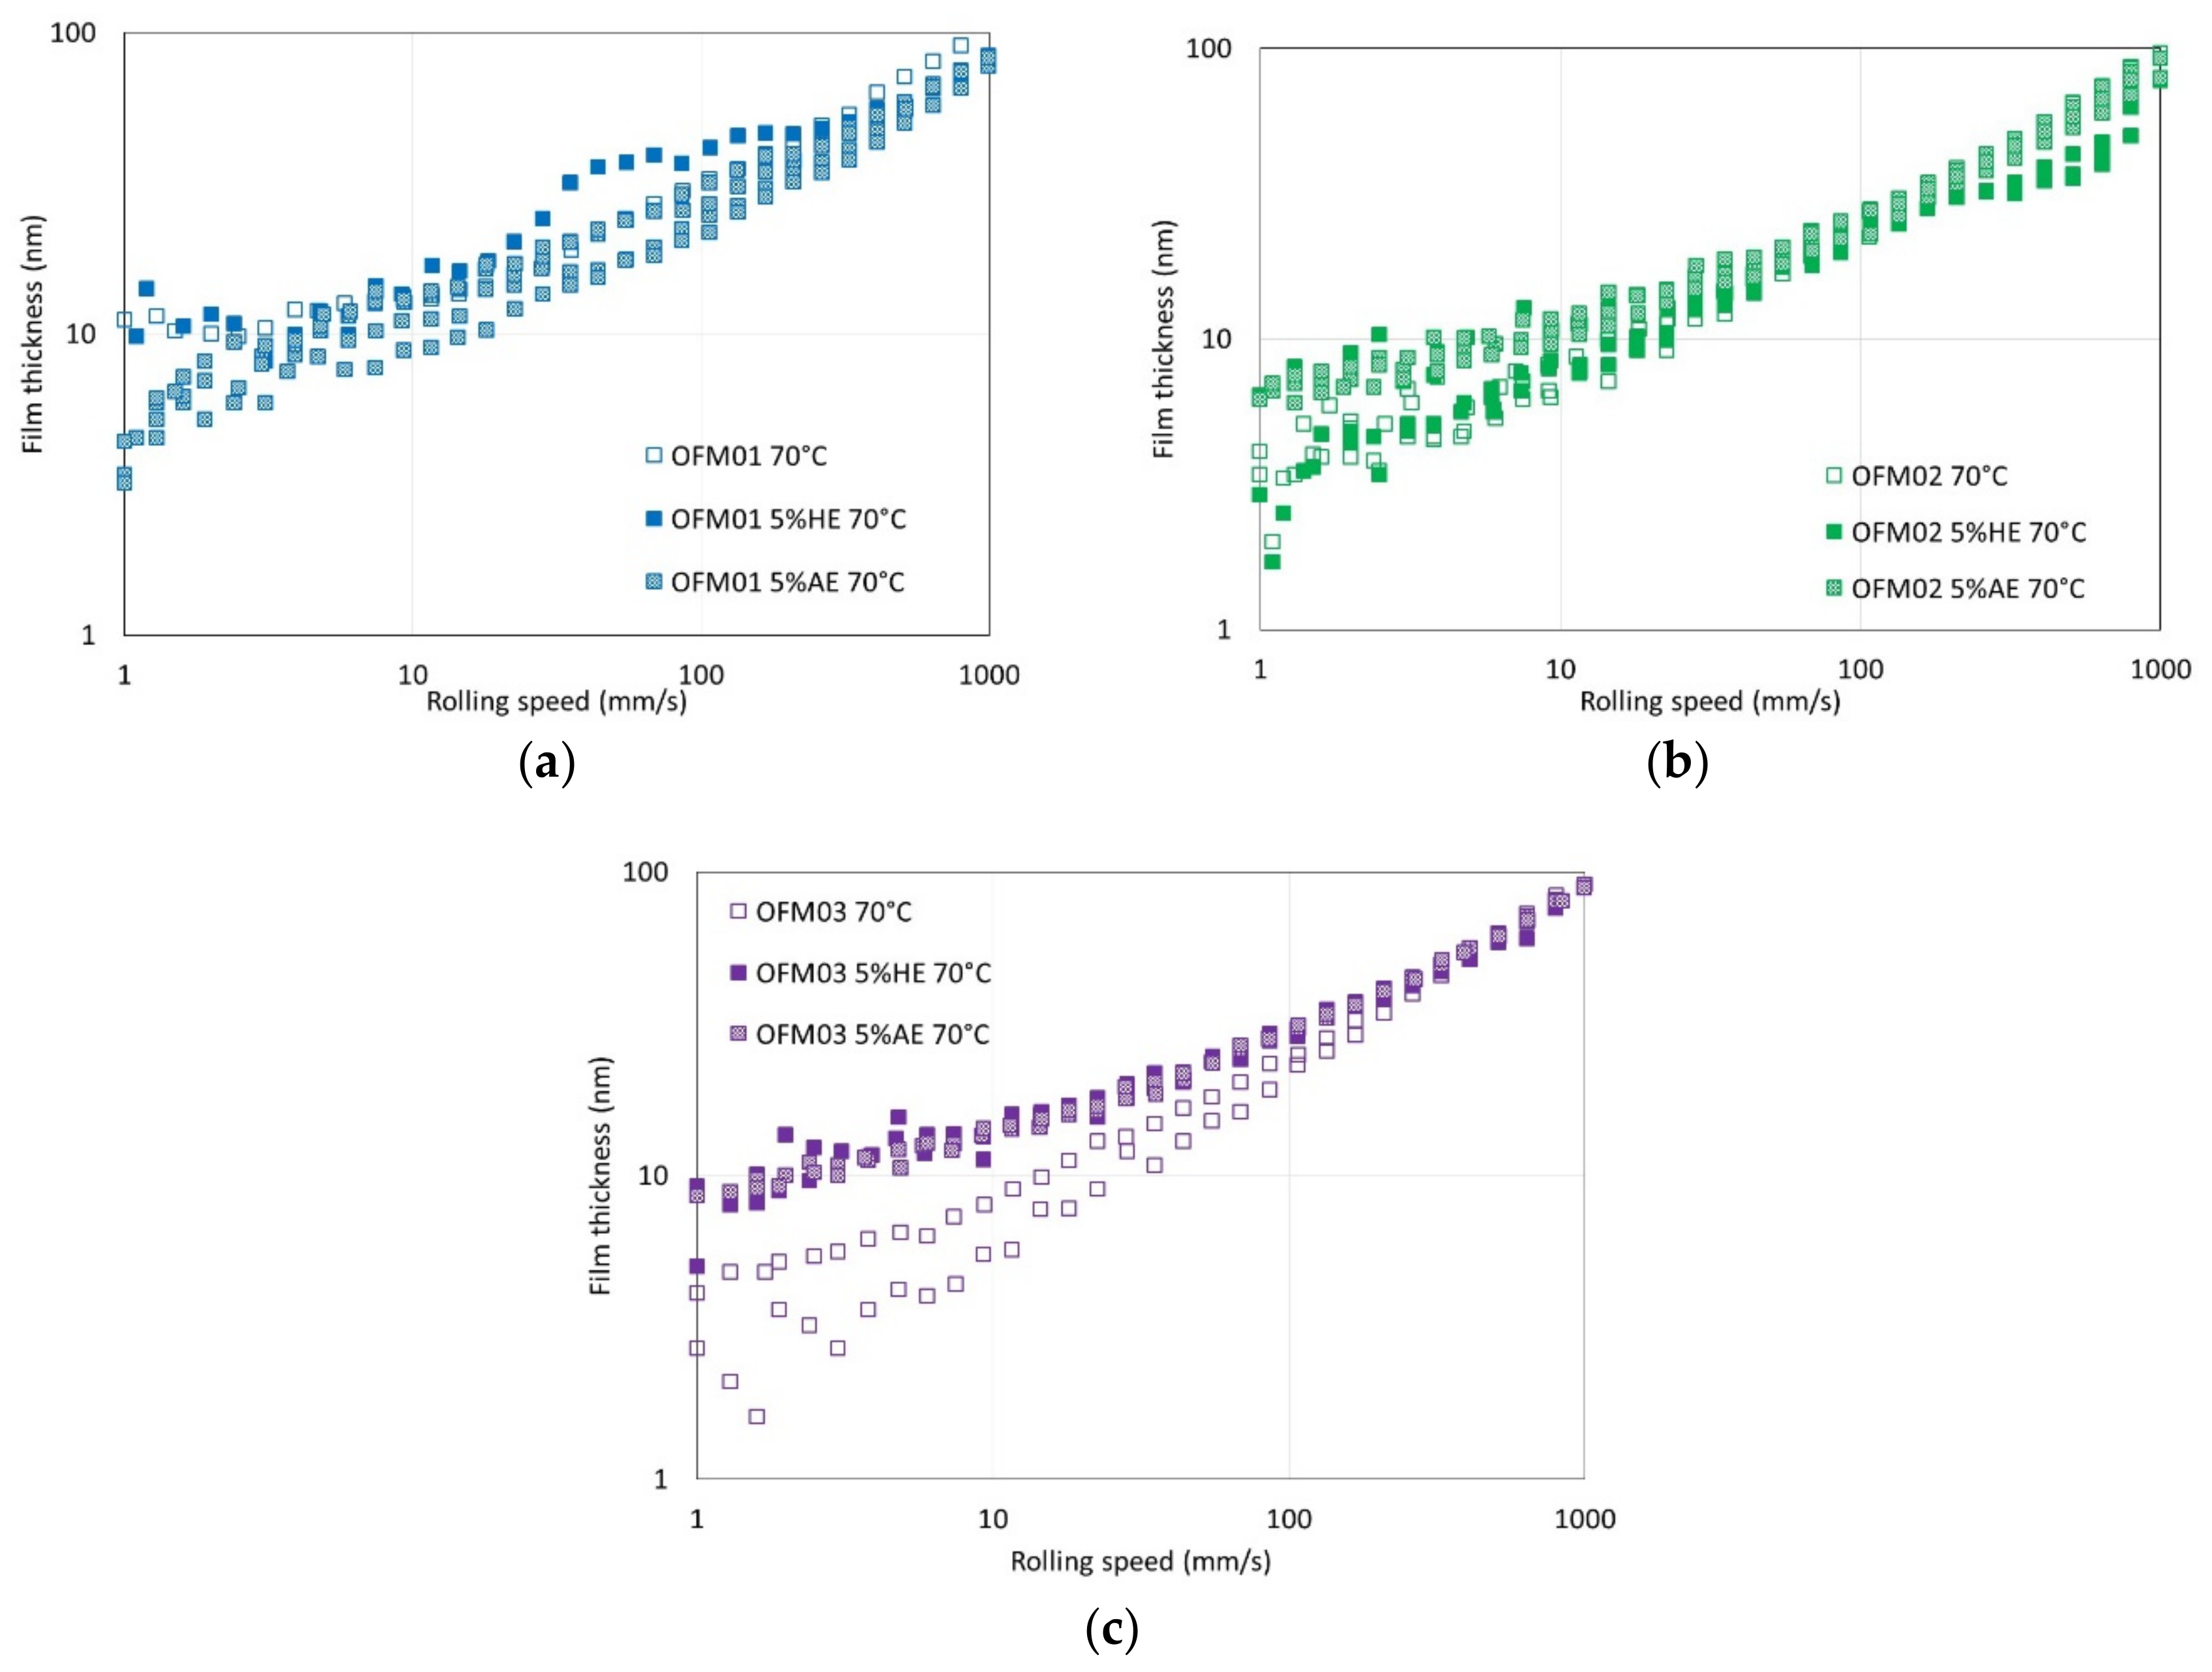
At 70 °C, the effects of the addition of ethanol to the base oil containing OFMs were more complex. For OFM01 (Figure 7a), when AE was added the thickness of the boundary film reduced at very low speeds, but it increased with speed. With HE significantly thicker boundary films were measured. However, the film thickness varied greatly, both within one test and between different repeats at the same condition. At the highest speeds, this very thick film disappeared. For OFM02 (Figure 7b) HE did not affect film thickness in the region of low and intermediate speeds. In the region of high speeds, a large reduction in film thickness was seen, which was very reproducible between repeats. This reduction was proportionally larger than the reduction in viscosity caused by the addition of HE (see Table 3). The addition of AE increased film thickness in the range of low and intermediate speeds, but at high speeds a reduction in film thickness occurred, apparently related to the reduction in the viscosity of the mixture. For OFM03 (Figure 7c), the presence of both HE and AE increased the thickness of the boundary film, but the difference in film thickness due to ethanol was lost in the region of higher speeds.
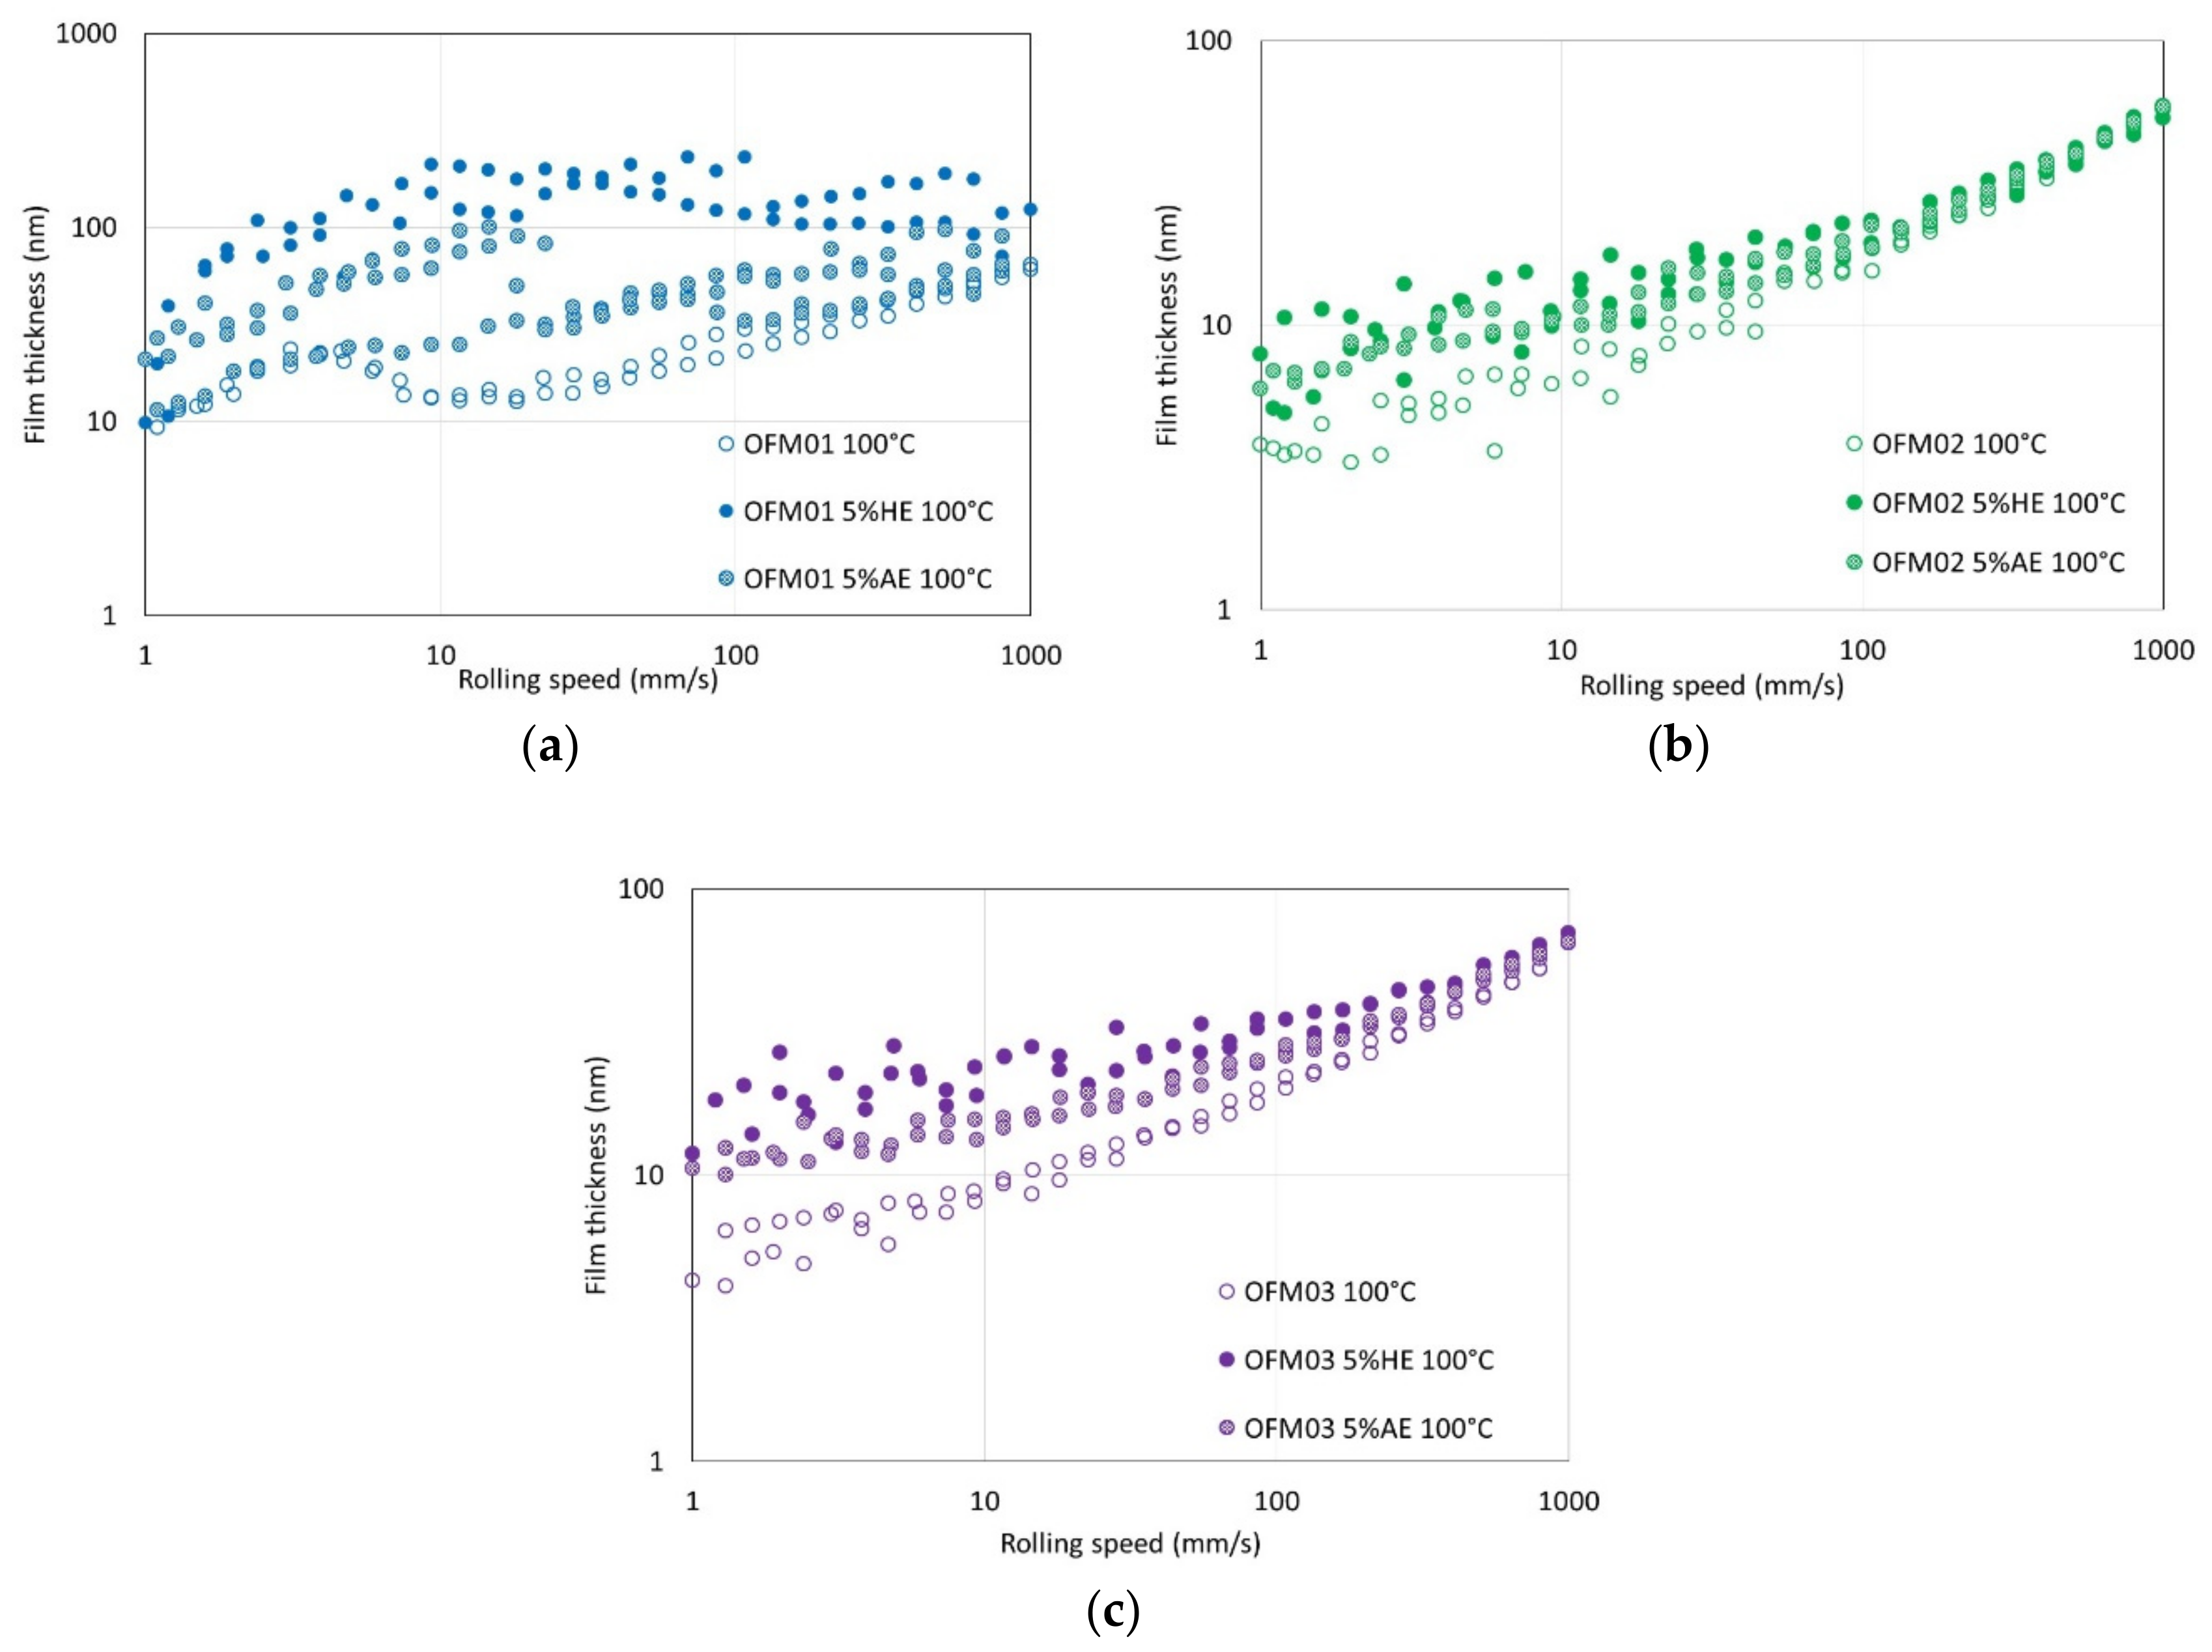
The effects of ethanol on EHD film formation at 100 °C are presented in Figure 8. For OFM01 (Figure 8a) the addition of both AE and HE resulted in the formation of very thick boundary films. However, the films formed when water was present (HE) were even thicker. Also, the variation of thickness of the boundary film with speed was very irregular. The film thickness initially increased, but then decreased and increased intermittently throughout the test. Finally, the boundary film seemed to remain on the surfaces for the whole range of speeds tested with ethanol. For OFM02 (Figure 8b) the addition of HE resulted in the formation of a slightly thicker boundary film. Also, the thickness of this film seemed more irregular. A similar effect was observed for the addition of AE, although the thickness of the boundary film was more regular than that formed for HE. For OFM03, both AE and HE increased film thickness for the whole range of speeds tested. The addition of HE induced the formation of thicker films than AE, but the variation of film thickness with speed was more irregular.

3.2. MoDTC

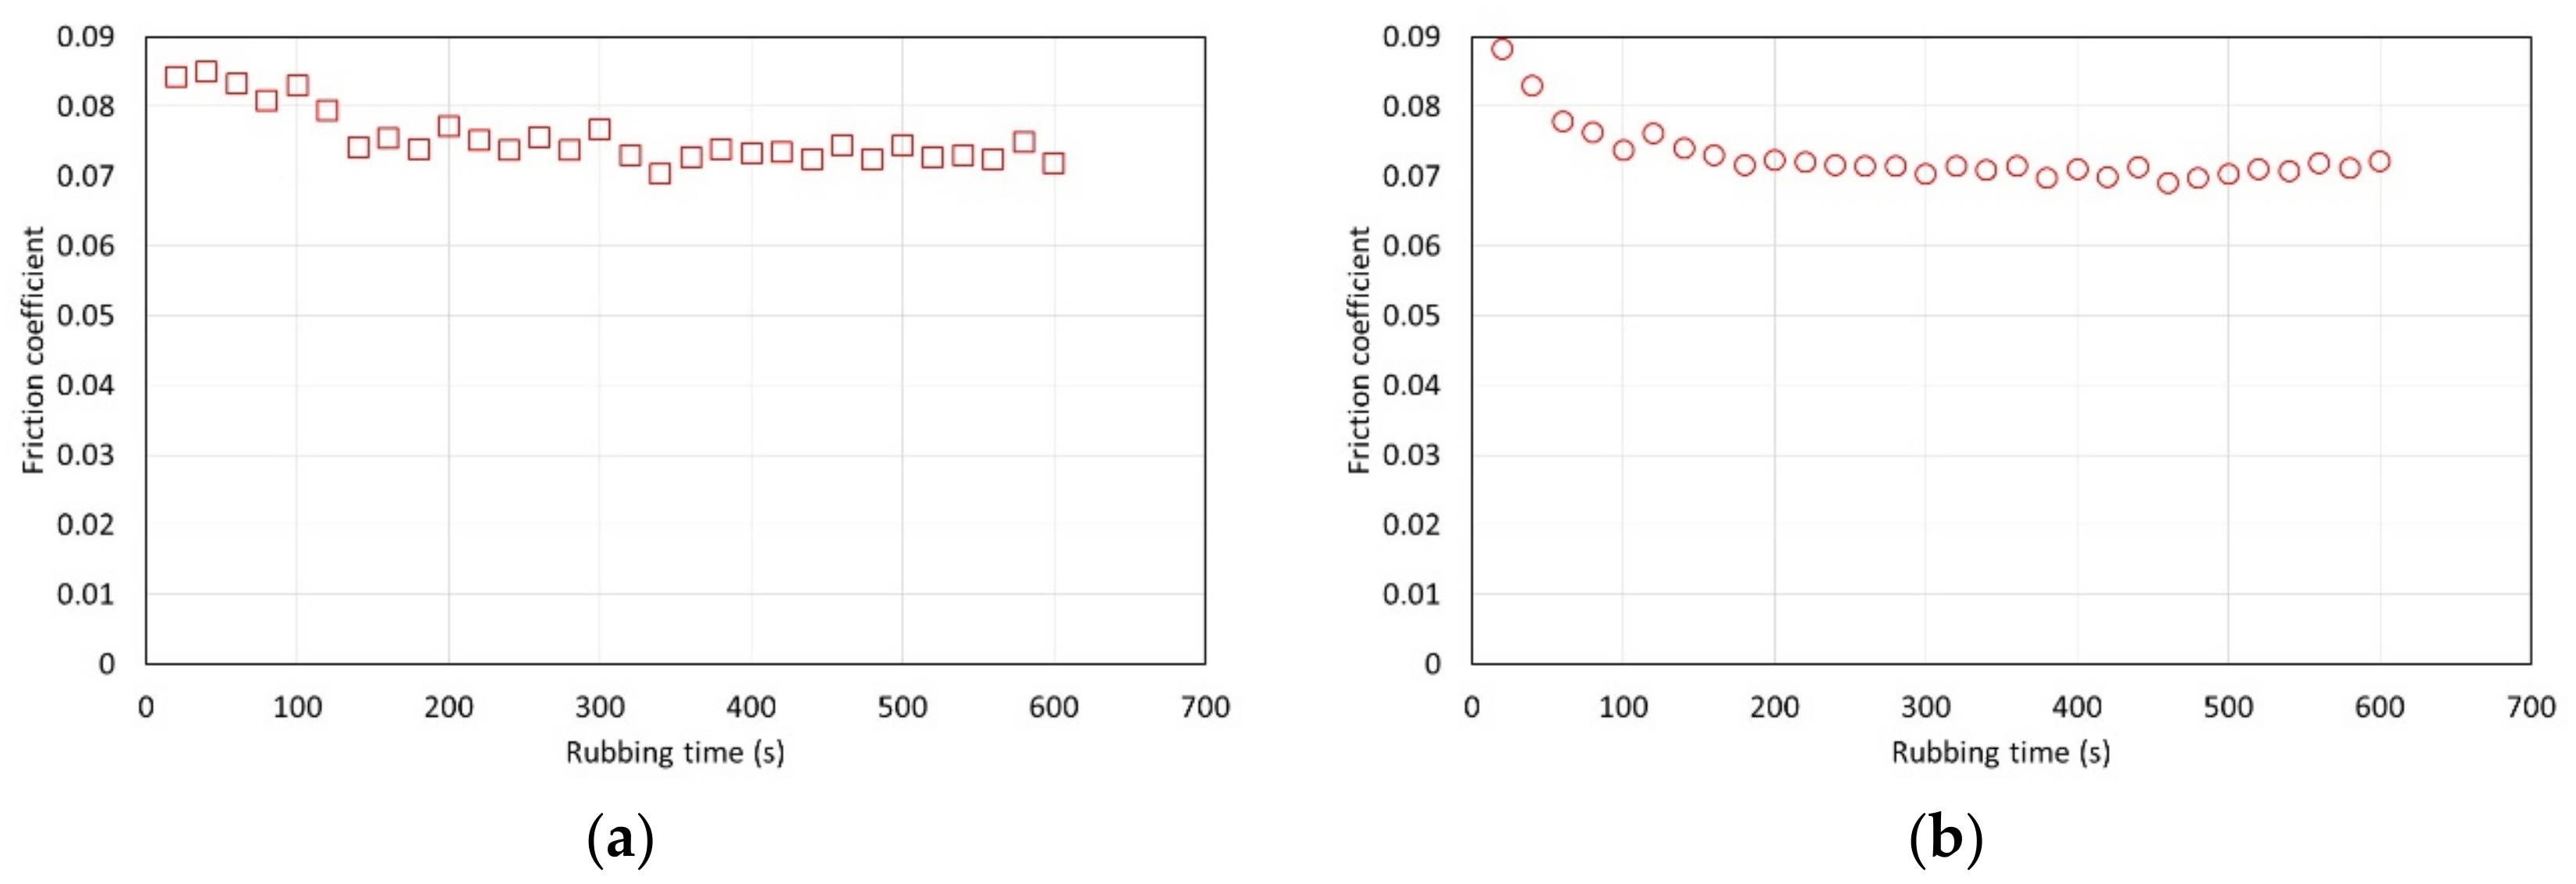
Before obtaining Stribeck curves, the samples were subject to rubbing at a normal load of 20 N and entrainment speed of 20 mm/s for 10 min at a sliding to roll ratio (SRR) of 50% to induce tribofilm formation. During the initial rubbing step, friction coefficient was measured. Figure 9 shows that friction indeed reduced with rubbing time for different test temperatures.
Figure 10 shows Stribeck curves for the oils containing MoDTC. First the curves obtained for the neat lubricant (without addition of ethanol) are presented at different test temperatures (Figure 10a). For comparison, the curves for the base oil are also presented. MoDTC did not lead to any significant friction reduction at 40 °C when compared with the base oil. At 70 °C, friction coefficients of around 0.08–0.09 were obtained in boundary lubrication, showing activation of the additive. At 100 °C, friction was further reduced to around 0.05–0.07. In the high-speed region, at 40 and 70 °C friction leveled out showing the onset of full film lubrication.
When ethanol was added ethanol at 40 °C (Figure 10b) in the full film region (higher speeds) the reduction in film thickness due to presence of hydrated ethanol was larger than for anhydrous ethanol. However, no clear trend could be observed in the boundary region (low speeds), probably because at this temperature the MoDTC was not activated. At 70 °C (Figure 10c) the addition of both AE and HE increased friction in the boundary lubrication regime. Also, this effect was more significant for HE than for AE. In fact, the behavior of the mixture containing HE was slightly worse than that of the base oil itself (compare Figure 10a,c). However, the effect of the addition of ethanol was much less significant at 100 °C, as shown in Figure 10d.

4. Discussion

This work shows interactions between ethanol, water, and different types of friction modifiers. Regarding the organic friction modifiers, three different commercial additives were tested. Analyzing the neat lubricants without ethanol, all three organic friction modifiers gave low boundary friction, which could be associated with a measurable boundary film, but there were only small differences between them. OFM01 showed some friction reduction at 40 °C, but this reduction was more significant at 70 and 100 °C. Film thickness measurements showed that the thickness of the boundary film increased with test temperature. At 100 °C the boundary film appeared to be viscous in that it initially developed as speed increased as though being entrained. Many commercial OFMs, such as copper carboxylate, show similar behaviour at higher test temperatures, based on thick boundary-film formation due to a surface deposit which is entrained at low speeds but lost at high speeds [18]. OFM02 and OFM03 also showed lower boundary friction as temperature increased, but the thickness of the boundary film did not increase with test temperature or speed. This might suggest that the boundary film results from a chemical reaction forming ferrous-based films [18].
The effects of ethanol were different under full film and boundary lubrication conditions. Under full film lubrication, ethanol always reduced film thickness and friction and the reduction in film thickness and friction was larger for AE than for HE. This can be attributed to the effects of ethanol on viscosity shown in Table 3, probably because water reduces the true solubility of the ethanol in the oil so that some ethanol forms a microemulsion with water, thus having less effect on the lubricant´s viscosity. The reduction in viscosity reduces viscous losses when shearing the lubricant, but it also induces thinner EHL films, increasing the likelihood of asperity contact as speed reduces.
For boundary and mixed conditions, the effects of the addition of ethanol on film thickness depended on the temperature and type of OFM. In none of the conditions tested did the addition of HE or AE stop the formation of low friction boundary films, but their effect varied. In fact, for most of the conditions tested, the addition of ethanol reduced friction coefficient. Also, for all conditions tested, friction reduction due to the addition of AE was generally larger or at least similar to that promoted by HE.
For OFM01 at low temperatures (40 and 70 °C) AE reduced the thickness of the boundary film and the thickness increased with speed, suggesting that pure ethanol might contribute to a viscous boundary film. At 100 °C very thick viscous boundary films were formed, in particular with HE, which resulted in the formation of films with thickness above 100 nm at 100 °C. Boundary friction in the presence of ethanol was also very low at higher temperatures. It can be hypothesized that ethanol at higher temperatures interacts with OFMs to form very thick viscous boundary films, possibly involving chemical reactions that are favored by higher temperature. Since the boundary films were thicker for HE than AE, probably the presence of water interacts strongly with the structure of the boundary film formed. For OFM02 and OFM03, at higher temperatures ethanol also led to thicker boundary films, in particular HE, although much thinner than for OFM01.
Another relevant remark is that for all the film thickness tests carried out with OFM01 in the presence of HE, the reflective disc appeared severely damaged at the end of the test, although this did not happen when AE was added. On the ball, apparently some solid film was formed both in the presence of AE and HE, and it was not removed by rinsing with toluene. For the tests with OFM02 and OFM03 with addition of HE, visual observation of the ball again showed some apparent film, which was not removed by rinsing with toluene, but the severe damage to the reflective disc observed for OFM01 did not happen. The films formed on the ball were apparently oxidation but they need to be further investigated in future works. Taking into account that the film thickness in the boundary region was larger for HE but friction was lower for AE, it is possible that HE leads to more severe oxidation of the metallic surfaces whereas AE might interfere more directly with the structure of the adsorbed boundary film.
At 100 °C, the effects of ethanol on friction were negligible for the three different OFMs. The most likely reason is ethanol evaporation since this temperature is substantially higher than the boiling point of ethanol. To verify this hypothesis, a simple experimental technique developed in a previous work was employed to estimate the amount of ethanol at the end of the tests [17]. In this technique, ethanol is extracted from the lubricant by aqueous extraction. After separation from the lubricant, the refractive index of the extraction water is measured. Previous calibration of refractive measurements of water containing different amounts of ethanol allowed to estimate the amount of ethanol in the extraction water. Further details of the technique can be found in [17]. The amounts of ethanol after the tests using this technique are presented in Table 5. This refractive index-based technique showed that the amount of ethanol remaining in the lubricants at the end of the MTM tests at 100 °C was very small, indicating that ethanol did not affect friction at 100 °C because ethanol evaporates rapidly at this temperature. On the other hand, the amounts of ethanol after the film thickness measurement tests (EHD) were higher. Reasons that could contribute for this are: (i) the EHD test chamber is more hermetically closed than the chamber for the MTM tests; and (ii) the volume of lubricant used in the EHD tests is substantially larger. Also, the EHD tests started at low speeds which then increased, ensuring a large amount of ethanol available when the boundary film formed, whereas the MTM started at higher speeds which then decreased, so that the boundary films would form at the end of the tests, when the amount of ethanol available was substantially smaller. Probably due to this combination of factors, the effects of ethanol on friction were negligible for the oils containing organic friction modifiers at 100 °C, but not on boundary film thickness.
The tests with MoDTC showed that at 40 °C the additive was not properly activated, since the formation of a low boundary film was not observed, but that boundary friction reduced with test temperature. The literature has indeed shown that activation of MoDTC in MTM tests is very challenging and often requires the use of higher test temperatures and rougher disks to induce asperity contact, apparently necessary for the tribochemical reactions involved in the decomposition of the additive and formation of low friction MoS2 nanosheets [18].
For the tests with MoDTC at 70 °C the presence of ethanol increased boundary friction compared with the neat lubricant (without ethanol). This suggests that ethanol interferes with the chemical reactions involved in the formation of a low friction tribofilm. Also, this effect is more significant for HE than for AE, indicating that the presence of water is further detrimental to the formation of the low friction film. This could be related for example to oxidation leading to formation of MoO3 in detriment to MoS2. At 100 °C, the effects of ethanol on boundary friction disappeared, also probably attributable to the large ethanol evaporation at this temperature (see Table 5), although the film might also be more stable at this temperature.
5. Conclusions

This work has studied the impact of anhydrous and hydrated ethanol on friction and film thickness of solutions of friction modifier additives in base oil. The objective was to help understand the effects of contamination of engine lubricants on performance when using ethanol-containing fuels. The results showed that:
  • For all the FMs tested ethanol reduced film thickness and friction under full-film lubrication conditions, which was attributable to a reduction in viscosity. This phenomenon was more significant for anhydrous than hydrated ethanol, probably because water forms a microemulsion with ethanol, reducing the latter′s effect on viscosity
  • For three commercial organic friction modifiers tested, both hydrated ethanol (HE) and anhydrous ethanol (AE) generally reduced boundary friction. HE always increased the thickness of the organic friction modifier boundary films, although AE reduced boundary film for OFM01 at low temperatures
  • For MoDTC, ethanol (particularly HE) was very detrimental, increasing boundary friction significantly.
  • For all the FMs tested the effects of ethanol almost disappeared at 100 °C, apparently due to almost complete ethanol evaporation.

Author Contributions

Conceptualization, H.L.C.; Data curation, H.L.C.; Formal analysis, H.L.C.; Investigation, H.L.C.; Methodology, H.S.; Resources, H.S.; Supervision, H.S.; Writing—original draft, H.L.C.; Writing—review and editing, H.S.

Funding

This research was funded by Conselho Nacional de Desenvolvimento Científico e Tecnológico (CNPq, Brazil) under the program “Science without Borders”.

Acknowledgments

The authors are grateful to Petrobras for providing lubricant and hydrated ethanol fuel samples and to Triboflex Consortium (Brazil).

Conflicts of Interest

The authors declare no conflict of interest.

References

  1. Bastian-Pinto, C.; Brandão, L.; de Lemos Alves, M. Valuing the switching flexibility of the ethanol-gas flex fuel car. Ann. Oper. Res. 2010, 176, 333–348. [Google Scholar] [CrossRef]
  2. US Government. Alternative Motor Fuels Act of 1988. Public Law 1988, 1, 100–494. [Google Scholar]
  3. Pelkmans, L.; Lenaers, G.; Bruyninx, J.; Scheepers, K.; De Vlieger, I. Impact of biofuel blends on the emissions of modern vehicles. Proc. Inst. Mech. Eng. Part D J. Automob. Eng. 2011, 225, 1204–1220. [Google Scholar] [CrossRef]
  4. Linde, R.; Frode, J. EU Report: Emissions and Experiences with E85 Converted Cars in the BEST Project; European Union: Vaxjo, Sweden, 2010; pp. 9–27. [Google Scholar]
  5. Campbell, H.; Anderson, J.; Luckert, M. Public policies and Canadian ethanol production: History and future prospects for an emerging industry. Biofuels-UK 2016, 7, 117–130. [Google Scholar] [CrossRef]
  6. Wu, X.; Daniel, R.; Tian, G.; Xu, H.; Huang, Z.; Richardson, D. Dual-injection: The flexible, bi-fuel concept for spark-ignition engines fuelled with various gasoline and biofuel blends. Appl. Energy 2011, 88, 2305–2314. [Google Scholar] [CrossRef]
  7. Dutcher, D.D.; Stolzenburg, M.R.; Thompson, S.L.; Medrano, J.M.; Gross, D.S.; Kittelson, D.B.; McMurry, P.H. Emissions from ethanol-gasoline blends: A single particle perspective. Atmosphere 2011, 2, 182–200. [Google Scholar] [CrossRef]
  8. Maricq, M.M. Soot formation in ethanol/gasoline fuel blend diffusion flames. Combust. Flame 2012, 159, 170–180. [Google Scholar] [CrossRef]
  9. Chui, G.; Millard, D. Development and Testing of Crankcase Lubricants for Alcohol Fueled Engines; SAE Technical Paper, 0148-7191; SAE: Warrendale, PA, USA, 1981. [Google Scholar]
  10. Boons, M.; Van Den Bulk, R.; King, T. The Impact of E85 Use on Lubricant Performance; SAE Technical Paper, 0148-7191; SAE: Warrendale, PA, USA, 2008. [Google Scholar]
  11. Chui, G.; Baker, R.; Pinto, F. Lubrication behaviour in ethanol-fueled engines. In Proceedings of the 4th Symposium on Alcohol Fuels, São Paulo, Brazil, 5–8 October 1980. [Google Scholar]
  12. De Silva, P.; Priest, M.; Lee, P.; Coy, R.; Taylor, R. Tribometer investigation of the frictional response of piston rings with lubricant contaminated with the gasoline engine biofuel ethanol and water. Proc. Inst. Mech. Eng. Part J J. Eng. Tribol. 2011, 225, 347–358. [Google Scholar] [CrossRef]
  13. Costa, H.L.; Spikes, H.A. Impact of ethanol on the formation of antiwear tribofilms from engine lubricants. Tribol. Int. 2016, 93, 364–376. [Google Scholar] [CrossRef]
  14. Evangelista, K.S.; Kessler, F.; Cousseau, T.; Acero, J.S.R.; Costa, H.L. Use of X-ray absorption techniques to investigate the effects of ethanol contamination on ZDDP tribofilms. Tribol. Lett. 2019, in press. [Google Scholar]
  15. Parsaeian, P.; Van Eijk, M.C.; Nedelcu, I.; Neville, A.; Morina, A. Study of the interfacial mechanism of ZDDP tribofilm in humid environment and its effect on tribochemical wear; Part I: Experimental. Tribol. Int. 2017, 107, 135–143. [Google Scholar] [CrossRef]
  16. De Silva, P.; Priest, M.; Lee, P.; Coy, R.; Taylor, R. Tribometer investigation of the frictional response of piston rings when lubricated with the separated phases of lubricant contaminated with the gasoline engine biofuel ethanol and water. Tribol. Lett. 2011, 43, 107–120. [Google Scholar] [CrossRef]
  17. Costa, H.L.; Spikes, H. Effects of Ethanol Contamination on Friction and Elastohydrodynamic Film Thickness of Engine Oils. Tribol. Trans. 2015, 58, 158–168. [Google Scholar] [CrossRef]
  18. Spikes, H. Friction Modifier Additives. Tribol. Lett. 2015, 60, 5. [Google Scholar] [CrossRef]
  19. Canter, N. Fuel economy: The role of friction modifiers and VI improvers. Tribol. Lubr. Technol. 2013, 69, 14–27. [Google Scholar]
  20. Mattsson, L.; Olsson, B.; Nilsson, P.H.; Wirmark, G. Wear and film formation in the presence of methanol and formic acid. Wear 1993, 165, 75–83. [Google Scholar] [CrossRef]
  21. Risdon, T.J.; Gresty, D.A. An Historical Review of Reductions in Fuel Consumption of United States and European Engines with MoS2; SAE Technical Paper 1975 750674; SAE: Warrendale, PA, USA, 1975. [Google Scholar]
  22. Grossiord, C.; Varlot, K.; Martin, J.M.; Le Mogne, T.; Esnouf, C.; Inoue, K. MoS2 single sheet lubrication by molybdenum dithiocarbamate. Tribol. Int. 1998, 31, 737–743. [Google Scholar] [CrossRef]
Figure 1. Stribeck curves for the neat blends with organic friction modifiers at 40, 70, and 100 °C: (a) OFM01; (b) OFM02; (c) OFM03.
Lubricants 07 00101 g001
Figure 2. Effects of ethanol on Stribeck curves for organic friction modifiers at 40 °C: (a) OFM01; (b) OFM02; (c) OFM03.
Lubricants 07 00101 g002
Figure 3. Effects of ethanol on Stribeck curves for organic friction modifiers at 70 °C: (a) OFM01; (b) OFM02; (c) OFM03.
Lubricants 07 00101 g003
Figure 4. Effects of ethanol on Stribeck curves for organic friction modifiers at 100 °C: (a) OFM01; (b) OFM02; (c) OFM03.
Lubricants 07 00101 g004aLubricants 07 00101 g004b
Figure 5. EHD Film thickness measurements for oils containing organic friction modifiers at different test temperatures: (a) OFM01; (b) OFM02; (c) OFM03.
Lubricants 07 00101 g005aLubricants 07 00101 g005b
Figure 6. Effects of ethanol on EHD film thickness at 40 °C for oils containing organic friction modifiers: (a) OFM01; (b) OFM02; (c) OFM03.
Lubricants 07 00101 g006
Figure 7. Effects of ethanol on film thickness at 70 °C for oils containing organic friction modifiers: (a) OFM01; (b) OFM02; (c) OFM03.
Lubricants 07 00101 g007
Figure 8. Effects of ethanol on film thickness at 100 °C for oils containing organic friction modifiers: (a) OFM01; (b) OFM02; (c) OFM03.
Lubricants 07 00101 g008
Figure 9. Effect of rubbing time on friction coefficients for oils containing MoDTC during the initial rubbing step: (a) 70 °C; (b) 100 °C.
Lubricants 07 00101 g009
Figure 10. Stribeck curves for lubricants with MoDTC: (a) neat lubricants at different temperatures; (b) effects of ethanol at 40 °C; (c) effects of ethanol at 70 °C; (d) effects of ethanol at 100 °C.
Lubricants 07 00101 g010
Table 1. Metallic elements present in the friction modifiers, in ppm
MetalMoDTCOFM01OFM02OFM03
Fe920<1<1
Mo14,699<1<1<1
P 143155<20<20
Pb<10<10<10<10
S149,200<500<500<500
Sn33<20<20
Ti<30<30659203
Zn25322
Table 2. List of fluid samples, presenting the symbols used to represent the different conditions
DescriptionAbbreviationSymbol
40 °C70 °C100 °C
Base oilGroup I base oil (neat)Base Lubricants 07 00101 i001
Base oil + MoDTCBase oil + 0.9 wt % MoDTC (neat)MoDTC Lubricants 07 00101 i002
Base oil + 0.9 wt % MoDTC + 5 wt % hydrated ethanolMoDTC 5%HE Lubricants 07 00101 i003
Base oil + 0.9 wt % MoDTC + 5 wt % anhydrous ethanolMoDTC 5%AE Lubricants 07 00101 i004 Lubricants 07 00101 i005 Lubricants 07 00101 i006
Base oil + organic friction modifiers (OFMs)Base oil + 1.2 wt % of OFM01 (neat)OFM01 Lubricants 07 00101 i007
Base oil + 1.2 wt % OFM01 + 5 wt % hydrated ethanolOFM01 5%HE Lubricants 07 00101 i008
Base oil + 1.2 wt % OFM01 + 5 wt % anhydrous ethanolOFM01 5%AE Lubricants 07 00101 i009 Lubricants 07 00101 i010 Lubricants 07 00101 i011
Base oil + 0.5 wt % OFM02 (neat)OFM02 Lubricants 07 00101 i012
Base oil + 0.5 wt % OFM02 + 5 wt % hydrated ethanolOFM02 5%HE Lubricants 07 00101 i013
Group I base oil + 0.5 wt % OFM02 + 5 wt % anhydrous ethanolOFM02 5%AE Lubricants 07 00101 i014 Lubricants 07 00101 i015 Lubricants 07 00101 i016
Base oil + 0.5 wt % OFM03 (neat)OFM03 Lubricants 07 00101 i017
Base oil + 0.5 wt % OFM03 + 5 wt % hydrated ethanolOFM03 5%HE Lubricants 07 00101 i018
Base oil + 0.5 wt % OFM03 + 5 wt % anhydrous ethanolOFM03 5%AE Lubricants 07 00101 i019 Lubricants 07 00101 i020 Lubricants 07 00101 i021
Table 3. Viscosity of the lubricants contaminated with ethanol, where ρ = density, ɳ = kinematic viscosity, VI = viscosity index, HE = hydrated ethanol, AE = anhydrous ethanol, N.M. = not measurable
Fluidρ at 15 °C (g/cm3)η at 40 °C (mm2/s)ɳ at 70 °C (mm2/s)ɳ at 100 °C (mm2/s)VI
Group I Base 0.87428.69810.5155.092104.8
Base + MoDTC0.87730.54510.7585.254102.6
Base + MoDTC + 5%HE0.87525.9998.440N.M.N.M.
Base + MoDTC + 5%AE0.87220.8607.620N.M.N.M.
Base + OFM010.87730.25810.7095.228102.9
Base + OFM01 + 5%HE0.87125.6508.130N.M.N.M.
Base + OFM01 + 5%AE0.87121.517.703N.M.N.M
Base + OFM020.87730.90510.8285.259100.6
Base + OFM02 + 5%HE0.87227.4868.7719N.M.N.M.
Base + OFM02 + 5%AE0.84620.867.62N.M.N.M.
Base + OFM030.87831.88010.9425.361100.7
Base + OFM03 + 5%HE0.87227.0358.7676N.M.N.M.
Base + OFM03 + 5%AE0.87223.2218.2685N.M.N.M.
Table 4. Refractive index for the test fluids, HE = hydrated ethanol and AE = anhydrous ethanol
Oil40 °C70 °C100 °C
Group I Base1.4781.4691.460
Base + MoDTC1.4781.4711.461
Base + MoDTC + 5%HE1.4761.4691.462
Base + MoDTC + 5%AE1.4661.4611.446
Base + OFM011.4781.4691.456
Base + OFM01 + 5%HE1.4761.4681.454
Base + OFM01 + 5%AE1.4731.4631.455
Base + OFM021.4771.4701.461
Base + OFM02 + 5%HE1.4741.4691.462
Base + OFM02 + 5%AE1.4731.4771.458
Base + OFM031.4791.47151.461
Base + OFM03 + 5%HE1.4761.46851.458
Base + OFM03 + 5%AE1.4731.46351.454
Table 5. Amounts of ethanol after the tests using refractive index measurements of extraction water
Test FluidAmount of Ethanol in wt %
MTM TestsEHD Tests
40 °C70 °C100 °C(after 40, 70, and 100 °C)
OFM01 + 5%AE4312
OFM01 + 5%HE3.82.40.41.2
OFM02 + 5%AE3.01.60.51.5
OFM02 + 5%HE2.71.80.41.5
OFM03 + 5%AE3.12.50.31.4
OFM03 + 5%HE3.11.90.31.6
MoDTC + 5%AE2.91.40.2Not tested
MoDTC + 5%HE3.31.20.1