Article

Squeeze Flow of Bingham Fluids through Reticulated, Compressed Foams

Department of Machine Elements and Tribology, University Politehnica of Bucharest, Spl. Independenței 313, RO-060042 Bucharest, Romania
*
Author to whom correspondence should be addressed.
Lubricants 2019, 7(10), 86; https://doi.org/10.3390/lubricants7100086
Submission received: 24 July 2019 / Revised: 16 September 2019 / Accepted: 25 September 2019 / Published: 27 September 2019
(This article belongs to the Special Issue Fluid-Film Lubrication II)

Abstract

:
The paper presents experimental and theoretical results for the planar squeeze flow of a finite volume of viscoplastic material through a highly deformable porous layer. The central zone of an annular disc made of a reticulated polyurethane foam with high porosity (ε > 0.97) was fully filled with tooth paste. The porous disc placed between two flat, impermeable, parallel, and rigid discs was subjected to compression and the normal force was recorded. After compression, the radial extension of the squeezed fluid was measured. The visualisation of the compressed disc managed to provide evidence of a tortuous flow inside the porous structure. An original analytical model is proposed for the prediction of the front of the flow inside the porous layer and corresponding resistant normal force. The model combines the Covey and Stanmore (1981) model for squeeze flow of a Bingham fluid inside the central zone, with an original approach for flow through the reticulated foams, based on the concept of “equivalent flow tubes” with variable tortuosity. This explorative investigation is of interest for innovative shock absorbers. The model validity covers both low and high plasticity numbers and was experimentally validated for low speed.

Graphical Abstract

1. Introduction

Damping effects may occur when an imbibed, extremely soft, porous material is compressed. Load support is produced by the fluid flow resistance through communicating pores and the effect is amplified by the decreasing permeability during compression. A similar mechanism can be found inside human joints where the synovial fluid impregnates porous cartilages [1].
This squeeze mechanism of liquids imbibed in highly deformable porous layers (named ex-poro-hydrodynamic lubrication—XPHD) was intensively studied by Pascovici and co-workers. They developed several theoretical models based on Darcy law (neglecting viscous and inertia effects) and made experiments for various types of contacts: Disc on plane [2], cylinder on plane [3], sphere on plane [4], cylinder on cylinder [5]. The results have proved the generation of high lift forces, greater than those typically obtained during pure fluid squeeze. Their models were developed for Newtonian fluids, and based on three assumptions: (i) the porous material is highly deformable and the forces generated by the elastic structure are negligible compared to the fluid pressure forces; (ii) the permeability varies with porosity (which in turn is variable with the level of compression) and permeability–porosity correlation is given by Kozeny–Carman law; and (iii) the porous structure does not inflate during compression and correspondingly, the area normal to the direction of compression remains constant. Applications were imagined for squeeze dampers [6,7] and shock absorbers [4].
Recent laboratory experiments made with damping cells consisting of porous discs imbibed with Newtonian liquids have shown high capacity of force attenuation at impact [8]. However, if the porous is partially imbibed, the cells cannot be used in vertical position due to the irregular imbibition provoked by gravitational forces.
Squeeze effects in ultra-soft materials (snow, pillow-filling polyester) imbibed with air have been studied extensively by professor Weinbaum and his co-workers. Their theoretical and experimental results revealed that the change in permeability as a function of compression is one of the key factors for generating lift effects [9,10].
Squeeze flow between two circular discs, of which one is being porous, have been theoretically studied by Bou-Said and co-workers. Their models were developed for both Newtonian [11] and non-Newtonian (couple stress) [12] fluids and included viscous shear and inertia effects (Darcy–Brinkmann–Forchheimmer model). Their results, focused on bio-lubrication applications, have shown the reduced effect of inertia. However, the permeability was assumed constant during the squeeze process.
The flow of non-Newtonian fluids through reticulated foams has been thoroughly investigated for research domains such as resin injection, filtering systems, oil industry, etc. However, the fluid–porous structure interaction during impact load still remains an emerging subject, due to its potential for damping. Dawson [13,14] explored a new promising solution for energy dissipation by incorporating shear thickening non-Newtonian liquids into reticulated foams.
For all applications based on non-Newtonian fluids, the imbibition of the porous materials remains a technological challenge, especially for highly viscous fluids. The fluid can be forced to fill the porous structure either by injection or by using vacuum pumps. A configuration that overcomes the imbibition difficulties was proposed by Dawson and has been successfully used later by Vossen [15]. The porous layer was provided with fluid filled zones surrounded by dry foam, the former playing the role of a fluid reservoir.
Chevalier et al. [16] report compelling studies concerning non-Newtonian fluid flows though porous materials. An analogy is made between the fluid flow through pores and the one made through a bundle of equivalent parallel conduits (tubes). The tortuosity of the fluid paths is taken into account when estimating the diameter of such conduits. Several models based on similarity between the flow in porous media and the flow in bundle of capillaries was proposed by Pearson and Tardy [17]. Their numerical analysis was done for viscous flow of Newtonian and non-Newtonian fluids; however, there is no information about the porosity of the analyzed media.
Some unpublished experimental results obtained on damping cells with a center reservoir filled with a yield stress fluid (a solution inspired by [15]) revealed good stability of the paste inside the reservoir, whatever its position. Using yield stress fluids, it is also expected to obtain greater forces at the beginning of the compression, when the porosity and permeability are higher and the resistance to flow of the Newtonian fluids is low.
This paper proposes a model for the squeeze process of a Bingham fluid from a fluid reservoir through a surrounding annular disc of dry foam. An experimental model was setup using a reticulated foam and paste, which is filled in center reservoir in order to evaluate the force generated during compression. The proposed theoretical model allows the prediction of the pressure distribution in radial direction and the total force for the simple case of constant squeeze speed.

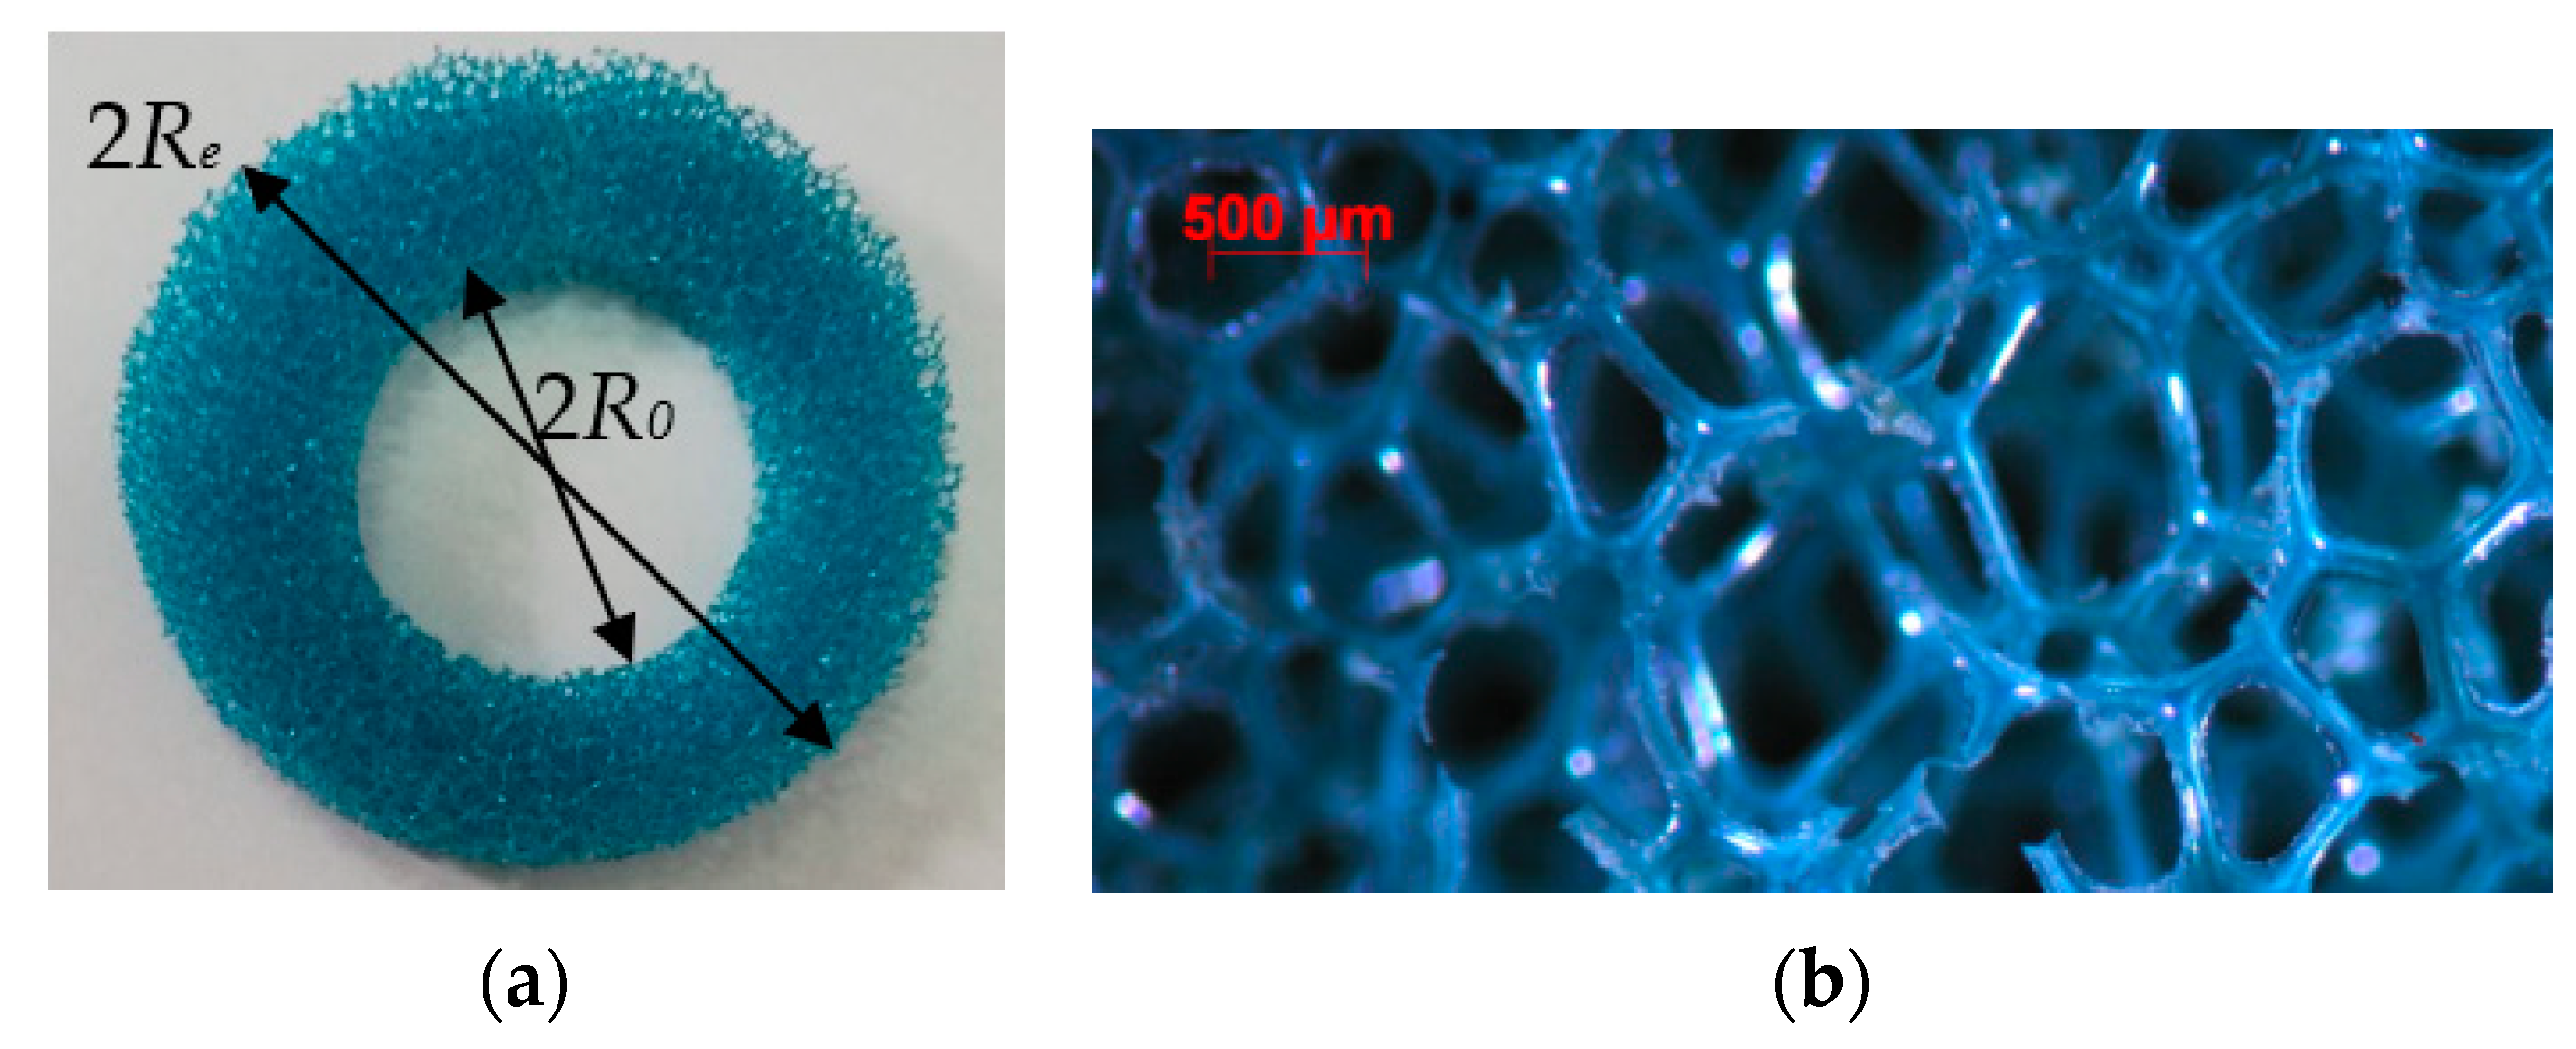
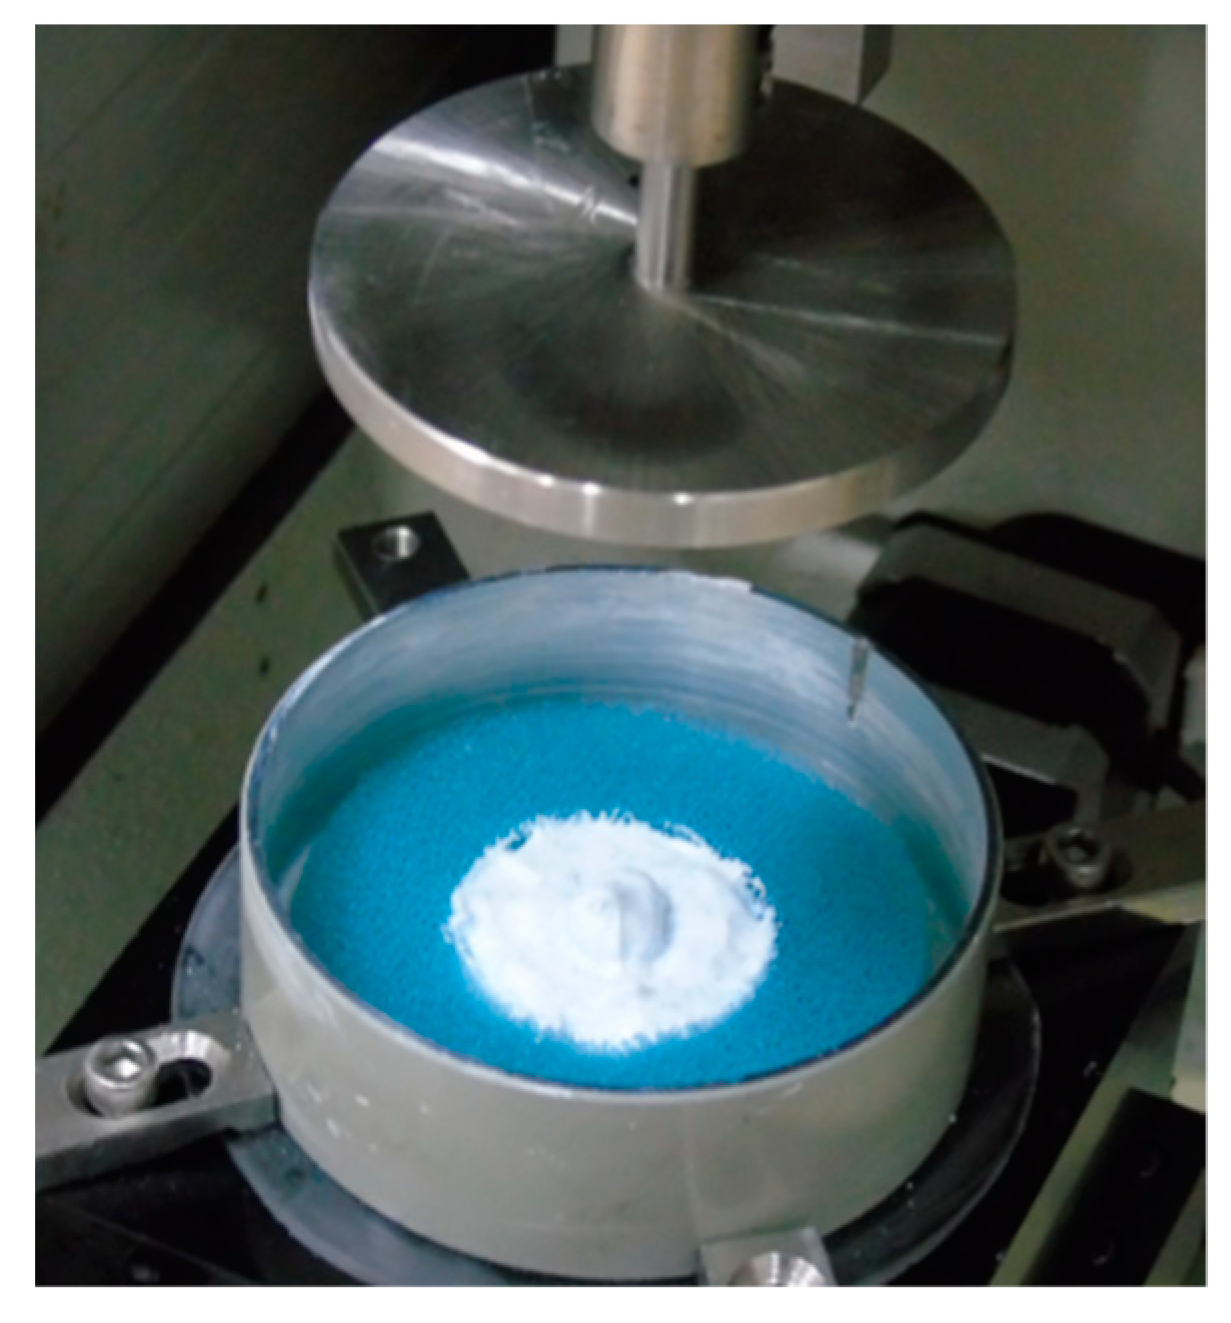
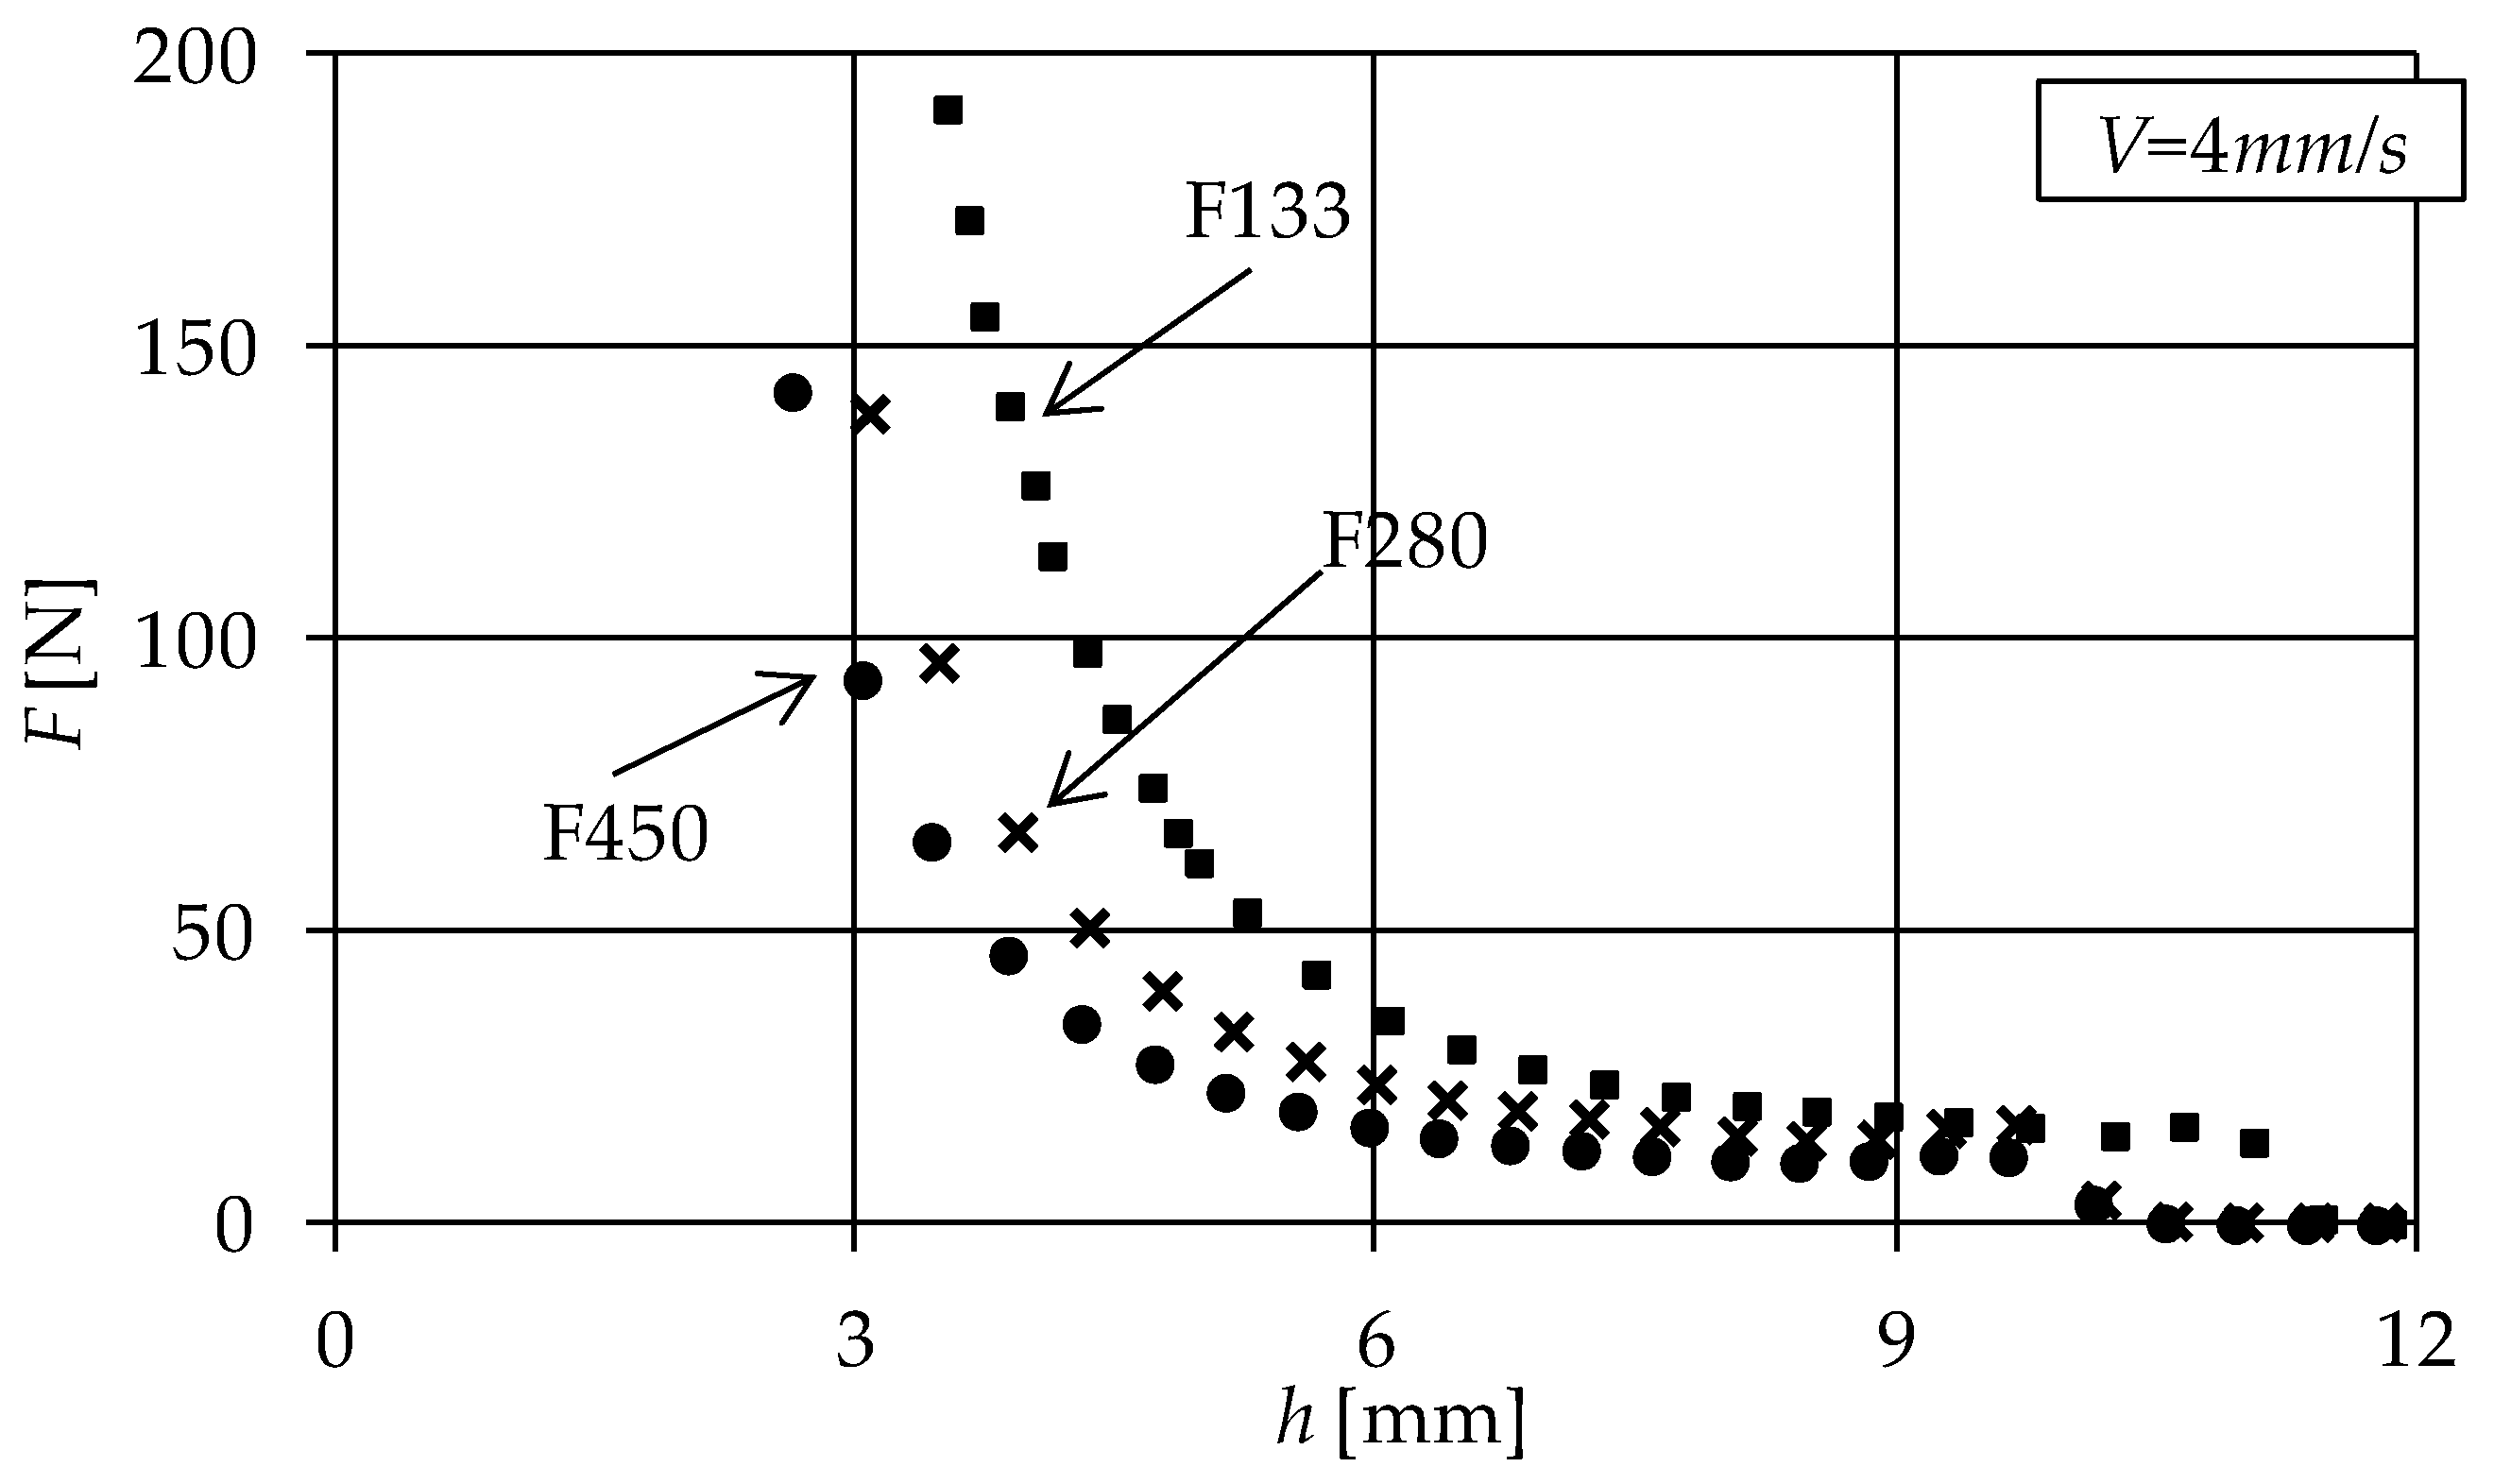
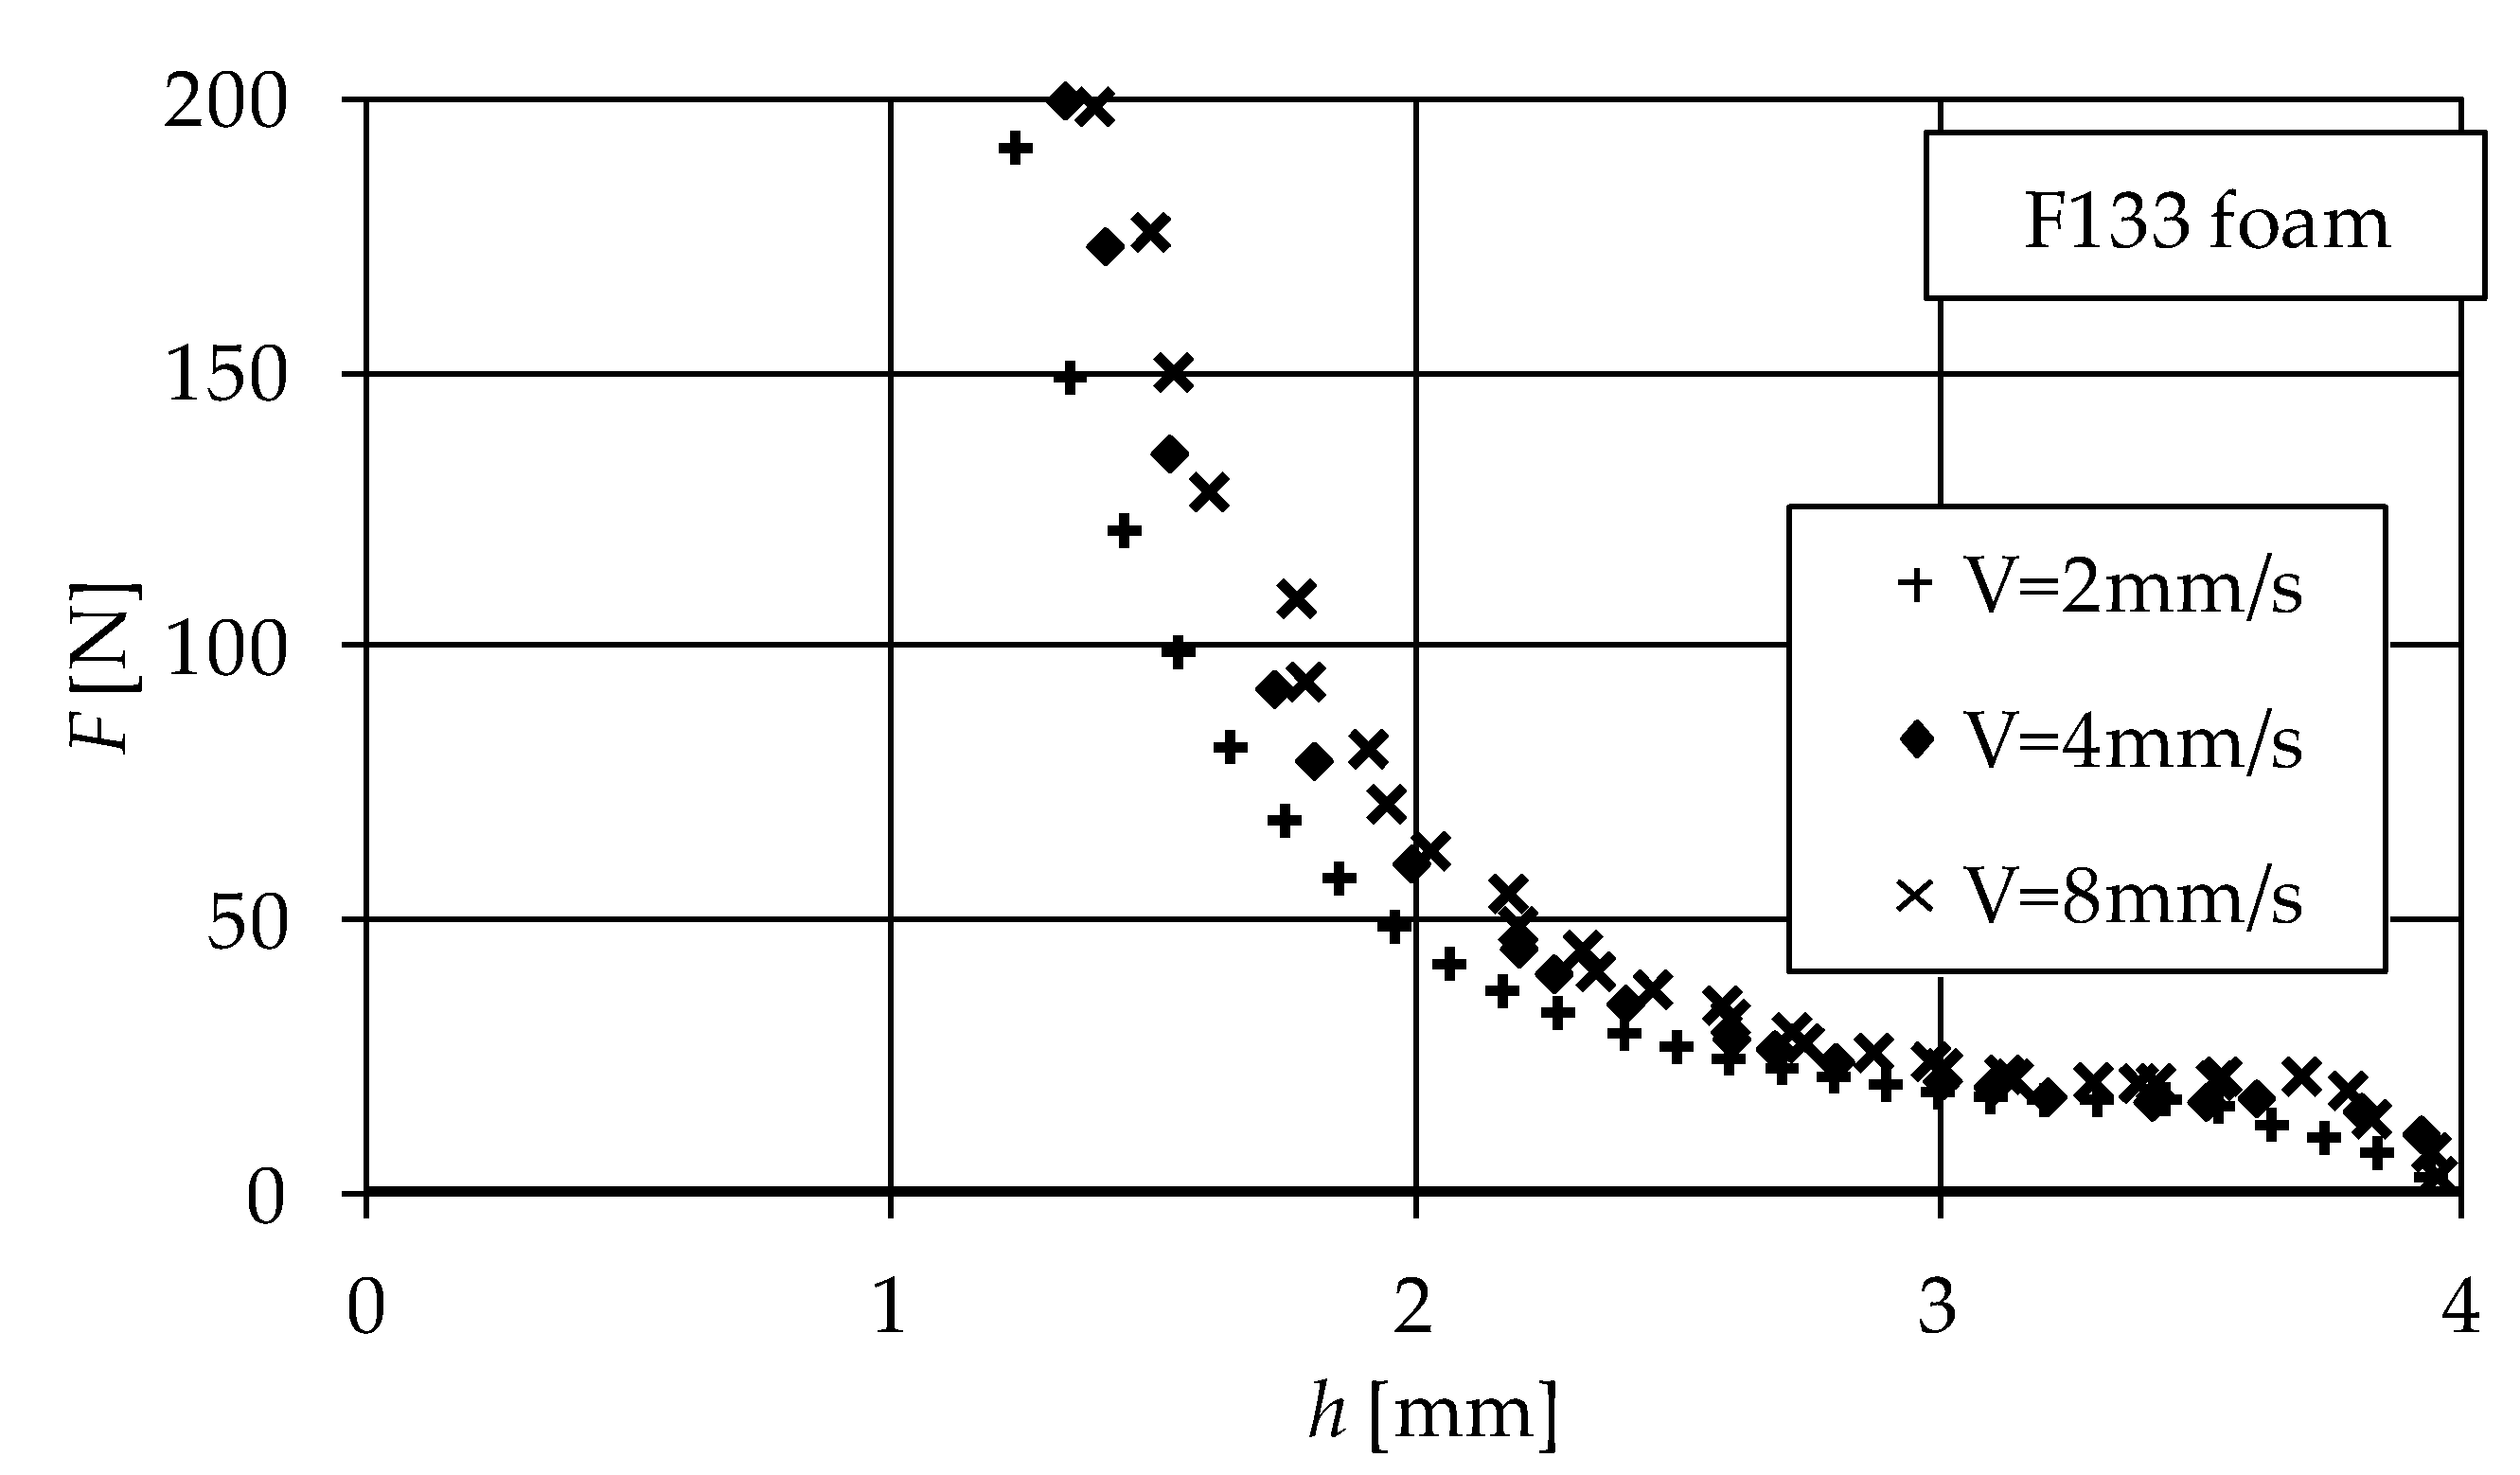
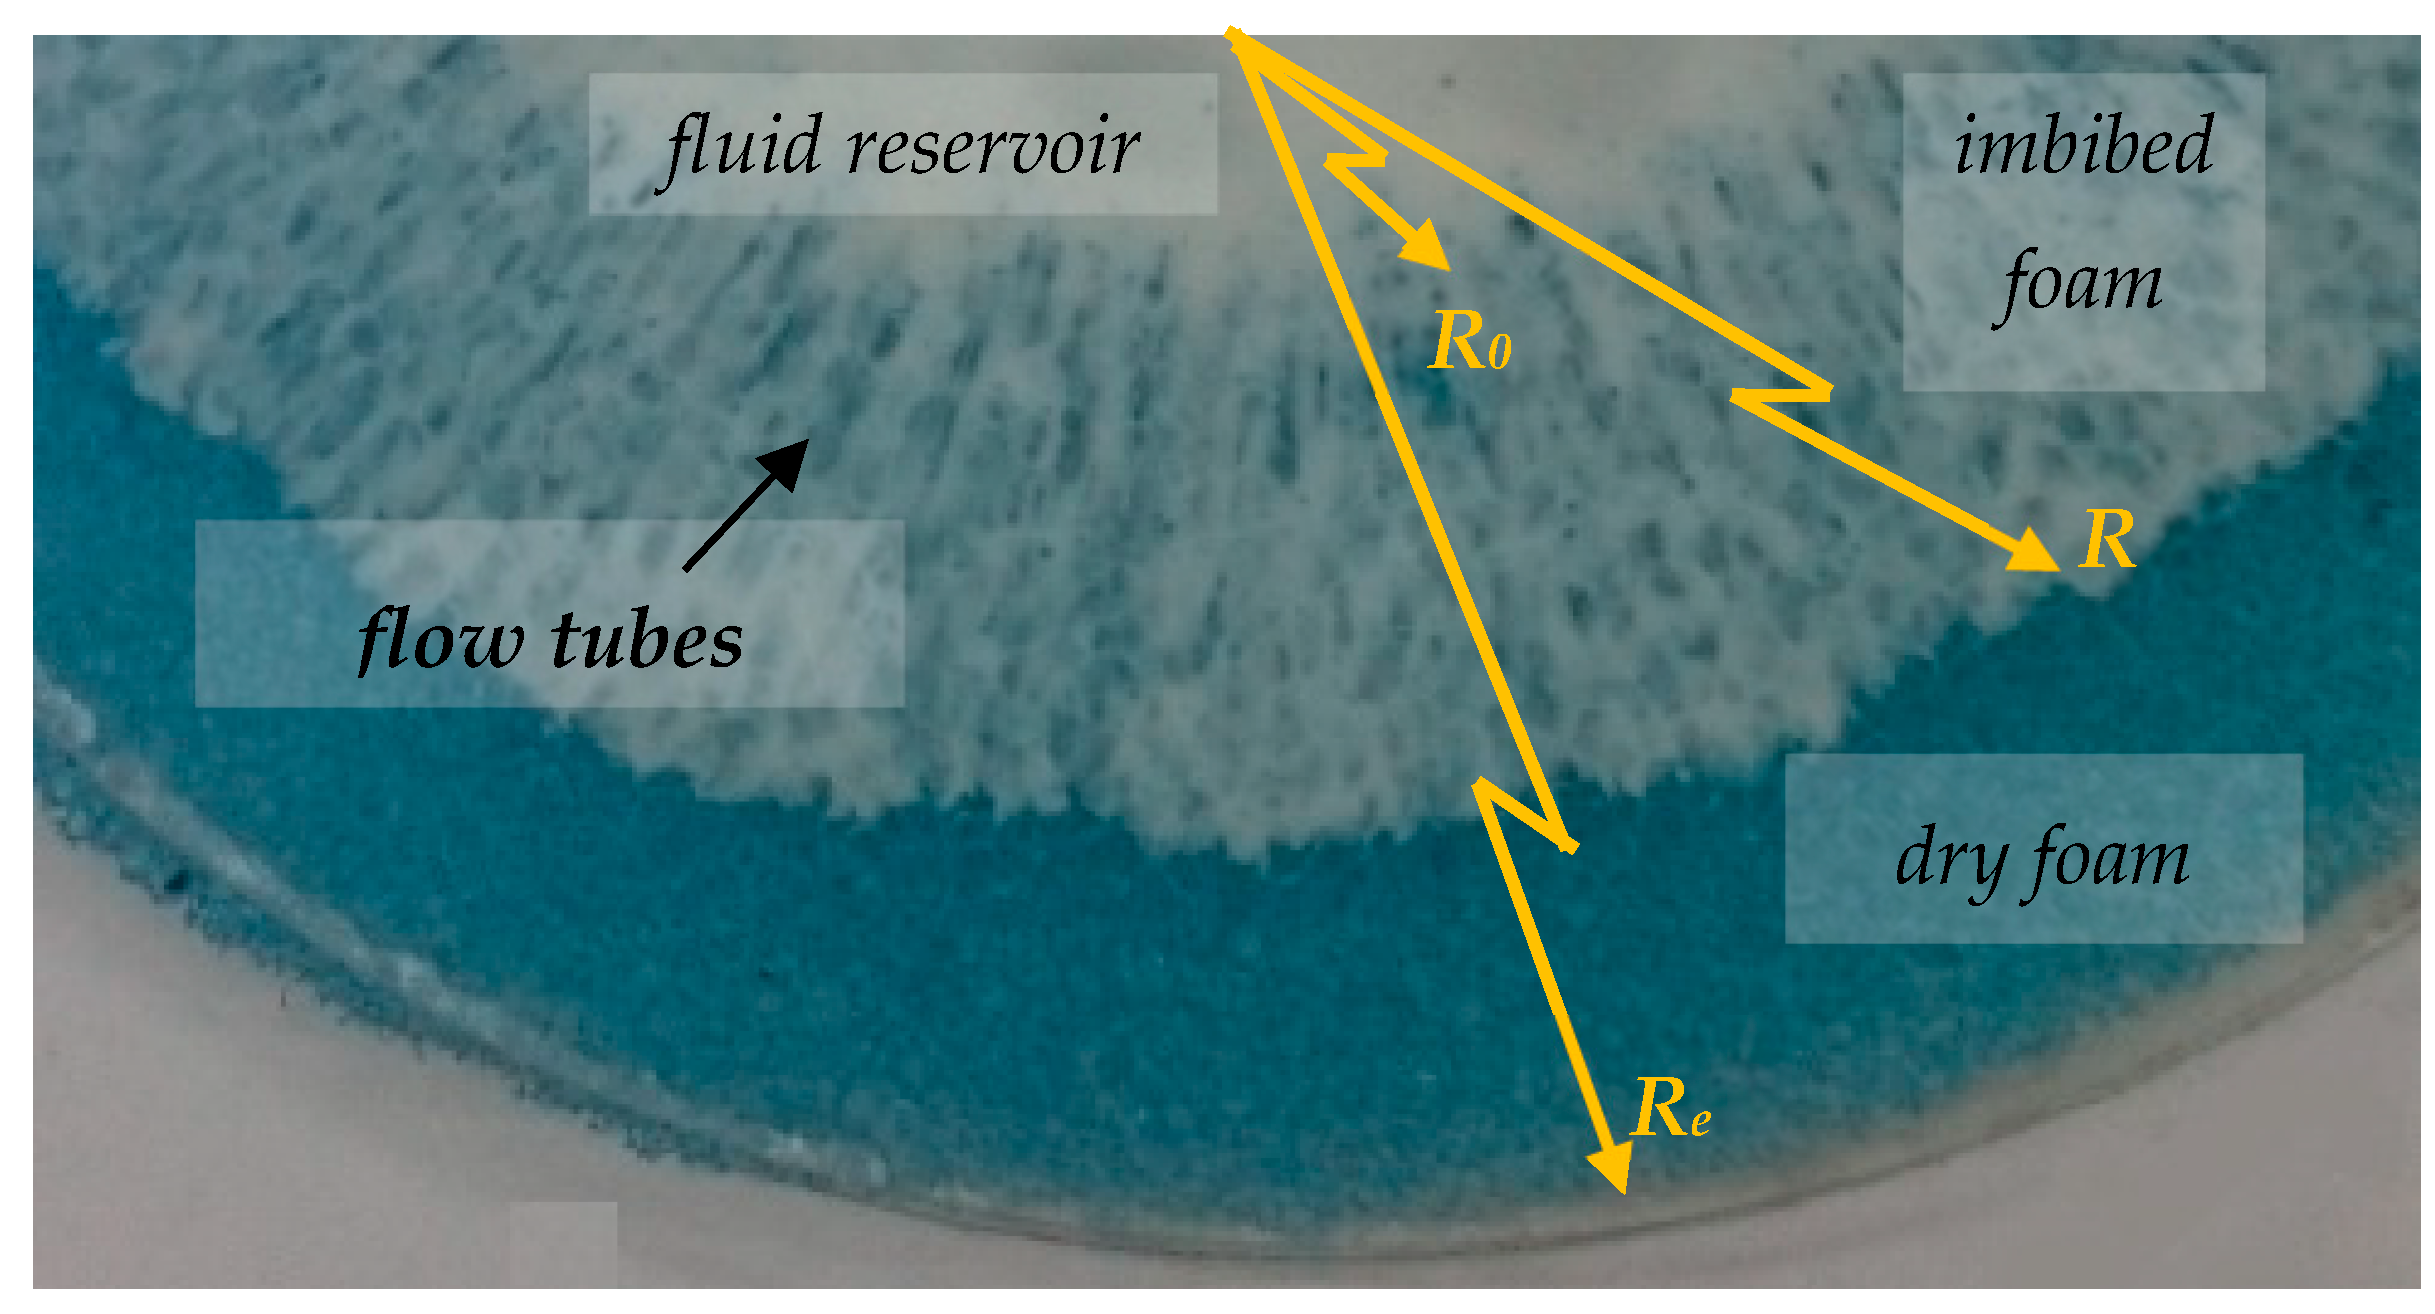
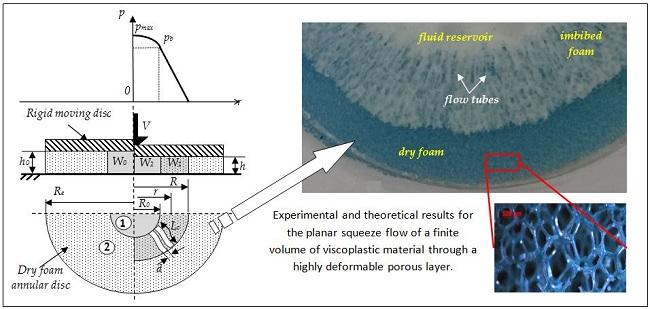
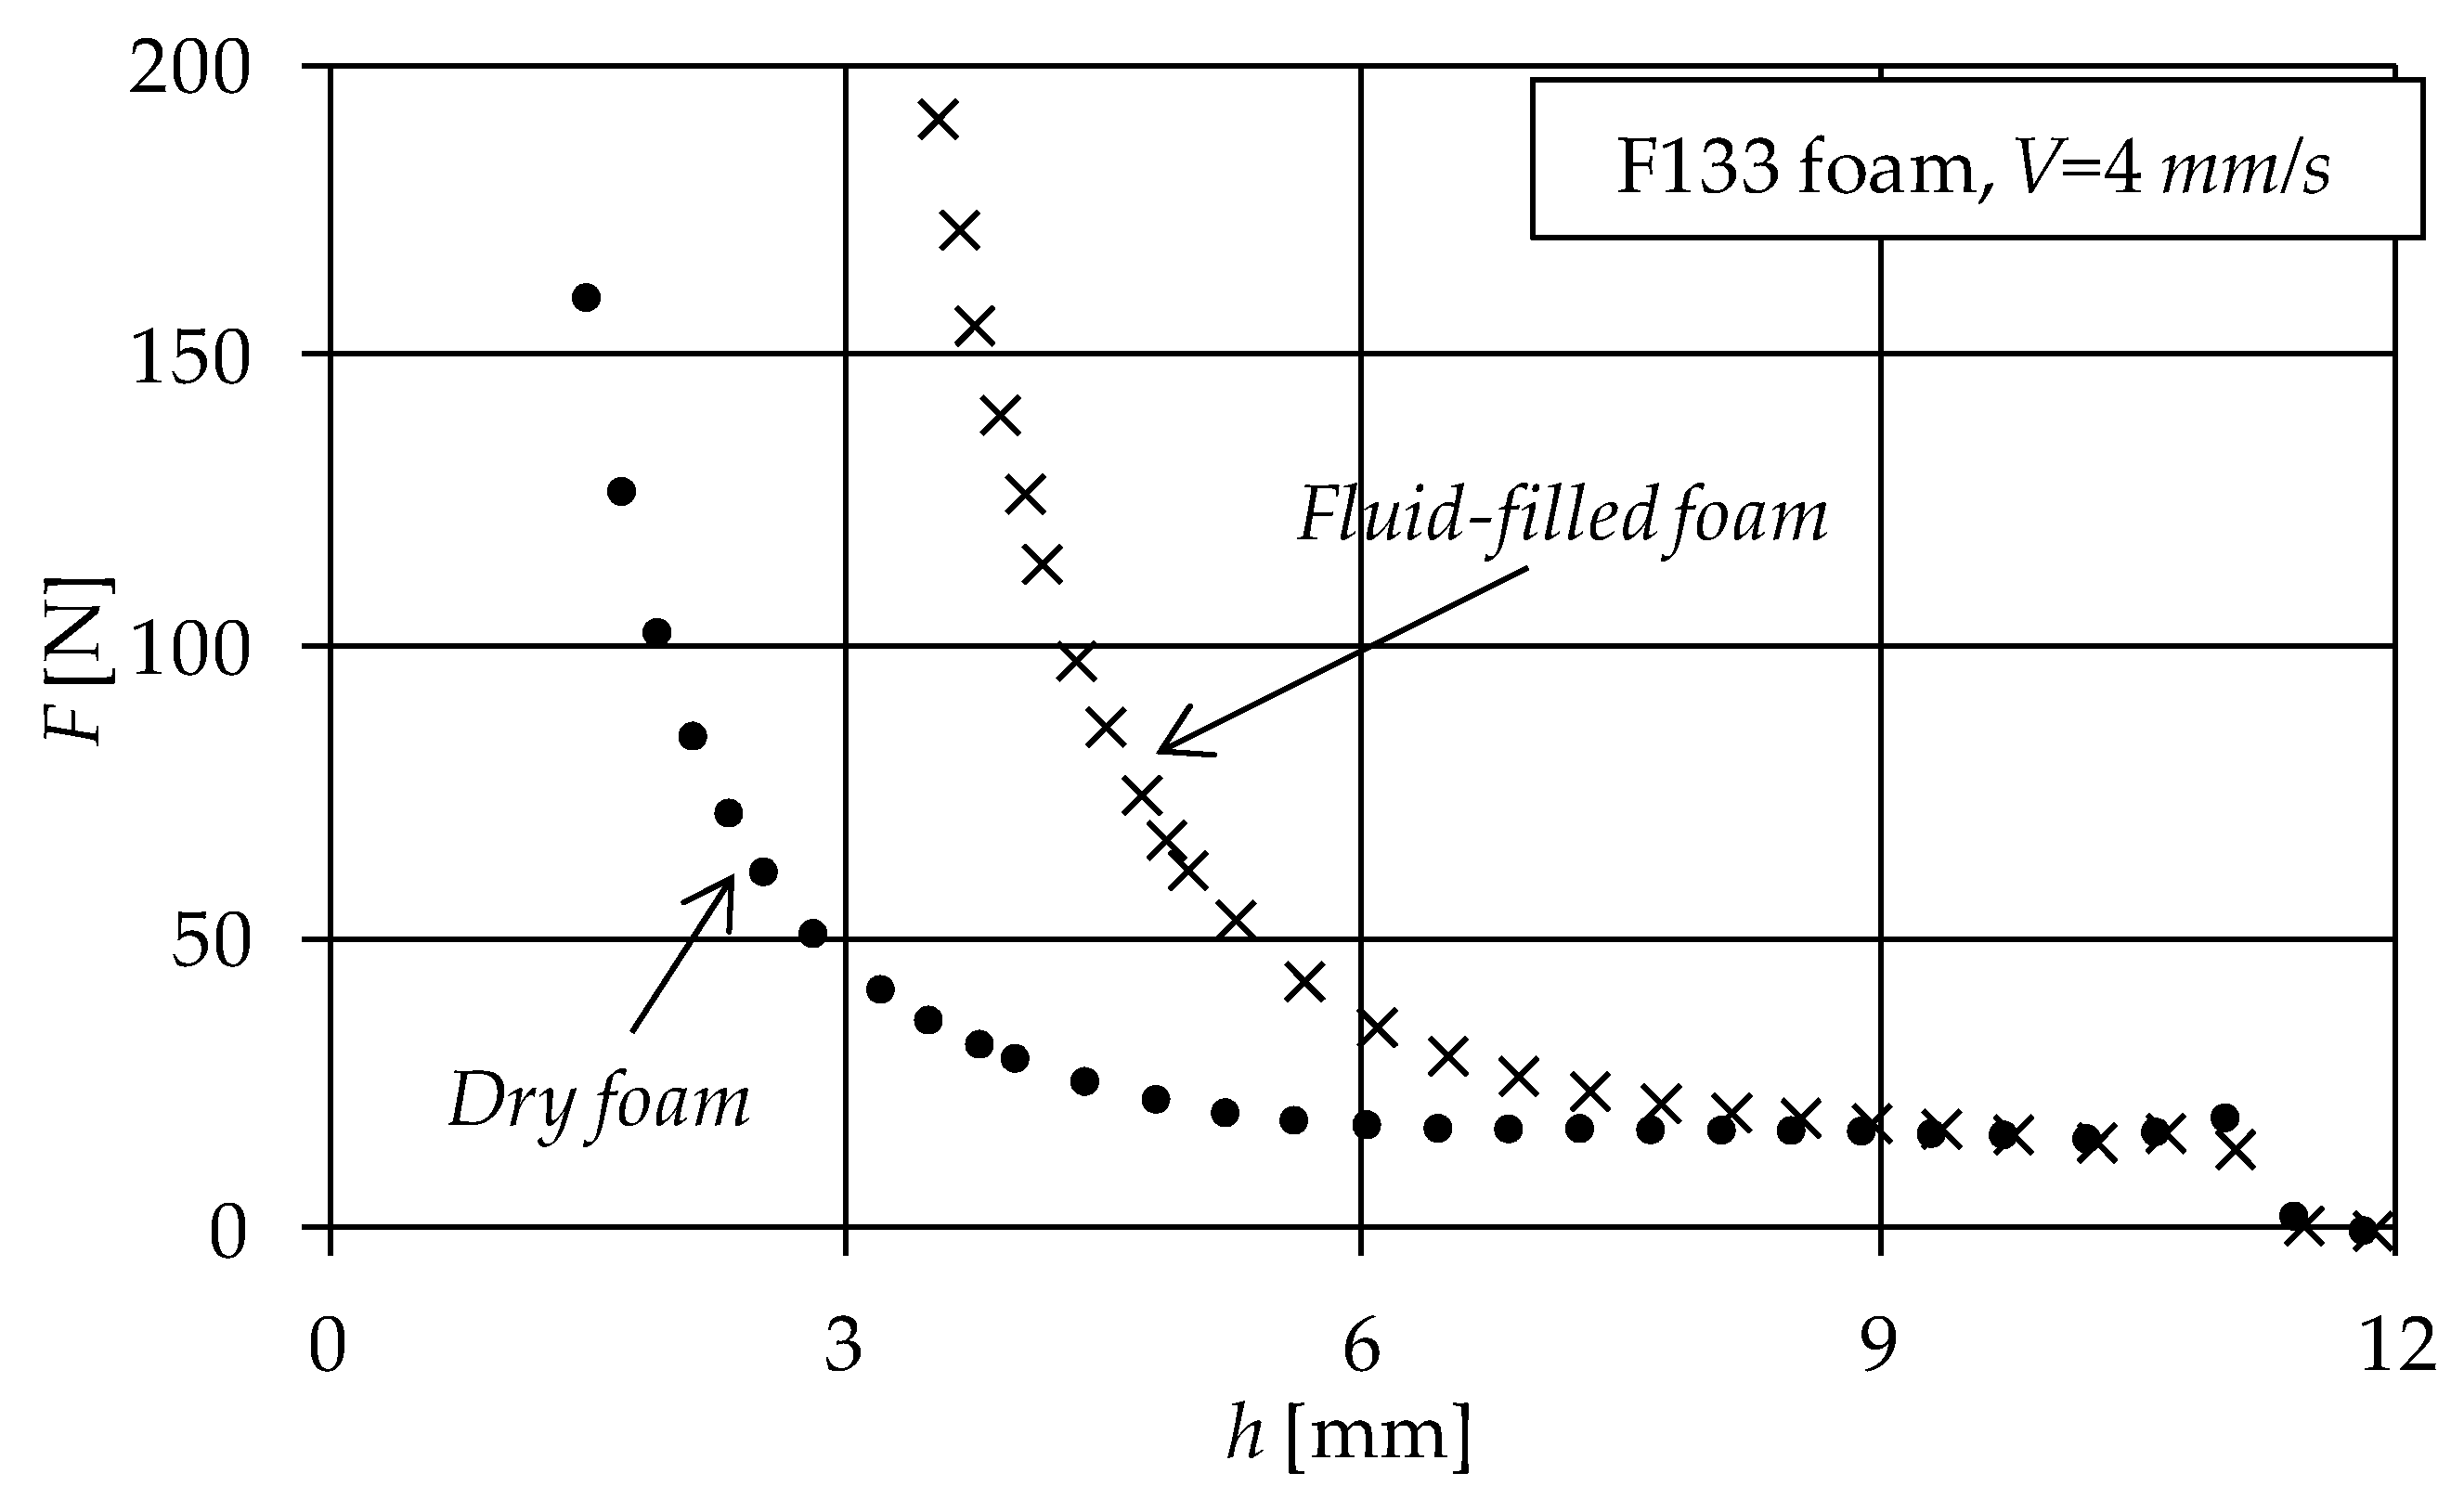
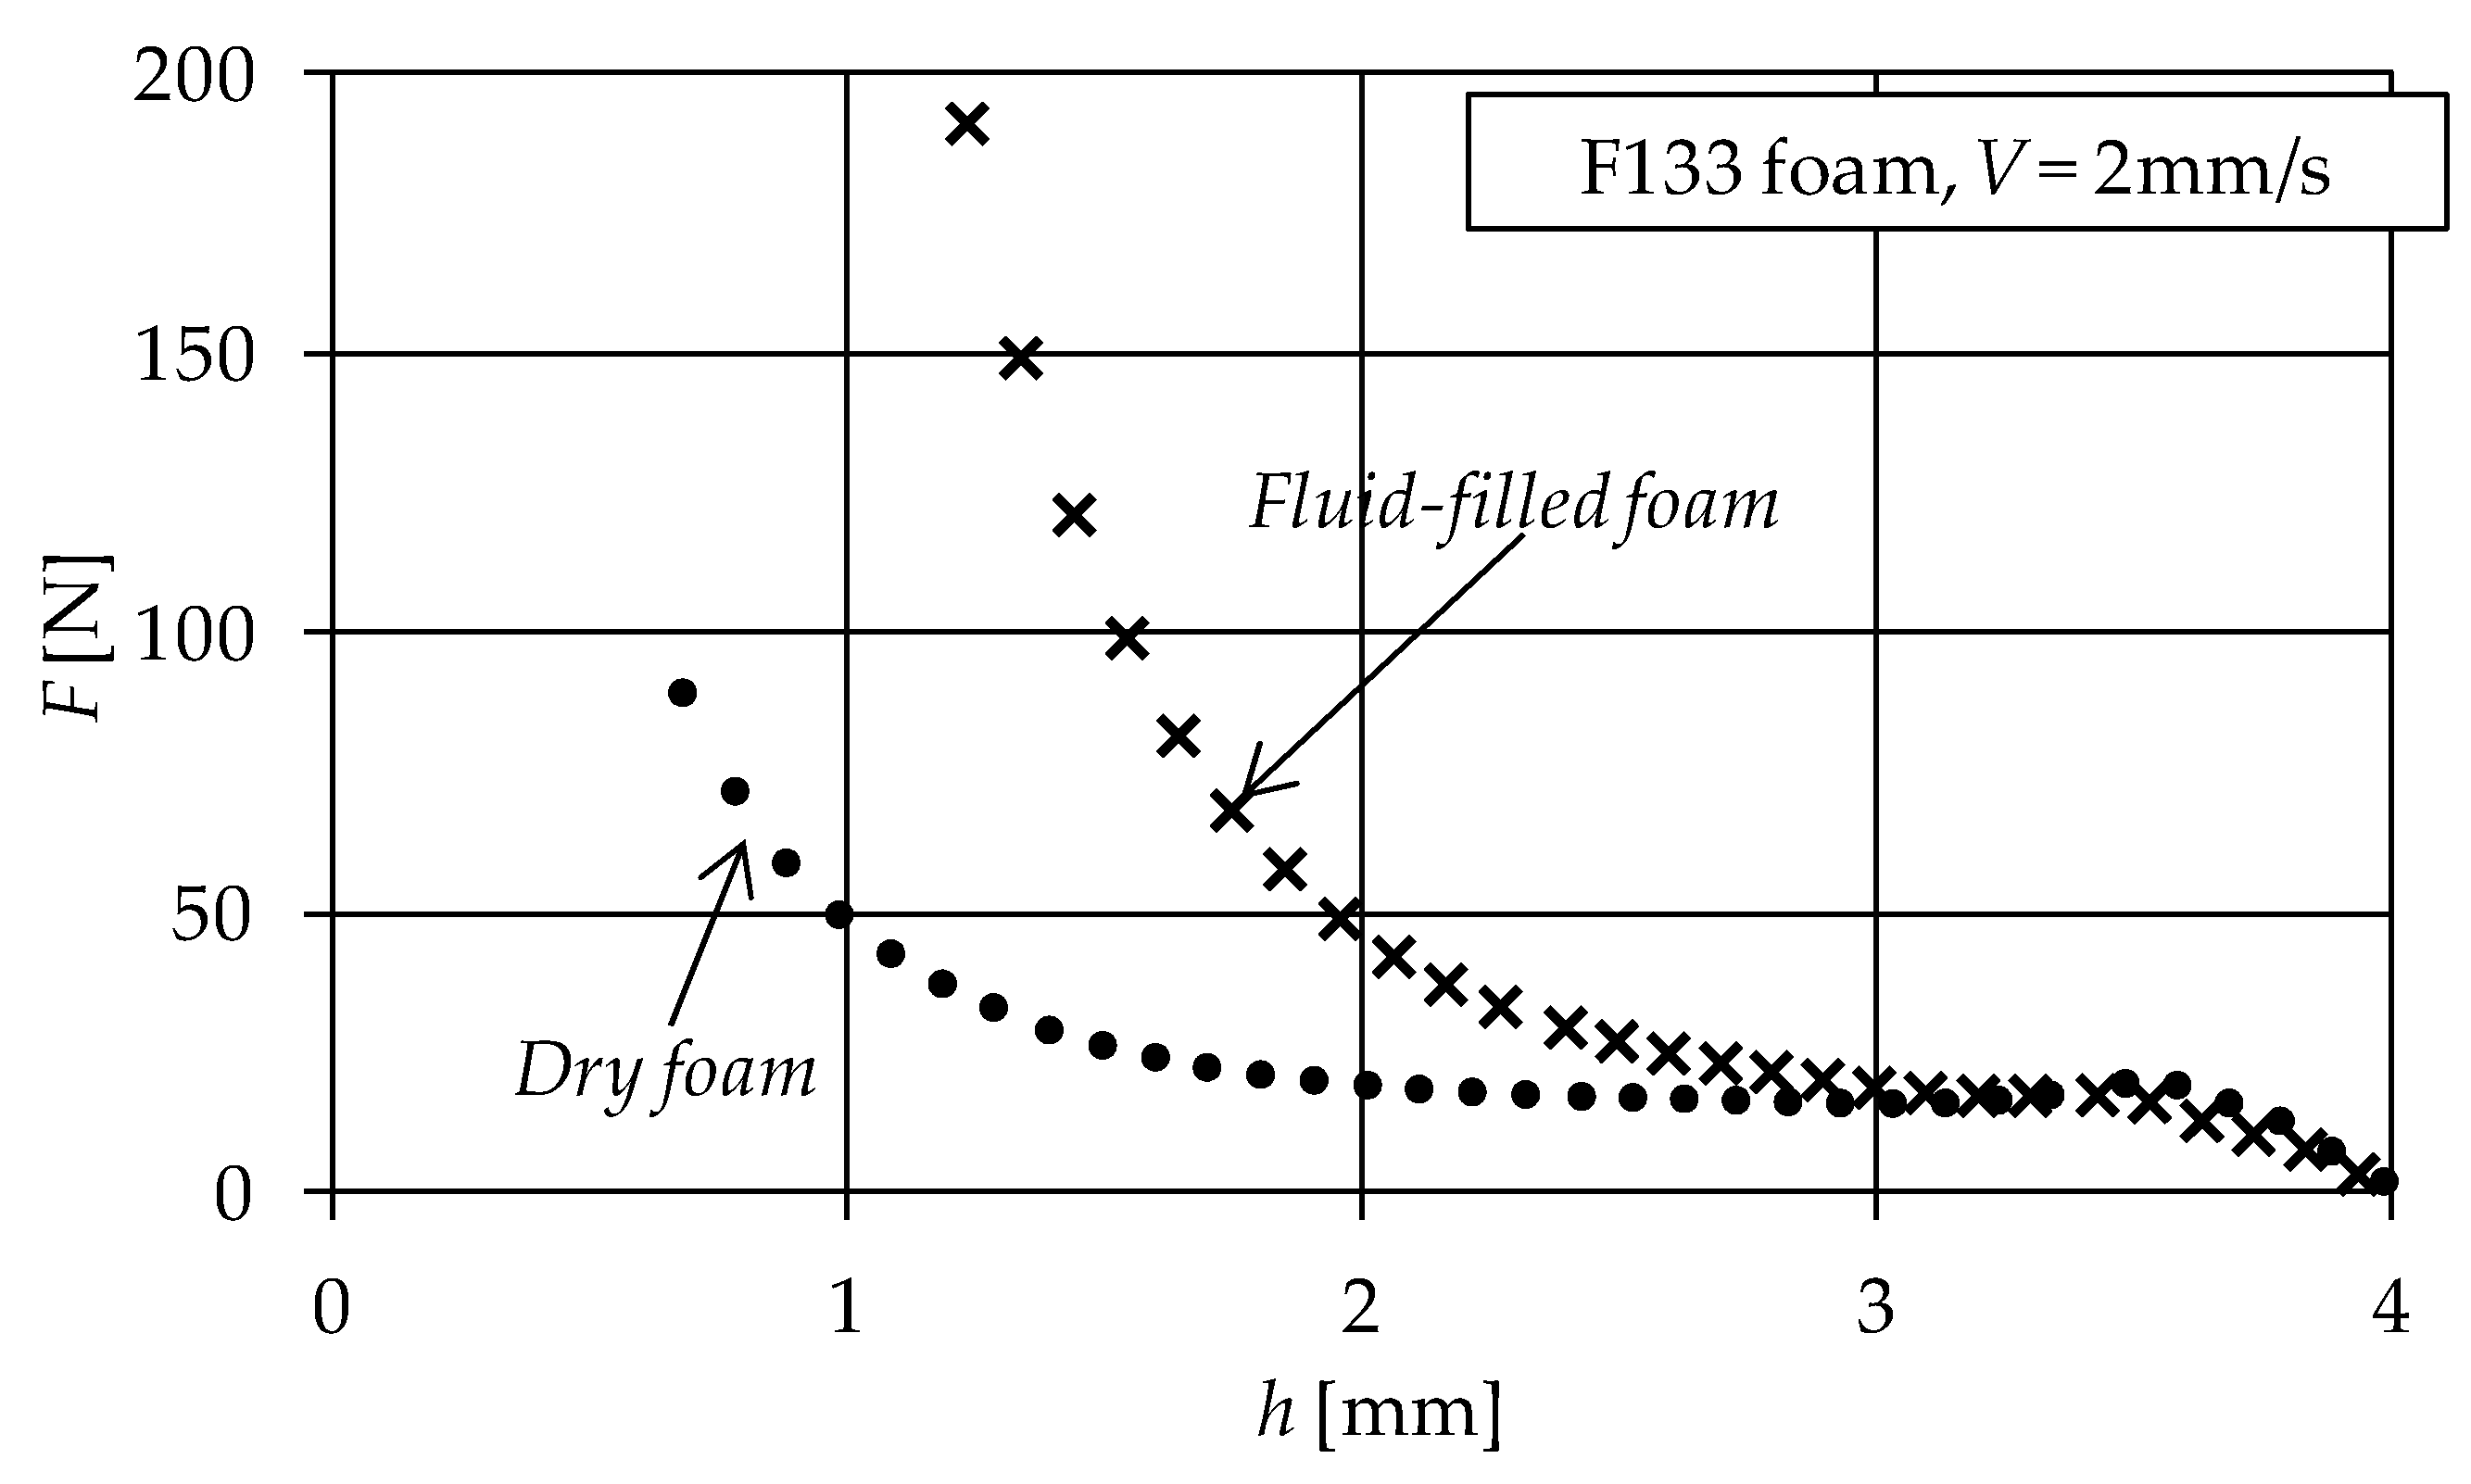
2. Experimental Evidence
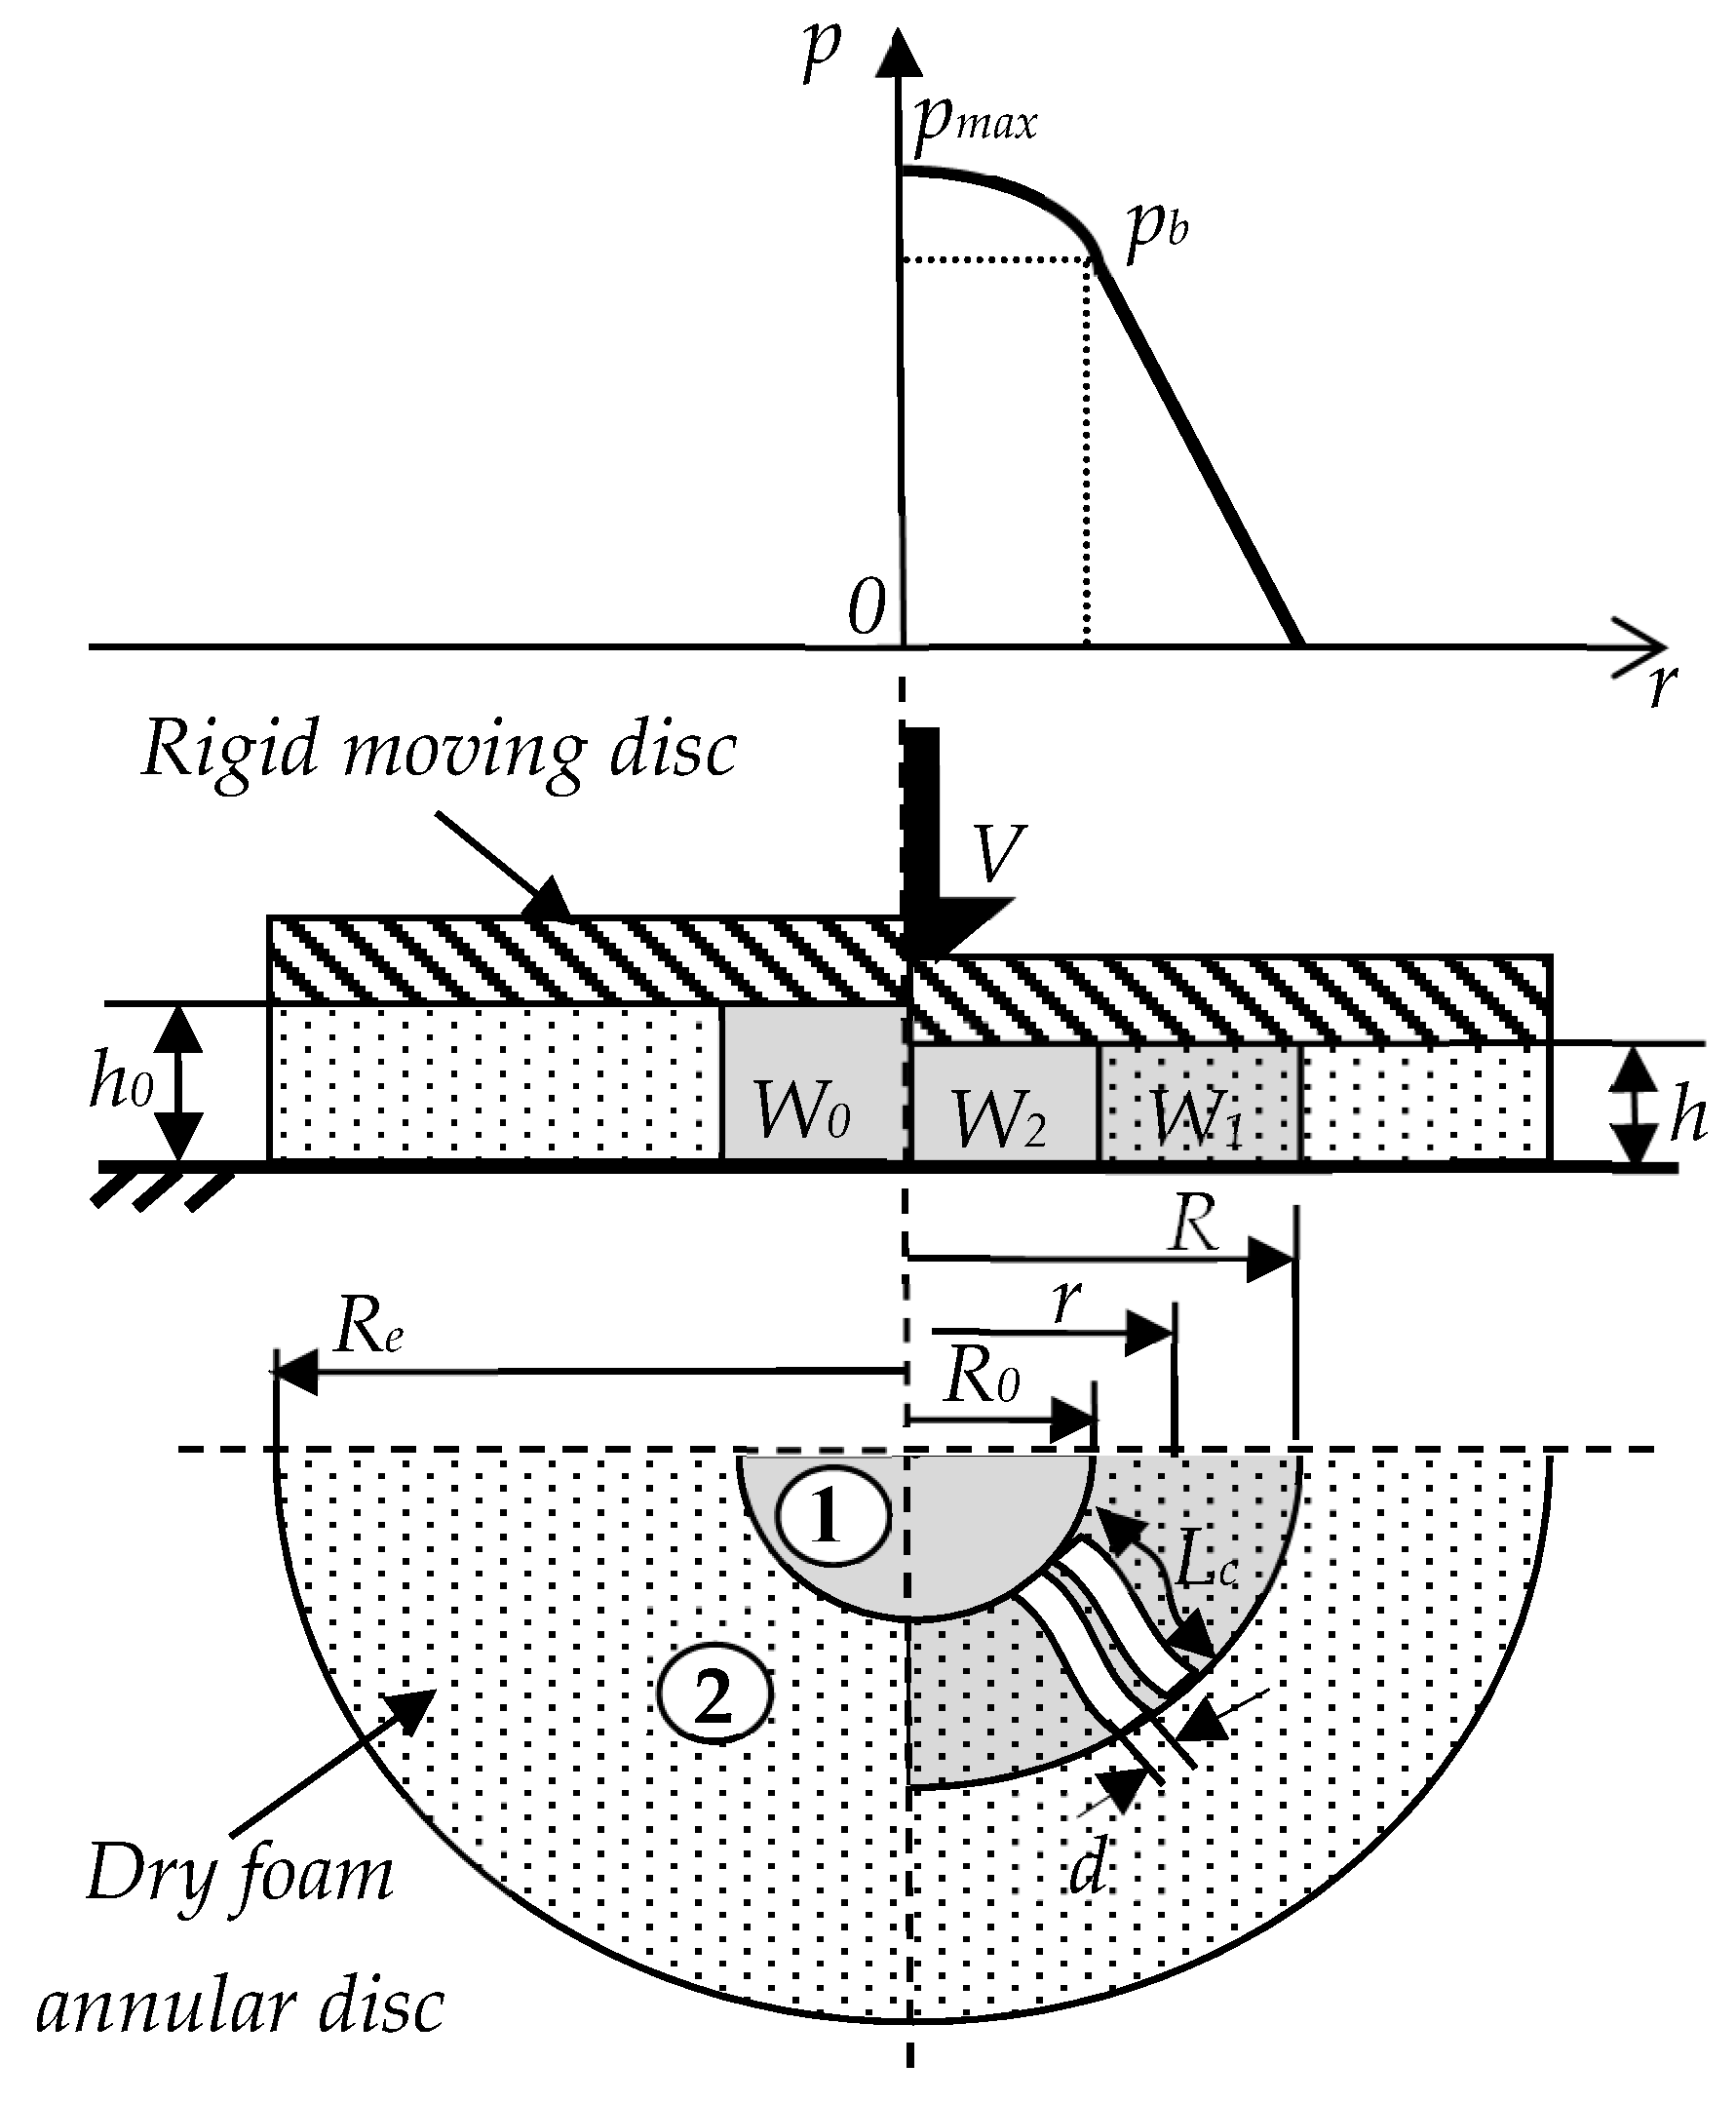
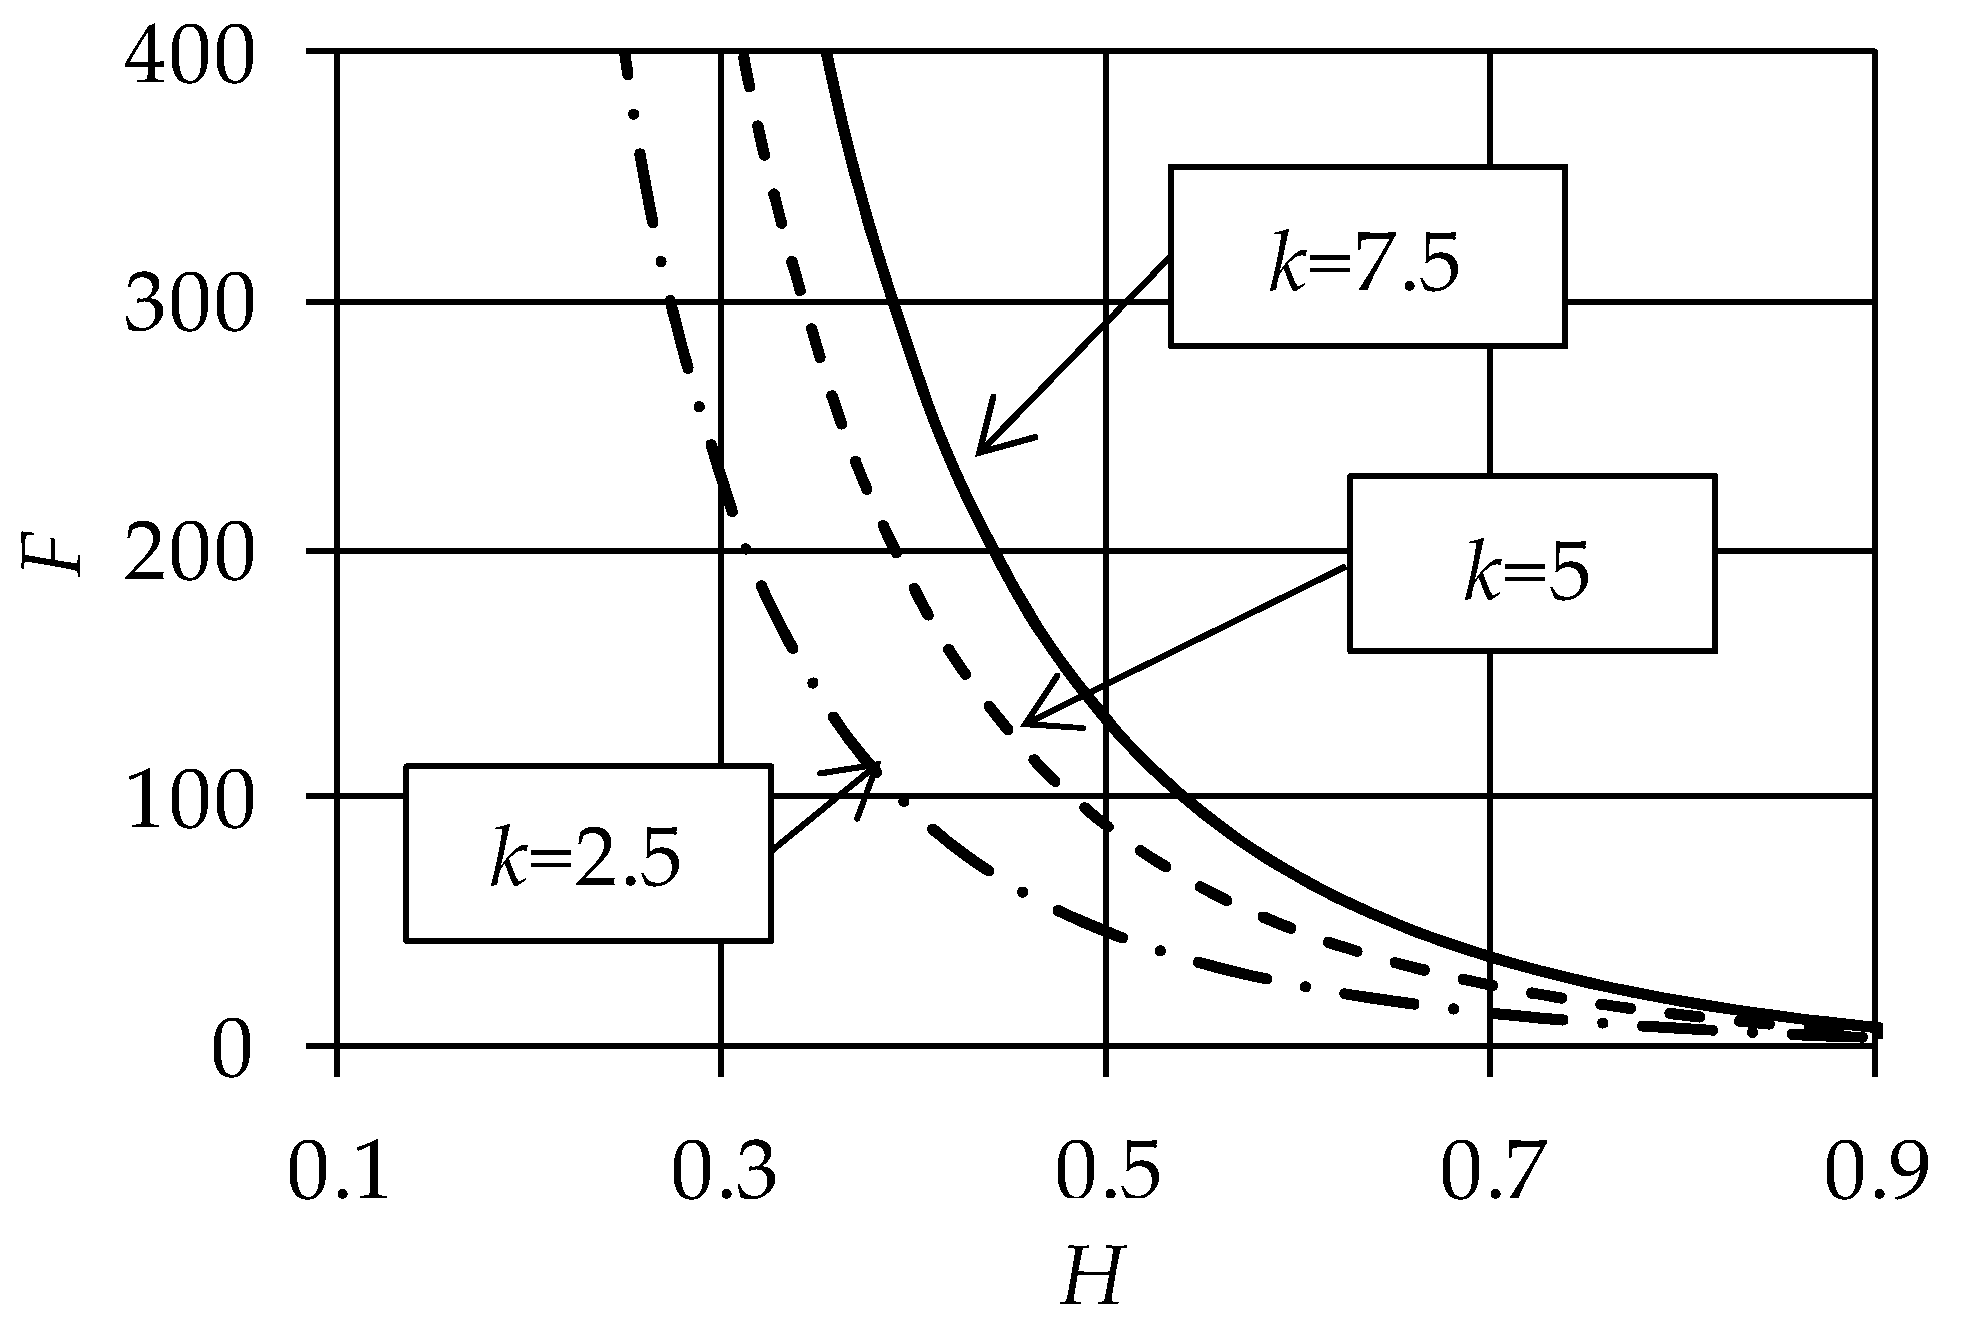
The experimental investigation was focused on measuring the force generated during constant speed squeeze of a highly compressible porous layer impregnated with a paste. Annular discs with an outer radius Re = 33 mm and inner radius R0 = 16.5 mm were cut from sheets of the same polyurethane reticulated foam (EUROFOAM ROMANIA, Sibiu, Romania) of different cell sizes and thicknesses (see Figure 1a).
Microscope (SMZ-1000, Nikon, Tokyo, Japan) visualization reveals the internal structure of the material, based on long filaments of polyurethane forming a 3D structure with the cross sections of the pores close to a hexagonal shape (Figure 1b). For each type of foam, the variation of pore size is very small and can be neglected. The initial porosity, ε0, for each type of foam was measured by gravimetric method. Table 1 summarizes the symbols and the properties of interest for the tested samples.
The viscoplastic fluid is a toothpaste. Its rheological behavior was studied using a Brookfield CAP 2000+ rheometer (BROOKFIELD, Middleboro, MA, USA), and the obtained results presented a shear stress–strain rate characteristic close to the Bingham fluid model, with a yield stress threshold τ0 = 350 Pa and viscosity η = 0.33 Pa·s.
The compression tests were performed on a CETR-UMT-2 test rig (Bruker, Billerica, MA, USA). An upper moving disc of radius Re was driven with constant speed downwardly against the lower stationary disc (Figure 2). A rigid force sensor (accuracy 0.1 N) was attached to the upper moving disc. Concomitantly, the position of the upper disc was recorded with a very accurate displacement transducer (accuracy ±1 μm). Three squeeze speeds were used: 2, 4, and 8 mm/s. All tests were limited by the maximum force that could be measured by the sensor Fmax = 200 N.
The squeezed fluid was placed initially only in the center reservoir of radius R0. Using a syringe with a micrometer screw, a very accurate volume of paste W0 = 3.4 cm3 was injected in the central reservoir of the disc as shown in Figure 2.
For each case, three consecutive tests were performed, and the average values were used in the subsequent analysis.
All the samples were tested successively in two configurations. Firstly, a simple compression test of the dry sample (without fluid) was performed, then the material was relaxed for a couple of minutes, the paste was injected in the reservoir, and a second compression test was performed.
The total compression force measured during compression with paste was generated by two mechanisms: (i) Resistance to pure squeeze flow in the center reservoir and further resistance to flow through pores in porous layer and (ii) the resistance to compression of the porous structure. These effects cumulate and can be evaluated separately.
Figure 3 presents a typical variation with sample thickness of the compression force for a F133 foam disc of initial thickness h0 = 12 mm. One can remark the sharp, small increase at the very beginning of compression (a force bump), produced by filaments buckling, typical for these materials. Compared with the squeeze force for fluid-filled materials, the force generated during the compression of the dry foam is very low; therefore, for theoretical approaches, it can be neglected for a limited range of thickness, varying between 0 < h < 0.4h0. This interval corresponds to the compression levels where fluid force has significant values. A similar behavior, but with slightly greater interval, can be observed for a thinner foam (h0 = 4 mm) in Figure 4.
Figure 5 presents the variation of the force for all three types of foams compressed with the same constant speed, V = 4 mm/s. One can notice that the force decreases with the initial porosity of the materials, with a maximum attained for the foam with the lowest porosity F133. A higher porosity is equal to a lower resistance to flow, and consequently, to a lower load.
The interest of the present experimental study was to evaluate the force generated during compression only by the resistance to flow, which is called XPHD force. This force can be obtained by extracting from the total measured force the contribution of the compressed dry foam. Figure 6 shows the variation of the XPHD force with the layer thickness at different compression speeds, for the foam with the lowest porosity. As expected, the force slightly increases with compression speed.
The visual inspection of the specimens after being squeezed (see Figure 7) clearly reveals that the flow occurs inside tortuous tubes. It can also be seen that the process is axisymmetric. For all the experiments done, the front of the fluid stops before reaching the outer radius, Re, due to the limitation of the maximum squeeze force of the test rig.

3. Analytical Model

The geometry of the theoretical model is presented in Figure 8. An annular disc layer of dry porous material is squeezed between two rigid disks with perfectly flat and impermeable surfaces. The rigid disks as well as the porous disk have the same radius Re. The porous disc has a centrally placed reservoir of radius R0, filled with a Bingham fluid. The disks are perfectly parallel and concentric and thus the model is assumed axisymmetric.
Initially (at t = 0), the volume ought to be compressed is divided in two parts: the cylindrical central reservoir occupied entirely by Bingham fluid-zone 1, and the surrounding annular, dry porous disc-zone 2.
During normal compression, the Bingham fluid is squeezed out from zone 1 through the surrounding porous medium (zone 2). For t > 0, zone 2 becomes gradually imbibed with fluid from the center to the outer boundary.
According to the classical assumptions of XPHD lubrication, the present model neglects the elastic forces generated by the solid structure, and considers only the effects of the fluid flow.

3.1. Flow Model for Zone 1

For Bingham fluid squeeze flow in zone 1, the model proposed by Covey and Stanmore [18] can be used. Introducing the modified plasticity number, S 0 = R 0   V   η h 0 2   τ 0 Covey and Stanmore proposed an analytical formulation for load carrying capacity for constant speed squeeze with zero pressure boundary condition. The model was validated using experiments for Bingham and Herschel–Bulkley fluids, using a parallel-plate plastometer. Two different analytical solutions were proposed for two domains of operating conditions: S0 < 0.05 and S0 > 10, respectively.
Based on our experimental data, the variation of modified plasticity number is between S0 = 2 × 10⁻⁴–8 × 10⁻³. As a consequence, the squeeze force, for zone 1, can be calculated with the solution for S0 < 0.05:
F 1 = π R 0 2   p b + 2 π 3 τ 0 R 0 3 h + 4 π 7 h 0 τ 0 R 0 3 h 2 2 S 0
where the first term in the right hand side counts for the supplementary load produced by the non-zero pressure at the reservoir boundary, p0.

3.2. Flow Model for Zone 2
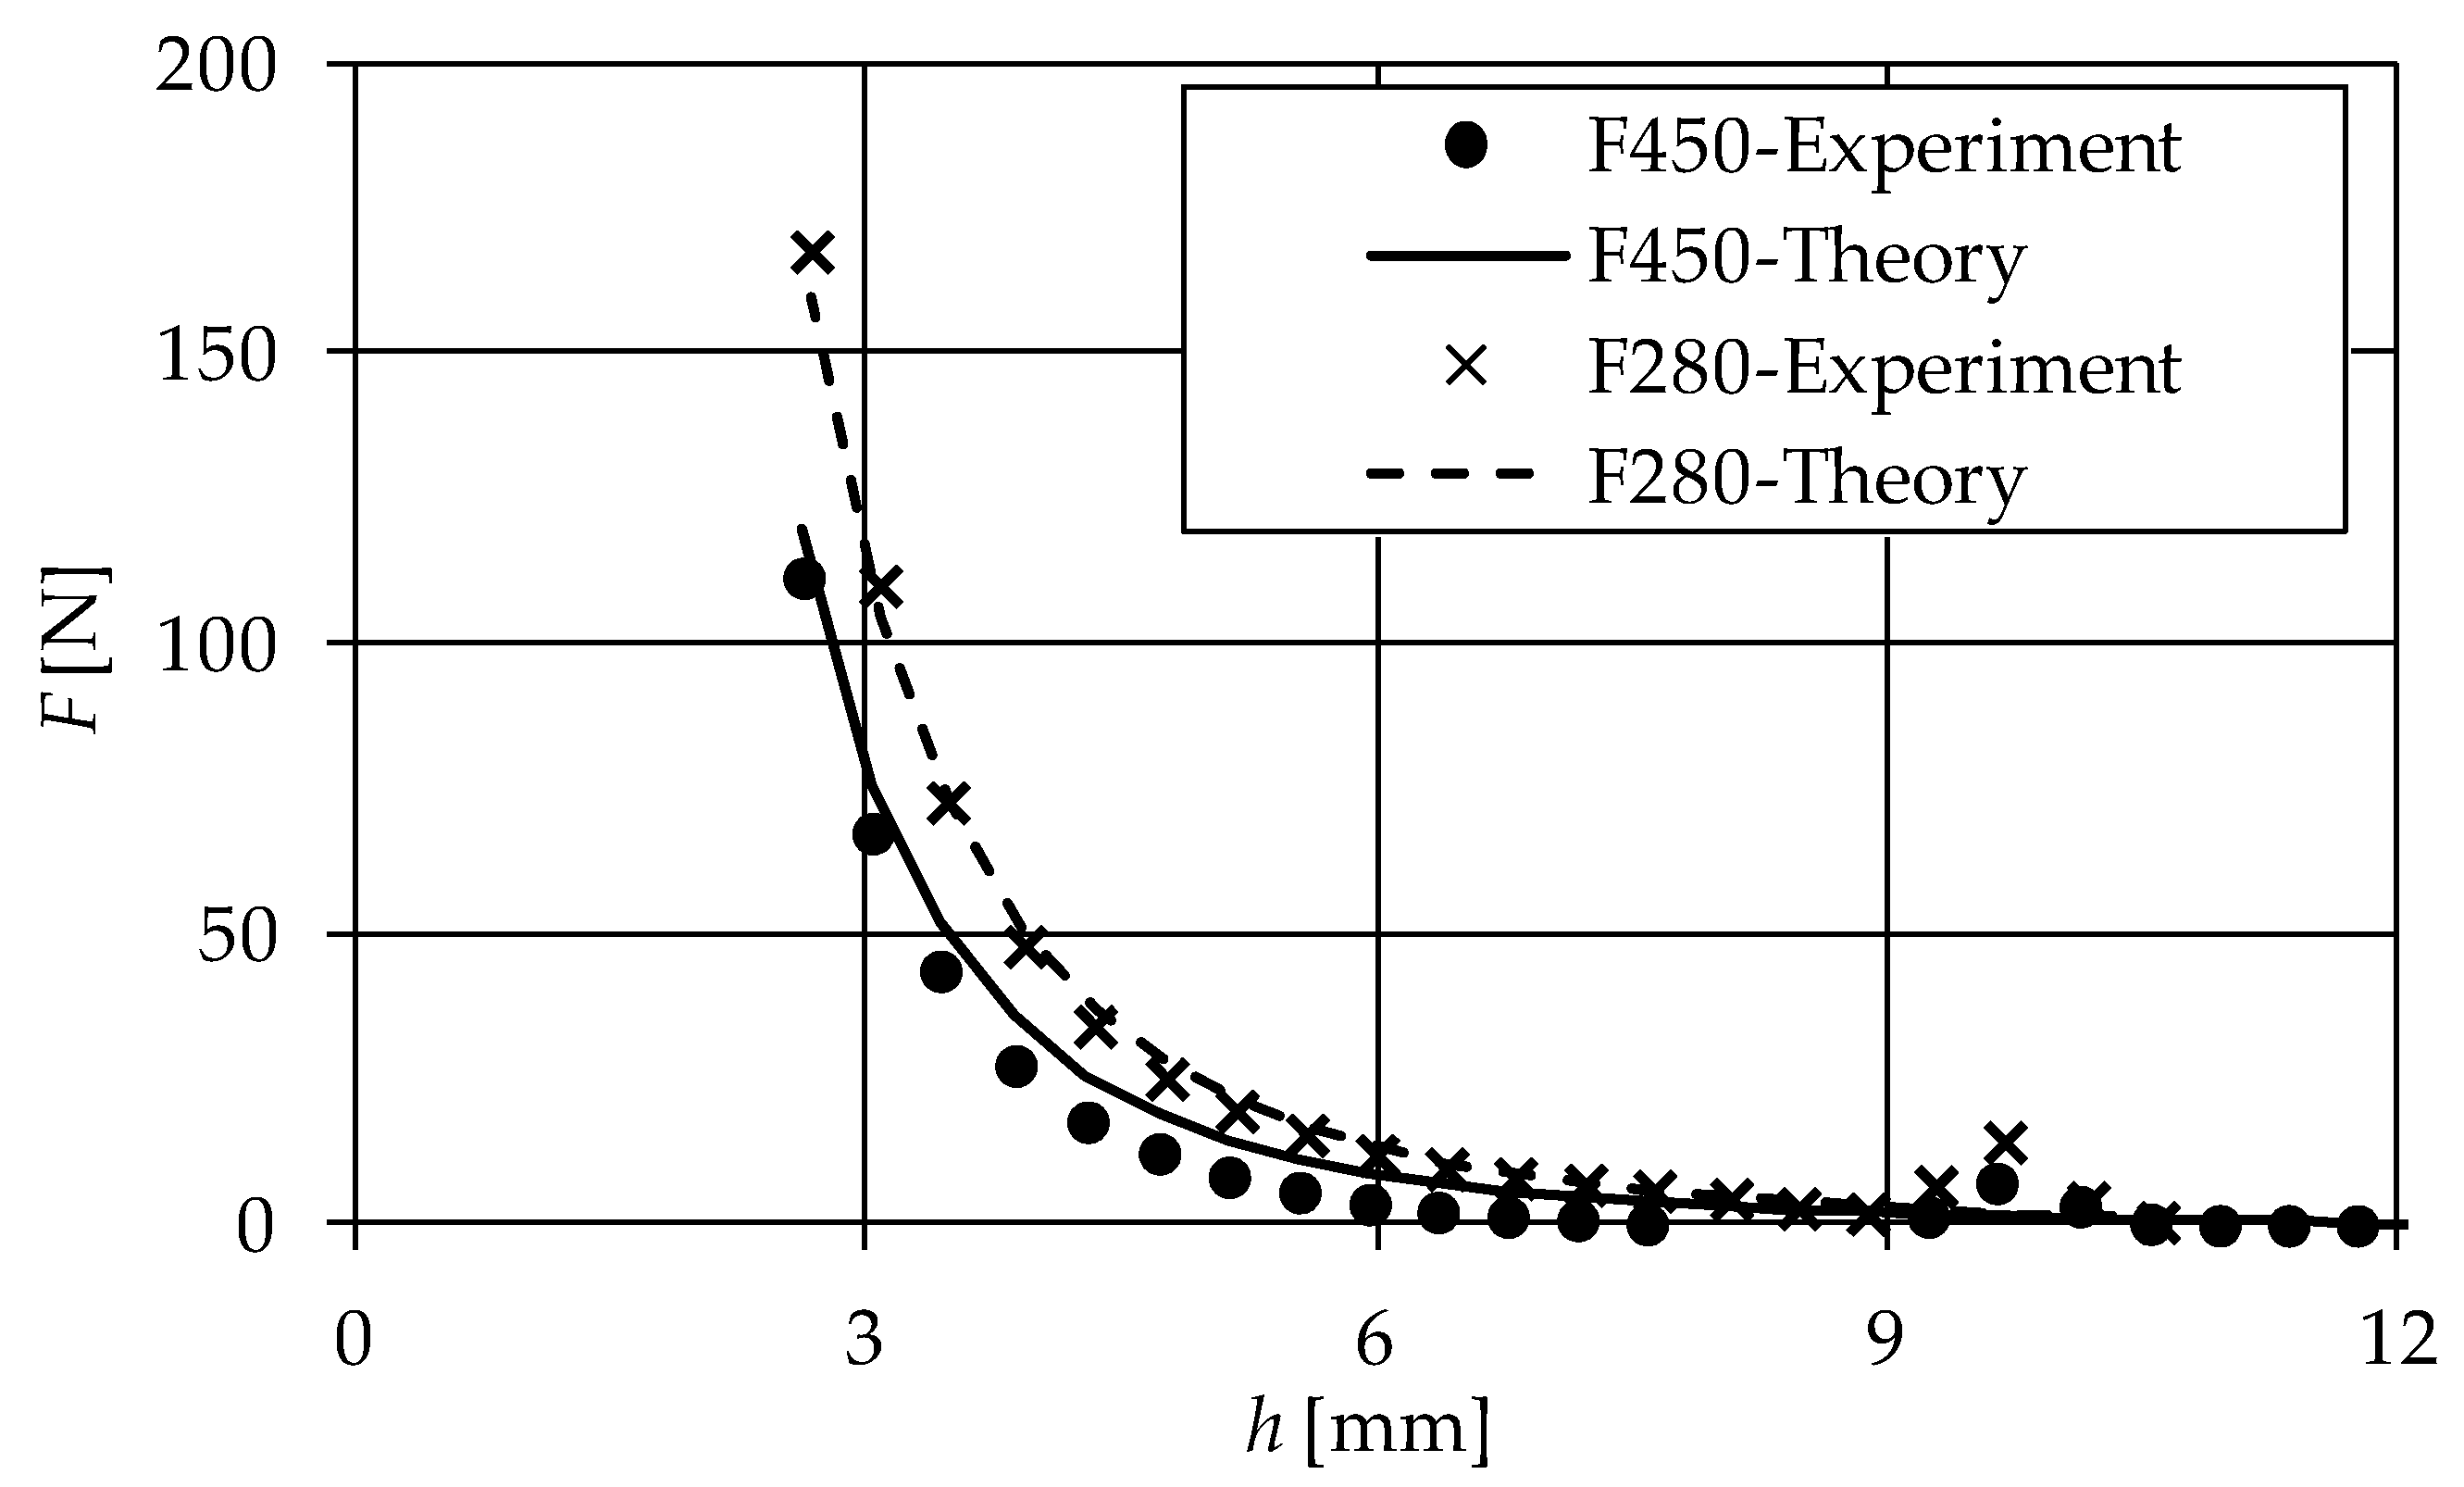
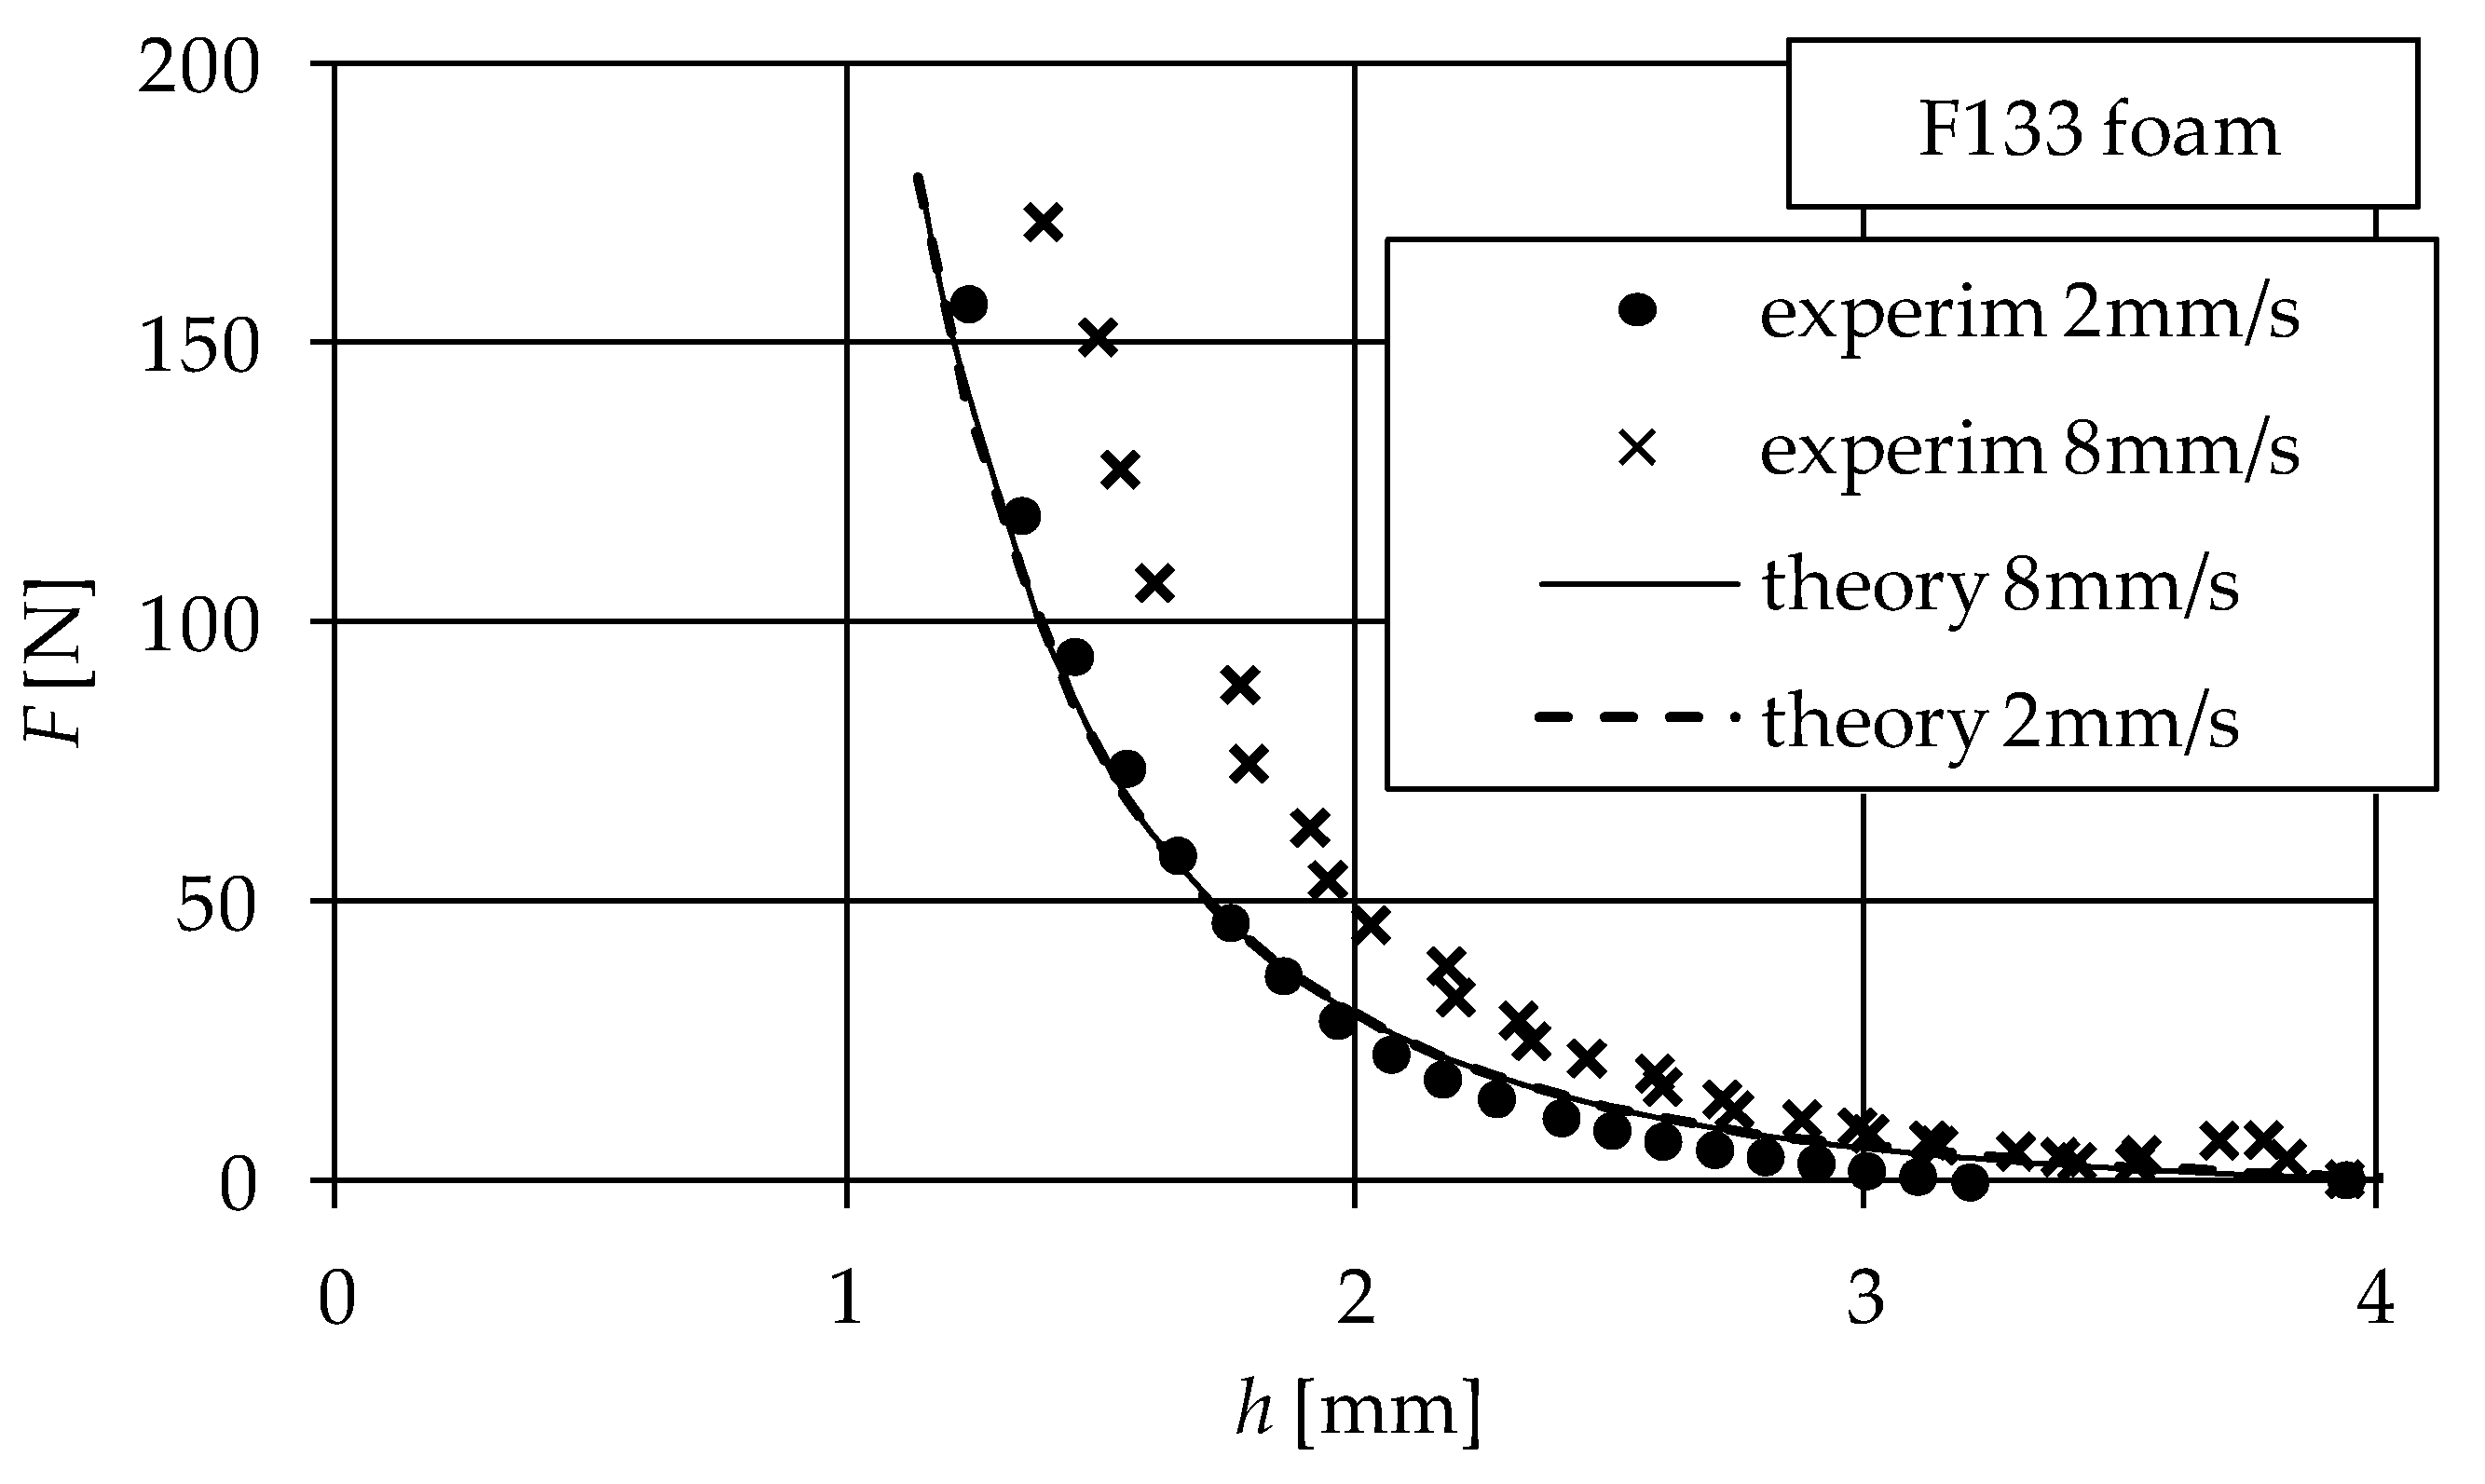
The flow inside a porous matrix can be characterized by the well-known Bingham number:
B n = τ 0   d η   u m
where um is the fluid velocity, averaged across the height of the porous disk, and the pore diameter, d, is used for the characteristic size.
Obviously, um varies in time and space and vanishes at the front of the flow. It has a maximum value at the inner radius of the porous disk, R0, which can be calculated function of the compression speed V, as shown in the Appendix A.
In the case of our experiments made at low speeds, the Bingham number exceeds 100, which allows us to consider the flow completely viscoplastic [19].
As shown in Figure 7, the experiments revealed the formation of flow tubes inside the porous foam due to fluid squeezing. Using the concept of “equivalent flow tubes” [16,20], an analogy can be made between the Poiseuille flow of a Bingham fluid through porous materials, at high Bingham number, and the flow through straight parallel tubes. All tubes are radially aligned, and the Bingham fluid flow is similar with an extrusion process of a paste through the pores of a sieve when the plug is equal with the flow tube diameter. The pressure drop inside radial tubes can be determined using the classical equation for viscoplastic flows in tubes:
d p d r = τ 0 ρ
where the hydraulic radius ρ is used to extend the generality of Equation (3) to any shape of the tube cross-section.
Equation (3) is valid only for small velocities, which is the case of our experiments. At higher velocities, the shear stress of the tube walls will be greater due to additional viscous effects.
Moreover, modeling the axisymmetric flow with the flow through a bundle of straight flow tubes seems to be objectionable because it cannot provide evidence of fluid slow down due to increased cross sectional area, as one moves from the center; hence, we expect the model to overestimate the pressure distribution. However, as the front of the flow moves toward the outer boundary, the disk thickness reduces due to compression. This compensates the increase of the diameter of the cross sectional area.
By definition, the hydraulic radius is the ratio between the tube cross-section area α and wetted perimeter β:
ρ = α β
For the geometric configuration of the high porosity structure (ε0 > 0.95) (Figure 1), we assume that the filaments of the pores are subjected mainly to bending when compressed. This phenomenon is described in reference [15] and is explained by structural instability. Therefore, during the compression of the porous material, the tube perimeter can be considered constant (β = πd).
On the other hand, during compression, the porosity is assumed to be proportional with the tube cross sectional area:
α ε = α 0 ε 0
where α0 = πd2/4 is the cross-sectional area of a flow tube. This assumption is in accordance with the Delesse [21] conclusions.
According to assumption (iii)—see Introduction—solid fraction conservation yields:
h ( 1 ε ) = h 0 ( 1 ε 0 )
Combining Equations (5) and (6) one obtains:
α = α 0 ε 0   h [ h h 0 ( 1 ε 0 ) ]
Finally, combining Equation (3) with Equations (4) and (7) results:
d p d r = 4 τ 0   ε 0   h d [ h h 0 ( 1 ε 0 ) ]
Due to the “Principle of least work”, the fluid from the central reservoir flows through the porous material, following the shortest path inside the radial tubes. The flow tubes are formed from connected pores and, therefore, it is obvious that they are not straight. Figure 7 confirms the previous affirmation. Based on this observation, a correction must be made in order to take into consideration the flow in a sinuous tube. This could be done by using the tube tortuosity T, defined by Guyon [22] based on a similitude with electric conductivity, as seen below:
T = ( L c R R 0 ) 2
where Lc represents the length of the sinuous tube.
A similar approach was proposed by Scheidegger [20] for the correction of the relation between permeability and porosity with influence on the pressure drop inside porous materials. His correction affects the characteristic size of the porous media, by dividing the equivalent capillary tube diameter to tortuosity. In conclusion, tortuosity is one of the key parameters describing the geometry and the flow characteristics of porous media. Hence, using the same reasoning, a correction was introduced in Equation (8), by dividing the tube diameter d to the tortuosity T:
d p d r = 4 τ 0   ε 0   T   h d [ h h 0 ( 1 ε 0 ) ]
It is very difficult to evaluate tortuosity for random porous structures, since it depends on the pore size and arrangement, the type of fluid used and its viscosity, the flow velocity, etc. The difficulty is much greater if the porous media changes its sizes. However, it is evident that the compression of the porous material modifies the form of the tubes, and the tortuosity increases when layer thickness becomes smaller. There are many theoretical [23] and experimental [24] studies that found a linear variation of tortuosity with porosity ε. Using solid fraction assumption, from linear variation of tortuosity with porosity can be found that the product between tortuosity and material thickness remains constant during compression:
T   h = T 0   h 0
Viewed under microscope, the arrangement of pores inside the foam is similar to a honeycomb wall structure with hexagonal cells, but other filament-based structures can also be found. This proves that the material is non-homogeneous regarding pore size and distribution and it is difficult to estimate tortuosity. For the present work, the initial tortuosity was assumed T0 = 1.33. This value agrees with similar data obtained by experimental means [25] and numerical simulation for different porous media [26].
Introducing Equation (11) in Equation (10) and integrating with the atmospheric boundary condition (p = 0 at r = R), we obtain the pressure distribution inside the porous layer:
p = 4 τ 0   ε 0   T 0   h 0 d [ h h 0 ( 1 ε 0 ) ] ( R r )
Fluid pressure continuity at the inner radius of the annular disc, R0, allows one to calculate the pressure pb of the fluid at the interface between zone 1 and 2, using Equation (12):
p = 4 τ 0   ε 0   T 0   h 0 d [ h h 0   ( 1 ε 0 ) ] ( R R 0 )
Finally, the force generated in zone 2 is obtained by the integration of pressure on the annular ring, between R and R0:
F 2 = 2 π R 0 R p r d r = 4 π τ 0 ε 0 T 0 h 0 3 d [ h h 0 ( 1 ε 0 ) ] ( R R 0 ) 2 ( R + 2 R 0 )
or, in dimensionless form:
F ¯ 2 = F 2   h 0 τ 0   R 0 3 = 4 π 3 ε 0   k H ( 1 ε 0 ) ( R ¯ 1 ) 2 ( R ¯ + 2 )
where k = h0T0/d is a size factor dependent on material characteristics, and H = h/h0 is dimensionless layer thickness.
A similar dimensionless form can be obtained for the squeeze force component in zone 1 (Equation (1)):
F ¯ 1 = 4 π ε 0 k H ( 1 ε 0 ) ( R ¯ 1 ) + 2 π 3 H   +   4 π 7   H 2 2 S 0
Because the squeezed fluid remains in the porous layer (there is no flow outside the porous disc Figure 7), from fluid volume conservation (W = W1 + W2) one can obtain:
π   h 0   R 0 2 = π h R 0 2 + π ε h ( R 2 R 0 2 )
After simplification, using Equation (6), and dimensionless notations, one can correlate the radius of the front of the flow with the dimensionless layer thickness:
R ¯ 2 = ε 0 H 1 + ε 0
Finally, adding the two force components, using Equation (18) and rearranging, we obtain:
F ¯ = 4 π 3 k R ¯ 2 ( R ¯ 3 1 ) + 2 π 3 H   +   4 π 2 S 0 7   H 2
Or in terms of dimensionless film thickness:
F ¯ = 4 π 3 k ε 0 H 1 + ε 0 [ ( ε 0 H 1 + ε 0 ) 3 2 1 ] + 2 π 3 H   +   4 π 2 S 0 7   H 2
The parametric analysis of the lift force shows that for low values of S0 the force increases with the size factor k (Figure 9).

4. Model Validation

A comparison between predicted the force with Equation (20) and the force measured with the foam sheet F280 and F450 with initial thickness h0 = 12 mm, is presented in Figure 10.
The compression speed is low and the modified plasticity number ranges between S0 = 2 × 10⁻⁴–8 × 10⁻³. The domain of variation for the Bingham number is Bn = 172–1380. The comparison shows good correlation with experiments. A similar comparison is shown in Figure 11 where the results for the thin F133 specimen compressed at two different speeds are represented. Tests were made for different speeds, and one can see that the theoretical curves are almost superposed for the compression speeds of 2 and 8 mm/s, respectively. This can be explained by the fact that the proposed model is explorative and gives a simple solution to a very difficult problem i.e., Bingham flow through complex porous structure of foam. The flow model inside the porous material neglects the contribution of the fluid phase of the Bingham media. Because the Bingham flow is reduced to a plug flow, the analytical model is less sensitive to fluid velocity and this explains why the theoretical curves in Figure 11 are almost superposed.

5. Conclusions

A closed-form analytical solution was found for the planar squeeze process of a finite volume of viscoplastic material, placed inside a central reservoir, through a soft porous layer subjected to compression under constant speed. An original concept of equivalent flow tubes was used to characterize the Bingham flow inside the porous structure. The concept of tortuosity was also used to take into consideration the sinuous shape of the flow tubes.
The proposed model was validated by comparing the theoretically predicted values of load carrying capacity with the experimental data in the case of low squeeze speed. The comparison shows a good predictability of the force evolution in time.
These preliminary experiments proved the possibility to use yield stress fluids in damping cells, to replace Newtonian liquids. However, the possibility to use yield stress fluids in reusable dampers is questionable due to the difficulty of re-imbibition, which is not the case when Newtonian fluids are used.
An extended model appears necessary to consider the Bingham flow for higher squeeze speed. Also, more experiments for higher squeeze speeds (around 1 m/s and beyond) are needed to define model limits of applicability.

Author Contributions

Conceptualization, M.D.P.; methodology, M.D.P; software, P.T.; validation, P.T., M.D.P., and T.C.; investigation, P.T. and M.D.P.; resources, P.T., M.D.P., and T.C.; data curation, T.P.; writing—original draft preparation, P.T. and T.C.; writing—review and editing, P.T. and T.C.; visualization, P.T. and T.C.; supervision, M.D.P.; project administration, M.D.P. and T.C.; funding acquisition, T.C.

Funding

This work has been supported by Partnerships in Priority Areas Program-PN II implemented with the support of Romanian Ministry of Education-UEFISCDI, project number 287/2014 (http://www.omtr.pub.ro/cesit/granturi/PROTHEIS/index.html).

Conflicts of Interest

The authors declare no conflict of interest.

List of Notations

Latin Alphabet Notations
BnBingham number, B n = τ 0 d / η u m
daverage diameter of flow tube/pore
Ftotal force
F ¯ dimensionless force, F ¯ = F h 0 / τ 0 R 0 3
hporous layer thickness
Hdimensionless layer thickness, H = h / h 0
lclength of elementary flow path
ksize factor, k = T 0 h 0 / d
ppressure
pbpressure at the boundary of the reservoir
rradial coordinate
Rradius of the front of the flow
Reouter radius of the annular disc
R ¯ dimensionless relative radius of the front of the flow, R ¯ = R / R 0
Splasticity number, S = R V η / h 2 τ 0
Ttortuosity, T = [ L c / ( R R 0 ) ] 2
umfluid average velocity
Vsqueeze speed
Wvolume of fluid
Greek Alphabet Notations
αflow tube cross section area
βtube cross section perimeter
εporosity
ηdynamic viscosity
ρhydraulic radius
τ0threshold/yield stress
Subscripts
0initial (corresponding to undeformed layer)
1corresponding to zone 1
2corresponding to zone 2

Appendix A

If we consider that, at the beginning of the compression, the fluid from the reservoir is squeezed out through n identical, equally spaced tubes of diameter d, the mass conservation equation gives:
π R 0 2 V = n π d 2 4 u m
On the other hand, the number of the equivalent tubes yields from a simple geometric condition:
n π d 2 4 = 2 π R 0 h 0 ε 0
Finally, combining Equations (A1) and (A2) we obtain
u m | r = R 0 = R 0 2 h 0 ε 0 V

References

  1. Pascovici, M.D.; Cicone, T. Squeeze-film of unconformal, compliant and layered contacts. Tribol. Int. 2003, 36, 791–799. [Google Scholar] [CrossRef]
  2. Pascovici, M.D.; Russu, C.; Cicone, T. Squeeze film of conformal, layered, compliant and porous contacts. Acta Teh. Napoc. Ser. Appl. Math. Mech. 2004, 47, 425–430. [Google Scholar]
  3. Radu, M.; Cicone, T. Squeeze effects of an infinitely long, rigid cylinder on a highly compressible porous layer imbibed with liquid. UPB Sci. Bull. Ser. D 2014, 76, 91–102. [Google Scholar]
  4. Pascovici, M.D.; Popescu, C.S.; Marian, V. Impact of a rigid sphere on a highly compressible porous layer imbibed with a Newtonian liquid. Proc. Inst. Mech. Eng. Part J J. Eng. Tribol. 2010, 224, 789–795. [Google Scholar] [CrossRef]
  5. Radu, M.; Cicone, T. Experimental determination of the damping capacity of highly compressible porous materials imbibed with water. J. Balkan Tribol. Assoc. 2014, 22, 390–400. [Google Scholar]
  6. Pascovici, M.D.; Cicone, T.; Marian, V. Squeeze process under impact, in highly compressible porous layers imbibed with liquids. Tribol. Int. 2009, 42, 1433–1438. [Google Scholar] [CrossRef]
  7. Melciu, C.; Cicone, T.; Pascovici, M.D. Saturated porous layers squeezed between parallel disks in enclosed cells. IOP Conf. Ser. Mater. Sci. Eng. 2017, 174, 012031. [Google Scholar] [CrossRef] [Green Version]
  8. Cicone, T.; Pascovici, M.D.; Melciu, C.; Turtoi, P. Optimal porosity for impact squeeze of soft layers imbibed with liquids. Tribol. Int. 2019, 138, 140–149. [Google Scholar] [CrossRef]
  9. Wu, Q.; Andreopoulos, Y.; Xanthos, S.; Weinbaum, S. Dynamic compression of highly compressible porous media with application to snow compaction. J. Fluid Mech. 2005, 542, 281–304. [Google Scholar] [CrossRef]
  10. Crawford, R.; Nathan, R.; Wang, L.; Wu, Q. Experimental study on the lift generation inside a random synthetic porous layer under rapid compaction. Exp. Therm. Fluid Sci. 2012, 36, 205–216. [Google Scholar] [CrossRef]
  11. Nabhani, M.; Khlifi, M.; Bou-Said, B. A general model for porous medium flow in squeezing film situations. Lubr. Sci. 2010, 22, 27–52. [Google Scholar] [CrossRef]
  12. Gbehe, O.S.T.; Khlifi, M.; Nabhani, M.; Bou-Said, B. Investigation of couple stress effects on poroelastic squeeze film of parallel plates. Lubr. Sci. 2017, 29, 93–113. [Google Scholar] [CrossRef]
  13. Dowson, M.A.; McKinley, G.H.; Gibson, L.J. The Dynamic Compressive Response of Open-Cell Foam Impregnated with a Non-Newtonian Fluid. J. Appl. Mech. 2009, 76, 061011. [Google Scholar] [CrossRef]
  14. Dawson, M.A. Modeling the Dynamic Response of Low-Density, Reticulated, Elastomeric Foam Impregnated with Newtonian and Non-Newtonian Fluids. Ph.D. Thesis, Massachusetts Institute of Technology, Cambridge, MA, USA, 2008. [Google Scholar]
  15. Vossen, B.G. Modeling the Application of Fluid Filled Foam in Motorcycle Helmets; Scientific Report; Eindhoven University of Technology: Eindhoven, The Netherlands, 2010. [Google Scholar]
  16. Chevalier, T.; Chevalier, C.; Clain, X.; Dupla, J.C.; Canou, J.; Rodts, S.; Coussot, P. Darcy’s law for yield stress fluid flowing through a porous medium. J. Non-Newton. Fluid Mech. 2013, 195, 57–66. [Google Scholar] [CrossRef]
  17. Pearson, J.R.A.; Tardy, P.M.J. Models for flow of non-Newtonian and complex fluids through porous media. J. Non-Newton. Fluid Mech. 2002, 102, 447–473. [Google Scholar] [CrossRef]
  18. Covey, G.H.; Stanmore, B.R. Use of the parallel-plate plastomer for the characterization of viscous fluids with a yield stress. J. Non-Newton. Fluid Mech. 1981, 8, 249–260. [Google Scholar] [CrossRef]
  19. Mitsoulis, E. Flows of viscoplastic materials: Models and computations. Rheol. Rev. 2007, 64, 135–178. [Google Scholar]
  20. Scheidegger, A.E. The Physics of Flow through Porous Media, 3rd ed.; University of Toronto Press: Toronto, ON, Canada, 1974. [Google Scholar]
  21. Delesse, M.A. Procede Mecanique Pour Determiner la Composition des Roches; Librarie de la Societe Geologique de France: Paris, France, 1866. [Google Scholar]
  22. Guyon, E.; Huliu, J.P.; Petit, L. Hydrodinamique Physique; EDP Sciences/CNRS Editions: Paris, France, 2001. [Google Scholar]
  23. Sun, Z.; Tang, X.; Cheng, G. Numerical simulation for tortuosity of porous media. Microporous Mesoporous Mater. 2013, 173, 37–42. [Google Scholar] [CrossRef]
  24. Salem, H.; Chilingarian, G. Influence of porosity and directional of flow on Tortuosity in unconsolidated porous media. Energy Sources 2000, 22, 207–213. [Google Scholar]
  25. Montillet, A.; Comiti, J.; Legrand, J. Determination of structural parameters of metallic foams from permeametry measurements. J. Mater. Sci. 1992, 27, 4460–4464. [Google Scholar] [CrossRef]
  26. Ortega, J.M. A porous media model for blood flow within reticulated foam. Chem. Eng. Sci. 2013, 99, 59–66. [Google Scholar] [CrossRef] [Green Version]
Figure 1. (a) Porous ring, (b) magnified view of the porous matrix.
Lubricants 07 00086 g001
Figure 2. Testing arrangement.
Lubricants 07 00086 g002
Figure 3. Force versus film thickness F133 foam (dry and fluid-filled) with initial thickness h0 = 12 mm.
Lubricants 07 00086 g003
Figure 4. Measured forces vs. film thickness (dry and fluid-filled) with initial thickness h0 = 4 mm.
Lubricants 07 00086 g004
Figure 5. Comparison of fluid-filled foam force variation with layer thickness.
Lubricants 07 00086 g005
Figure 6. Fluid-filled foam force with layer thickness for different speeds.
Lubricants 07 00086 g006
Figure 7. Image showing the radial flow tubes.
Lubricants 07 00086 g007
Figure 8. The geometry of the model.
Lubricants 07 00086 g008
Figure 9. Variation of F ¯ versus dimensionless thickness H, S0 = 0.001, ε0 = 0.97.
Lubricants 07 00086 g009
Figure 10. Experiment vs. theory for F450 and F280 foam for squeeze speed V = 4 mm/s.
Lubricants 07 00086 g010
Figure 11. Experiment vs. theory for F133 foam.
Lubricants 07 00086 g011
Table 1. Properties of the used foams.
Disc No.Foam SymbolCommercial NamePore size [mm] (1)Initial Porosity, ε0Thickness h0 [mm]
1F133FILTREN® TM 251331.06–1.660.97612
2F280FILTREN® TM 252802.2–3.40.98212
3F450FILTREN® TM 254503.4–5.60.99712
4F133FILTREN® TM 251331.06–1.660.9764
(1) according to the product catalogue EUROFOAM ROMANIA.

