Article

The Influence of Surface Texturing on the Frictional Behaviour of Parallel Sliding Lubricated Surfaces under Conditions of Mixed Lubrication

1
Materials Innovation Institute (M2i), P.O. Box 5008, 2600 GA Delft, The Netherlands
2
Bosch Transmission Technology, Doctor Hub van Doorneweg 120, 5026 RA Tilburg, The Netherlands
3
Laboratory for Surface Technology and Tribology, Faculty of Engineering Technology, University of Twente, P.O. Box 217, 7500 AE Enschede, The Netherlands
*
Author to whom correspondence should be addressed.
Lubricants 2018, 6(4), 91; https://doi.org/10.3390/lubricants6040091
Submission received: 29 August 2018 / Revised: 9 October 2018 / Accepted: 9 October 2018 / Published: 11 October 2018
(This article belongs to the Special Issue Fluid-Film Lubrication)

Abstract

:
In many industrial applications, a modification of the surface geometry can enhance the tribological behaviour of lubricated sliding contacts. In this paper, the effect of surface texturing on the coefficient of friction in parallel sliding lubricated surfaces is investigated. It is shown that surface texturing can improve film formation and, as a result, the load-carrying capacity as well as a reduction in the coefficient of friction. With the numerical model developed, and by considering cavitation, the effects of shape, depth, size, and the textured area fraction on the frictional behaviour of parallel sliding lubricated contacts under conditions of mixed lubrication is studied. In this article it is shown that the surface texturing can have a beneficial effect, in order to decrease friction.

Graphical Abstract

1. Introduction

There is a growing demand for improving the tribological performance (frictional behaviour) of sliding lubricated contacts in many applications. The first method of reducing friction is to make the surfaces smoother; however, producing a super-smooth surface can be expensive, and it may cause failure [1]. In the case of lubricated contacts, a geometrical modification on the micro-scale of the surfaces can be a potential solution for this problem.
Surface texturing has been widely applied as a well-known method of reducing friction and wear between sliding surfaces separated by a thin lubricant film. Nowadays, due to improvement of texturing techniques it is possible to employ different geometrical patterns of texturing. These surface modification techniques include machining, photoetching, etching techniques, ion beam texturing, and laser texturing [2]. Laser texturing prevails over the other methods as it is efficient, convenient, and controllable for many materials [3]. However, the process parameters should be determined carefully to avoid a bulge at the rims of the textures [4,5].
In recent decades, much effort has been put into understanding the effect of surface texturing, in order to improve the tribological performance of lubricated contacts. The cavities can result in an improvement in tribological performance, due to local convergent and divergent gaps, which can generate pressure, even in lubricated parallel sliding flat-on-flat contacts. In the cavities, cavitation may occur. Therefore, three main effects are expected to occur to enhance the tribological performance of lubricated sliding textured surfaces. The first effect is the improvement in hydrodynamic pressure in the contacts, due to the converging wedges constituted by the cavities or pockets. The second is the containment of wear debris inside the cavities, which can be of benefit by removing the wear particles between the two surfaces, to avoid for instance, abrasive wear. The third effect is more sensible in high plastic deformation conditions, then the presence of pockets of lubricants due to texturing could have a beneficial influence on the tribological behaviour of the contact [6]. A lot of studies relating to surface texturing with respect to friction have focused on the experimental aspect, and recently, theoretical research has received more attention [7,8,9,10]. However, it is necessary to identify the effect of each of the parameters that define the texturing pattern. Therefore, the most important parameters influencing the frictional behaviour of lubricated contacts need to be identified. By presenting the results as a Stribeck curve, the lubricated contact performance as a function of the operational conditions such as velocity, and texturing parameters such as texture depth, size, and density, can be analysed.
When two solid surfaces of contacts are so close together then asperities collide (see Figure 1). Under these conditions, the friction is determined predominantly by the interaction between the solids at the asperity level where the boundary layers are being sheared. In this condition, the lubricant properties have an insignificant or even no influence on friction force. In lubricated contacts, the boundary lubrication mostly occurs when the contact is under high-load and low-velocity conditions.
Most machine components, such as gears and bearings, are likely to operate in the mixed lubrication regime where asperity contacts exist, and the fluid contributes significantly to carrying the load. Modelling friction under mixed lubrication conditions is a challenging task; much effort has been devoted to this in the past few decades [8,11,12,13]. There are two types of mixed lubrication models, based on statistical and deterministic contact models. The statistical model uses selected statistical parameters to represent random characteristics of surface roughness. A major shortcoming of these models is their inability to provide detailed information about local affairs, which have an influence on the mechanisms of lubrication and friction. The deterministic model, which uses deterministic information of surface roughness, is another common approach to simulating the behaviour of contacting asperities under mixed lubrication.
This study investigates numerically the effect of surface texturing on the Stribeck curve, i.e., friction in lubricated contacts; in particular, the lubrication regimes of hydrodynamic lubrication and mixed lubrication.

2. Materials and Methods

During their study on face seals, Hamilton et al. [14] pointed out that the pressure increases in the converging film regions, whilst facing a reduction in pressure in the diverging film regions likewise in a cavity generated, for instance, by laser surface texturing. When the lubricant enters the cavity zone, by approaching into the end of the divergence zone, the pressure will drop, but by considering the effect of cavitation and the fact that the lubricant pressure cannot reach values lower than the cavitation pressure, the lubricant pressure will reach the lowest value (cavitation pressure). After passing the divergence zone and by reaching the convergence zone, the pressure in the lubricant will start to increase. The pressure generation in the convergence zone can increase to high values, leading to an increase in the load-carrying capacity. Various studies on the tribological behaviour of textured surfaces include numerical [8,15] and experimental investigations on textured surfaces [16,17]. Several studies have shown that when using a textured surface, the transition between boundary and hydrodynamic lubrication occurs at a lower velocity than when using a smooth surface [16,18,19].
Etsion and Burstein [7], in their work on the surface texturing of mechanical seals, by developing model showed an improvement in seal performance when surface texturing is employed. In their work, one of the seal surfaces was textured with evenly distributed hemispherical micro-dimples.
Wang et al. [20,21] and Kovalchenko et al. [18] have shown the effect of dimples on the friction coefficient and load carrying capacity. In their studies, several texture patterns were considered, such as spiral grooves, micro-dimple, and square dents. It was reported that the shape, size, texture density, and orientation of the texture patterns played an important role on the film thickness and frictional behaviour of the lubricated contacts. Costa et al. [22] performed an experimental investigation to find the role of surface texturing in generating hydrodynamic pressure in lubricated sliding contacts. They showed that the texturing geometrical parameters such as pattern, shape, density, and the size of the pockets have an influence on the tribological behaviour of contacts, and this can reduce the friction.
In work by Wang et al. [23], and in Hu and Zhu’s mixed lubrication friction model [11,12], the effect of texture distribution patterns on the lubrication performance was investigated in relation to texture direction, the orientation angle of the features, the feature continuity, and the aspect ratio. They showed that narrow short grooves perpendicular to the motion direction, a small orientation angle, and a small ratio of width/length were effective in producing a thick oil film [24]. The optimum value for the different texture geometrical parameters has, in several studies, been investigated analytically [25,26], experimentally [8,16,17,20,27,28,29], and numerically [8,15,30,31]. These studies showed that, for any particular dimple shape, the texture density plays an important role in determining the effectiveness of the texture to increase the load-carrying capacity, and to reduce friction, since the optimum for different shapes might not be at a constant dimple depth. In addition, many researchers investigated the performances of herringbone-grooved journal bearings.
The mixed lubrication (ML) regime is the transition regime between the hydrodynamic lubrication (HL) and the boundary lubrication (BL), and therefore it can be seen as a combination of these two, having the properties of both regimes, and the value of the coefficient of friction in the ML regime varies between the values of the coefficient of friction of the BL and HL regimes. Most of the researchers who studied the mixed lubrication regime, employed experimental methods in their investigations (i.e., Stribeck [32], Hersey [33], Lenning [34], and Schipper [35]) compared to theoretical methods (Patir and Cheng [36,37], Johnson, Greenwood and Poon [38], and Gelinck and Schipper [39] etc.) are available in the literature. Patir and Cheng investigated the effect of roughness on the hydrodynamic load by introducing the average Reynolds equation with pressure and shear flow factors; however, their analysis is actually valid for separations that are larger than three times the combined root mean square surface roughness (Rq). In 1972, Johnson, Greenwood, and Poon combined the Greenwood and Williamson [40] theory with the elasto-hydrodynamic lubrication theory in order to develop a mixed lubrication model in which the load over the lubricated contact is shared between the lubricant film and the asperity contact. Gelinck and Schipper [39] extended this model for line contacts in order to determine the Stribeck curve. Shi and Salant [41] introduced a mixed lubrication model, which considers inter-asperity cavitation and surface shear deformation for soft materials, and showed the occurrence of local cavitation. For such moderately loaded lubricated systems, the Jakobsson–Floberg–Olsson [42,43] cavitation theory is typically used. It is worth to mention that when the surface tension effect is significant, the Jakobsson–Floberg–Olsson theory is less reliable [44]. In work of Faraon et al. [45] a numerical model is developed. This model developed here is based on the deterministic mixed lubrication model, in which the local cavitation in the contact zone is considered. This is realised by combining the film thickness calculation results from a previous study [46] with a deterministic asperity contact model to calculate the friction. This model will provide a better understanding with respect to the influence of surface texture features on friction in the mixed lubrication regime.

3. Mathematical Solution and Modelling

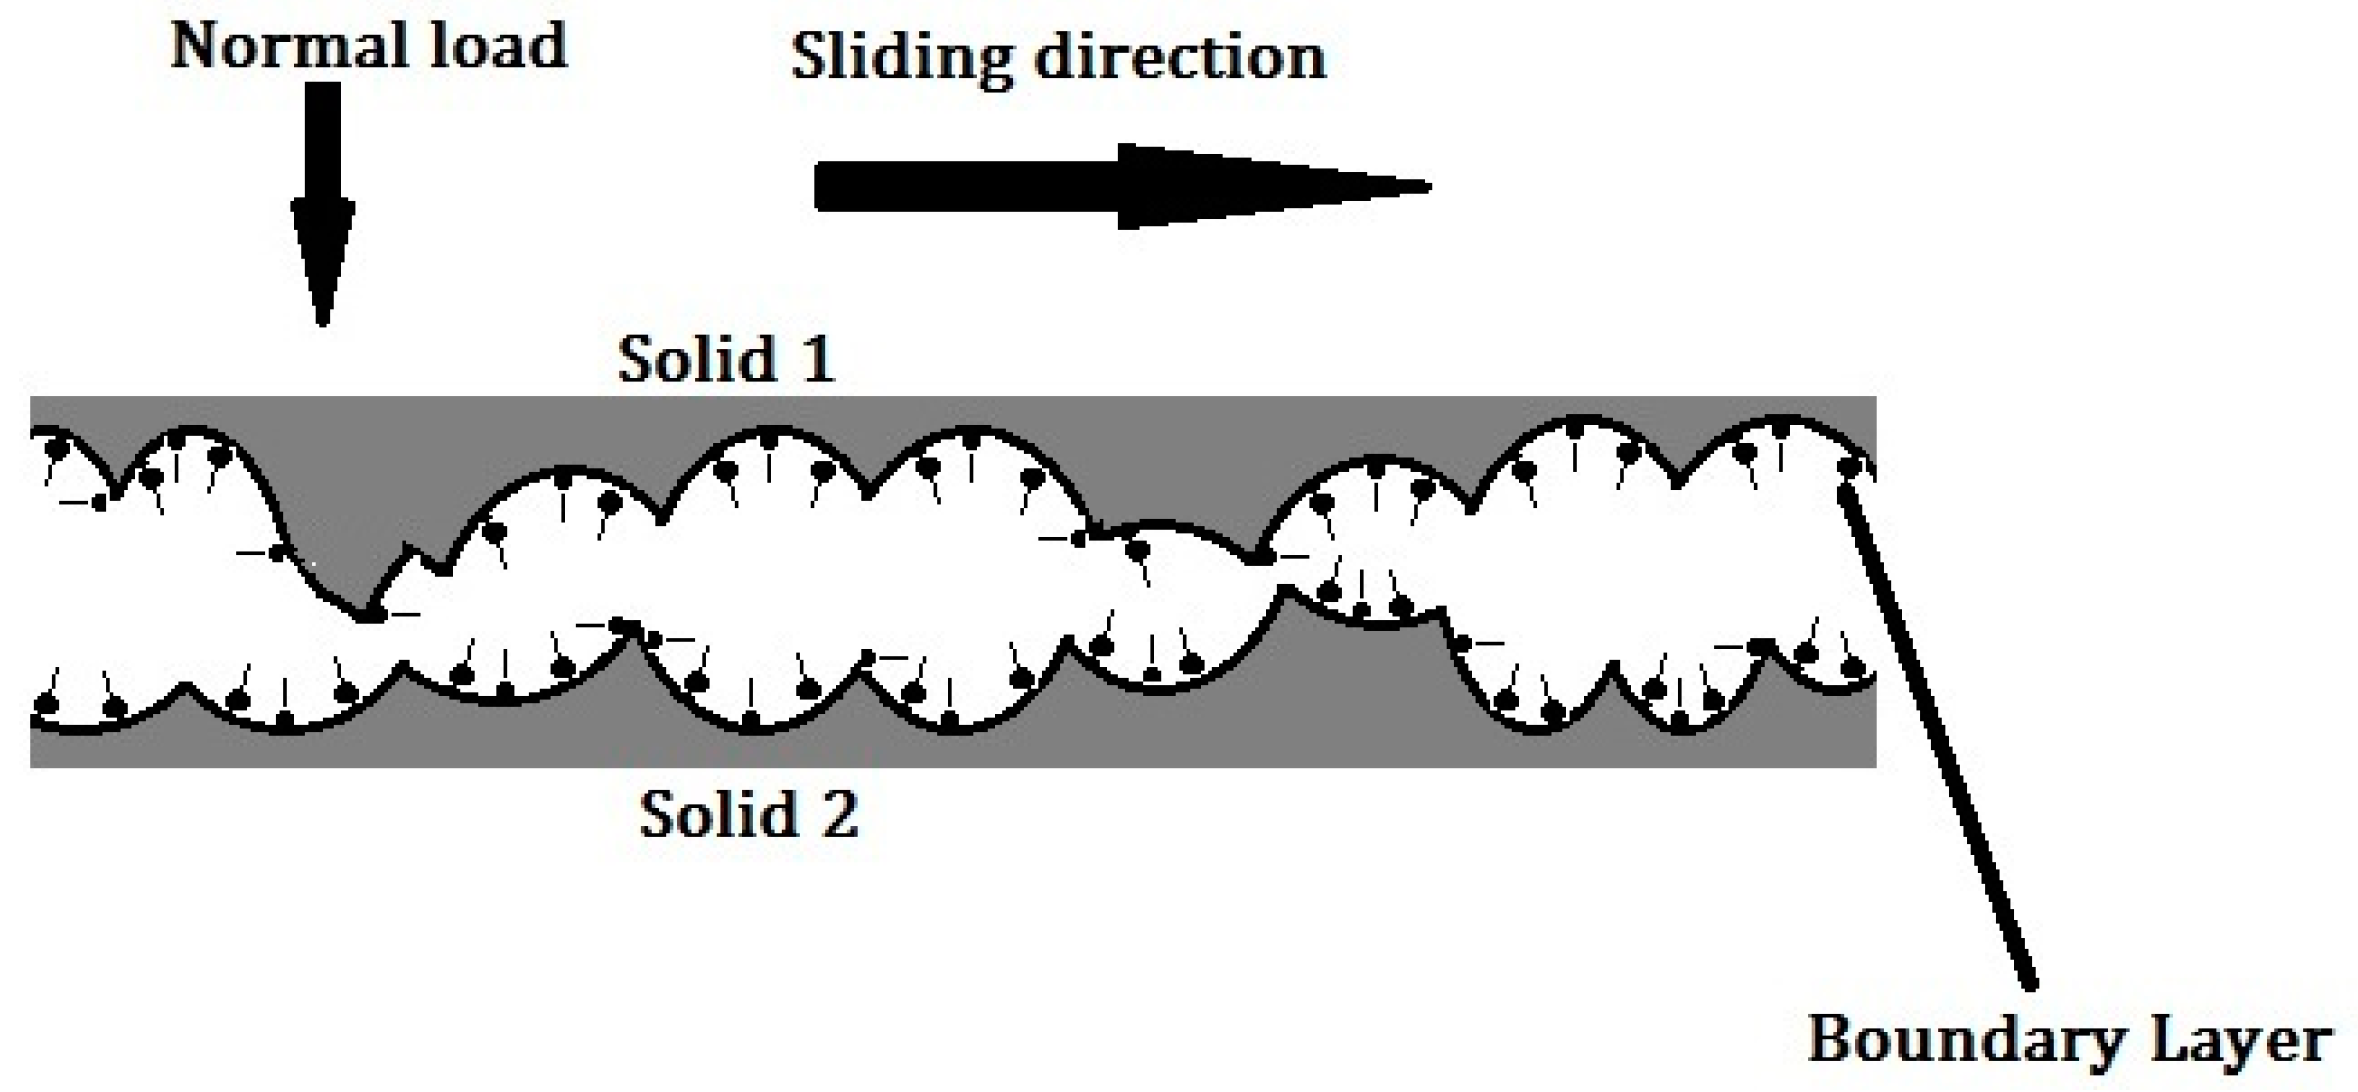
Deterministic Asperity Model:

Greenwood and Williamson, in their contact model [40], assumed that the asperities are spheres with equal radius, and they employed a Gaussian distribution of the summit heights. However, in reality, the asperity radius is not constant for all asperities in contact. Also, most of the surfaces have a height distribution, which is not Gaussian. Although this model is quite reliable when the aforementioned conditions are applied, the assumption of a Gaussian distribution of equal summits is a drawback in this model. Here, in order to avoid Greenwood and Williamson’s assumptions, a deterministic contact model was developed based on measured roughness data (see Figure 2).
Figure 2, shows a schematic illustration of the contact between a rough surface and a flat surface. By adding together the local contributions, the quantities of real contact area, the number of asperities, and the total force carried by the contact are possible to calculate deterministically, when the separation between the two surfaces ( d ) , is known. In this contact model, it is assumed that the asperities are deforming independently of each other, and that they have elliptical shapes. Furthermore, the radii of these ellipsoids are not similar for all asperities (the asperity radii are measured in sliding and in perpendicular direction β x i , β y i ).
  w i = z i d  
In this equation, z i is the individual summit height and d is the separation parameters.
By determining the value of each deformed asperity ( w i ) and the total real contact area, and by adding the individual components of each asperity, it is possible to calculate the normal load over the asperities ( F C ). According to Johnson et al. [38], the total normal load on the contact in the ML regime is carried by the BL ( F C ) and the HL ( F H ) force component, Therefore:
  F T = F C + F H  
Based on Equation (2), coefficients γ 1 and γ 2 are introduced [38]:
  γ 1 = F T F H ,   γ 2 = F T F C  
The two coefficients, γ 1 and γ 2 , refer to the HL component and the BL component, respectively. The two coefficients ( γ 1 and γ 2 ) are mutually dependent through the equation:
  1 = 1 γ 1 + 1 γ 2  
In the deterministic asperity contact model, by using the two coefficients γ 1 and γ 2 for the contact between a rigid flat surface against a rough one and the HL theory, the entire Stribeck curve can be calculated.
In mixed lubricated contacts, in order to measure the frictional behaviour and to calculate the coefficient of friction of contact, three parameters must be calculated: the load carried by the asperities, the load carried by the fluid, and the lubricant film thickness. Three equations are used to calculate the values of the three aforementioned parameters.
  • The first equation is Equation (2) ( F T = F C + F H ).
  • The Reynolds equation.
The Reynolds equation is deduced from the Navier–Stokes equations under the assumption that the gap between the surfaces and the Reynolds number is small. The general Reynolds equation in Cartesian coordinates can be written as Equation (5):
  x ( ρ h 3 η p x ) + y ( ρ h 3 η p y ) = 6 ( u 0 ) ( ρ h ) x + 6 ρ h ( u 0 ) x + 12 ( ρ h ) t  
By approaching to the outlet wall of the cavity, the lubricant enters into a converging zone, which it results in an increase in the lubricant pressure. At the entry of the cavity, the lubricant flow diverges, which results, according to the Reynolds Equation (5), in a negative pressure. The negative pressure is suppressed by cavitation; i.e., vapour bubbles are formed in the lubricant. Based on Jakobsson–Floberg–Olsson, the lubrication film is divided into two zones. The first part is with a complete lubricant film; in this region, the Reynolds equation applies. In the second part, cavitation takes place, and a fraction of the lubricant film gap is occupied. Because the vapour bubbles are formed within the void fraction, the pressure throughout the cavitation area is taken as being constant [44].
The Reynolds equation, in a Cartesian coordinate system, can be written as Equation (6) [47]. In this steady-state equation, the mass-conservation and cavitation conditions are also considered.
  x ( h 3 η ( F φ ) x ) + y ( h 3 η ( F φ ) y ) = 6 u 0 p a p c ( ( 1 + ( 1 F ) φ ) h ) x  
In this equation, h is the film thickness, η is the viscosity, u 0 is the sum velocity, p a is the ambient pressure, p c is the cavitation pressure, F is a dimensionless dependent variable, and φ is the cavitation index; for more information, the reader is referred to Xiong and Wang [47].
Three different texture patterns have been investigated in this study: the chevron, the groove, and the triangular pocket. Figure 3 shows the different cavity shapes and the parameters characterizing their geometry. The chevron pocket geometry can be characterised by using two equilateral triangles of different sizes. The midpoint of the altitude line of the triangle in a chevron or triangle pattern is the center of the unit cell; see also [48]. All patterns have a rectangular cross-sectional profile. The general film thickness formula can be written as Equation (7):
  h = h 0 + h m a c r o + h t e x t u r e  
In the case of a flat–flat contact, the macro geometry is omitted and the film thickness Equation (7) reduces to Equation (8) [48,49]:
  h ( x , y ) h 0 ( x , y ) = 1 + H ( x , y )  
In this simulation, r p is the characteristic radius for the triangular and chevron patterns, and the half-width of the grooves.
In order to solve Equation (6) iteratively, the Tri-Diagonal Matrix Algorithm (TDMA) is used, and to reduce the storage needed for calculation, the line-by-line TDMA solver (Patankar [50]) is applied. For a two-dimensional problem, the TDMA solution column-by-column or row-by-row becomes iterative, and sweeping is done line-by-line, and column-by-column or row-by-row. For three-dimensional problems, the TDMA is applied line-by-line on a selected plane, and then the calculation is moved to the next plane, scanning the domain plane-by-plane [51].
III.
The third equation is the force carried by asperities:
  F c = i = 1 N 2 3 E R i 1 2 ( z i d ) 3 2  
in which E is the combined elasticity modulus, and R i is the reduced radius of the cylinder. The reduced elastic modulus is given by:
  2 E = 1 v 1 2 E 1 + 1 v 2 2 E 2  
where E 1 = E 2 = E and ν 1 = ν 2 = ν .
Finally, the total friction force ( F f ) in the ML regime is the sum of the friction force of the contacting asperities and the shear force of the lubricant ( F f h ):
  F f = i = 1 N A c i τ c i d A c i + F f H  
where the first term is the friction force due to contacting asperity; N is the number of contacting asperities; A c i is the area of contact of a single asperity; τ c i is the shear stress at the asperity contact.
For the HL component, the friction force can be calculated as:
  F f H = τ H A H  
where A H is the contact area of the hydrodynamic component and τ H is the shear stress of the lubricant. For the contacting asperities, the friction is assumed to be of the Coulomb type, i.e.:
  f C i = τ C i p C i  
with p c i being the average contact pressure on the current asperity. The coefficient of friction f C i is assumed constant for all asperities; therefore, the first term of Equation (13), can be written as:
  i = 1 N A c i f C p c i d A c i = f C F C  
where the value of f C is experimentally determined and set in this work at 0.1. Now, the coefficient of friction can be written as:
  f = F f F T = f C F C + F f H F T  
By solving these equations, the three papermakers needed to determine the coefficient of friction in ML regime can be calculated as explained in Appendix A, (see Figure A1).

4. Problem Definition and its Solution

In these calculations, the number of pockets and the distance between the pockets are combined by introducing a new parameter, pitch. The pitch ( P i ) for the chevron and groove pockets is calculated using the cavity size:
  S = 2 × r p  
The pitch in x direction, P i = S L g x
In this study, the influence of different texturing parameters on the frictional behaviour of contacts is investigated. From the previous study on the film thickness [46], it is possible to limit the investigation on texturing parameters and patterns. The effect of the cavity cross-sectional shape is studied [46], and the rectangular cross section has been found as the more efficient pattern; therefore, in the present study, the calculations will be limited to cavities with a rectangular cross section (see Figure 4d). In order to find the most efficient pattern, the coefficient of friction calculation will be based on linear groove, chevron, and triangular pockets. The effect of different texturing parameters, such as cavity depth and cavity size as well as pitch, will be investigated. The texturing properties, which are applied in this calculation, are presented in (Table 1). In Table 1, as it is mentioned before r p is characteristic radius of the pocket in the case of chevrons and triangular pockets and the half-width of the groove, in case of rectangular grooves. More information about the roughness and boundary lubrication parameters are presented in Appendix B.

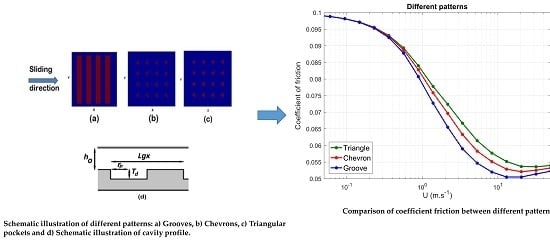
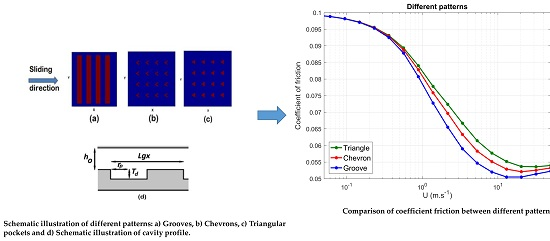
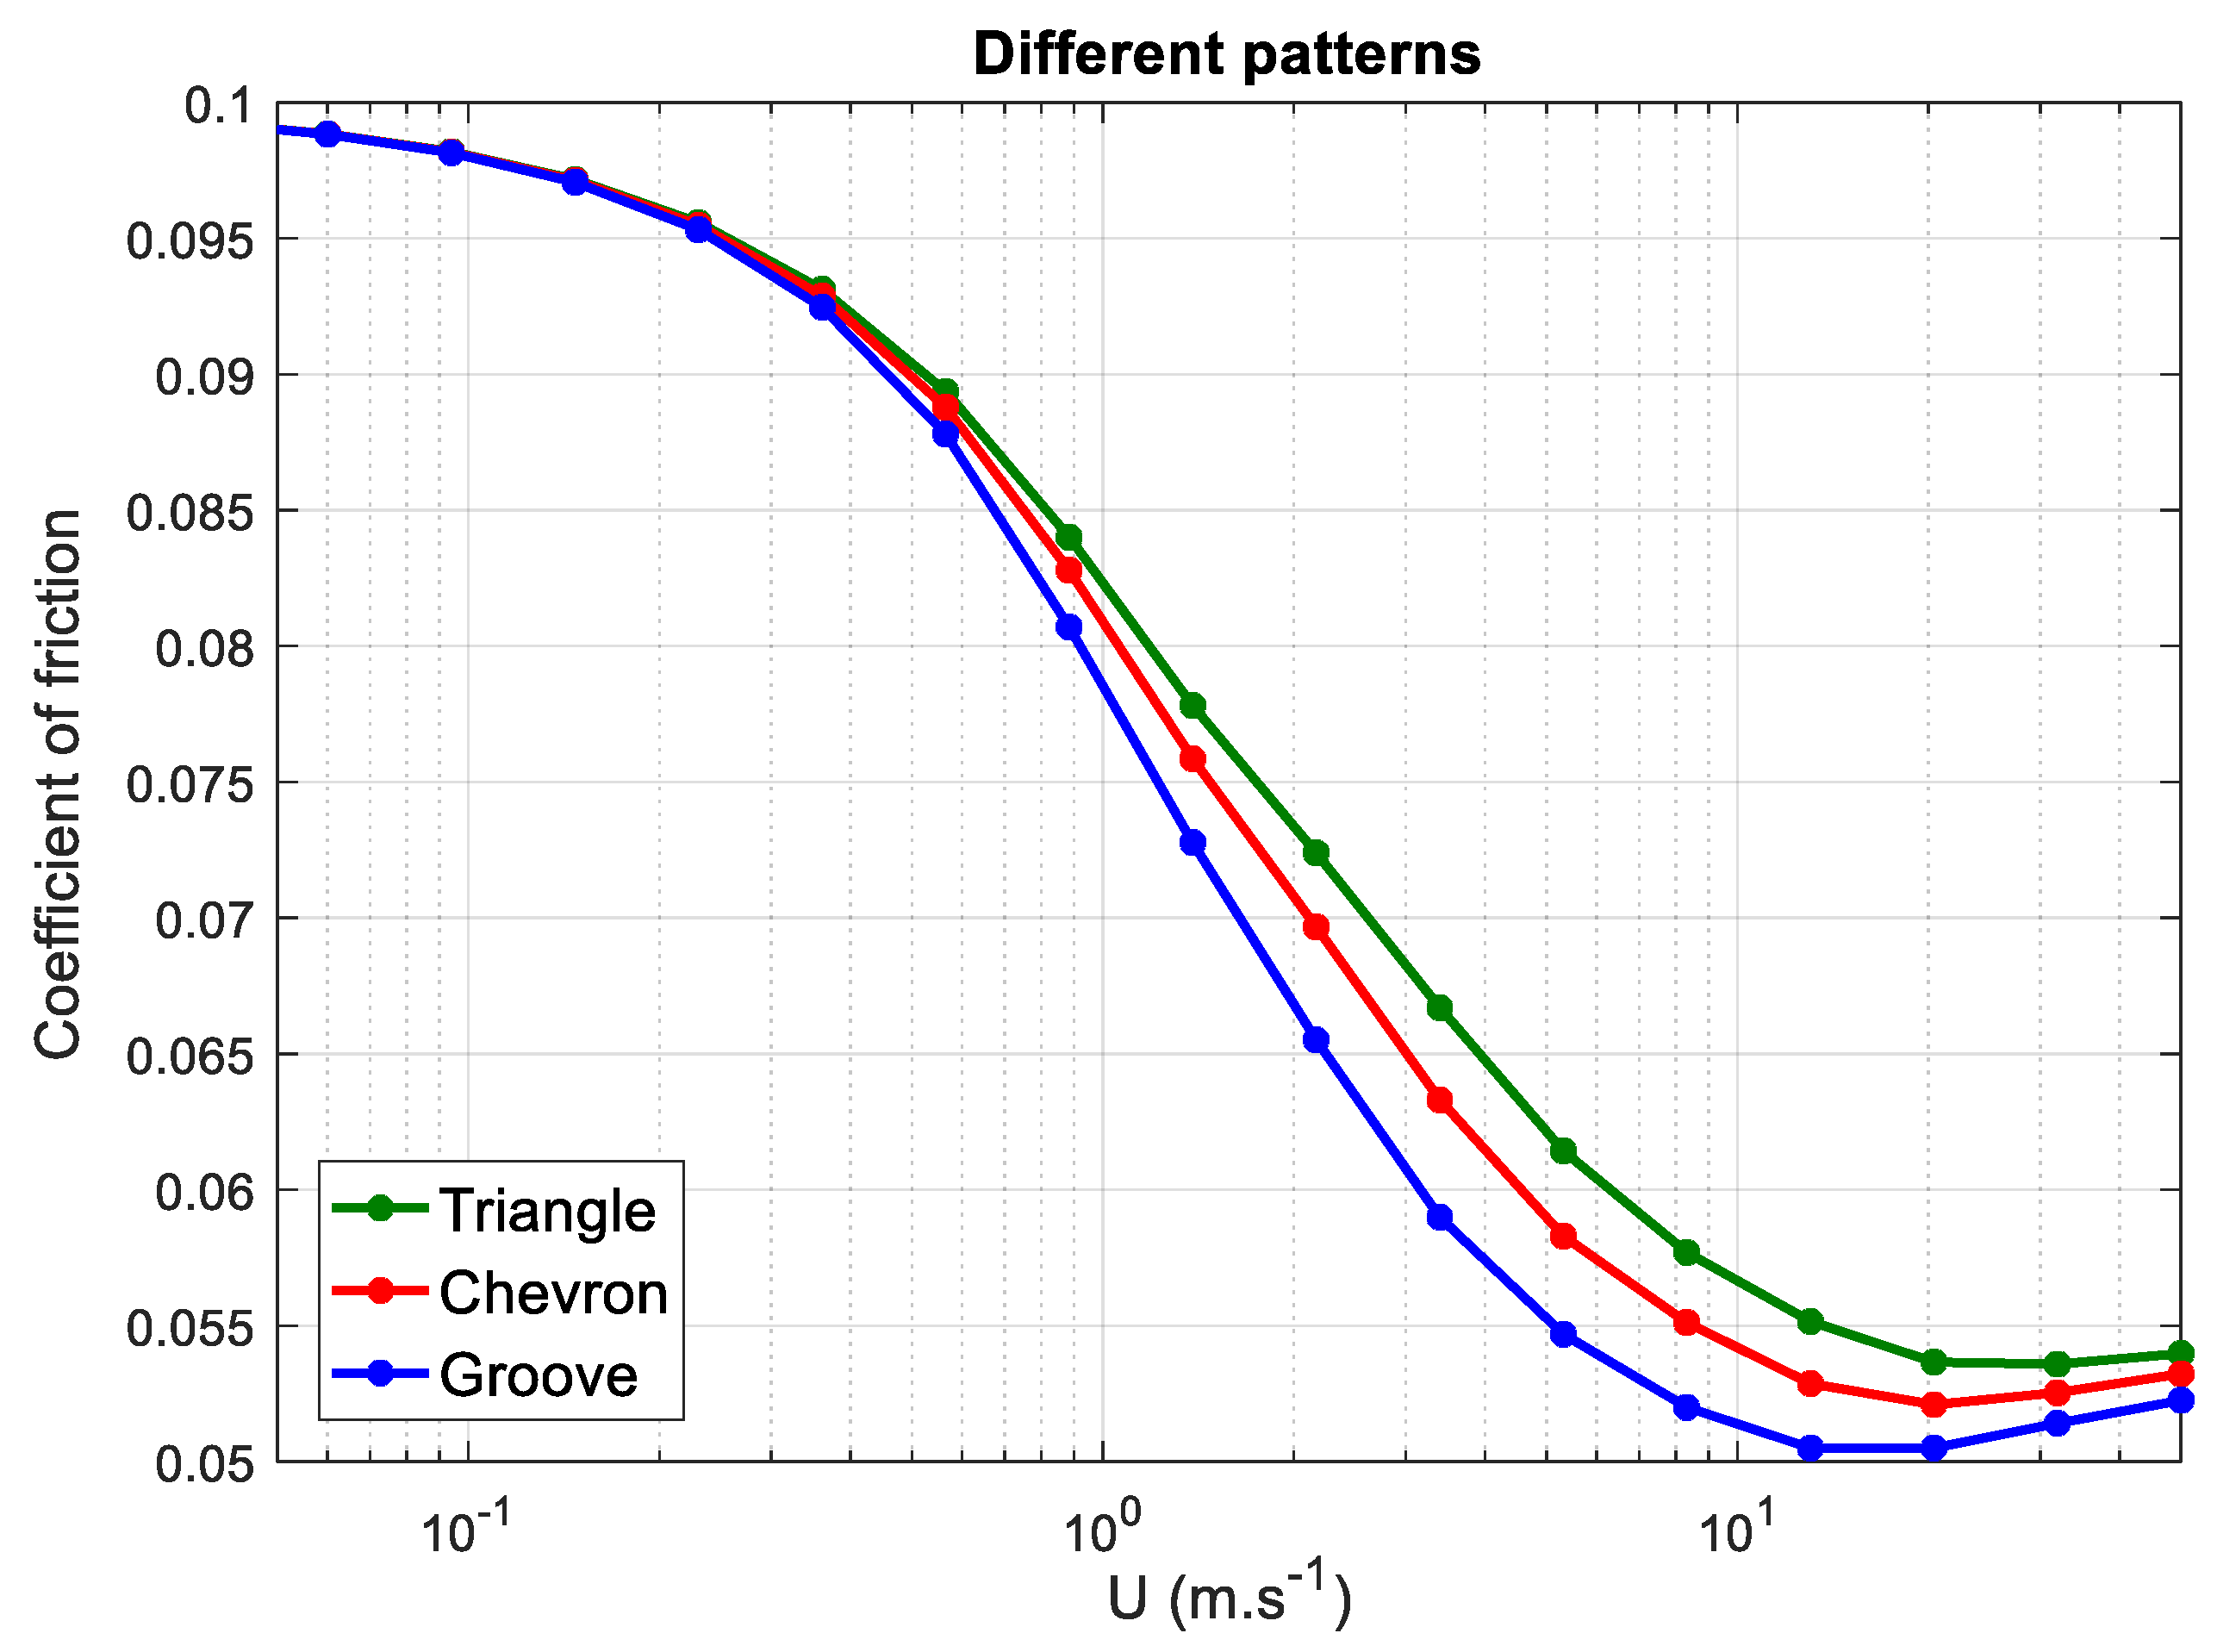
4.1. Comparison of Patterns

In order to determine the effect of texturing on lubricated contacts with respect to friction, several simulations were carried out using different texturing parameters. The coefficient of friction for grooves as well as chevron and triangular pockets parallel to the moving direction was calculated. From a previous study [46], simulations indicated that a higher lubricant pressure generation is achievable by closed grooves, because the side leakage for open grooves is higher than for closed grooves; see Figure 4a. Therefore, in this study, closed grooves were chosen to determine their effect on the coefficient of friction.
In Figure 5, in the boundary lubrication region when the surfaces start to slide against each other, ( U < 0.1   m · s 1 ), due to the lack of lubricant film in contact, the normal load carries by solid asperities. In this region the coefficient of friction is high and under the influence of the roughness of surfaces, and different texturing patterns have almost the same value.
In parallel sliding contacts, by increasing the velocity, the wedge effect caused by the existence of textures over the surface leads to an increase of the lubricant pressure. Moreover, the pressure generation in fluid film results in a lower amount of asperities in contact, and a drop in the coefficient of friction. In this region, the load over the contact carries partially by lubricant as well as solid asperities; therefore, the performance of the lubricant film in contact has an influential effect on the coefficient of friction. In a mixed lubrication regime, patterns that are more successful in film formation can cause a higher reduction of friction. The highest drop in the coefficient of friction in this region belongs to the surfaces with a groove pattern and after that, the chevrons are successful in the case of friction reduction.
In higher velocity range ( U > 10   m · s 1 ) the lubrication regime changes from a mixed to a hydrodynamic lubrication regime. In the hydrodynamic lubrication regime, by increasing the sliding velocity, the shear stress also increases, and a higher shear stress results in a higher coefficient of friction. For those patterns, that are more efficient in film formation, the transition point between the mixed and hydrodynamic lubrication regime occurs at a lower velocity; therefore, the friction begins to increase in the lower velocities also. Figure 5, shows that in a hydrodynamic lubrication regime ( U > 10   m · s 1 ), the coefficient of friction increases more dramatically in the case of a groove pattern, and the least sensitive pattern to the velocity increment is a triangular pattern.
When the distances between the texture cells are the same (the pitch is constant), the groove pattern is more effective in generating a local load-carrying capacity because of the higher textured area fraction per unit area. Chevrons are more beneficial than the triangular pockets because of the existence of a longer outlet wall in the cavity zone (Figure 5).

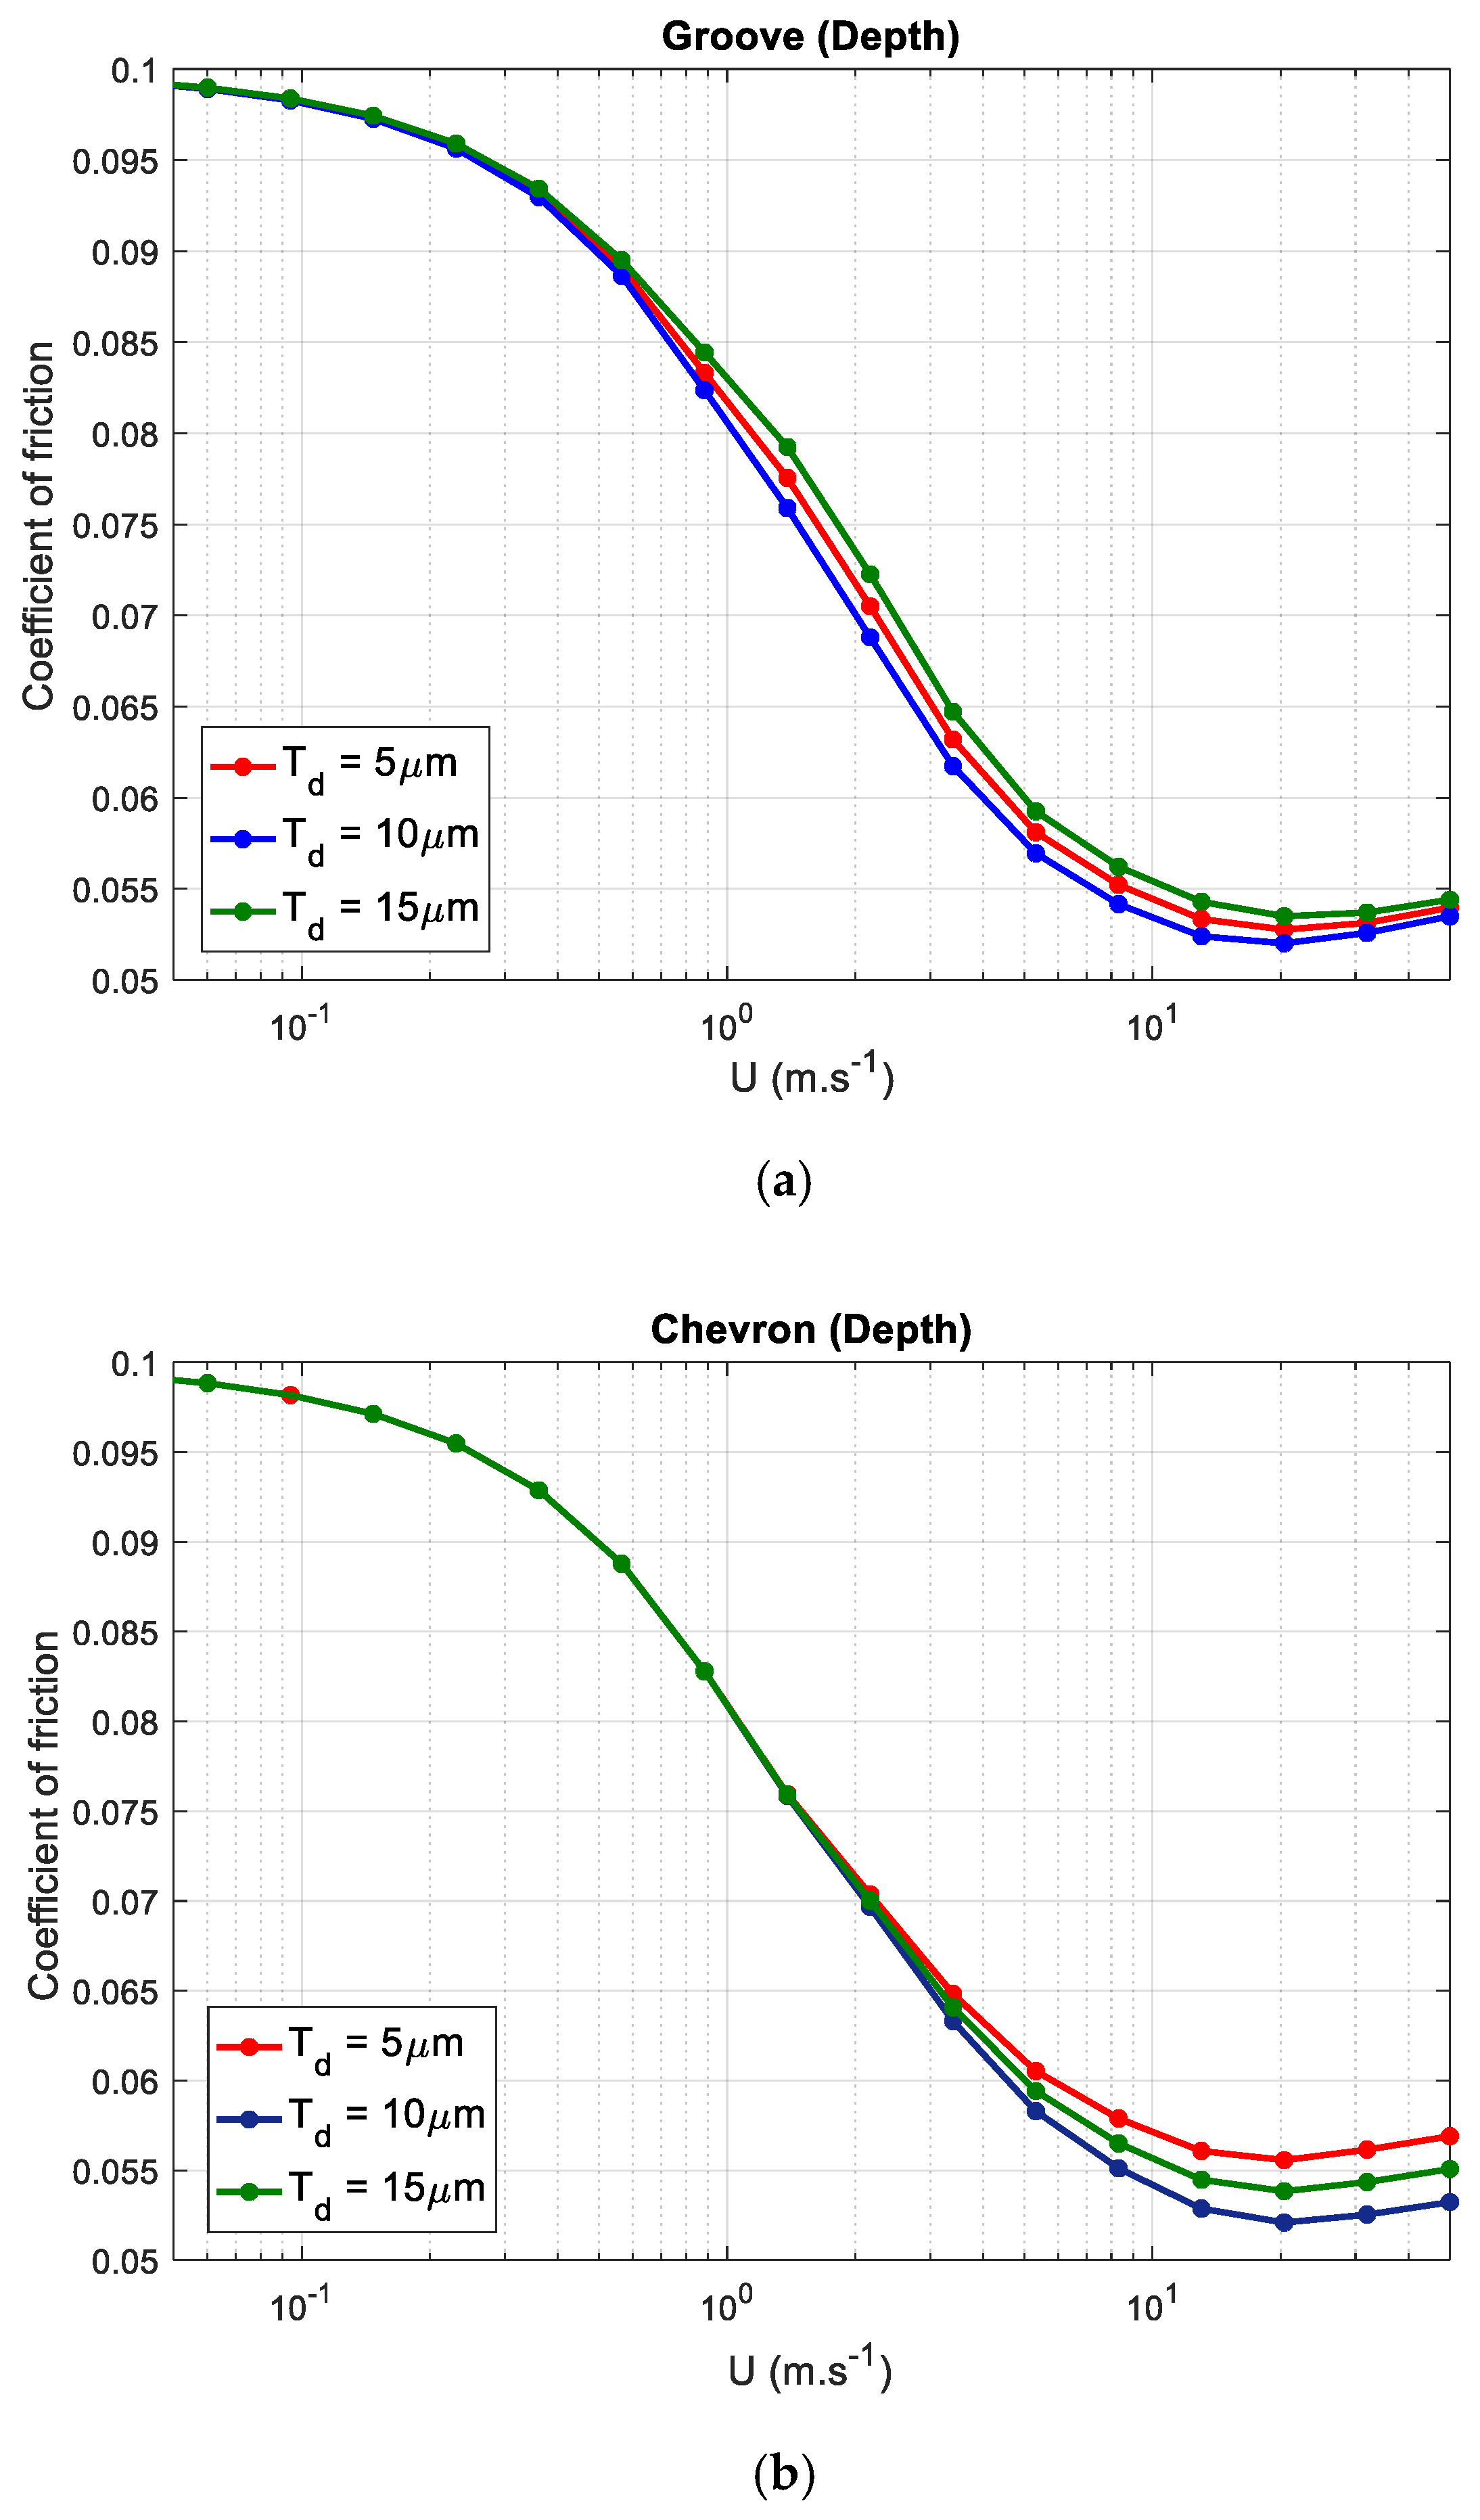
4.2. Property Effects

In this section an optimization of the geometrical parameters is performed. In this optimization, the effect of texture pitch, cavity size, and texture depth on the coefficient of friction for cavities with a rectangular profile (Figure 4) is studied. Grooves can be characterised by three geometry parameters, and in the case of chevrons, a fourth parameter is needed to define this pattern; see Figure 6.
Cavity size: S = 2 r p
Texture depth: T d
Texture pitch: P i = S L g x
Cavity width ratio: K
In the calculations, K is kept constant and it is equal to 0.5.
The effect of texture depth ( T d )
In Figure 7, simulation results are shown for the coefficient of friction as a function of the texture depth for the groove and chevron pattern. When the depth is tending to zero, there is no film formation because of the absence of the wedge effect in the flat–flat contact and the disappearance of texturing.
For both chevron and groove patterns, the fluctuation of texture depth affects the hydrodynamic lubrication component of mixed lubrication. A texture depth that is close to 10   μ m leads to a reduction in the coefficient of friction due to a film thickness increase. After the texture depth passes the optimum value for the texture depth, i.e., 10   μ m , deeper cavities result in an increase in the coefficient of friction. This phenomenon is caused by the reduction in lubricant film thickness [46]. From Figure 7, it is concluded that when the textured contact is operating near the transition between the ML and HL regimes, the texture depth has an influence on the frictional behaviour.

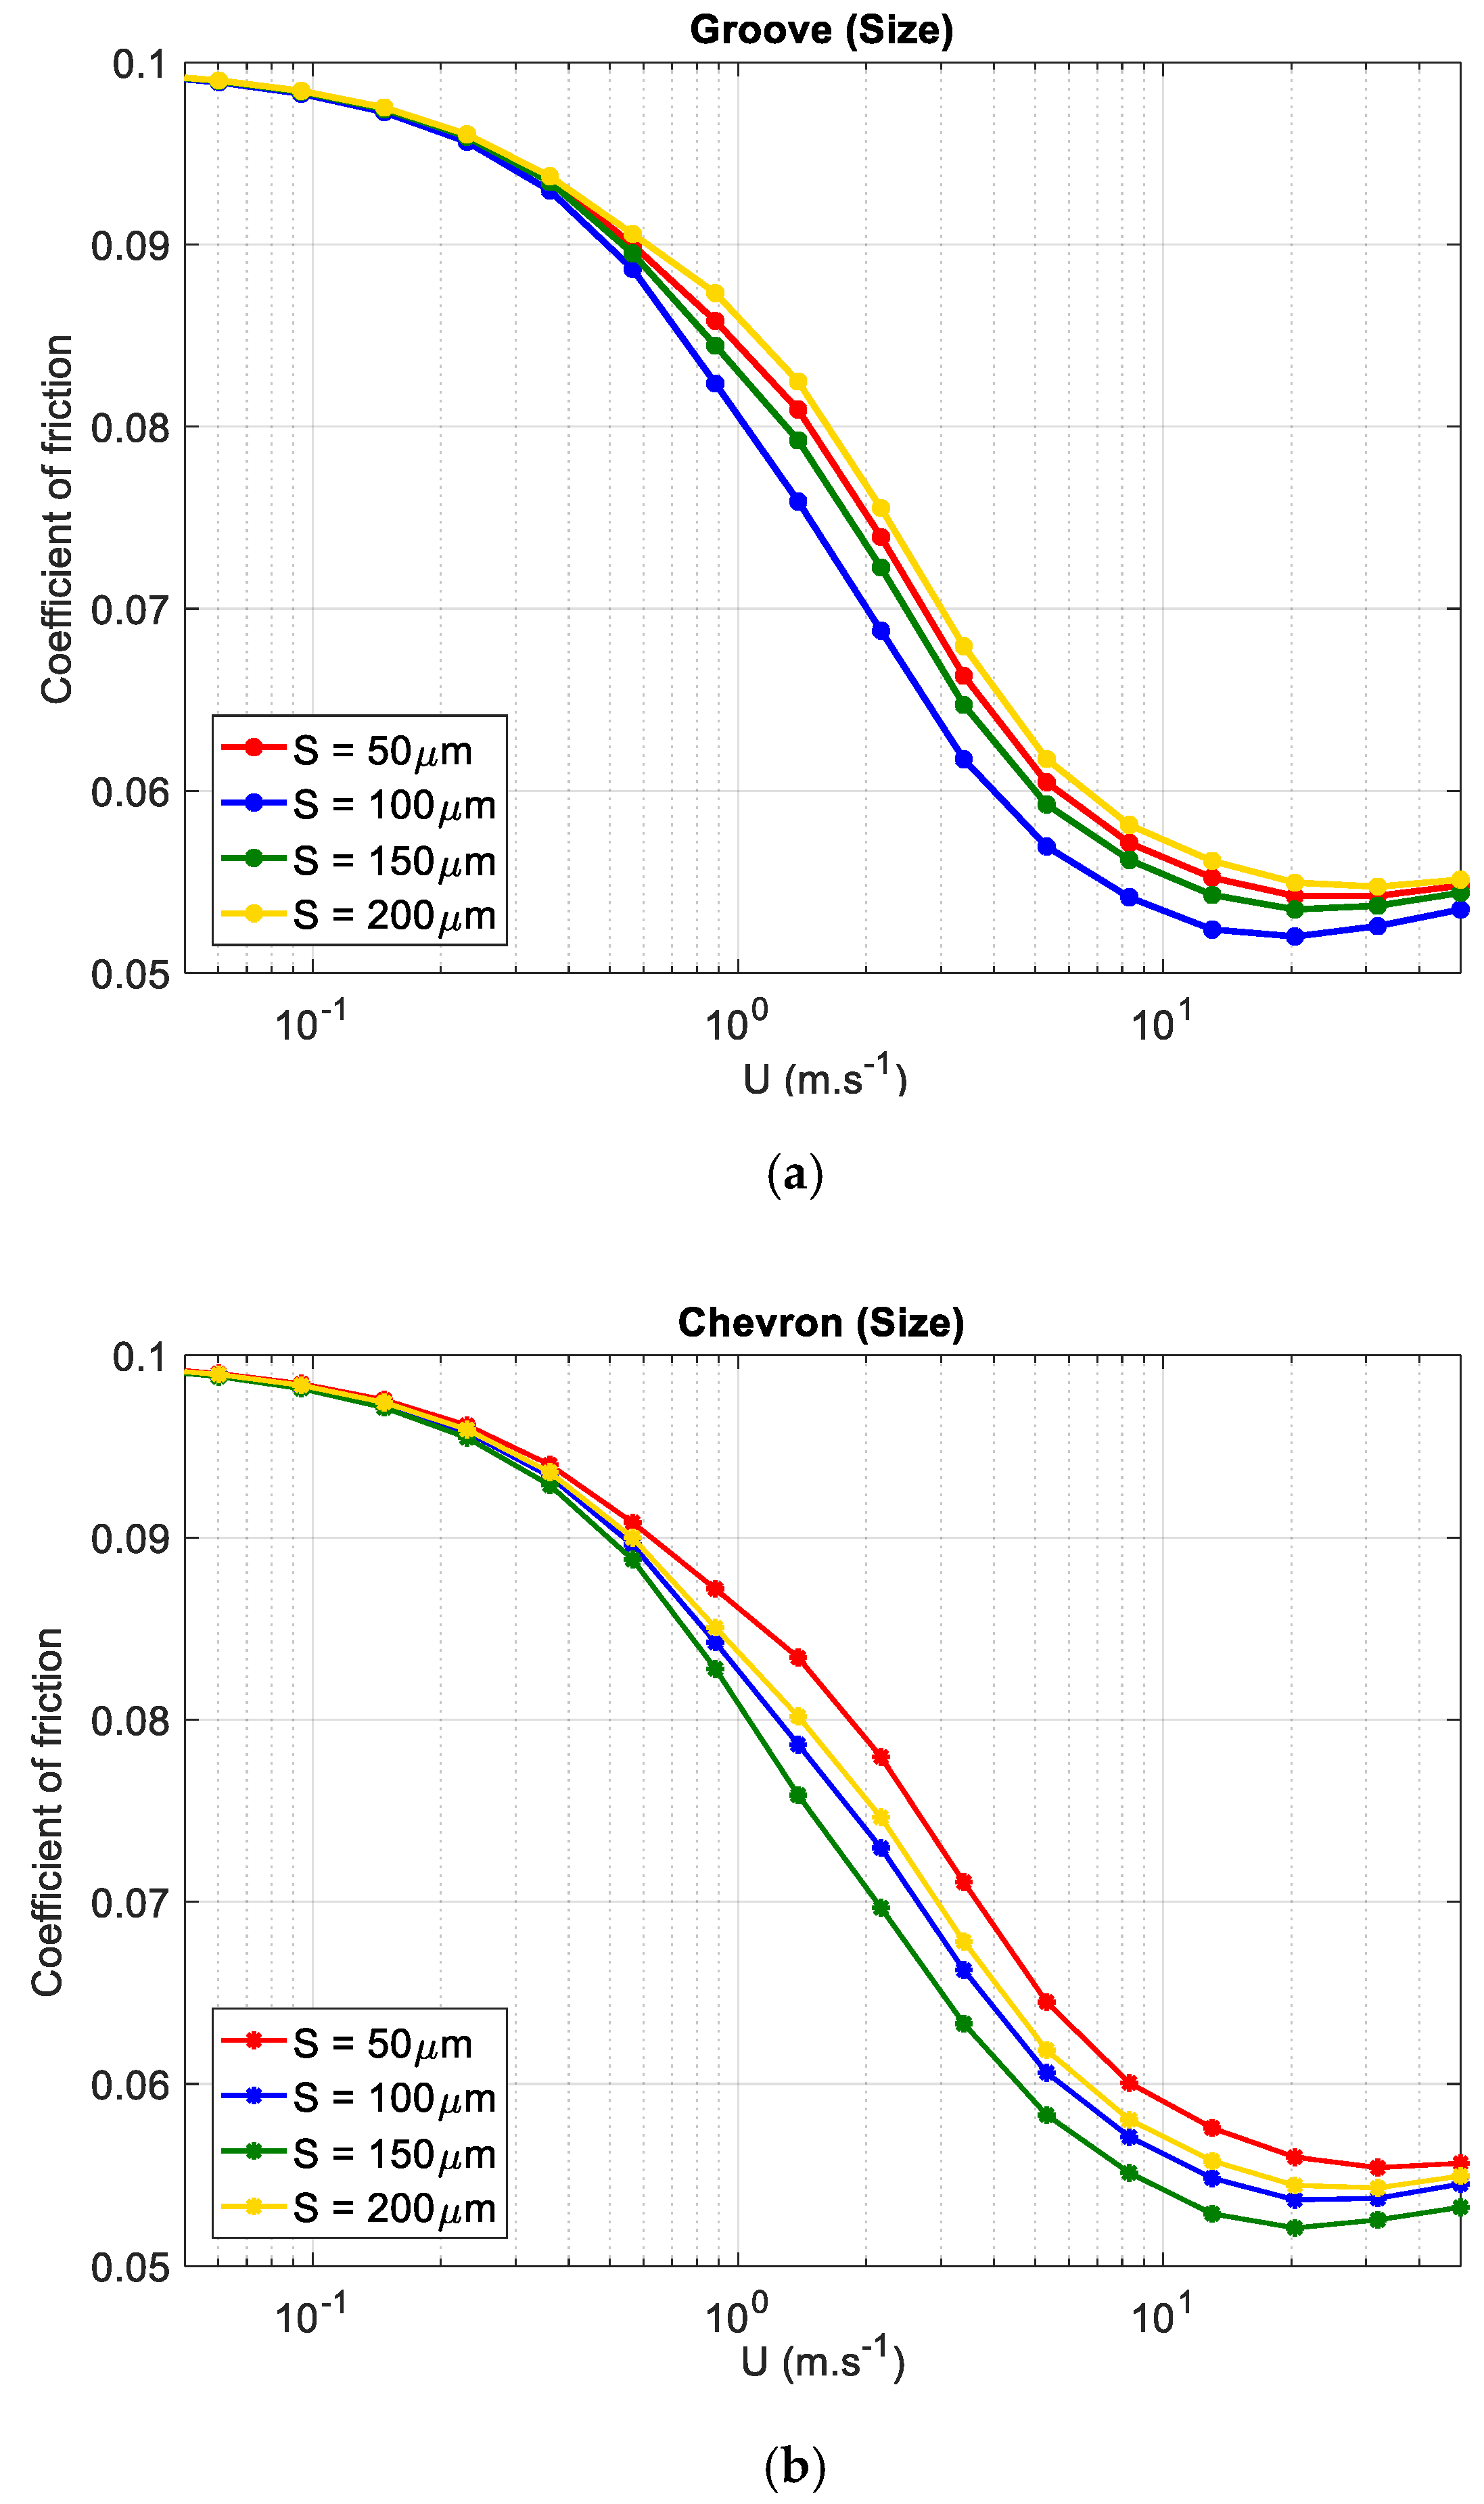
4.2.1. The Effect of Cavity Size (S)

The coefficient of friction in lubricated contacts in the ML and HL regimes are influenced by several parameters, as well as by lubricant viscosity and contact pressure. When these parameters have a fixed value, it is possible, by changing the geometrical parameters, to detect the influence of the size of the surface texturing on the frictional behaviour of the contact. In Figure 8, the effect of the cavity size ( S ) of the chevron and groove patterns on the coefficient of friction is shown. As found for the texturing depth, an optimum value for the cavity size ( S ) exists. For sizes tending to zero, or which are very large, there is no pressure generation, due to the absence of the wedge effect.
Changing the cavity size will affect the hydrodynamic lubrication component. In the case of grooves (see Figure 8a), by increasing the cavity size to 100   μ m , a reduction in the coefficient of friction happens due to the increase in film thickness. After passing the S = 100   μ m , the larger cavities cause a drop in film thickness, which causes an increase in the coefficient of friction. For higher velocities, the hydrodynamic lubrication is the dominant lubrication mechanism. The lowest coefficient of friction is achievable when the size is approximately 100   μ m . In the case of chevrons (see Figure 8b), from the previous study [46], the optimum value for the film thickness is achievable when the size of chevron cavity is around 150   μ m . Therefore, the lowest coefficient of friction can be obtained when cavities with S = 150   μ m are applied.

4.2.2. The Effect of Texture Pitch ( P i )

By adjusting the pitch parameter, the quantity of the chevron pockets and grooves over the surface area will undergo a change. When the pitch parameter value is equal to one, there is no textured area, as well as when the pitch is zero. Therefore, there should be a specific value for the pitch parameter for each pattern in which the texturing has a maximum effect on the frictional behaviour. By applying a pattern with a pitch value around that specific value, a reduction in the coefficient of friction will be expected. In Figure 9, the simulation results show the variation of coefficient of friction based on the texture pitch for groove and chevron patterns.
Due to the high texture area coverage when grooves are applied, a low coefficient of friction is achievable with a lower value for the pitch parameter than with chevrons.
In the case of grooves (see Figure 9a), increasing the texture pitch value up to 0.4 leads to a reduction of the coefficient of friction due to the existence of a thicker lubricant film. For pitch values, passing a pitch value of 0.4 , the coefficient of friction increases due to a decrease in film thickness [46]. These results show that the texture pitch has an influence on the hydrodynamic lubrication component of mixed lubrication. For high velocities, i.e., the hydrodynamic lubrication component is the dominant factor in the frictional behaviour, and the lowest coefficient of friction is achievable when the pitch is equal to 0.4 .
In the case of chevrons (see Figure 9b), the increase in texture pitch leads to the reduction in friction. The optimum value is reached for a pitch of 0.5, due to a thicker film thickness. As a result, the lowest coefficient of friction is obtained when the pitch value is around 0.5 .

5. Conclusions

The aim of this research was to study and predict the effect of surface texturing on the coefficient of friction for parallel sliding contacts. In order to obtain a better understanding of the friction phenomenon, a numerical model has been developed. Simulations of textured surfaces with different patterns and different texture properties are performed to determine the frictional behaviours of lubricated parallel sliding contacts. For the mixed lubrication model, the hydrodynamic film thickness is calculated based on a numerical model. The film thickness model is a numerical algorithm based on the Reynolds equation, along with the Elrod cavitation algorithm. The effect of several parameters on the frictional behaviour of lubricated parallel siding contacts, such as pattern type, depth, size and texture pitch, have been studied. The results can be summarised as:
  • Of the patterns studied, the groove pattern shows the lowest coefficient of friction. When the distances between texture cells are the same (the pitch is constant), the groove pattern is more successful in generating a load-carrying capacity, because of the higher textured area fraction per unit area. Chevrons are more beneficial than triangular pockets.
  • For both chevron and groove patterns, texturing parameters such as depth, pitch, and size values have an influence on the hydrodynamic lubrication component in the mixed lubrication regime.
  • An increase of the texture depth to a specific value of this parameter for different patterns leads to a reduction of coefficients of friction due to an increase in film thickness.
  • In the case of a groove pattern, the optimum cavity sizes is approximately 100 µm, and in the case of chevrons, the optimum cavity size is approximately   150   μ m .
  • The optimum depth for different patterns is in the range of 10   μ m .
  • The optimum value for the texture pitch is 0.4 for the groove pattern, and 0.5 for the chevron patterned surfaces.

Author Contributions

Conceptualization, D.J.S., E.L.D. and D.B.; Methodology, D.J.S. and D.B.; Software, D.B. and A.A.; Validation, D.B. and D.J.S.; Formal Analysis, D.B. and D.J.S.; Investigation, D.B. and D.J.S.; Writing-Original Draft Preparation, D.B.; Writing-Review & Editing, D.B., E.L.D., M.B.d.R. and D.J.S.; Supervision, D.J.S.

Funding

This research was funded by Materials Innovation Institute (M2i) grant number M21.1.11448.

Conflicts of Interest

The authors declare no conflict of interest.

Nomenclature

ηDynamic viscosityPa·s
ρ Density kg · m 3
φ Cavitation dimensionless variable
γ 1 Adaption parameter for hydrodynamic component in ML
γ 2 Adaption parameter for asperity contact
ν Poisson’s ratio
τ C Shear stress of asperity contact Pa
A C Real area of asperity contact m 2
d Separation m
E Elasticity modulus Pa
E Reduced elasticity modulus Pa
f Coefficient of friction
f C Coefficient of friction in BL regime
F Elrod switch function
F f Friction force N
F f H Hydrodynamic friction force N
F N Dimensionless total normal load
F T Normal load on the contact N
F C Load carried by the asperities N
F H Load carried by the hydrodynamic component N
h Film thickness m
h 0 Minimum film thickness m
H Dimensionless local depth of textured surface
L g x Texture cell length in the x-direction m
L x Textured area in the x-direction m
L y Textured area in the y-direction m
P i Texture pitch
p Pressure Pa
P Dimensionless pressure
P a Average contact pressure Pa
p a Ambient pressure Pa
p c Cavitation pressure Pa
p T Total pressure Pa
p C Asperity pressure Pa
p H Hydrodynamic pressure Pa
r p Cavity characteristic radius m
R i Reduced radius of cylinder m
S Cavity size = 2 r p m
T d Texture depth m
U 0 Sum velocity m · s 1
X Dimensionless Cartesian coordinate
Y Dimensionless Cartesian coordinate
w i compliance of an asperity m
z i Asperity height m

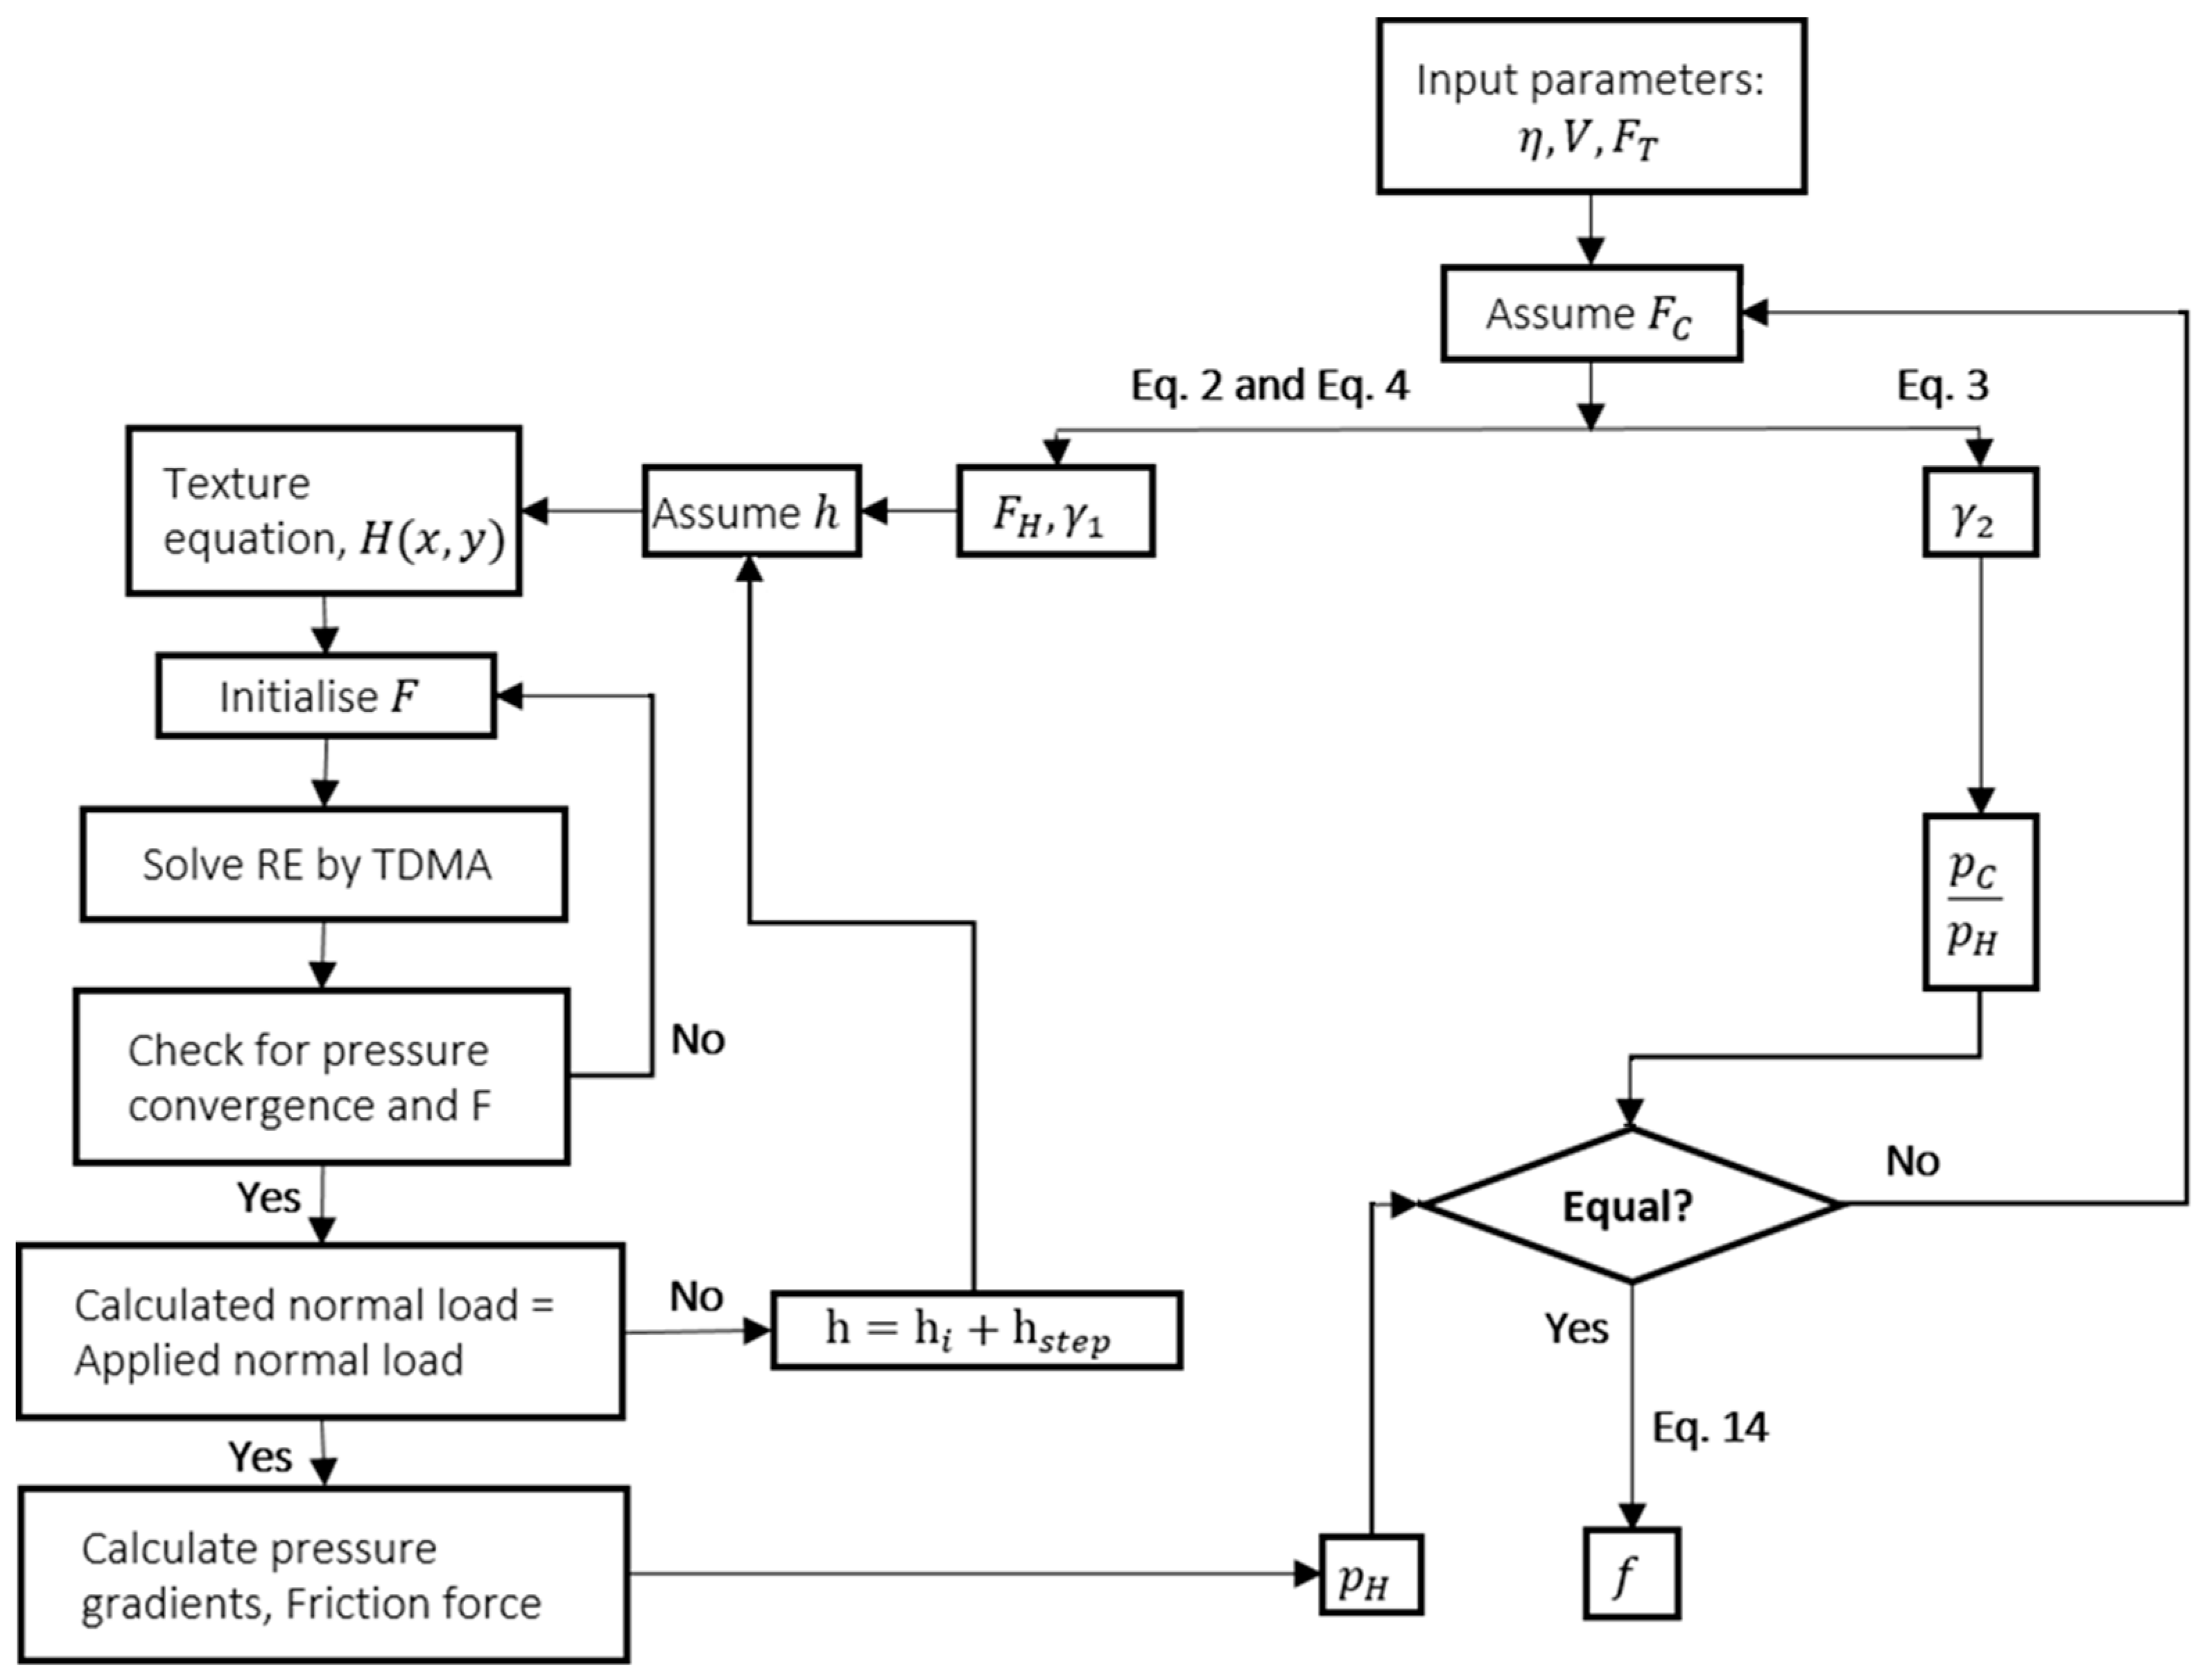
Appendix A. Mixed Lubrication Model Algorithm

As mentioned in Section 3, the coefficient of friction in the ML regime can be calculated as explained in the chart presented below, (see Figure A1).
Figure A1. Mixed lubrication model algorithm.
Lubricants 06 00091 g0a1

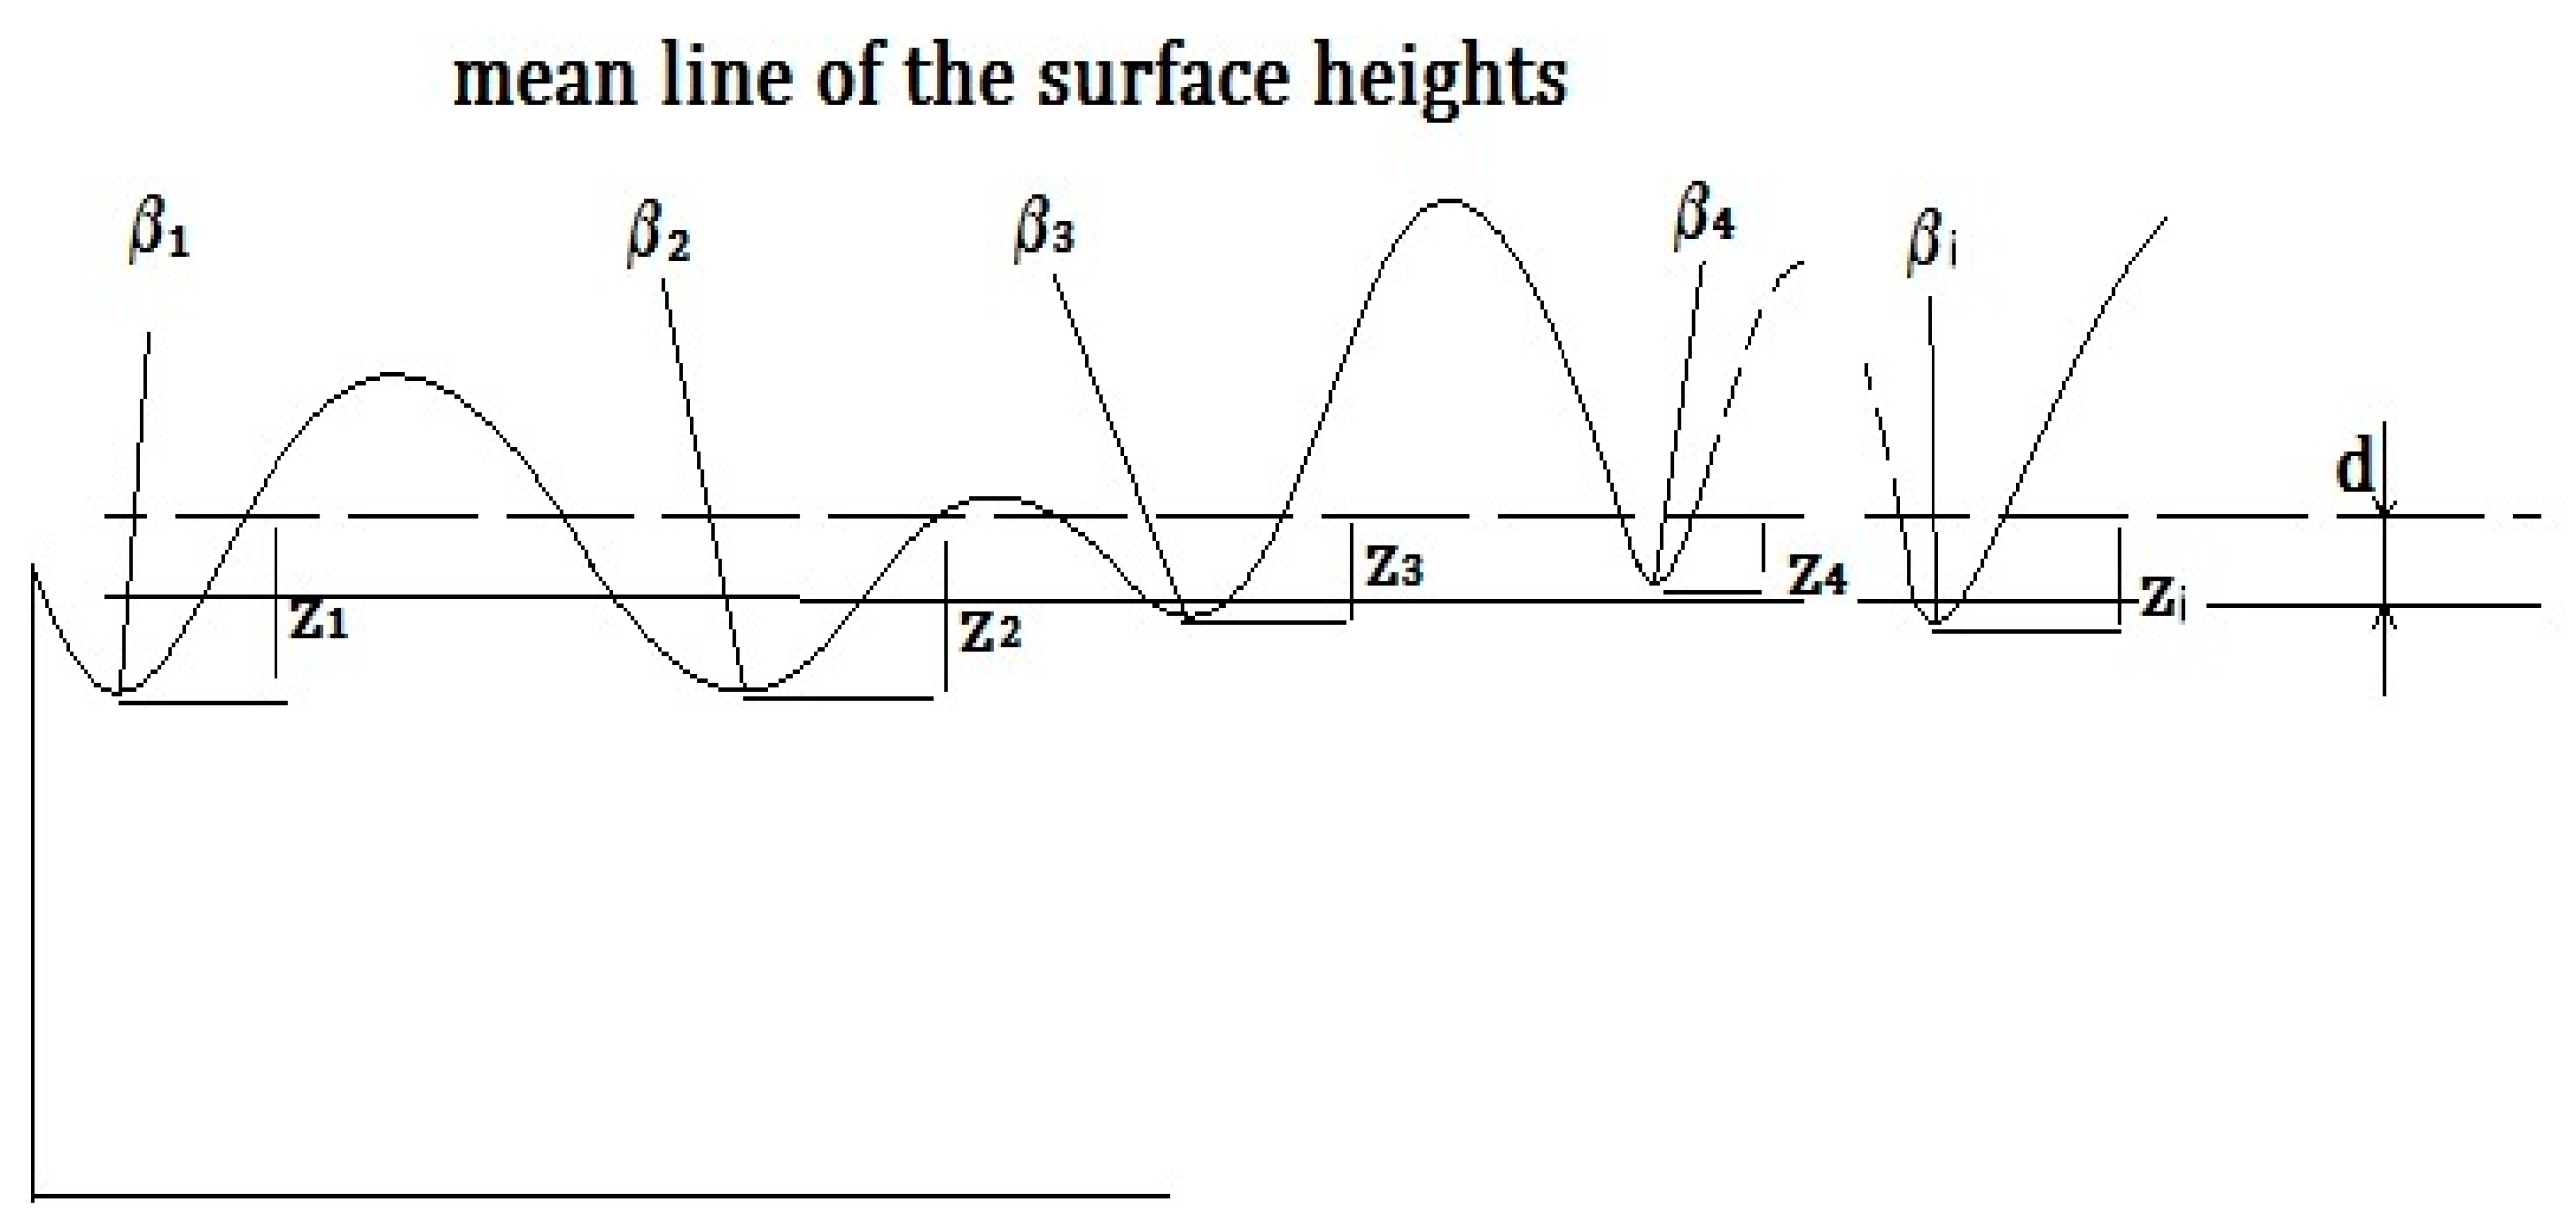
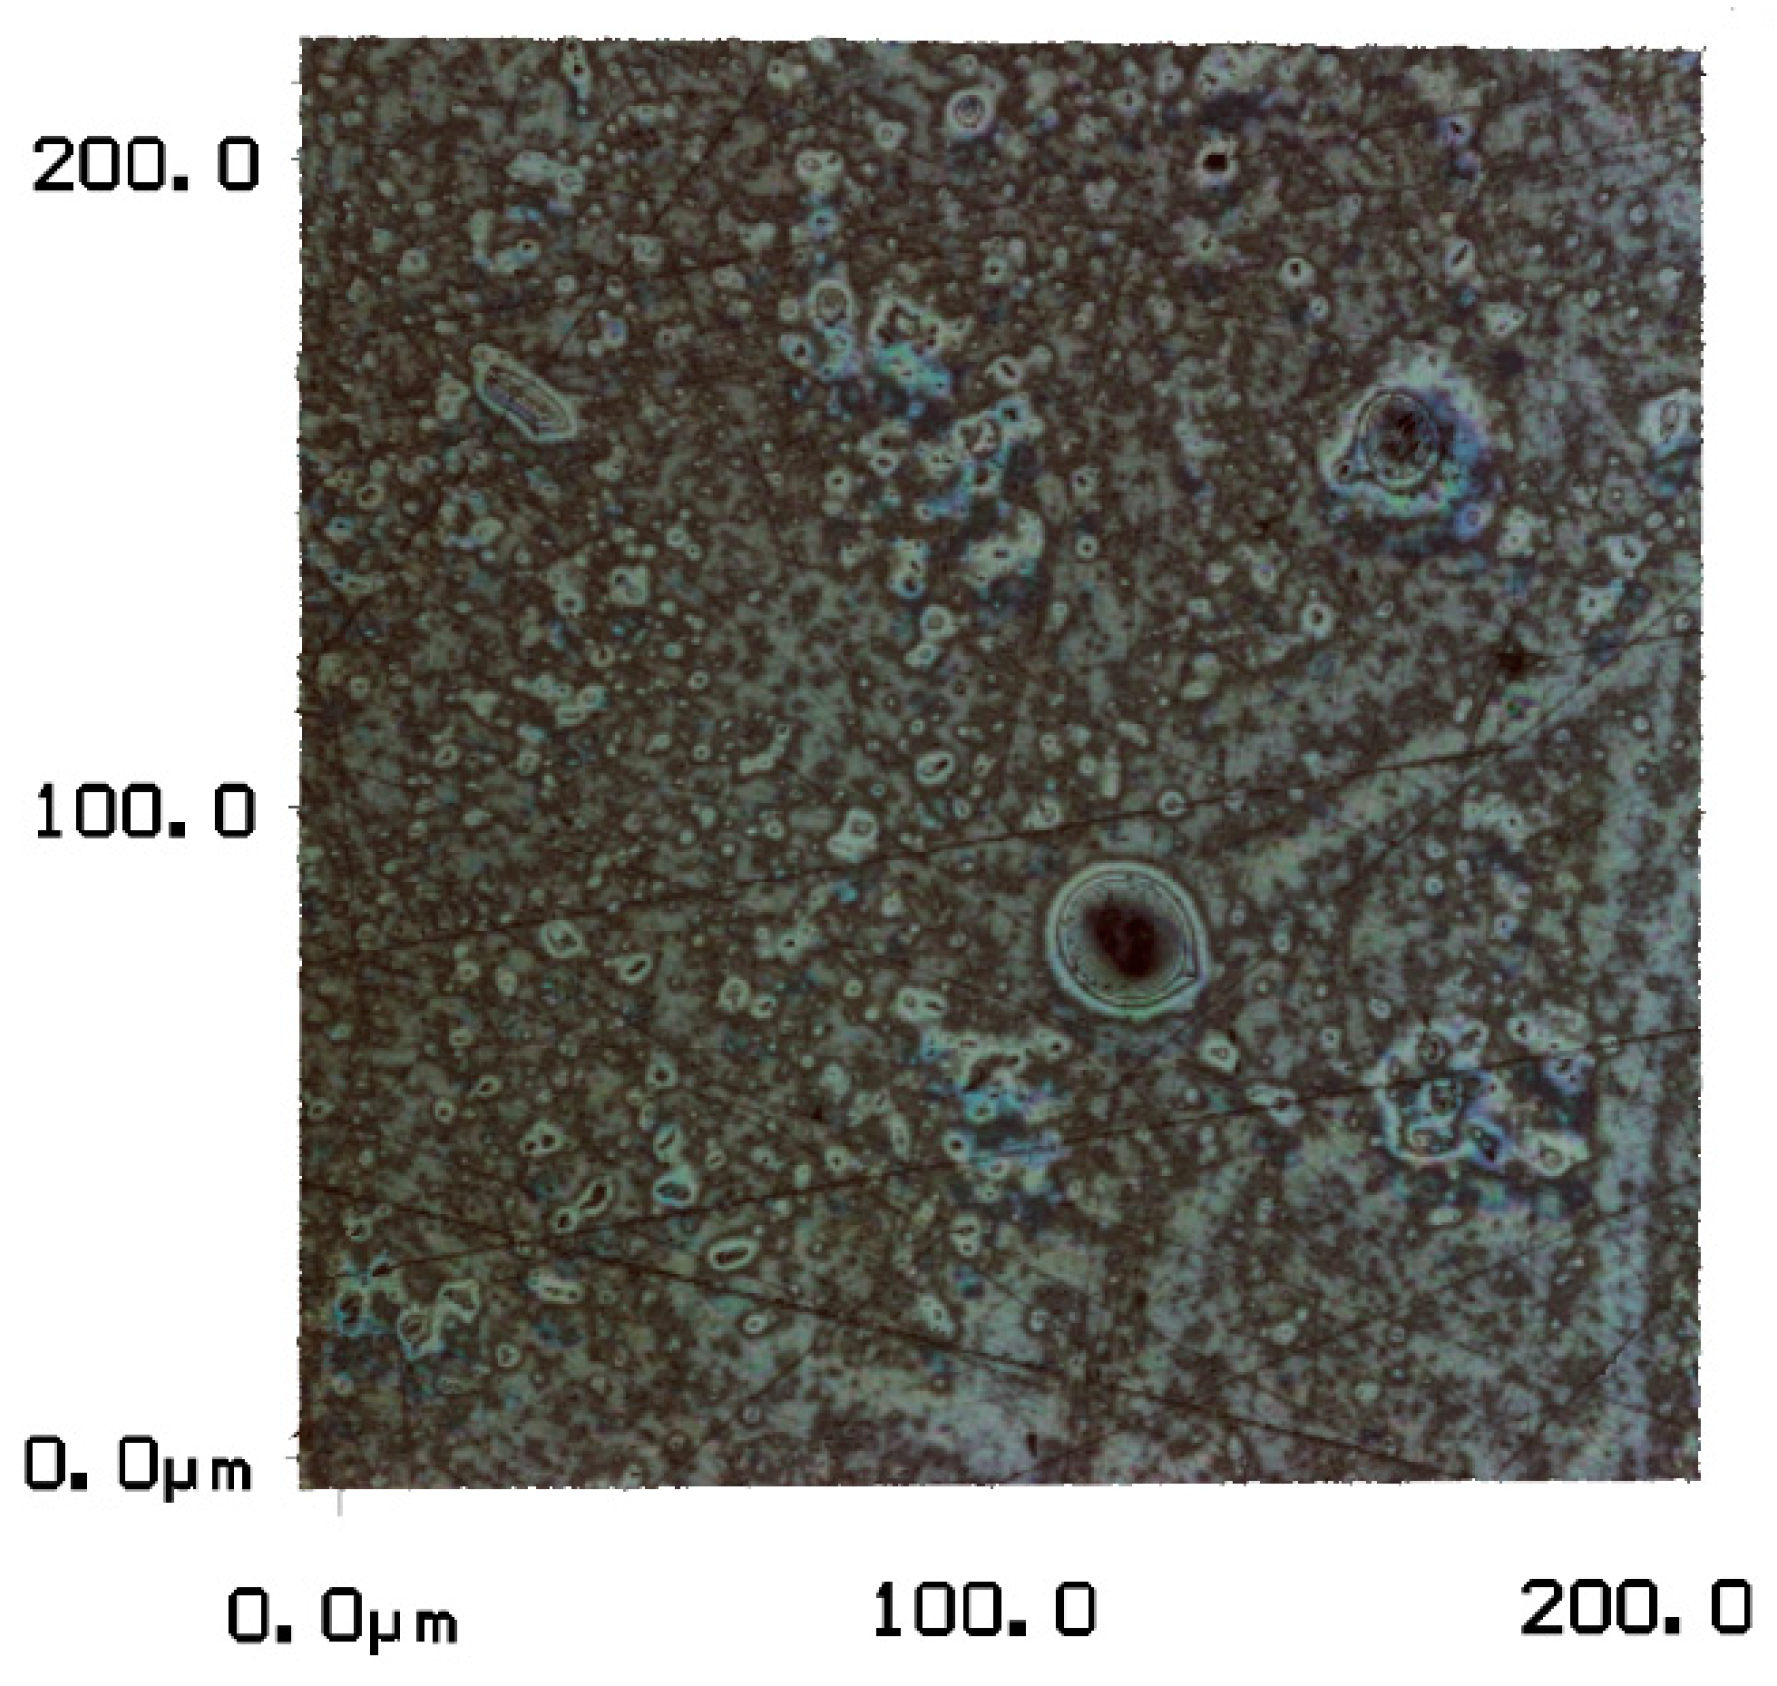
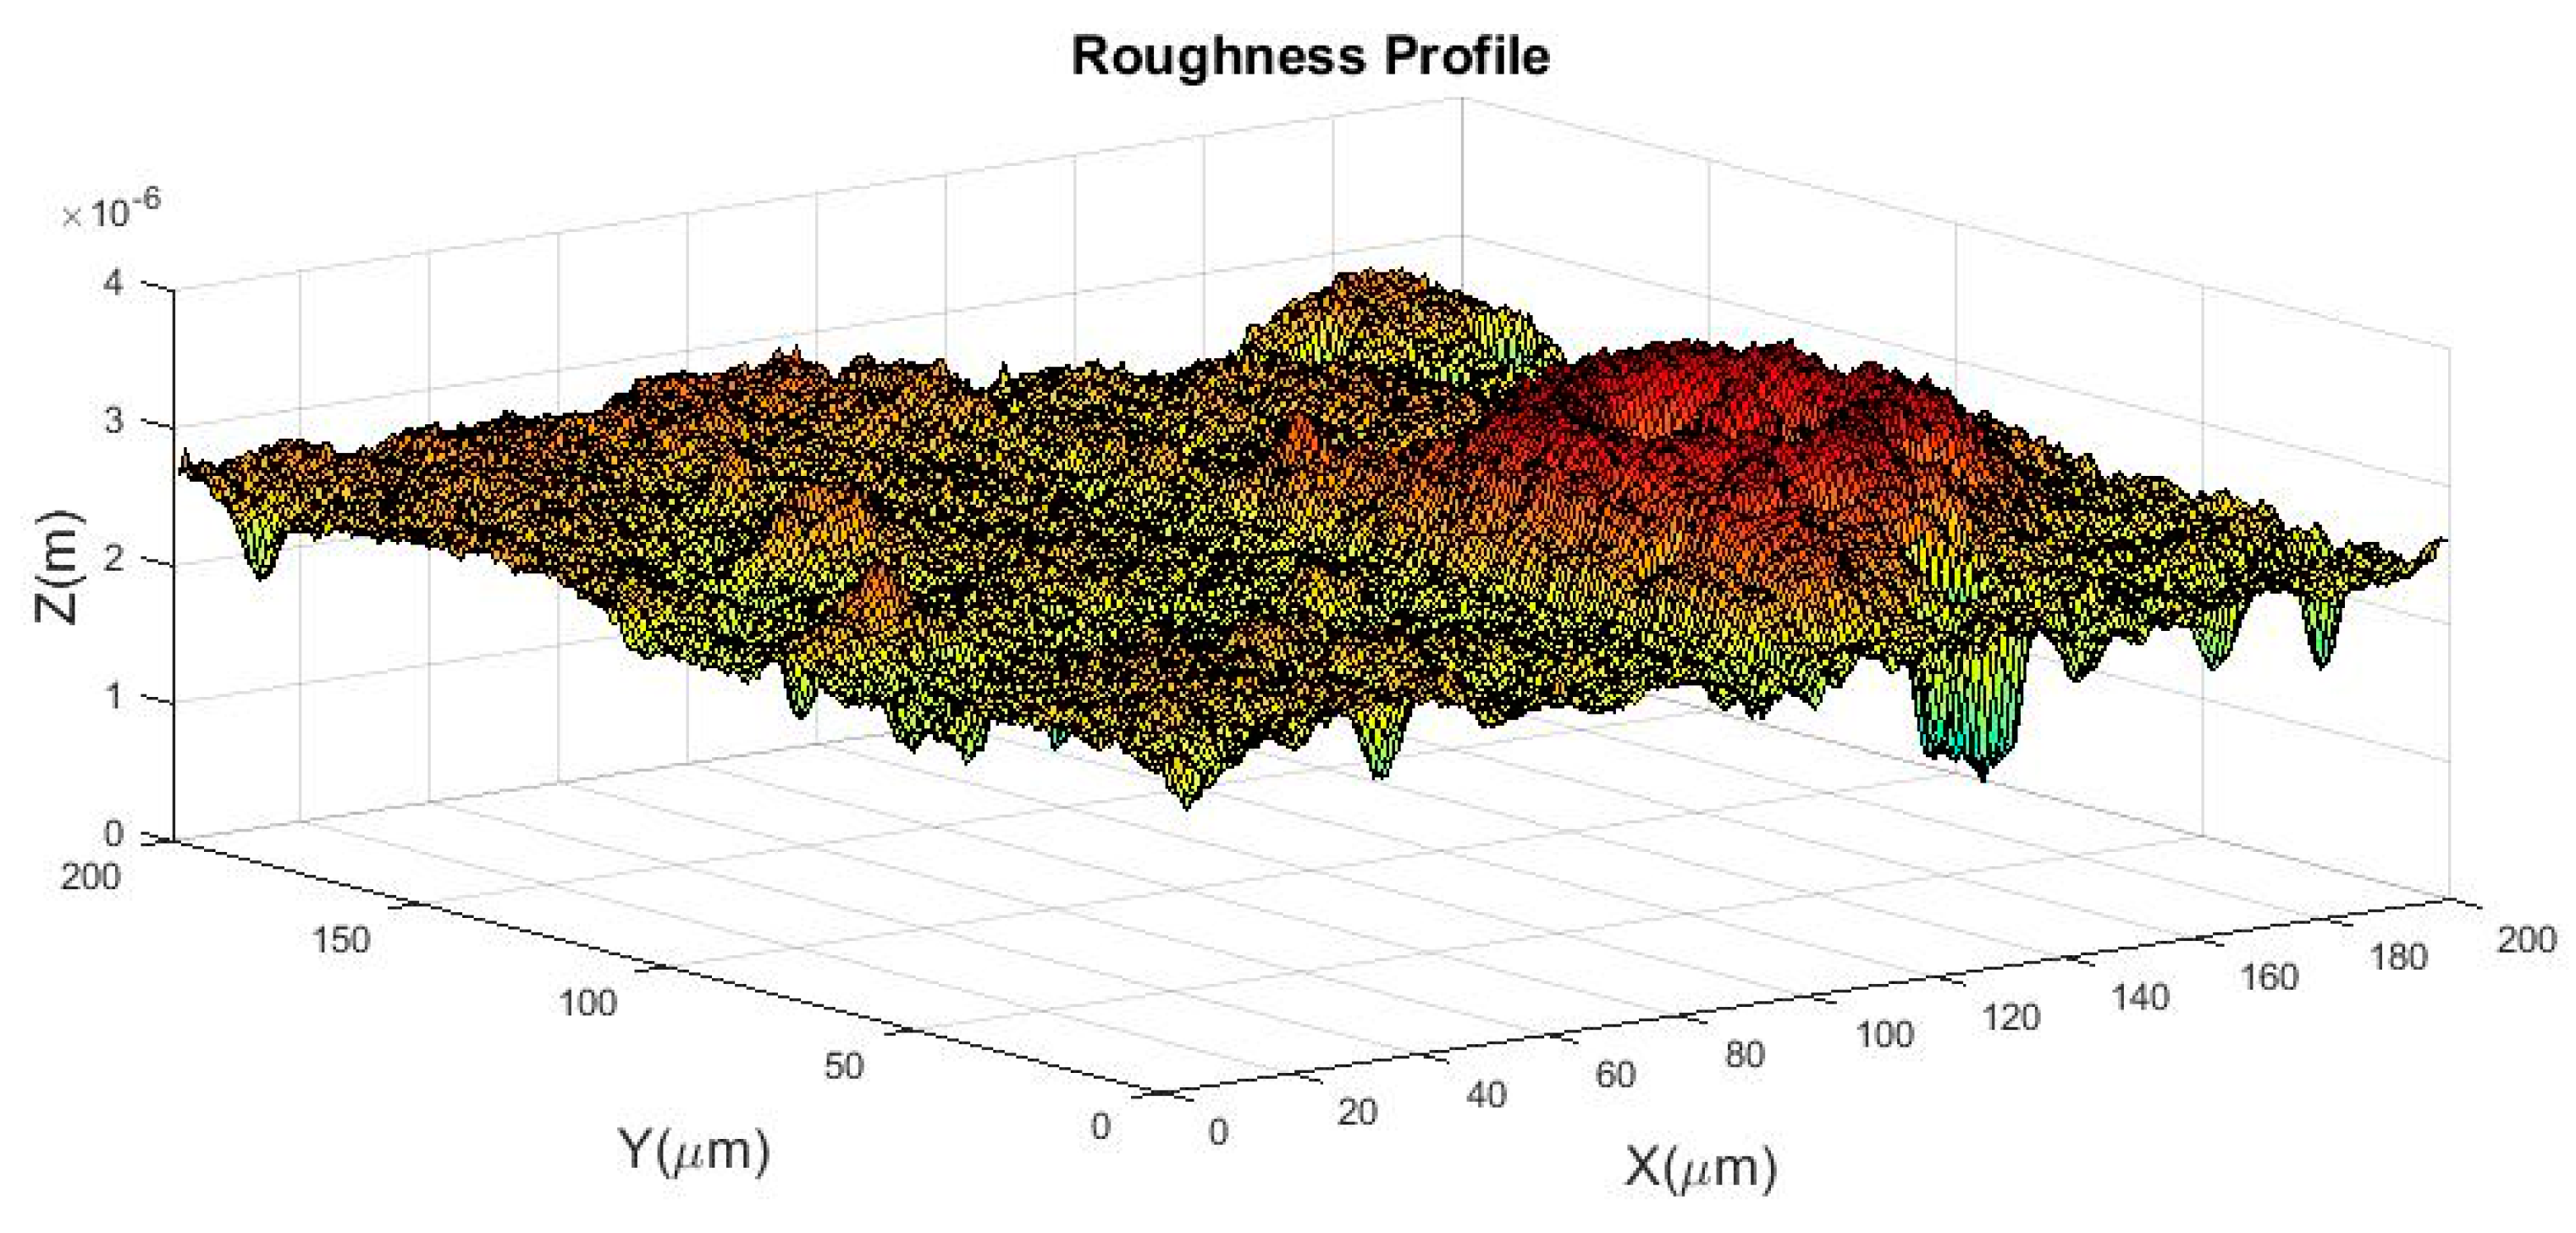
Appendix B. Determination of Roughness Parameters

In this study, calculations were performed using the roughness measured by images extracted from the laser microscope; these images are obtained from roughness height measurements. In this appendix, one of these images is shown as an example and the equations for calculating the roughness parameters are presented as well.

Roughness Measurement

In order to calculate the boundary lubrication component, the roughness measurement is essential. As mentioned in the article, in the case of the deterministic approach, the real measured height of asperities is needed to calculate the separation between the opposing surfaces. In order to achieve the height of the asperities, the surface topography for textured surfaces is measured by using microscopic images. These analyses have been performed using a Keyence Color 3D Scanning Microscope, which uses a violet laser λ = 388   nm . The result from a roughness measurement in case of a chevron textured sample is presented in Figure A2 (standard lens 50× is employed).
Figure A2. Laser scanning microscope image of surface.
Lubricants 06 00091 g0a2
By using the measured data for the surface roughness, the 3D illustration is calculated (see Figure A3).
Figure A3. Roughness measurement surface profile based on the measured roughness by Laser Scanning Microscope measurements, in this case R a =   0.11   μ m   .
Lubricants 06 00091 g0a3
To compare the measured roughness with the Gaussian roughness distribution, the probability density of asperities against the dimensionless asperity height is shown in Figure A4. In this figure the Gaussian probability density distribution of one surface is shown with the red line and blue bars present the real measured probability density distribution.
Figure A4. Distribution of surface heights and the radii of each asperity as a function of the dimensionless asperity height ( s / σ ).
Lubricants 06 00091 g0a4
The definition of a summit in this work is that it is higher than its eight neighbour points (see Figure A5).
Figure A5. Definition of a summit.
Lubricants 06 00091 g0a5
The radius of an asperity is calculated using the 3-point definition:
  β x 1 = z x Δ x , y 2 z x , y + z x + Δ x , y Δ x 2  
  β y 1 = z x Δ x , y 2 z x , y + z x + Δ x , y Δ y 2  
where β x and β y are the radii in, respectively, the x and the y directions, z x , y is the local surface height at location ( x ,   y ) and Δ x , Δ y are the step or pixel size. The combined summit radius β i of the radii in the two perpendicular directions β x and β y is obtained by:
  β i = β x i . β y i  
The value of β ¯ used in the calculations is the average summit radius:
  β ¯ = 1 n i = 1 n β i  
The calculated average radius of asperity from Figure A3 is equal to 4.8 × 10 8   m .

References

  1. Hirst, W. Scuffing and its prevention. Chart Mech. Eng. 1974, 21, 88–92. [Google Scholar]
  2. Wakuda, M.; Yamauchi, Y.; Kanzaki, S.; Yasuda, Y. Effect of surface texturing on friction reduction between ceramic and steel materials under lubricated sliding contact. Wear 2003, 254, 356–363. [Google Scholar] [CrossRef]
  3. Wang, W.-Z.; Huang, Z.; Shen, D.; Kong, L.; Li, S. The effect of triangle-shaped surface textures on the performance of the lubricated point-contacts. J. Tribol. 2013. [Google Scholar] [CrossRef]
  4. Baumgart, P.; Krajnovich, D.J.; Nguyen, T.A.; Tam, A.G. A new laser texturing technique for high performance magnetic disk drives. IEEE Trans. Magn. 1995, 31, 2946–2951. [Google Scholar] [CrossRef]
  5. Geiger, M.; Roth, S.; Becker, W. Influence of laser-produced microstructures on the tribological behaviour of ceramics. Surf. Coat. Technol. 1998, 100–101, 17–22. [Google Scholar] [CrossRef]
  6. Steinhoff, K.; Rasp, W.; Pawelski, O. Development of deterministic-stochastic surface structures to improve the tribological conditions of sheet forming processes. J. Mater. Process. Technol. 1996, 60, 355–361. [Google Scholar] [CrossRef]
  7. Etsion, I.; Burstein, L. A Model for Mechanical Seals with Regular Microsurface Structure. Tribol. Trans. 1996, 39, 677–683. [Google Scholar] [CrossRef]
  8. Etsion, I.; Kligerman, Y.; Halperin, G. Analytical and Experimental Investigation of Laser-Textured Mechanical Seal Faces. Tribol. Trans. 1999, 42, 511–516. [Google Scholar] [CrossRef]
  9. Kovalchenko, A.; Ajayi, O.; Erdemir, A.; Fenske, G.; Etsion, I. The effect of laser surface texturing on transitions in lubrication regimes during unidirectional sliding contact. Tribol. Int. 2005, 38, 219–225. [Google Scholar] [CrossRef]
  10. Dobrica, M.B.; Fillon, M.; Pascovici, M.D.; Cicone, T. Optimizing surface texture for hydrodynamic lubricated contacts using a mass-conserving numerical approach. Proc. Inst. Mech. Eng. 2010, 224, 737–750. [Google Scholar] [CrossRef]
  11. Zhu, D.; Hu, Y.-Z. A computer program package for the prediction of EHL and mixed lubrication characteristics, friction, subsurface stresses and flash temperatures based on measured 3-d surface roughness. Tribol. Trans. 2001, 44, 383–390. [Google Scholar] [CrossRef]
  12. Hu, Y.Z.; Zhu, D. A full numerical solution to the mixed lubrication in point contacts. J. Tribol. 2000, 122, 1–9. [Google Scholar] [CrossRef]
  13. Zhu, D.; Cheng, H.S.; Hamrock, B.J. Effect of surface roughness on pressure spike and film constriction in elastohydrodynamically lubricated line contacts. Tribol. Trans. 1990, 33, 267–273. [Google Scholar] [CrossRef]
  14. Hamilton, D.B.; Walowit, J.A.; Allen, C.M. A theory of lubrication by microirregularities. J. Basic Eng. 1966, 88, 177–185. [Google Scholar] [CrossRef]
  15. Ronen, A.; Etsion, I.; Kligerman, Y. Friction-reducing surface-texturing in reciprocating automotive components. Tribol. Trans. 2001, 44, 359–366. [Google Scholar] [CrossRef]
  16. Galda, L.; Pawlus, P.; Sep, J. Dimples shape and distribution effect on characteristics of Stribeck curve. Tribol. Int. 2009, 42, 1505–1512. [Google Scholar] [CrossRef]
  17. Qiu, Y.; Khonsari, M.M. Experimental investigation of tribological performance of laser textured stainless steel rings. Tribol. Int. 2011, 44, 635–644. [Google Scholar] [CrossRef]
  18. Kovalchenko, A.; Ajayi, O.; Erdemir, A.; Fenske, G.; Etsion, I. The effect of laser texturing of steel surfaces and speed-load parameters on the transition of lubrication regime from boundary to hydrodynamic. Tribol. Trans. 2004, 47, 299–307. [Google Scholar] [CrossRef]
  19. Raeymaekers, B.; Etsion, I.; Talke, F.E. Enhancing tribological performance of the magnetic tape/guide interface by laser surface texturing. Tribol. Lett. 2007, 27, 89–95. [Google Scholar] [CrossRef]
  20. Wang, X.; Kato, K.; Adachi, K.; Aizawa, K. Loads carrying capacity map for the surface texture design of SiC thrust bearing sliding in water. Tribol. Int. 2003, 36, 189–197. [Google Scholar] [CrossRef]
  21. Wang, X.; Kato, K.; Adachi, K.; Aizawa, K. The effect of laser texturing of SiC surface on the critical load for the transition of water lubrication mode from hydrodynamic to mixed. Tribol. Int. 2001, 34, 703–711. [Google Scholar] [CrossRef]
  22. Costa, H.L.; Hutchings, I.M. Hydrodynamic lubrication of textured steel surfaces under reciprocating sliding conditions. Tribol. Int. 2007, 40, 1227–1238. [Google Scholar] [CrossRef]
  23. Wang, Q.J.; Zhu, D. Virtual texturing: Modeling the performance of lubricated contacts of engineered surfaces. J. Tribol. 2005, 127, 722–728. [Google Scholar] [CrossRef]
  24. Ren, N.; Nanbu, T.; Yasuda, Y.; Zhu, D.; Wang, Q. Micro textures in concentrated-conformal-contact lubrication: Effect of distribution patterns. Tribol. Lett. 2007, 28, 275–285. [Google Scholar] [CrossRef]
  25. Rahmani, R.; Shirvani, A.; Shirvani, H. Optimization of partially textured parallel thrust bearings with square-shaped micro-dimples. Tribol. Trans. 2007, 50, 401–406. [Google Scholar] [CrossRef] [Green Version]
  26. Pascovici, M.D.; Cicone, T.; Fillon, M.; Dobrica, M.B. Analytical investigation of a partially textured parallel slider. Proc. Inst. Mech. Eng. 2009, 223, 151–158. [Google Scholar] [CrossRef]
  27. Wang, X.; Adachi, K.; Otsuka, K.; Kato, K. Optimization of the surface texture for silicon carbide sliding in water. Appl. Surf. Sci. 2006, 253, 1282–1286. [Google Scholar] [CrossRef]
  28. Wang, X.; Kato, K. Improving the anti-seizure ability of SiC seal in water with RIE texturing. Tribol. Lett. 2003, 14, 275–280. [Google Scholar] [CrossRef]
  29. Nakano, M.; Korenaga, A.; Korenaga, A.; Miyake, K.; Murakami, T.; Ando, Y.; Usami, H.; Sasaki, S. Applying micro-texture to cast iron surfaces to reduce the friction coefficient under lubricated conditions. Tribol. Lett. 2007, 28, 131–137. [Google Scholar] [CrossRef]
  30. Raeymaekers, B.; Etsion, I.; Talke, F.E. A model for magnetic tape/guide friction reduction by laser surface texturing. Tribol. Lett. 2007, 28, 9–17. [Google Scholar] [CrossRef]
  31. Kligerman, Y.; Etsion, I. Analysis of the hydrodynamic effects in a surface textured circumferential gas seal. Tribol. Trans. 2001, 44, 472–478. [Google Scholar] [CrossRef]
  32. Stribeck, R. Die Wesentlichen Eigenschaften der Gleit- Und Rollenlager (The Basic Properties of Sliding and Rolling Bearings). Z. Ver. Deutsch. Ing. 1902, 46, 1341–1348. [Google Scholar]
  33. Hersey, M.D. The laws of lubrication of horizontal journal bearings. J. Wash. Acad. Sci. 1914, 4, 542–552. [Google Scholar]
  34. Lenning, R.L. The transition from boundary to mixed friction. Lubr. Eng. 1960, 16, 575. [Google Scholar]
  35. Schipper, D.J. Transitions in the Lubrication of Concentrated Contacts. Ph.D. Theses, University of Twente, Enschede, Sweden, 1988. [Google Scholar]
  36. Patir, N.; Cheng, H.S. Application of Average Flow Model to Lubrication Between Rough Sliding Surfaces. J. Lubr. Technol. 1978. [Google Scholar] [CrossRef]
  37. Patir, N.; Cheng, H.S. An Average Flow Model for Determining Effects of Three-Dimensional Roughness on Partial Hydrodynamic Lubrication. J. Lubr. Technol. 1978, 100, 12–17. [Google Scholar] [CrossRef]
  38. Johnson, K.L.; Greenwood, J.A.; Poon, S.Y. A simple theory of asperity contact in elastohydro-dynamic lubrication. Wear 1972, 19, 91–108. [Google Scholar] [CrossRef]
  39. Gelinck, E.R.M.; Schipper, D.J. Calculation of Stribeck curves for line contacts. Tribol. Int. 2000, 33, 175–181. [Google Scholar] [CrossRef]
  40. Greenwood, J.A.; Williamson, J.B.P. Contact of Nominally Flat Surfaces. Proc. R. Soc. Lond. Ser. A Math. Phys. Sci. 1966, 295, 300–319. [Google Scholar] [CrossRef]
  41. Shi, F.; Salant, R.F. A mixed soft elastohydrodynamic lubrication model with interasperity cavitation and surface shear deformation. J. Tribol. 2000, 122, 308–316. [Google Scholar] [CrossRef]
  42. Jakobsson, B.; Floberg, L. The Finite Journal Bearing, Considering Vaporization: (Das Gleitlager von Endlicher Breite mit Verdampfung); Gumpert: Göteborg, Sweden, 1957. [Google Scholar]
  43. Olsson, K.O. Cavitation in Dynamically Loaded Bearings; Chalmers University of Technology: Göteborg, Sweden, 1965. [Google Scholar]
  44. Coyne, J.C.; Elrod, J.H.G. Conditions for the rupture of a lubricating film. Part I Theor. Model. J. Lubr. Technol. 1970, 92, 451–456. [Google Scholar]
  45. Faraon, I.C. Mixed Lubricated Line Contacts, Ph.D. Thesis, University of Twente, Enschede, The Netherlands, 2005. [Google Scholar]
  46. Bijani, D.; Deladi, L.E.; Schipper, D.J. The Influence of Surface Texturing on the Film Thickness in Parallel Sliding Surfaces. In Proceedings of the 20th International Colloquium Tribology, Stuttgart/Ostfildern, Germany, 12–14 January 2016. [Google Scholar]
  47. Xiong, S.; Wang, Q.J. Steady-state hydrodynamic lubrication modeled with the payvar-salant mass conservation model. J. Tribol. 2012. [Google Scholar] [CrossRef]
  48. Qiu, M.; Minson, B.R.; Raeymaekers, B. The effect of texture shape on the friction coefficient and stiffness of gas-lubricated parallel slider bearings. Tribol. Int. 2013, 67, 278–288. [Google Scholar] [CrossRef]
  49. Qiu, M.; Delic, A.; Raeymaekers, B. The effect of texture shape on the load-carrying capacity of gas-lubricated parallel slider bearings. Tribol. Lett. 2012, 48, 315–327. [Google Scholar] [CrossRef]
  50. Patankar, S.V. Numerical Heat Transfer and Fluid Flow, Series in Computational Methods in Mechanics and Thermal Sciences; Patankar, S.V., Ed.; Hemisphere Pub. Corp.: Washington, DC, USA, 1980. [Google Scholar]
  51. Versteeg, H.K.; Malalasekera, W. An Introduction to Computational Fluid Dynamics—The Finite Volume Method; Longman Group Ltd.: Harlow, UK, 1995. [Google Scholar]
Figure 1. Schematic representation of two surfaces in contact.
Lubricants 06 00091 g001
Figure 2. The contact between a rough surface and a flat surface.
Lubricants 06 00091 g002
Figure 3. Geometrical scheme of patterns, (a) chevron, (b) groove, (c) triangular pocket (reproduced with the permission of Mingfeng Qiu, Bret R. Minson, Bart Raeymaekers, Tribology International, published by Elsevier, 2013) [48].
Lubricants 06 00091 g003
Figure 4. Schematic illustration of different patterns: (a) Grooves, (b) chevrons, (c) triangular pockets and (d) schematic illustration of cavity profile.
Lubricants 06 00091 g004
Figure 5. Comparison between different patterns, texturing properties are given in Table 1.
Lubricants 06 00091 g005
Figure 6. Definition of cavity width ratio; K is the ratio of the inner wall length over the outer wall length.
Lubricants 06 00091 g006
Figure 7. Coefficient of friction as a function of speed for patterns with different texture depth for: (a) grooves, (b) chevrons.
Lubricants 06 00091 g007
Figure 8. Coefficient of friction as a function of speed for patterns with different cavity sizes (S) for: (a) grooves, (b) chevrons.
Lubricants 06 00091 g008
Figure 9. Coefficient of friction as a function of speed for patterns with different texture pitch for: (a) grooves, (b) chevrons.
Lubricants 06 00091 g009
Table 1. Operational conditions.
ParameterValue
Texture   depth ,   T d 10   μ m
Texture   pitch ,   P i   0.4
Cavity   size ,   S = 2 r p 50   μ m
Normal load   5   N
Average contact pressure   0.05   MPa
Dynamic viscosity   8   mPa · s
Elasticity   modulus ,   E 210 GPa
Poisson s   ratio ,   ν 0.3

